studying scratching/buffing mechanism of the clearcoats
TRANSCRIPT

Eastern Michigan UniversityDigitalCommons@EMU
Master's Theses and Doctoral Dissertations Master's Theses, and Doctoral Dissertations, andGraduate Capstone Projects
2008
Studying scratching/buffing mechanism of theclearcoats and improving the technique anddevices/materials in automobile refinish workChakravarthi Mallikarjun Nagolu
Follow this and additional works at: http://commons.emich.edu/theses
Part of the Physics Commons
This Open Access Thesis is brought to you for free and open access by the Master's Theses, and Doctoral Dissertations, and Graduate Capstone Projectsat DigitalCommons@EMU. It has been accepted for inclusion in Master's Theses and Doctoral Dissertations by an authorized administrator ofDigitalCommons@EMU. For more information, please contact [email protected].
Recommended CitationNagolu, Chakravarthi Mallikarjun, "Studying scratching/buffing mechanism of the clearcoats and improving the technique anddevices/materials in automobile refinish work" (2008). Master's Theses and Doctoral Dissertations. 154.http://commons.emich.edu/theses/154

STUDYING SCRATCHING/BUFFING MECHANISM OF THE CLEARCOATS AND
IMPROVING THE TECHNIQUE AND DEVICES/MATERIALS IN AUTOMOBILE
REFINISH WORK.
by
Chakravarthi Mallikarjun Nagolu
Thesis
Submitted to the Department of Physics and Astronomy
Eastern Michigan University
in partial fulfillment of the requirements
for the degree of
MASTER OF SCIENCE
in
Physics
Thesis Committee:
Weidian C. Shen, PhD, Chair
Natthi Lal Sharma, PhD
Diane Jacobs, PhD
November 15, 2008
Ypsilanti, Michigan

DEDICATION
To my father, who would have been very proud,
to all my family members,
to Dr. Alexandria Oakes, Head of the Department, Physics and Astronomy.

ACKNOWLEDGEMENTS
I would like to express profound thanks to my research advisor, Dr. Weidian Shen, for his
guidance and encouragement throughout the research work. My knowledge and enthusiasm
about surface studies and tribology has increased significantly after working in his surface
science and Nanotribology laboratory. He allotted me a thesis topic which was one of the
ongoing projects in the lab sponsored by the 3M Company. Many of the concepts discussed in
the thesis represent his thoughts and suggestions throughout the progress of the research. He was
always available for any help I needed and supported me with funds in the spring and summer of
2008. His expertise, knowledge, and thinking abilities make him one of the most valuable and
excellent professors I have worked with.
I am very thankful to Dr. Alexandria Oakes, head of the department, the most wonderful
person I have ever met in my life. I am also thankful to Mary Jane, secretary, Physics and
Astronomy Department, for all of her help. Thanks to Dr. Thomsen, graduate advisor, for his
valuable time and patience in listening to me throughout my days at EMU. Special thanks to the
committee members, Dr. Diane Jacobs & Dr. Natthi Lal Sharma, for their acceptance to be on
my thesis committee and for their critical reading and comments on the thesis drafts. Thanks to
Rene Crombez for spending his precious time helping me. I have learned many things, and
without you, this would not have been possible. Thank you very much for a great experience.
Loving thanks to my friends Hareesh, Rajesh, Sudheer, Sumanth, Syed, Vamshi B,
Vamsi G, and Vijay, who played an important role. Being far away from home, this would have
been impossible without all the support and encouragement you have given me.
Thanks to the entire EMU Physics and Astronomy department.

ABSTRACT
As automotive coating technology advances, the manufacturers have developed new
generations of after-market coatings as well as OEM (Original Equipment Manufacturing)
coatings. The new coatings possess much stronger mar/scratch resistance either with raised
elastic modulus and hardness or with the ability of self-healing. These pose new challenges to the
auto-body refinish work. In the refinishing process, the after-market coatings are applied to the
bodies (surfaces), and then the imperfections, which are inevitable during the application process
due to the environmental dust in the shops, will be buffed out to make a smooth and shining
surface. The new coatings are very difficult to work with in the refinish process.
Sponsored by 3M Incorporation, the largest producer of the refinish devices and materials,
we have carried out a systematic study of the scratching/buffing mechanism of the clearcoats in
the refinish work. We measured modulus and hardness at depths of nano/micron meters at the
coating surface, checked the heating effect on the mars and scratches at the coating surface, and
examined the surface morphologies in nano and micro scales of different coatings at different
stages in the refinish process. We also studied the variations of the mechanical and tribological
properties of the coatings during the curing process after the baking, etc., using newly developed
nano instruments, a Nano-Indenter XP and a Scanning Probe Microscope (SPM). This study has
increased our knowledge of the scratching and buffing mechanism of coatings and the refinish
process, thus shedding light on the direction for improvement of the technique and
devices/materials in the refinish work.

TABLE OF CONTENTS
Dedication …………………………………………………………..……………………….…...ii
Acknowledgements………………………………………………….…………………..……….iii
Abstract …………………………………………………………………………….……….........v
Table of contents…………………………………………………………………………………vi
List of Figures…………………………………………………………………………………....vii
1 Introduction…………………………………………………………………………...…….......1
2 Instruments…………………………………………………………………………...…………5
2.1 Nano Indenter XP………………………………………………………….………….5
2.2 Scanning Probe Microscope………………………………………………….……….9
3 Experiment and Data Analysis………...……………………………………………………….13
3.1 Recovery Mechanism………………………………………………………….……..13
3.2 Buffing Study………………………………………………………………….……..22
3.3 Curing Study…………………………………………………………………………28
4 Conclusions…………………………………………………………………………………….37
References………………………………………………………………………………………..39

LIST OF FIGURES
Figure Page
1. Nano indenter XP and CSM equipment in the Surface Science and Nanotribology Laboratory. It is operated using the attached computer................................................................................6
2. Schematic diagram of the indenter head and its components7............................................7
3. Typical shape of a (1) Berkovich indentation tip and (2) Conical-shaped scratch tip7......8
4. Physical interpretation of Scanning Probe Microscopy (SPM) components and principal involved in the SPM technique13............................................................................................10
5. Raster movement. The tip moves on the surface following a precise movement called raster, as shown13..................................................................................................................10
6. Diagram used to show the characterization of Micro-Mar Resistance by a scratch17…...12
7. (1) and (2) are the smooth surface morphologies of samples 1 and 2, respectively, with height (z) scale of 50 nm and (3) and (4) are the areas of imperfections on the clearcoat Samples 1 and 2, respectively, with a z-scale of 3µm; all the images are 100×100 µm in the x-y plane.…..14
8. Optical images of Sample 1 that clearly shows the recovery due to heat treatment….…15
9. Indentation test curve to a depth of 10µm and nine indent locations 1µm apart, the graph shows all nine indentation curves illustrating repeatability of our measurements.……………..16
10. Plots of hardness and modulus Vs load on sample of both the Samples 1 and 2…….…..17
11. The progressive load scratches on one of the samples showing the scratch depth (bottom curve) and the residual depth of the scratch (top curve) describing the marring, cracking, and chipping regions. ………………………………………………………………………….18
12. The images of progressive load scratches of sample 1 (advanced coating) using an SPM (a) image of the actual scratch (control sample) (b) recovered scratch due to dry heat (c) wet heated scratch. ………………………………………………………………………….……..…19

13. The images of progressive load scratches of Sample 2 (traditional coating) using an SPM (a) image of the actual scratch (control sample) (b) recovered scratch due to dry heat (c) wet heated scratch.…………………………………………………………………………………....20
14. Constant load scratches of Sample 1 at 15, 55, 87 and 125 mN; respectively…………..21
15. Constant load scratches of Sample 2 at 15, 55, 87 and 125 mN; respectively…………..21
16. The average modulus graph in all the buffing steps from 1 to 5 & unbuffed samples.…..23
17. The average hardness graph in all the buffing steps from 1 to 5 & unbuffed samples.…..24
18. SPM images of sample 2 used in estimating the roughness measurement, the dimensions of step 1 and step 2 images are 100 µm × 100 µm and a z scale of 2 µm and all the remaining steps 3, 4, 5 and 0 are at 25 µm × 25 µm but the z scale of 3 and 4 images is 100 nm and the for the steps 5 and 0 is 25 nm…………………………………………………………………………….26
19. The average roughness graph in all the six steps of each sample measured with Scanning Probe Microscope………………………………………………………………………………...26
20. Average modulus graph for the thick sample; this clearly shows the change in modulus over time……………………………………………………………………………………………….30
21. Average hardness graph for the thick sample; also shows the change in hardness over time…...30
22. Average modulus of the same sample but different thickness; the graph clearly shows the increase in modulus with time……………………………………………………………………………..31
23. Average hardness of the same sample with different thickness; the graph clearly shows the increase of hardness over time……………………………………………………………………31
24. Modulus graphs of the same after market sample tested earlier at different thicknesses 2 hours after of coming out of the oven and on the 2, 5, and 8 days. Red tests were run on the spray sample (approximately 1 mil coating thickness), Green tests were run on the drawdown sample (approximately 1 mil coating thickness), and Blue tests were run on the drawdown sample (approximately 1/2 mil coating thickness)…………………………………………………...34
25. Average modulus graph of a clearcoat with thickness ½ mil (blue) and 1 mil (green) using drawdown technique and 1mil (red) using spray technique……………………………………...35
26. Average hardness graph of a clearcoat with thickness ½ mil (blue) and 1 mil (green) using drawdown technique and 1mil (red) using spray technique……………………………………...35

1: Introduction
There have been developments in the automotive refinish clearcoats industry that
make the coats self-healing, scratch resistant, economically affordable and with better
adhesion. They have made a phenomenal impact on the change of mechanical properties
like scratch and mar resistance of automotive coatings. The clearcoat, being a top layer
coat of a multilayered coating system of 4 to 5 layers, is prone to various environmental
damage like stone chipping, marring, UV radiation, acid rain, snow, etc.1, 2 The 40 to 60
µm fast drying automotive clearcoat, which is a mixture of acrylic polyol/thermoset
polyurethane resin and a curing agent reactive with hydroxyl groups, makes the
automobiles look glossy, and protects them from environmental damage. The clearcoats,
therefore, must provide resistance to chemical and mechanical damage to preserve the
look of vehicles.3, 4 In automotive refinish work, one has to take several measures to get
the final coat to the expected finish, and the surface must be clear from any visible flaws.
The quality of an automotive coating is determined predominantly by the appearance,
which must remain attractive to the customers. In the refinish process, despite taking
several precautions, the coated samples are prone to several surface flaws that need to be
buffed out to give the panel a glossy appearance. Imperfections in the clearcoats are the
results of the environmental conditions in the bodyshops, such as unclean substrate
surfaces, untidy surroundings, improper air filtration and circulation, and uneven
temperature variations inside the coating chamber, which are difficult to control during
the application process. It is more economical to buff out the surface flaws rather than to
create prefect environmental conditions.
1

In this paper I have discussed three parts of a study conducted by the Surface
Science and Nanotribology Laboratory (SSNTL). Part 1 of the study examines the
recovery mechanism of different clearcoats at high temperatures (up to 70°C). Part 2 of
the study seeks a better understanding of the mechanism of buffing at different stages.
Part 3 of the study examines the curing process of the clearcoats.
Initially we studied the indentation and the scratch mechanisms of two samples
(sample 1 is an advanced coating and sample 2 is a standard coating) available on the
market. Initially we took two sets of samples of each coating on which we performed
indentation and scratch tests. The indentation and scratch tests were carried out on a
Nano Indenter XP, produced by MTS. The indentation tests were carried out with a
Brockovich tip, and indents were made using different loads from which hardness and
modulus of the coatings were determined. The scratch tests were carried out using a
conical tip of one micron radius, in which a set of progressive and constant load scratches
were made. Data from the scratch tests, like the ditch area, shoulder area, and the load
applied on sample, gave information regarding the mar resistance. The recovery
mechanism (memory) of the coating at higher temperatures was determined in this part of
the study; we found that modern coatings can easily restore plastic deformation simply by
warming of the metallic substrate on a sunny day without any need of buffing or
polishing aids. We used two different methods of applying heat to the samples, dry heat
(samples placed in an oven) and wet heat (samples immersed in hot water).
2

In the second part of study we tried to explore the buffing mechanism of the
clearcoats. In order to better understand what happens in the process of buffing, we
visited a workshop where we observed the steps involved in buffing. We also visited
several body shops to encounter the real world application of buffing and refinish work.
In order to study different stages of buffing, we used six different commercial
clearcoats. Clearcoats 1 & 2 are the Original Equipment Manufacturer/ OEM coatings
for which the curing temperature is high, and the clearcoats 3, 4, 5, 6 are the after-market
coatings that have a lower curing temperature. Clearcoat 3 is an established coating that
has been in use for a long time, is generally considered to buff easily, and is used in this
study as a reference coating. We recognized six steps for the buffing process. The first
(step 0) was the initial unbuffed coated sample and next five buffing steps (steps 1
through 5) involved a progressive abrading of the clearcoats from course to ultrafine. We
have studied the characteristic damage on each of the clearcoats at each of the buffing
steps. The damage was characterized by measuring roughness after each of the buffing
steps. We also measured hardness and modulus after each of the buffing steps in order to
determine any changes due to buffing. A Scanning Probe Microscope (SPM) was used to
measure the roughness, and a Nano Indenter XP was used to measure modulus and
hardness. There were a total of 36 samples corresponding to the six clearcoats in six
different buffing steps. The results are interpreted by plotting variations of average
roughness, average modulus, and average hardness Vs indentation depth in each of the
buffed samples.
3

In Part 3 of the study we made a time study of the curing process of clearcoat 3,
which was our after-market reference clearcoat. The clearcoats are cured in an oven for a
certain amount of time depending on the manufacturer’s specifications. The clearcoats
are considered fully cured after coming out of the oven, but it was suspected that the
clearcoats continue to cure for several days even after they are baked. We observed the
changes in the mechanical properties over time from four hours out of the oven up to
several days. Samples were prepared using the facilities in the Coatings Research
Institute (CRI, EMU) and brought to the Surface Science Lab for testing within 2 to 3
hours after coating and baking. Starting at 4 hours after coming out of the oven, we did
indentation testing, measuring the elastic modulus and hardness of the sample.
Concurrently we did scratch testing, scratching the surface of the clearcoat at different
constant loads. The tests were continued on the second day, fourth day, and so on. The
test results clearly showed changes in mechanical properties.
Developments in the clearcoat industry have changed the way coatings behave in
response to different damages physically and environmentally. In the refinish process,
the discrepencies in the final clearcoats need to be buffed out; this paper identifies the
problem of the advanced coatings and distingushes the differences between the new and
the OEM (Original Equipment Manufacturer) coatings.
4

2: Instruments
We used a Nano Indenter XP and a Scanning Probe Microscope (SPM) to study
the mechanical and tribological properties of the clearcoats. A Nano indenter is used to
make indents and scratches to characterize hardness and modulus, and a Scanning Probe
Microscope is used to image the scratched surface to determine the roughness.
2.1 Nano Indenter XP
The Nano Indenter XP is one of the most common devices used to study the
mechanical properties of materials at the sub-micron scale range. We used a Nano
indenter XP for indenting and scratching, which provides an easy and quick way obtain
mechanical data on the nano scale.5, 6 It is made by MTS and is a software-controlled
device that has an easy user interface. Many studies have been published in the field of
the tribology using a Nano indenter8. The instrument is very accurate in detecting the
surface and measuring creep on polymer films8. We used the instrument to measure
hardness and modulus as a continuous function of displacement in the surface. Elastic
Modulus and hardness are calculated as following
Elastic modulus9 (Bulk);
5

Hardness9;
where β is a constant dependent on the tip geometry (β = 1.034 for Berkovich tip) and A
is the projected area of contact. S (df/dh or Newton/meter) is the slope of indentation
curve (as shown in Figure 9) and is determined by the force with respect to displacement
in to the surface.9, 10 is the maximum force applied on the tip.
In the surface and nano-tribology laboratory we are using a Nano indenter XP,
which is equipped with continuous stiffness measurement (CSM). The CSM mode
allows us to simultaneously calculate the hardness and modulus, the measuring stiffness
data along the applied load, and the displacement into the surface at each and every data
point.11 The reliability of the tribological properties of a surface does not only depend on
the tip geometry, force, and displacement measurements but also on the stiffness of the
contact area between the indenter tip and the sample material; this allows us to measure
hardness and modulus accurately.11, 12
Nano indenter XP is also used to measure storage and loss modulus. Storage
modulus is a quantity used to describe the ratio of stress in phase with strain to the total
strain, and loss modulus is energy dissipation as heat due to mechanical deformation;
these are observed in materials due to visco-elastic damping.
6

Figure 1: Nano indenter XP and CSM equipment in the Surface Science and Nanotribology Laboratory. It is operated using the attached computer.
Preparation before the test
(1) The sample must be as flat as possible. (2) The surface roughness affects the
measure of hardness and modulus. It should be examined by profiling the sample before
testing. (3) Mounting the sample to the indenter is also important in characterizing the
tribological properties of the coatings. The glue used in mounting should not give a
cushion effect to the samples. Glues like epoxy have this effect, but hot glue, which is an
adhesive that melts around 70ºC and solidifies at room temperature, gives a better
adhesion and is also harder. However, we mainly used superglue in mounting the
samples in this study, as it does not give any cushion effect to the sample and is also very
thin. (4) It is better to be familiar with the film thickness and sample substrate and to
have a rough idea of hardness and modulus before running the tests.
Components of the indenter
7

Some of the components of the indenter head, which is operated with computer
using testworks software provided by MTS, are shown in Fig 2.
Figure 2: Schematic diagram of the indenter head and its components.7
Tips used for indentation and scratching
We used a Berkovich tip and a conical shaped tip in order to indent and scratch
the samples, respectively. The Berkovich tip is a pyramidal shaped tip used to indent the
surface to obtain a measurement of the hardness and modulus. The conical tip of 1µm
diameter was used to make progressive and constant load scratches to find the mar
resistance and abrasive wear of the clearcoats. Figure 3 illustrates the shapes of the (1)
Berkovich tip and (2) The conical shaped tip.
8

(1) (2)
Figure 3: Typical shape of a (1) Berkovich indentation tip and (2) Conical shaped scratch tip.7
2.2 Scanning Probe Microscope (SPM)
Scanning Probe Microscopy is one of the best techniques employed in the surface
characterization of various materials. It is a technique associated with nano science that
is used to form images of surfaces on the atomic/molecular scale using a physical probe.
SPM is widely used in a variety of applications in the field of research involving surface
studies of materials like polymers and biological samples.13 Ever since its development
in 1985, the Scanning Probe Microscopy technique has been branching out into several
9

fields with an improved imaging speed and force sensitivity.13 Images produced using an
SPM can be in the scale range of a few nanometers (nm) to several hundred micrometers
(µm) in the x-y direction and 4 to 6 micrometers in the z direction. Images with a
magnification to the level of an atom, are made using a nano tip that is glued to a very
low spring constant cantilever that gently touches the surface without damaging it. This
interaction between the probe and the surface is used in obtaining a topographic
representation or an image, as illustrated in Figure 4. The Scanning Probe Microscopy
technique is operated on a principle based on Van der Waals forces between the tip and
the surface. These forces may be either the short range repulsive or the long range
attractive force when operated in contact-mode and tapping mode respectively.13 The
force measurement using an SPM is not only recorded in the direction normal to the
surface but also in the direction parallel to it, measuring the torsional moment of the
cantilever. The force normal to the surface gives rise to a height image, and the force
parallel to the surface gives a friction image in contact mode and a phase image in
tapping mode.14 The tip scans the selected area on the surface of the samples in a
particular way as shown in Figure 5; this method is called “Raster Movement”. 13 The
SPM used in the lab (SSNTL) is a Veeco instrument and is equipped with a Nanoscope
IIIa controller. In this study the SPM was operated in the Atomic Force Microscope
(AFM) mode.
10

Figure 4: Physical interpretation of Scanning Probe Microscopy (SPM) components and principal involved in the SPM technique.13
Figure 5: Raster movement. The tip moves on the surface following a precise movement called raster, as shown.13
Different Modes of Scanning
A scanning probe microscope can be operated in contact mode as well as in
dynamic or tapping mode based on the surface characteristics.18 Contact mode is best in
imaging harder surfaces, and tapping mode is used to image softer surfaces. Larger
11

contact forces in the contact mode and higher tapping voltages in tapping mode may lead
to changes to or damage in the surface, resulting in a decrease of the sharpness of the
tip.18
In contact mode the tip approaches the sample surface and makes contact with the
surface. The tip follows the contour of the surface while it is traced and retraced. The
topographic variation is read by a laser beam detector from the vertical displacement of
the tip, and an image is formed on a computer screen that is a representation of the
surface.20, 21 The same thing happens with the tapping mode, but the cantilever is vibrated
with an oscillating magnetic field that detects the smallest change in the morphology of
the sample. These small changes are crests and troughs that are produced by the
irregularities on the surfaces of the coatings which are only within the nanometer range of
the original morphology but can be identified by the larger deflection of the tip in tapping
mode.
However, since most of our polymeric samples were hard, the contact mode
operated with a silicon nitride tip, which is flexible in friction and height measurements
and which was a better choice rather than with a silicon tip, which is brittle and can be
damaged at faster scanning rates. The samples are mounted on the scanner, which is
equipped with a piezo-electric actuator.
Micro-Mar Resistance
Mar is defined as a shallow and light scratch on the surface of the coating, and a
scratch can be identified as intense or severe damage.15 The data for calculating the
components are obtained by measuring the depth of penetration and the dimensions of
12

each mar made by a single scratch.16 The cross section of the ditches and of the shoulders
of the mar can be closely approximated by troughs.17 The areas of the cross sections of
each ditch and the sum of two shoulders are measured for about 400 sets of data along
each mar, and the results are averaged. Figure 6 is a diagram showing the evaluation of a
constant load scratch and defining the cross-sections of the indentation, the ditch, two
shoulders, and the trough, to find Micro Mar Resistance (MMR).
Figure 6: Diagram used to show the characterization of Micro Mar Resistance by a scratch.17
3: Experimental and Data analysis
In the first phase, we studied the temperature dependent recovery mechanism of
clearcoats; in the second, we studied the buffing mechanism of various types of clear
13

coats in five different stages of buffing; and finally we studied the curing process of
different clearcoats.
3.1 Recovery Process
Automotive coating systems are made of 4 to 5 layers of coatings in which the clearcoat
is the topmost layer. The thickness of this layer is about 2 to 3 mil (1mil = 10-3 inch =
25.4 µm). In order to study the damage within this layer (since the focus of the study was
on buffing systems), we received panels prepared by the project sponsor. The panels
were cut into small pieces of 1cm×1cm size, using a shear cutter, so they would fit into
Nano-indenter and Scanning Probe Microscope.
On a sunny day, automotive panels are normally heated to a temperature higher
than 70ºC. We therefore felt comfortable using a thermoset glue to mount the samples to
the Nanoindenter for testing the clearcoats. Though mounting and dismounting the
samples is easy with thermoset glue, we observed a marked change in the scratch
morphology due to heating the samples to remove them from the mount. We then
switched to superglue (ethyl cyanoacrylate) to mount the sample. We studied the
indentation and the scratch mechanisms of two clearcoats named Sample 1 and Sample 2.
Sample 1 is an advanced coating and Sample 2 is the standard coating available in the
market. We further studied the recovery due to heating that we observed when we were
using thermoset glue.
Original Morphologies
We examined the original morphologies of both the clearcoats using an Atomic
Force Microscope (AFM). A 100 × 100 µm image was taken at different spots on each
14

of the samples to examine the differences in the surface morphologies. Sample 1 showed
a smoother surface than Sample 2, as shown in images (1) and (2) of Figure 7, where the
z scale is 50 nm. We also found larger imperfections on the same set of samples, as
shown in images (3) and (4) of Figure 7 In this case the z scale is 3 µm.
(1) (2)
(3) (4)
Figure 7: (1) and (2) are the smooth surface morphologies of Samples 1 and 2, respectively, with a height (z) scale of 50 nm and (3) and (4) are the areas of
imperfections on the clearcoat Samples 1 and 2, respectively, with a z-scale of 3µm; all the images are 100×100 µm in the x-y plane.
Direction of the study
Phase 1 of the study was initially intended to differentiate between the two
clearcoats as a part of the preliminary study in a project sponsored by 3M. Accidentally
15

we discovered when using a thermoset glue that the heat has considerable effect on the
clear coats. The glue is heated to a temperature of 70ºC to melt; due to this, the cylinders
used to mount the samples in the indenter are heated. The same process is repeated to
remove the samples from the mount after testing. After dismounting the samples we
noticed that the scratch morphology was greatly affected due to the heat treatment.
Figure 8 is the optical images of Sample 1 before and after the heat treatment. It is also
interesting to note that the scratches have healed, but the imperfections (pits) that occur
while coating are much less affected.
Figure 8: optical images of sample 1 that clearly shows the recovery due to heat treatment.
Indentation and scratching
The indentation tests were carried out, taking a sample set of each coating, using a
Brockovich tip and indents were made with different load to determine the hardness and
16

modulus of the coatings. Indents were made at nine locations at a distance of 1µm apart
on each sample. In a typical indentation test, the tip finds the surface, starts indenting to a
pre-determined load, holds the maximum load to check the creep, and finally unloads, as
shown in the Figure 9. The graph shows all nine indentation curves illustrating the
repeatability of our measurements. The hardness and modulus of Samples 1 and Sample 2
are plotted against the load on the sample, as shown in the Figure 10.
Figure 9: Indentation test curve to a depth of 10µm and nine indent locations 1mm apart,
the graph shows all nine indentation curves illustrating repeatability of our measurements.
17

Figure 10: plots of Hardness and Modulus Vs load on sample of both the samples
1 and 2. The scratch tests were carried out using a conical tip of one micron radius, in
which a set of progressive and constant load scratches were made. The progressive load
scratches are the scratches that are made with an assigned maximum incremental load
18

from the start to the end point. Progressive scratches determine the different tear
response of material at different loads. We can estimate the forces of marring, cracking,
and chipping on the surface with these scratches.
In making a progressive scratch, the indenter finds the surface, does a pre-scan
over the surface to outline the original shape, then makes a scratch from zero to the
assigned maximum load, and then does a post-scan, profiling the residual depth of the
scratch. Figure 11 is a displacement curve of a typical progressive scratch on one of the
samples showing the scratch depth and residual depth curves as well as the marring,
cracking, and chipping regions. The scratch length is 400 µm and the maximum load
used was 150 mN at a velocity of 5 µm/s.
Figure 11: The progressive load scratches on one of the samples showing the scratch depth (bottom curve) and the residual depth of the scratch (top curve) describing the
marring, cracking, and chipping regions.
19

There were three sets of samples of each of the advanced and traditional
clearcoats; we made three progressive load scratches on each sample. We used one set of
samples as control samples, and the other two sets were to examine the effects of dry heat
and wet heat (heating the samples in air and heating them in water) up to a temperature of
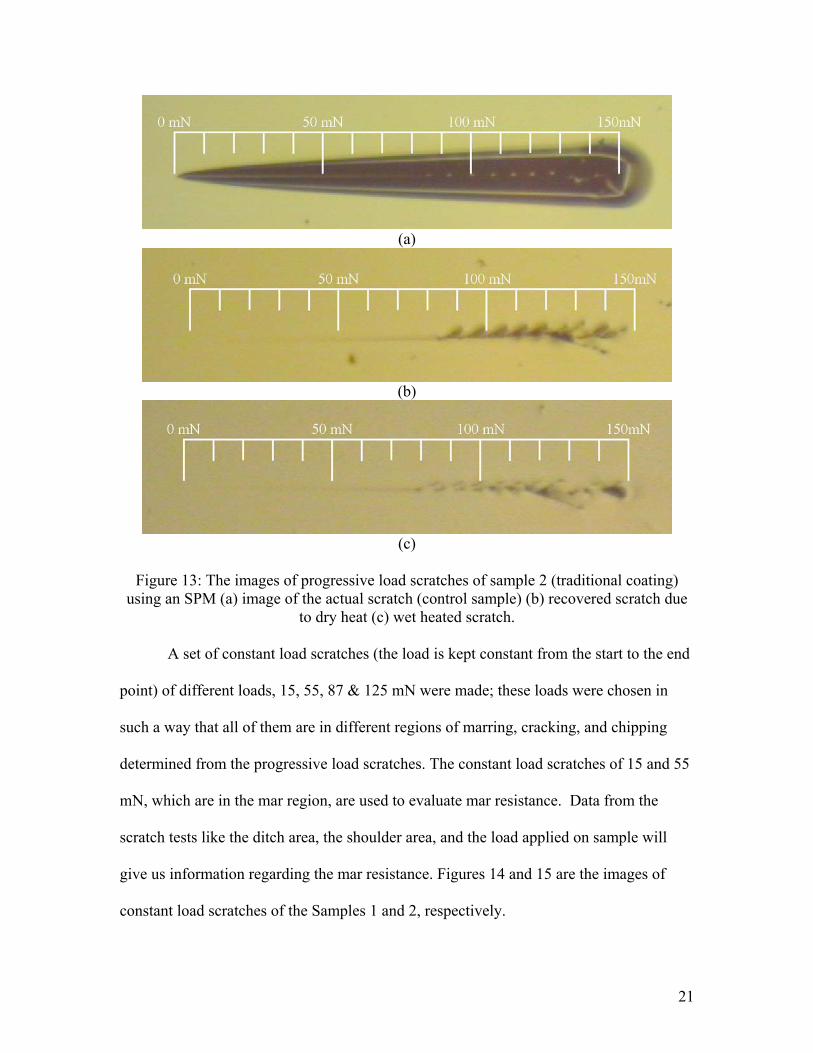
70ºC in both the cases. Figures 12 and 13 are the scratch images taken using a scanning
probe microscope of the Samples 1 and 2, respectively.
(a)
(b)
(c)
Figure 12: The images of progressive load scratches of Sample 1 (advanced coating)
using an SPM (a) image of the actual scratch (control sample) (b) recovered scratch due to dry heat (c) wet heated scratch.
20
(a)
(b)
(c)
Figure 13: The images of progressive load scratches of sample 2 (traditional coating)
using an SPM (a) image of the actual scratch (control sample) (b) recovered scratch due to dry heat (c) wet heated scratch.
A set of constant load scratches (the load is kept constant from the start to the end
point) of different loads, 15, 55, 87 & 125 mN were made; these loads were chosen in
such a way that all of them are in different regions of marring, cracking, and chipping
determined from the progressive load scratches. The constant load scratches of 15 and 55
mN, which are in the mar region, are used to evaluate mar resistance. Data from the
scratch tests like the ditch area, the shoulder area, and the load applied on sample will
give us information regarding the mar resistance. Figures 14 and 15 are the images of
constant load scratches of the Samples 1 and 2, respectively.
21

Figure 14: Constant load scratches of sample 1 at 15, 55, 87 and 125 mN, respectively.
Figure 15: Constant load scratches of sample 2 at 15, 55, 87 and 125 mN, respectively.
Results and Discussions
Sample 1 of the Indentation testing has a higher modulus and hardness. Sample 1
of the progressive (also from constant) load scratches had earlier onset of cracking and
chipping than Sample 2. Sample 2 of the Progressive load scratch testing showed more
ductile than Sample 1 due to earlier onset of cracking and chipping. Both samples
showed a recovery when heated above 70ºc. Sample 2 showed a better recovery than
Sample 1, and there was very little difference in the wet and dry heating.
22
3.2 Buffing Study
We examined the buffing process. We first had a demonstration of the entire
buffing process where we observed the procedure and the steps involved in buffing. We
also visited several body shops to encounter the real world application of buffing and
refinish work. Several panels were prepared for us by the project sponsor using the six
commercially available clearcoats utilized in the study. Each clearcoat was buffed to the
various stages in the buffing process. We learned several aspects from our initial study
and from the workshop and the body shops. The buffing mechanism involves two levels
of controlled sanding for abrading the material to a thickness of the imperfection, and the
next three levels make use of buffing compounds to buff out the scratches produced by
earlier sanding. The buffing compounds are chemical compounds with mineral
abrasives. P1500 and P3000 sized particle sandpaper with a random orbital sander was
used to abrade the surface of the clearcoat in the first two stages of sanding. The next
three stages of buffing are compounding, polishing, and finishing, using a disc sander and
wool or foam pads wetted with the buffing compounds. After the five steps of buffing,
the samples have a smooth finish; i.e., scratches are so fine that they are not visible to the
human eye.
In this phase of the study, we examined six different clearcoats each in six
different stages of buffing, for a total of 36 samples. Sample 1 and Sample 2 are the
Original Equipment Manufacturer (OEM) or the standard coatings for which the curing
temperature is high. Samples 3, 4, 5, and 6 are the aftermarket coatings that have lower
curing temperatures and in which sample 3 is an established coating that has been in use
for a long time, and is generally considered to buff easily and is used as a reference
23

coating. Out of the six stages of each clearcoat, the first stage or step 0 is the initial
coated sample, and the next are the five buffing stages. These samples were
characterized using the Nano Indenter XP for hardness and modulus measurements and
the AFM to measure roughness and scratch morphology at the various stages of the
clearcoats.
Indents were made on all 36 samples to determine the hardness and modulus.
Figure 16 is the average modulus graph of all the samples, and Figure 17 is the average
hardness graph. Standard deviation bars (shown in Figures 16 and 17) of the hardness and
modulus graphs in step 1 and step 2 are greater because of roughness of the samples; the
greater the surface roughness, the greater the deviation from the represented value.
Figure 16: The average modulus graph in all the buffing steps from 1 to 5 and unbuffed
samples.
24

Figure 17: The average hardness graph in all the buffing steps from 1 to 5 & unbuffed
samples. The Scanning Probe Microscope was operated in contact mode, using a silicon
nitride tip, to determine the roughness of all 36 samples. The images were taken at 3
different locations on each (1 cm × 1 cm) sample. The roughness measurement presented
is the average of the three images with the standard deviation of the three measurements.
Images of step 1 and step 2 were taken with dimensions of 100 µm × 100 µm in x-y scale
and a z scale of 2 µm. The images of steps 3, 4, 5, and 0 were taken at 25 µm × 25 µm
using a z scale of 100 nm for steps 3 and 4 and 25 nm for steps 5 and 0. The decrease in
the z scale from 2 µm to 25 nm in the five stages of buffing signifies that the scratches
are polished from coarse to ultrafine, making the surface look glossy and free from
visible surface imperfections. Figure 18 shows the images of one of the OEM samples;
25

the images illustrate the damage to the sample done by early sanding with a grit of P1500
and P3000 in steps 1 and 2 that are buffed out in the steps 3, 4, and 5 with buffing
compounds. Figure 19 shows the average roughness of all the samples measured in each
step. The average roughness was calculated using the roughness of the images taken from
the Scanning Probe Microscope at three different places on each sample. The average
roughness for step 1 and 2 shows a large variation at different spots on the sample; it also
can be spotted from the graph that these steps have a noticeable standard deviation.
Step 1 Step 2
Step 3 Step 4
26

Step 5 Step 0
Figure 18: SPM images of sample 2 used in estimating the roughness measurement, the dimensions of step 1 and step 2 images are 100 µm × 100 µm and a z scale of 2 µm and
all the remaining steps 3, 4, 5 and 0 are at 25 µm × 25 µm but the z scale of 3 and 4 images is 100 nm and the for the steps 5 and 0 is 25 nm.
Figure 19: The Average Roughness graph in all the six steps of each sample measured with Scanning Probe Microscope.
27

Results and discussions
The results of both the studies from the indentation and SPM can be interpreted
by plotting the variations of average roughness, average modulus, and average hardness
in each of the buffed samples. The average roughness plot shows that the OEM samples
are slightly less rough than the aftermarket ones in the first stage of buffing. The average
modulus plot depicts that OEM samples have higher modulus than the aftermarket
samples in the first stage of buffing, but gradually this reverses in the next four stages and
it becomes opposite in the fifth stage. The average hardness is comparatively higher in
the OEM samples throughout the buffing stages, but one of the OEM’s (sample 1)
displays greater hardness than any of the other samples. The samples with higher
hardness and higher elastic modulus seem to be cut more (remove excess material), and
vice versa. We were not able to reproduce scratches made by the buffer in order to know
what happens while scratching using Nano indenter, since speed (speed of the buffer is
ten thousand times greater than the velocity of the tip) was the main limitation of this part
of the study. The project sponsor found that Sample 2 is much more challenging to buff
than Sample 1. This is contrary to the idea that the harder materials are more difficult to
buff.
28

3.3 Curing Study
The refinish work of the automotive clearcoats was done between 4 to 6 hrs after
the panel was coated and baked; this was because the body shops want to save time and
cost. To this end we wanted to make a time study of the curing process of the clearcoats
testing the mechanical and tribological properties of the clearcoats right after they are
painted. In order to paint a sample, the coating was mixed with the hardener at a specific
ratio and stirred properly for a fine mixing. This mixture was taken in to a cup holder of
the spray gun, which should be thoroughly cleaned before spraying the clearcoat. The
coatings were done on steel panels that already have basecoat on them, and on aluminum
panels that were also used in the later part of the study. There are several parameters that
should be controlled, such as using a clean substrate for coating the sample, maintaining
dirt-free surroundings that are a constant temperature, and, most important, coating the
film in a uniform thickness. The coated panels are baked for a specific amount of time at
a specific temperature, depending on the manufacturer directions. Again the oven used
for baking must be clean and have a uniform temperature and air filtration across the
chamber. Usually the paintings are done over at the Coatings Research Institute (CRI),
Eastern Michigan University (EMU), and the samples are brought to the Surface Science
and Nano Tribology Lab (SSNTL) and are tested within 4 to 5 hours after coating and
baking as the samples were coated by a spray technique. Starting the first curing tests
with an aftermarket clearcoat, we measured the elastic modulus and hardness and
scratched the surface of the paint at constant loads of 2, 4, 6, 8, and 10mN, about 4 - 5
hours after taking the sample from the oven, as well as on the second day, fourth day, and
after a week using the Nano-Indenter XP. It was difficult for the indenter to find the
29

surface when the sample was too soft in the four-hour range. The curing of the clearcoat
within the first four hours was less and one has to manually define the surface when the
indenter is running. We discovered that when the stiffness dramatically shifted, then we
considered it as the indenter found the surface. This problem when testing the samples in
the four-hour range was seen in all the clearcoats, and the problem also signifies that the
clearcoats are not fully cured even 4 to 5 hrs after taking the samples out of the oven.
Nine indents were made, each at the time of 4 hrs, the second day, and fourth day, and
after a week. On one of the aftermarket samples, we tested to measure the hardness and
modulus. Figure 20 is the graph of the average modulus, and Figure 21 is the graph of
the average hardness. They clearly show the change in the mechanical properties with
the time. It is also interesting to note from the graphs that the samples tend to cure over a
week. The cure rate is faster in the first 2 to 3 days and approaches a stable value that
increases at a reduced rate.
We made both indents and scratch studies. Nine indents were made in an array of
a 3×3 matrix. Scratch testing was performed on each of the samples immediately
following the indentation testing on each of the testing days. The scratch tests were
performed with different constant loads of 2, 4, 8, and 10 mN. We made a second study
on the same samples but this time with a different thickness with the same spray
technique. The hardness and modulus measured this time was less than the previous
values due to the difference in thickness. Figures 22 and 23 are the average modulus and
hardness graphs of the same clearcoat but with a different thickness. The graphs clearly
indicate the change in mechanical properties over a period of time, but when compared to
the same clearcoat at a different thickness, the sample initial modulus varied from 2.48
30

GPa (thick) to 1.69 GPa (thin) and also the initial hardness varied from 1 GPa (thick) to
0.5 GPa (thin). The final modulus and hardness approached the same values in both the
cases.
Figure 20: Average modulus graph for the thick sample; this clearly shows the
change in modulus over time.
Figure 21: Average hardness graph for the thick sample; also shows the change in
hardness over time.
31

Figure 22: Average modulus of the same sample but different thickness; the graph
clearly shows the increase in modulus with time.
Figure 23: Average hardness of the same sample with different thickness; the
graph clearly shows the increase of hardness over time.
There is an indication that the thickness also affects the mechanical properties of
the clearcoats in the early stages of curing. As mentioned earlier, the above bar graphs
are the results of same clearcoat, but Sample 1 is thicker than Sample 2 since they were
made by different people at different times. We further studied the effect of thickness on
the curing process. As it is very difficult to get an exact thickness of the film with the
32

spray technique, we considered using the drawdown method using a drawdown bar. The
film thickness is also found to be more consistent than the spray method. We made a
systematic study of the change in mechanical properties measured during the curing
process of a coating applied by spray and a coating of the same thickness applied using a
drawdown bar. For this purpose we prepared three samples of the same aftermarket
sample used previously. On one we applied the paint using a spray gun in a single coat,
with a dry film thickness of approximately 1 mil (1 mil = 25.4 µm). On another we
applied the paint using a drawdown bar with a dry film thickness also of approximately 1
mil. And for a third sample we also applied the paint using the drawdown bar, but with a
dry film thickness of approximately 0.5 mil.
We did indentation testing to measure the hardness and modulus of the cured
samples. Tests were run on Day One or the first day of the study, starting about 2 hours
after the samples came out of the oven. The tests were repeated on days 2, 5, and 8. Four
separate indentations approximately 300 µm apart were done on each sample each day of
the study. First one indentation was done on each of the samples, and then the second
indentation, and so on. Figure 24 shows the progress of curing with time and clearly
demonstrates how the modulus varies with depth for each of the samples on the four days
when testing was conducted. Each line is the result of a separate indentation test. The
three colors differentiate the tests run on each of the samples where the blue and green
color curves show the samples prepared using drawdown technique of 0.5mil and 1mil
thick, respectively, and the red color curves shows the sample prepared with the spray
technique with 1mil thick. It can be clearly seen from these graphs that the two samples
prepared using different coating methods behave very similarly, while the thinner coating
33

cures much faster than the thicker coatings. The hardness data also followed a similar
trend.
Figures 25 and 26 show the average hardness and modulus graphs of the curing
study with spray and drawdown techniques. The graphs presented are the averaged
results between 3 to 5 µm of indentation depth. The 3D bar graphs show that the coating
done with drawdown of 0.5mil is different from the 1mil thick samples, as the 0.5mil
thick sample shows higher modulus and hardness in the beginning, but all three samples,
after being fully cured, attain a constant maximum value. Hardness and modulus over
time for all the samples increases at a reducing rate.
Scratch testing was also performed on each of the samples immediately following
the indentation testing on each of the testing days. Scratching was done under each of the
following constant loads, 2, 4, 8, 16, and 32 mN, with a scratch length of 1000 µm. As
with the indentation, first a 2mN scratch was performed on each of the samples, then the
4 mN scratches, and so on, to limit the time difference for the tests on each of the
samples.
34

Day 1 Day 2
Day 5 Day 8
Figure 24: Modulus graphs of the same after market sample tested earlier at different
thicknesses 2 hours after of coming out of the oven and on the 2, 5, and 8 days. Red tests were run on the spray sample (approximately 1 mil coating thickness), Green tests were
run on the drawdown sample (approximately 1 mil coating thickness), and Blue tests were run on the drawdown sample (approximately 1/2 mil coating thickness).
35

1/31/20082/1/2008
2/2/20082/3/2008
2/4/20082/5/2008
2/6/20082/7/2008
Spray (1 mil)
Drawdown (1 mil)
Drawdown (1/2 mil)0.000
0.500
1.000
1.500
2.000
2.500
3.000
Average Modulus (GPa)
Spray (1 mil) Drawdown (1 mil) Drawdown (1/2 mil)
Figure 25: Average modulus graph of a clearcoat with thickness ½ mil (blue) and
1 mil (green) using drawdown technique and 1mil (red) using spray technique.
1/31/20082/1/2008
2/2/20082/3/2008
2/4/20082/5/2008
2/6/20082/7/2008
Spray (1 mil)
Drawdown (1 mil)
Drawdown (1/2 mil)0.000
0.020
0.040
0.060
0.080
0.100
0.120
0.140
0.160
0.180
Average Hardness (GPa)
Spray (1 mil) Drawdown (1 mil) Drawdown (1/2 mil)
Figure 26: Average hardness graph of a clearcoat with thickness ½ mil (blue) and
1 mil (green) using drawdown technique and 1mil (red) using spray technique.
36

Results and discussions
The indentation test results clearly showed the changes in the properties. As the
time progressed, the elastic modulus and hardness increased at a reducing rate of change.
The sample with the slightly increased thickness of the same coating showed the same
tendency, but the modulus and hardness values were lower at the beginning because the
samples were not totally cured. This trend was also shown by the spray and drawdown
indentation tests.
The scratch tests showed that the ditch area, shoulder area, and trough area
decreased, indicating increasing resistance of the paint against the abrasive wear and the
plastic deformation. Over all, the coating method appears to influence scratching
morphology at least as much as film thickness. The real-time scratch depth is less on the
sprayed sample than on the two drawdown samples on Day 1 and Day 2 of the study,
regardless of film thickness. But by day 8 of the study, the real-time scratch depth is
similar for similar film thickness, regardless of coating method. Also, all three samples
have a similar residual scratch depth, even though the real-time scratch depth was
different. The mar resistance for the spray coating was better overall than for the
drawdown coatings.
As was predicted earlier, the thickness of the coating considerably affects the
mechanical properties in the process of curing, but it showed no effect after curing.
37

4: Conclusions
In the presented work, we first measured and compared the mechanical properties
of a traditional coating and a new coating. It was thought for a long time that the higher
modulus and hardness were the causes of the difficulties in the grinding/buffing work.
We found it may not be always true. The tested new coating, which is difficult to buff to
make a smooth surface, possesses lower modulus and hardness than the traditional
coating. Although hardness is a cause of the difficulties, sometimes soft coatings may be
ductile and viscous, which makes smoothing the surface difficult.
3M carried out cut tests, measuring the mass loss after grinding and buffing, and
finish tests, measuring the Haze level of the grinded and buffed surface, in the study of
refinish work, and found no clear pattern of correlation between the cut and the finish.
More cuts did not necessarily result in a better finish. After we examined 36 samples, i.e.,
six coatings at six stages during the refinish process, using the scanning probe
microscope, we found that the cut is a measure of abrasive wear, i.e., mass loss, while the
Haze level is an indication of the surface morphologies after grinding and buffing,
including gouges caused by mass loss and ditches and shoulders caused by plastic
deformation, etc., thus they do not have a clear correlation. We also measured elastic
modulus and hardness of the six samples at each stage using the Nano-Indenter XP, and
found the samples with higher hardness and higher elastic modulus seem to be cut more,
and vice versa. For example, aftermarket PPG ceramic clear coating possesses a lower
hardness and modulus and was cut less, which might be due to its softness and its being
more ductile and viscous.
38

Since the technicians in the body shops begin their grinding/buffing work within a
couple of hours to several hours after applying and baking the coatings, we studied the
freshly prepared samples intensively and found the mechanical and tribological properties
of coatings changed dramatically in the curing process, especially in the first 12 hours. As
the time went on, the modulus and hardness of the coatings increased at a gradually
reduced rate to reach the stabilized values as weathered coatings. The new coatings
usually are not ready for the refinish work due to their uncured softness and being ductile
and viscous a couple of hours to several hours after baking. To ease the refinish work, we
have to adjust the baking conditions (temperature and time), modify the formula of the
coatings (e.g., add some solvent), etc. to open a “window” (to discover a better time to
buff the samples) a couple of hours to several hours after baking, at which time the
coating possesses moderate hardness and elastic modulus, while not being ductile and
viscous, in addition to improve the grinding and buffing devices, pad materials, and
buffing compounds.
39

References
1. S. K. Sinha, W.L.M. Chong and S. C. Lim (2007), Scratching of polymers—
Modeling abrasive wear, J. Wear, 262, 1038-1047.
2. S. K. Sinha and Desmon B.J. Lim, Effects of normal load on single-pass
scratching of polymer surfaces, J. Wear,260, 751-765.
3. E. Barna, B. Bommer, J. Kursteiner, A. Vital, O. V. Trzebiatowski, W. Koch, B.
Schmid and T. Graule, Innovative, scratch proof nanocomposits for clear
coatings, J. Composites Part A: Applied Science and Manufacturing, 36, 473-478.
4. J. Cayer-Barrioz, D. Mazuyer, A. Tonck, Ph. Kapsa and A. Chateauminois,
Nanoscratch and friction: An innovative approach to understand the tribological
behavior of poly(amide) fibres, J. Tribology International, 39, 62-69.
5. W. Shen, J. Sun, Zh. Liu, W. Mao, J.D. Nordstrom and P.D. Ziemer et al. (2004)
Methods for studying the mechanical and tribological properties of hard and soft
coatings with a nano-indenter, J. Coat Technol Res 1, 117–125.
6. W. Shen, L. Mi, B. Jiang (2006), Characterization of mar/scratch resistaance of
coatings with a Nano-indenter and a scanning probe microscope, J. Tribology
International, 36, 146-158.
7. Nano indentation data of MTS is available from www.mtsnano.com/products/xp/
8. E. Felder, and J. L. Bucaille (2006), Mechanical analysis of the scratching of
metals and polymers with conical indenters at moderate and large strains, J.
Tribology International,39, 70-87.
9. P. B. Lambotte, J. L. Loubet, C. verpy and S. Pavan (2002), Understanding of the
automotive clearcoats scratch resistance, J. Thin Solid Films, 420-421, 281-286.
40

10. P. B. L Lambotte, J. L. Loubet, C. verpy and S. Pavan (2001), Nano-indentation,
scratching and atomic force microscopy for evaluating the mar resistance of
automotive clearcoats: study of the ductile scratches, J. Thin Solid Films,398-399,
306-312.
11. S. A. Syed Asif, K. J. Wahl and R. J. Clinton (1999), Nanoindentation and
constant stiffness measurement using force modulation wuth a capacitive load-
displacement transducer, J. American Institute of Physics, 70,2408-2413.
12. H. Pelletier, A. L. Durier, C. Gauthier and R. Schirrer (2008), Viscoelastic and
elastic–plastic behaviors of amorphous polymeric surfaces during scratch, J.
Tribology International, 41, 975-984.
13. SPM information is available from www.veeco.com
14. W. Shen, S.M. Smith, F.N. Jones, C. Ji, R.A. Ryntz and M.P. Everson (1997),
Use of a scanning probe microscope to measure marring mechanisms and
microhardness of crosslinked coatings, J. Coat Technol 69 (873), 123.
15. W. Shen and F.N. Jones (1999), Investigation of tribological properties of
polymeric surface coatings with scanning probe microscope. In: V.V. Tsukruk
and K.J. Wahl, Editors, J. Microstructure and microtribology of polymer surface,
The American Chemical Society, 439–454 [Chapter 28].
16. W.C. Shen, B. Jiang and F.N. Jones (2000) Measurement of mar resistance and
study of marring mechanism of polymeric coatings with scanning probe, J. Coat
Technol 72, 89.
17. Nano indentation data of MTS is available from www.mtsnano.com/products/xp/
41

42
18. P. B. Lambotte, J. L. Loubet, C. verpy and S. Pavan (2002), Understanding of the
automotive clearcoats scratch resistance, J. Thin Solid Films, 420-421, 281-286.
19. Z. Chen, L. Y. L. Wu, E. Chwa and O. Tham (2008), Scratch resistance of brittle
thin films on compliant substrates, J. Materials Science and Engineering, 493,
292-298.
20. W. Shen, C. Ji, F. Jones, M.P. Everson and R.A. Ryntz (1996), Measuring scratch
resistance and microharness of crosslinked coatings with a scanning force
microscope, J. Polym Mater Sci Eng 74, 346–347.
21. W. Shen, C. Ji, F. Jones, M.P. Everson and R.A. Ryntz (1996), Measurement by
scanning force microscopy of the scratch and mar resistance of surface coatings,
J. Surf Coat Int 79 (6), 253.
22. N. Guermazi, K. Elleuch, H.F. Ayedi, H. Zahouani and Ph. Kapsa, Susceptibility
to scratch damage of high density polyethylene coating, J. Materials Science and
Engineering, 492, 400-406.