sturaa test 7 year 200,000 mile bus model low floor ... · sturaa test 7 year 200,000 mile bus...
TRANSCRIPT

STURAA TEST
7 YEAR
200,000 MILE BUS
MODEL LOW FLOOR FRIENDLY BUS
SEPTEMBER 2007
PTI-BT-R0706
The Pennsylvania Transportation Institute
201 Transp. Research Building (814) 865-1891 The Pennsylvania State University University Park, PA 16802
Bus Testing and Research Center
2237 Old Route 220 N. (814) 695-3404 Duncansville, PA 16635

TABLE OF CONTENTS
Page
EXECUTIVE SUMMARY ................................................................................................................................ 3
ABBREVIATIONS ........................................................................................................................................... 5
BUS CHECK-IN .............................................................................................................................................. 6
1. MAINTAINABILITY
1.1 ACCESSIBILITY OF COMPONENTS AND SUBSYSTEMS .......................................... 171.2 SERVICING, PREVENTATIVE MAINTENANCE, AND REPAIR AND
MAINTENANCE DURING TESTING ............................................................................... 201.3 REPLACEMENT AND/OR REPAIR OF SELECTED SUBSYSTEMS ........................... 24
2. RELIABILITY - DOCUMENTATION OF BREAKDOWN AND REPAIR TIMES DURING TESTING ...................................................................................................................... 29
3. SAFETY - A DOUBLE-LANE CHANGE (OBSTACLE AVOIDANCE TEST) ........................................ 32
4. PERFORMANCE - AN ACCELERATION, GRADEABILITY, AND TOP SPEED TEST ........................................................................................................................................... 35
5. STRUCTURAL INTEGRITY
5.1 STRUCTURAL STRENGTH AND DISTORTION TESTS - STRUCTURALSHAKEDOWN TEST ........................................................................................................ 39
5.2 STRUCTURAL STRENGTH AND DISTORTION TESTS - STRUCTURALDISTORTION .................................................................................................................... 43
5.3 STRUCTURAL STRENGTH AND DISTORTION TESTS - STATICTOWING TEST ................................................................................................................. 55
5.4 STRUCTURAL STRENGTH AND DISTORTION TESTS - DYNAMICTOWING TEST ................................................................................................................. 59
5.5 STRUCTURAL STRENGTH AND DISTORTION TESTS- JACKING TEST .............................................................................................................. 62
5.6 STRUCTURAL STRENGTH AND DISTORTION TESTS- HOISTING TEST.............................................................................................................. 64
5.7 STRUCTURAL DURABILITY TEST ................................................................................. 66
6. FUEL ECONOMY TEST - A FUEL CONSUMPTION TEST USING AN APPROPRIATE OPERATING CYCLE ................................................................................................. 75
7. NOISE
7.1 INTERIOR NOISE AND VIBRATION TESTS ................................................................ 907.2 EXTERIOR NOISE TESTS .............................................................................................. 96

3
EXECUTIVE SUMMARY
Dallas Smith Corporation submitted a model Low Floor Friendly Bus, diesel-powered 14 seat (including the driver) 28-foot bus, for a 7 yr/200,000 mile STURAAtest. The odometer reading at the time of delivery was 18,834 miles. Testing started onMay 11, 2007 and was completed on September 7, 2007. The Check-In section of thereport provides a description of the bus and specifies its major components.
The primary part of the test program is the Structural Durability Test, which alsoprovides the information for the Maintainability and Reliability results. The StructuralDurability Test was started on June 7, 2007 and was completed on August 30, 2007.
The test bus is built on a Ford Motor Co. F450 XL Super Duty Chassis. Theinterior of the bus is configured with seating for 14 passengers including the driver.Free floor space will accommodate 16 standing passengers resulting in a potential loadof 30 persons. At 150 lbs per person, this load results in a measured gross vehicleweight of 16,750 lbs. The first segment of the Structural Durability Test was performedwith the bus loaded to a GVW of 16,750 lbs. The middle segment was performed at aseated load weight of 14,420 lbs and the final segment was performed at a curb weightof 12,320 lbs. Durability driving resulted in unscheduled maintenance and failures thatinvolved a variety of subsystems. A description of failures, and a complete and detailedlisting of scheduled and unscheduled maintenance is provided in the Maintainabilitysection of this report.
Accessibility, in general, was adequate, components covered in Section 1.3(Repair and/or Replacement of Selected Subsystems) along with all other componentsencountered during testing, were found to be readily accessible and no restrictions werenoted.
The Reliability section compiles failures that occurred during Structural DurabilityTesting. Breakdowns are classified according to subsystems. The data in this sectionare arranged so that those subsystems with more frequent problems are apparent. Alsothe problems also are listed by class as defined in Section 2. The test bus encounteredno Class 1 or Class 2 failures. Of the seven reported failures, six were Class 3 and onewas a Class 4.
The Safety Test, (a double-lane change, obstacle avoidance test) was safelyperformed in both right-hand and left-hand directions up to a maximum test speed of 45mph. The performance of the bus is illustrated by a speed vs. time plot. Accelerationand gradeability test data are provided in Section 4, Performance. The average time toobtain 50 mph was 20.95 seconds.
The Shakedown Test produced a maximum final loaded deflection of -0.240inches with a permanent set ranging between -0.005 to 0.004 inches under a distributedstatic load of 11,250 lbs. The Distortion Test was completed with all subsystems, doorsand escape mechanisms operating properly. No water leakage was observedthroughout the test. All subsystems operated properly with the exception of thehandicap ramp not meeting the ground in two positions.

4
The Static Towing Test was performed using a target load (towing force) of14,784 lbs. All four front pulls were completed to the full test load with no damage ordeformation observed. The Dynamic Towing Test was performed by means of a front-lift tow. The towing interface was accomplished using a hydraulic under-lift wrecker.The bus was towed without incident and no damage resulted from the test. Themanufacturer does not recommend towing the bus from the rear, therefore, a rear testwas not performed. The Jacking and Hoisting Tests were also performed withoutincident. The bus was found to be stable on the jack stands, and the minimum jackingclearance observed with a tire deflated was 3.5 inches.
A Fuel Economy Test was run on simulated central business district, arterial, andcommuter courses. The results were 7.40 mpg, 7.99 mpg, and 13.74 mpg respectively;with an overall average of 8.73 mpg.
A series of Interior and Exterior Noise Tests was performed. These data arelisted in Section 7.1 and 7.2 respectively.

5
ABBREVIATIONS
ABTC - Altoona Bus Test Center
A/C - air conditioner
ADB - advance design bus
ATA-MC - The Maintenance Council of the American Trucking Association
CBD - central business district
CW - curb weight (bus weight including maximum fuel, oil, and coolant; but
without passengers or driver)
dB(A) - decibels with reference to 0.0002 microbar as measured on the "A" scale
DIR - test director
DR - bus driver
EPA - Environmental Protection Agency
FFS - free floor space (floor area available to standees, excluding ingress/egress areas,
area under seats, area occupied by feet of seated passengers, and the vestibule area)
GVL - gross vehicle load (150 lb for every designed passenger seating
position, for the driver, and for each 1.5 sq ft of free floor space)
GVW - gross vehicle weight (curb weight plus gross vehicle load)
GVWR - gross vehicle weight rating
MECH - bus mechanic
mpg - miles per gallon
mph - miles per hour
PM - Preventive maintenance
PSBRTF - Penn State Bus Research and Testing Facility
PTI - Pennsylvania Transportation Institute
rpm - revolutions per minute
SAE - Society of Automotive Engineers
SCH - test scheduler
SEC - secretary
SLW - seated load weight (curb weight plus 150 lb for every designed passenger seating
position and for the driver)
STURAA - Surface Transportation and Uniform Relocation Assistance Act
TD - test driver
TECH - test technician
TM - track manager
TP - test personnel
6
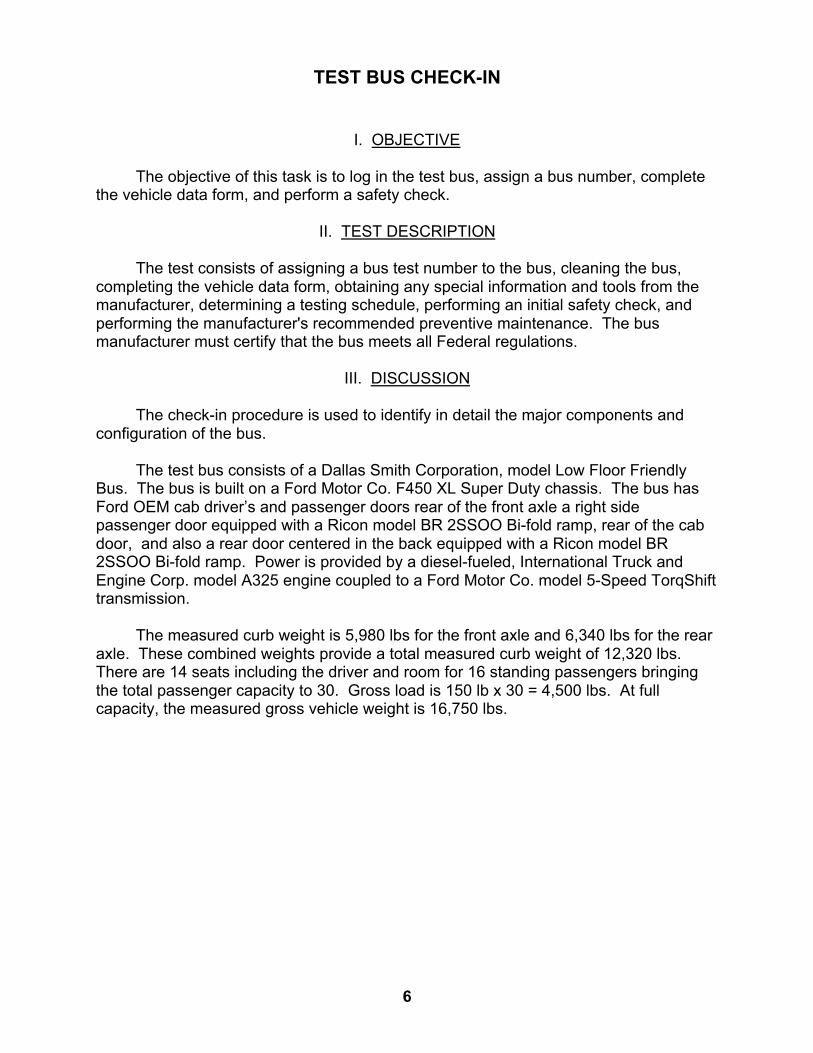
TEST BUS CHECK-IN
I. OBJECTIVE
The objective of this task is to log in the test bus, assign a bus number, completethe vehicle data form, and perform a safety check.
II. TEST DESCRIPTION
The test consists of assigning a bus test number to the bus, cleaning the bus,completing the vehicle data form, obtaining any special information and tools from themanufacturer, determining a testing schedule, performing an initial safety check, andperforming the manufacturer's recommended preventive maintenance. The busmanufacturer must certify that the bus meets all Federal regulations.
III. DISCUSSION
The check-in procedure is used to identify in detail the major components andconfiguration of the bus.
The test bus consists of a Dallas Smith Corporation, model Low Floor FriendlyBus. The bus is built on a Ford Motor Co. F450 XL Super Duty chassis. The bus hasFord OEM cab driver’s and passenger doors rear of the front axle a right sidepassenger door equipped with a Ricon model BR 2SSOO Bi-fold ramp, rear of the cabdoor, and also a rear door centered in the back equipped with a Ricon model BR2SSOO Bi-fold ramp. Power is provided by a diesel-fueled, International Truck andEngine Corp. model A325 engine coupled to a Ford Motor Co. model 5-Speed TorqShifttransmission.
The measured curb weight is 5,980 lbs for the front axle and 6,340 lbs for the rearaxle. These combined weights provide a total measured curb weight of 12,320 lbs.There are 14 seats including the driver and room for 16 standing passengers bringingthe total passenger capacity to 30. Gross load is 150 lb x 30 = 4,500 lbs. At fullcapacity, the measured gross vehicle weight is 16,750 lbs.

7
VEHICLE DATA FORM
Bus Number: 0706 Arrival Date: 5-11-07
Bus Manufacturer: Dallas Smith Corporation Vehicle IdentificationNumber (VIN): 1FDXF46P25EB88079
Model Number: Low Floor Friendly Bus Date: 5-23-07
Personnel: T.S. & S.C. Chassis: Ford Motor Co. / F450 XL Super Duty
WEIGHT:
Individual Wheel Reactions:
Front Axle Middle Axle Rear AxleWeights(lb)
Right Left Right Left Right Left
CW 3,020 2,960 N/A N/A 3,010 3,330
SLW 3,240 3,180 N/A N/A 3,660 4,340
GVW 3,500 3,460 N/A N/A 4,500 5,290
Total Weight Details:
Weight (lb) CW SLW GVW GAWR
Front Axle 5,980 6,420 6,960 7,000
Middle Axle N/A N/A N/A N/A
Rear Axle 6,340 8,000 9,790 12,000
Total 12,320 14,420 16,750 GVWR: 16,000
Dimensions:
Length (ft/in) 28 / 0
Width (in) 106.0
Height (in) 98.0
Front Overhang (in) 36.0
Rear Overhang (in) 75.0
Wheel Base (in) 225.0
Front: 75.0Wheel Track (in)
Rear: 85.0

8
Bus Number: 0706 Date: 5-23-07
CLEARANCES:
Lowest Point Outside Front Axle Location: Tie rod Clearance(in): 11.1
Lowest Point Outside Rear Axle Location: Handicap ramp Clearance(in): 11.4
Lowest Point between Axles Location: Fuel tank bracket Clearance(in): 8.0
Ground Clearance at the center (in) 8.0
Front Approach Angle (deg) 23.3
Rear Approach Angle (deg) 8.9
Ramp Clearance Angle (deg) 4.1
Aisle Width (in) 22.0
Inside Standing Height at CenterAisle (in)
78.0
BODY DETAILS:
Body Structural Type Semi-monocoque
Frame Material Steel
Body Material Steel / fiberglass
Floor Material Plywood
Roof Material Fiberglass
Windows Type _ Fixed _ Movable
Window Mfg./Model No. Janel Glass / AS-3 DOT 322 M-180
Number of Doors 1 Front 1 Rear
Mfr. / Model No. A & M / 123874
Dimension of Each Door (in) Driver’s – 40.7 x 47.5Cab pass. – 40.7 x 47.5
Front pass. – 36.8 x 70.4Rear pass. – 37.0 x 71.4
Passenger Seat Type _ Cantilever _ Pedestal _ Other (explain)
Mfr. / Model No. Freedman Seating Co. / Mid High FW 35”
Driver Seat Type _ Air _ Spring _ Other (cushion)
Mfr. / Model No. Recaro Seats / LXF High Back
Number of Seats (including Driver) 14

9
Bus Number: 0706 Date: 5-23-07
BODY DETAILS (Contd..)
Free Floor Space ( ft2 ) 25.0
Front 1. 12.7 2. N/A 3. N/A 4. N/A
Middle 1. N/A 2. N/A 3. N/A 4. N/A
Height of Each Step at NormalPosition (in)
Rear 1. 15.8 2. N/A 3. N/A 4. N/A
Step Elevation Change - Kneeling(in)
2.0 (Rear)
ENGINE
_ C.I. _ Alternate FuelType
_ S.I. _ Other (explain)
Mfr. / Model No. International Truck and Engine Corp. / A325
Location _ Front _ Rear _ Other (explain)
_ Gasoline _ CNG _ MethanolFuel Type
_ Diesel _ LNG _ Other (explain)
Fuel Tank Capacity (indicate units) 35 gals.
Fuel Induction Type _ Injected _ Carburetion
Fuel Injector Mfr. / Model No. International Truck and Engine Corp. / A325
Carburetor Mfr. / Model No. N/A
Fuel Pump Mfr. / Model No. International Truck and Engine Corp. / A325
Alternator (Generator) Mfr. / ModelNo.
Motorcraft / OEMAmerican Armature / NA
Maximum Rated Output (Volts / Amps)
12 / 130 (Motorcraft)12 / 200 (Ameriacan)
Air Compressor Mfr. / Model No. Thomas Compressors / BA3616-4208-7
Maximum Capacity (ft3 / min) N/A
Starter Type _ Electrical _ Pneumatic _ Other (explain)
Starter Mfr. / Model No. Visteon / 4M23B

10
Bus Number: 0706 Date: 5-23-07
TRANSMISSION
Transmission Type _ Manual _ Automatic
Mfr. / Model No. Ford Motor Co. / 5-Speed Torqshift
Control Type _ Mechanical _ Electrical _ Other
Torque Converter Mfr. / Model No. Ford Motor Co. / 5-Speed Torqshift
Integral Retarder Mfr. / Model No. N/A
SUSPENSION
Number of Axles 2
Front Axle Type _ Independent _ Beam Axle
Mfr. / Model No. Dana Corp. / 60
Axle Ratio (if driven) 4.88
Suspension Type _ Air _ Spring _ Other
No. of Shock Absorbers 2
Mfr. / Model No. Motorcraft / 5634-18045-HE
Middle Axle Type _ Independent _ Beam Axle
Mfr. / Model No. N/A
Axle Ratio (if driven) N/A
Suspension Type _ Air _ Spring _ Other
No. of Shock Absorbers N/A
Mfr. / Model No. N/A
Rear Axle Type _ Independent _ Beam Axle
Mfr. / Model No. Dallas Smith Corporation / D810015 & 16
Axle Ratio (if driven) N/A
Suspension Type _ Air _ Spring _ Other
No. of Shock Absorbers 2
Mfr. / Model No. Motorcraft / 5C34-18080

11
Bus Number: 0706 Date: 5-23-07
WHEELS & TIRES
Wheel Mfr./ Model No. Accuride / 19.5 x 6.00Front
Tire Mfr./ Model No. General LMT 400 / 22.5 / 70R 19.5
Wheel Mfr./ Model No. Accuride / 19.5 x 7.5Rear
Tire Mfr./ Model No. Michelin XTA2 / 265 / 70R 19.5
BRAKES
Front Axle Brakes Type _ Cam _ Disc _ Other (explain)
Mfr. / Model No. TRW / 6C34-2B120-BA & 6C34-B121-BA
Middle Axle Brakes Type _ Cam _ Disc _ Other (explain)
Mfr. / Model No. N/A
Rear Axle Brakes Type _ Cam _ Disc _ Other (explain)
Mfr. / Model No. TRW / 6C34-2B120-BA & 6C34-B121-BA
Retarder Type N/A
Mfr. / Model No. N/A
HVAC
Heating System Type _ Air _ Water _ Other
Capacity (Btu/hr) 65,000
Mfr. / Model No.Ford Motor Co. / O.E.M.Rear- ACC Climate Control / 20077A000A
Air Conditioner _ Yes _ No
Location Front – dash Rear – roof
Capacity (Btu/hr) Front - NA Rear – 87,000
A/C Compressor Mfr. / Model No. International Components Engineering / 2521467
International Components Engineering / TM - 16
STEERING
Steering Gear Box Type Hydraulic gear
Mfr. / Model No. Ford / XR-50
Steering Wheel Diameter 15.5
Number of turns (lock to lock) 4.0

12
Bus Number: 0706 Date: 5-23-07
OTHERS
Wheel Chair Ramps Location: Front right & Rear center
Type: Bi Fold Ramp Bi Fold Ramp
Wheel Chair Lifts Location: N/A Type: N/A
Mfr. / Model No. Ricon Corp / Bi Fold / BR2SS00 (Both)
Emergency Exit Location: Window
Hatch
Door
Number: 2
1
2
CAPACITIES
Fuel Tank Capacity (units) 35 gals
Engine Crankcase Capacity (quarts) 15.0
Transmission Capacity (quarts) 17.5
Differential Capacity (pints) 6.3
Cooling System Capacity (quarts) 27.5
Power Steering Fluid Capacity(gallons)
NA

13
VEHICLE DATA FORM
Bus Number: 0706 Date: 5-11-07
List all spare parts, tools and manuals delivered with the bus.
Part Number Description Qty.
1R8-026 Front air spring 1
6800 Rear air spring 1
5C34-18045 Front shock absorber 2
5C34 - 18080 Rear shock absorber 2

14
COMPONENT/SUBSYSTEM INSPECTION FORM
Bus Number: 0706 Date: 5-23-07
Subsystem Checked Comments
Air Conditioning Heatingand Ventilation
Body and Sheet Metal
Frame
Steering
Suspension
Interior/Seating
Axles
Front wheel drive.
Brakes
Tires/Wheels
Exhaust
Fuel System
Power Plant
Accessories
Lift System
Interior Fasteners
Batteries

15
CHECK - IN
DALLAS SMITH CORP.MODEL LOW FLOOR FRIENDLY BUS

16
CHECK - IN CONT.
DALLAS SMITH CORP.MODEL LOW FLOOR FRIENDLY BUS
EQUIPPED WITH A RICON MODEL BR 2SSOOHANDICAP RAMPS

17
1. MAINTAINABILITY
1.1 ACCESSIBILITY OF COMPONENTS AND SUBSYSTEMS
1.1-I. TEST OBJECTIVE
The objective of this test is to check the accessibility of components andsubsystems.
1.1-II. TEST DESCRIPTION
Accessibility of components and subsystems is checked, and where accessibilityis restricted the subsystem is noted along with the reason for the restriction.
1.1-III. DISCUSSION
Accessibility, in general, was adequate. Components covered in Section 1.3(repair and/or replacement of selected subsystems), along with all other componentsencountered during testing, were found to be readily accessible and no restrictions werenoted. Note: the upper alternator (add-on) must be removed to gain access to the lower(OEM) alternator.

18
ACCESSIBILITY DATA FORM
Bus Number: 0706 Date: 9-5-07
Component Checked Comments
ENGINE :
Oil Dipstick
Oil Filler Hole
Oil Drain Plug
Oil Filter
Fuel Filter
Air Filter
Belts
Coolant Level
Coolant Filler Hole
Coolant Drain
Spark / Glow Plugs N/A
Alternator
Two alternators – upper isvery accessible, the upperalternator must be removedto gain access to the lower.
Diagnostic Interface Connector
TRANSMISSION :
Fluid Dip-Stick
Filler Hole
Drain Plug
SUSPENSION :
Bushings
Shock Absorbers
Air Springs
Leveling Valves
Grease Fittings

19
ACCESSIBILITY DATA FORM
Bus Number: 0706 Date: 9-5-07
Component Checked Comments
HVAC :
A/C Compressor
Filters
Fans
ELECTRICAL SYSTEM :
Fuses
Batteries
Voltage regulator
Voltage Converters
Lighting
MISCELLANEOUS :
Brakes
Handicap Lifts/Ramps
Instruments
Axles
Exhaust
Fuel System
OTHERS :

20
1.2 SERVICING, PREVENTIVE MAINTENANCE, ANDREPAIR AND MAINTENANCE DURING TESTING
1.2-I. TEST OBJECTIVE
The objective of this test is to collect maintenance data about the servicing,preventive maintenance, and repair.
1.2.-II. TEST DESCRIPTION
The test will be conducted by operating the NBM and collecting the following dataon work order forms and a driver log.
1. Unscheduled Maintenancea. Bus numberb. Datec. Mileaged. Description of malfunctione. Location of malfunction (e.g., in service or undergoing inspection)f. Repair action and parts usedg. Man-hours required
2. Scheduled Maintenancea. Bus numberb. Datec. Mileaged. Engine running time (if available)e. Results of scheduled inspectionsf. Description of malfunction (if any)g. Repair action and parts used (if any)h. Man-hours required
The buses will be operated in accelerated durability service. While typical itemsare given below, the specific service schedule will be that specified by the manufacturer.
A. Service1. Fueling2. Consumable checks3. Interior cleaning
B. Preventive Maintenance4. Brake adjustments5. Lubrication6. 3,000 mi (or equivalent) inspection

21
7. Oil and filter change inspection8. Major inspection9. Tune-up
C. Periodic Repairs1. Brake reline2. Transmission change3. Engine change4. Windshield wiper motor change5. Stoplight bulb change6. Towing operations7. Hoisting operations
1.2-III. DISCUSSION
Servicing and preventive maintenance were performed at manufacturer-specifiedintervals. The following Scheduled Maintenance Form lists the mileage, items serviced,the service interval, and amount of time required to perform the maintenance. Table 1is a list of the lubricating products used in servicing. Finally, the UnscheduledMaintenance List along with Unscheduled Maintenance-related photographs is includedin Section 5.7, Structural Durability. This list supplies information related to failures thatoccurred during the durability portion of testing. The Unscheduled Maintenance Listincludes the date and mileage at which the malfunction occurred, a description of themalfunction and repair, and the time required to perform the repair.

22

23

24
Table 1. STANDARD LUBRICANTS
The following is a list of Texaco lubricant products used in bus testing conducted by thePenn State University Altoona Bus Testing Center:
ITEM PRODUCT CODE TEXACO DESCRIPTION
Engine oil #2112 URSA Super Plus SAE 30
Transmission oil #1866 Automatic Trans FluidMercon/Dexron IIMultipurpose
Gear oil #2316 Multigear LubricantEP SAE 80W90
Wheel bearing & #1935 Starplex IIChassis grease

25
1.3 REPLACEMENT AND/OR REPAIR OFSELECTED SUBSYSTEMS
1.3-I. TEST OBJECTIVE
The objective of this test is to establish the time required to replace and/or repairselected subsystems.
1.3-II. TEST DESCRIPTION
The test will involve components that may be expected to fail or requirereplacement during the service life of the bus. In addition, any component that failsduring the NBM testing is added to this list. Components to be included are:
1. Transmission2. Alternator3. Starter4. Batteries5. Windshield wiper motor
1.3-III. DISCUSSION
During the test, several additional components were removed for repair orreplacement. Following is a list of components and total repair/replacement time.
MAN HOURS
Both suspension travel limit cables 1.00
All tires. 2.00
At the end of the test, the remaining items on the list were removed and replaced.The transmission assembly took 8.5 man-hours (two men 4.25 hrs) to remove andreplace. The time required for repair/replacement of the four remaining components isgiven on the following Repair and/or Replacement Form.

26
REPLACEMENT AND/OR REPAIR FORM
Subsystem Replacement Time
Transmission 8.50 man hours
Wiper Motor 0.50 man hours
Starter 0.25 man hours
Alternator 1.00 man hours
Batteries 0.25 man hours

27
1.3 REPLACEMENT AND/OR REPAIR OFSELECTED SUBSYSTEMS
TRANSMISSION REMOVAL AND REPLACEMENT(8.50 MAN HOURS)
WIPER MOTOR REMOVAL AND REPLACEMENT(0.50 MAN HOURS)

28
1.3 REPLACEMENT AND/OR REPAIR OFSELECTED SUBSYSTEMS CONT.
STARTER REMOVAL AND REPLACEMENT(0.25 MAN HOURS)
ALTERNATOR REMOVAL AND REPLACEMENT(1.00 MAN HOURS)

29
2. RELIABILITY - DOCUMENTATION OF BREAKDOWN AND REPAIR TIMES DURING TESTING
2-I. TEST OBJECTIVE
The objective of this test is to document unscheduled breakdowns, repairs, downtime, and repair time that occur during testing.
2-II. TEST DESCRIPTION
Using the driver log and unscheduled work order forms, all significantbreakdowns, repairs, man-hours to repair, and hours out of service are recorded on theReliability Data Form.
CLASS OF FAILURES
Classes of failures are described below:
(a) Class 1: Physical Safety. A failure that could lead directly to passenger or driver injury and represents a severe crash situation.
(b) Class 2: Road Call. A failure resulting in an en route interruption of revenue service. Service is discontinued until the bus is replaced or repaired at the point of failure.
(c) Class 3: Bus Change. A failure that requires removal of the bus from service during its assignments. The bus is operable to a rendezvous point with a replacement bus.
(d) Class 4: Bad Order. A failure that does not require removal of the bus from service during its assignments but does degrade coach operation. The failure shall be reported by driver, inspector, or hostler.
2-III. DISCUSSION
A listing of breakdowns and unscheduled repairs is accumulated during theStructural Durability Test. The following Reliability Data Form lists all unscheduledrepairs under classes as defined above. These classifications are somewhat subjectiveas the test is performed on a test track with careful inspections every two hours.However, even on the road, there is considerable latitude on deciding how to handlemany failures.
The Unscheduled Repair List is also attached to provide a reference for therepairs that are included in the Reliability Data Forms.

30
The classification of repairs according to subsystem is intended to emphasizethose systems which had persistent minor or more serious problems. There were noClass 1 or 2 failures. Of the six Class 3 failures, four involved the suspension systemand one with a tire and the electrical system. These, and the one remaining Class 4failure are available for review in the Unscheduled Maintenance List, located in Section5.7 Structural Durability.

31

32
3. SAFETY - A DOUBLE-LANE CHANGE(OBSTACLE AVOIDANCE)
3-I. TEST OBJECTIVE
The objective of this test is to determine handling and stability of the bus bymeasuring speed through a double lane change test.
3-II. TEST DESCRIPTION
The Safety Test is a vehicle handling and stability test. The bus will be operatedat SLW on a smooth and level test track. The bus will be driven through a double lanechange course at increasing speed until the test is considered unsafe or a speed of 45mph is reached. The lane change course will be set up using pylons to mark off two 12foot center to center lanes with two 100 foot lane change areas 100 feet apart. The buswill begin in one lane, change to the other lane in a 100 foot span, travel 100 feet, andreturn to the original lane in another 100 foot span. This procedure will be repeated,starting first in the right-hand and then in the left-hand lane.
3-III. DISCUSSION
The double-lane change was performed in both right-hand and left-handdirections. The bus was able to safely negotiate the test course in both the right-handand left-hand directions up to the maximum test speed of 45 mph.

33
SAFETY DATA FORM
Bus Number: 0706 Date: 8-29-07
Personnel: B.S., T.S. & S.C.
Temperature (°F): 68 Humidity (%): 100
Wind Direction: Calm Wind Speed (mph): Calm
Barometric Pressure (in.Hg): 30.15
SAFETY TEST: DOUBLE LANE CHANGE
Maximum safe speed tested for double-lane change to left 45 mph
Maximum safe speed tested for double-lane change to right 45 mph
Comments of the position of the bus during the lane change: A safe profile was
maintained through all portions of testing.
Comments of the tire/ground contact patch: Tire/ground contact was maintained
through all portions of testing.

34
3. SAFETY
RIGHT - HAND APPROACH
LEFT - HAND APPROACH

35
4. PERFORMANCE - AN ACCELERATION, GRADEABILITY,AND TOP SPEED TEST
4-I. TEST OBJECTIVE
The objective of this test is to determine the acceleration, gradeability, and topspeed capabilities of the bus.
4-II. TEST DESCRIPTION
In this test, the bus will be operated at SLW on the skid pad at the PSBRTF. Thebus will be accelerated at full throttle from a standstill to a maximum "geared" or "safe"speed as determined by the test driver. The vehicle speed is measured using a Correvitnon-contacting speed sensor. The times to reach speed between ten mile per hourincrements are measured and recorded using a stopwatch with a lap timer. The time tospeed data will be recorded on the Performance Data Form and later used to generatea speed vs. time plot and gradeability calculations.
4-III. DISCUSSION
This test consists of three runs in both the clockwise and counterclockwisedirections on the Test Track. Velocity versus time data is obtained for each run andresults are averaged together to minimize any test variability which might be introducedby wind or other external factors. The test was performed up to a maximum speed of50 mph. The fitted curve of velocity vs. time is attached, followed by the calculatedgradeability results. The average time to obtain 50 mph was 20.95 seconds.

36
PERFORMANCE DATA FORM
Bus Number: 0706 Date: 8-29-07
Personnel: B.S., S.C. & T.S.
Temperature (°F): 68 Humidity (%): 100
Wind Direction: Calm Wind Speed (mph): Calm
Barometric Pressure (in.Hg): 30.15
Air Conditioning compressor-OFF Checked
Ventilation fans-ON HIGH Checked
Heater pump motor-Off Checked
Defroster-OFF Checked
Exterior and interior lights-ON Checked
Windows and doors-CLOSED Checked
ACCELERATION, GRADEABILITY, TOP SPEED
Counter Clockwise Recorded Interval Times
Speed Run 1 Run 2 Run 3
10 mph 2.85 3.20 3.17
20 mph 5.66 5.54 5.29
30 mph 9.16 9.08 9.11
40 mph 13.91 14.45 14.29
Top TestSpeed(mph) 50
21.85 21.73 21.39
Clockwise Recorded Interval Times
Speed Run 1 Run 2 Run 3
10 mph 3.20 3.01 3.26
20 mph 5.73 5.57 5.82
30 mph 9.11 8.88 8.89
40 mph 13.82 13.85 13.61
Top TestSpeed(mph) 50
20.39 20.29 20.07

37

38

39
5. STRUCTURAL INTEGRITY
5.1 STRUCTURAL STRENGTH AND DISTORTION TESTS -STRUCTURAL SHAKEDOWN TEST
5.1-I. DISCUSSION
The objective of this test is to determine certain static characteristics (e.g., busfloor deflection, permanent structural deformation, etc.) under static loading conditions.
5.1-II. TEST DESCRIPTION
In this test, the bus will be isolated from the suspension by blocking the vehicleunder the suspension points. The bus will then be loaded and unloaded up to amaximum of three times with a distributed load equal to 2.5 times gross load. Grossload is 150 lb for every designed passenger seating position, for the driver, and for each1.5 sq ft of free floor space. For a distributed load equal to 2.5 times gross load, place a375-lb load on each seat and on every 1.5 sq ft of free floor space. The first loadingand unloading sequence will "settle" the structure. Bus deflection will be measured atseveral locations during the loading sequences.
5.1-III. DISCUSSION
This test was performed based on a maximum passenger capacity of 30 peopleincluding the driver. The resulting test load is (30 x 375 lb) = 11,250 lb. The load isdistributed evenly over the passenger space. Deflection data before and after eachloading and unloading sequence is provided on the Structural Shakedown Data Form.
The unloaded height after each test becomes the original height for the next test.Some initial settling is expected due to undercoat compression, etc. After each loadingcycle, the deflection of each reference point is determined. The bus is then unloadedand the residual (permanent) deflection is recorded. On the final test, the maximumloaded deflection was -0.240 inches at reference point 12. The maximum permanentdeflection after the final loading sequence ranged from -0.005 inches at reference point1 to 0.004 inches at reference point 12.

40

41

42
5.1 STRUCTURAL SHAKEDOWN TEST
DIAL INDICATORS IN POSITION
BUS LOADED TO 2.5 TIMES GVL(11,250 LBS)

43
5.2 STRUCTURAL STRENGTH AND DISTORTIONTESTS - STRUCTURAL DISTORTION
5.2-I. TEST OBJECTIVE
The objective of this test is to observe the operation of the bus subsystems whenthe bus is placed in a longitudinal twist simulating operation over a curb or through apothole.
5.2-II. TEST DESCRIPTION
With the bus loaded to GVWR, each wheel of the bus will be raised (one at atime) to simulate operation over a curb and the following will be inspected:
1. Body2. Windows3. Doors4. Roof vents5. Special seating6. Undercarriage7. Engine8. Service doors9. Escape hatches
10. Steering mechanism
Each wheel will then be lowered (one at a time) to simulate operation through a potholeand the same items inspected.
5.2-III. DISCUSSION
The test sequence was repeated ten times. The first and last test is with allwheels level. The other eight tests are with each wheel 6 inches higher and 6 incheslower than the other three wheels.
All doors, windows, escape mechanisms, engine, steering and handicappeddevices operated normally throughout the test. In two positions of the test, with thekneeling activated the handicap ramp did not contact the ground when deployed. Theundercarriage and body indicated no deficiencies. No water leakage was observedduring the test. The results of this test are indicated on the following data forms.

44
DISTORTION TEST INSPECTION FORM(Note: Ten copies of this data sheet are required)
Bus Number: 0706 Date: 6-5-07
Personnel: T.S., E.D. & S.C. Temperature(°F): 70
Wheel Position : (check one)
All wheels level _ before _ after
Left front _ 6 in higher _ 6 in lower
Right front _ 6 in higher _ 6 in lower
Right rear _ 6 in higher _ 6 in lower
Left rear _ 6 in higher _ 6 in lower
Right center _ 6 in higher _ 6 in lower
Left center _ 6 in higher _ 6 in lower
Comments
_ Windows No deficiencies.
_ Front Doors No deficiencies.
_ Rear Doors No deficiencies.
_ Escape Mechanisms/ Roof Vents No deficiencies.
_ Engine No deficiencies.
_ Handicapped Device/ SpecialSeating
No deficiencies.
_ Undercarriage No deficiencies.
_ Service Doors No deficiencies.
_ Body No deficiencies.
_ Windows/ Body Leakage No deficiencies.
_ Steering Mechanism No deficiencies.

45
DISTORTION TEST INSPECTION FORM(Note: Ten copies of this data sheet are required)
Bus Number: 0706 Date: 6-5-07
Personnel: T.S., E.D. & S.C. Temperature(°F): 70
Wheel Position : (check one)
All wheels level _ before _ after
Left front _ 6 in higher _ 6 in lower
Right front _ 6 in higher _ 6 in lower
Right rear _ 6 in higher _ 6 in lower
Left rear _ 6 in higher _ 6 in lower
Right center _ 6 in higher _ 6 in lower
Left center _ 6 in higher _ 6 in lower
Comments
_ Windows No deficiencies.
_ Front Doors No deficiencies.
_ Rear Doors No deficiencies.
_ Escape Mechanisms/ Roof Vents No deficiencies.
_ Engine No deficiencies.
_ Handicapped Device/ SpecialSeating
No deficiencies.
_ Undercarriage No deficiencies.
_ Service Doors No deficiencies.
_ Body No deficiencies.
_ Windows/ Body Leakage No deficiencies.
_ Steering Mechanism No deficiencies.

46
DISTORTION TEST INSPECTION FORM(Note: Ten copies of this data sheet are required)
Bus Number: 0706 Date: 6-5-07
Personnel: T.S., E.D. & S.C. Temperature(°F): 70
Wheel Position : (check one)
All wheels level _ before _ after
Left front _ 6 in higher _ 6 in lower
Right front _ 6 in higher _ 6 in lower
Right rear _ 6 in higher _ 6 in lower
Left rear _ 6 in higher _ 6 in lower
Right center _ 6 in higher _ 6 in lower
Left center _ 6 in higher _ 6 in lower
Comments
_ Windows No deficiencies.
_ Front Doors No deficiencies.
_ Rear Doors No deficiencies.
_ Escape Mechanisms/ Roof Vents No deficiencies.
_ Engine No deficiencies.
_ Handicapped Device/ SpecialSeating
No deficiencies.
_ Undercarriage No deficiencies.
_ Service Doors No deficiencies.
_ Body No deficiencies.
_ Windows/ Body Leakage No deficiencies.
_ Steering Mechanism No deficiencies.

47
DISTORTION TEST INSPECTION FORM(Note: Ten copies of this data sheet are required)
Bus Number: 0706 Date: 6-5-07
Personnel: T.S., E.D. & S.C. Temperature(°F): 70
Wheel Position : (check one)
All wheels level _ before _ after
Left front _ 6 in higher _ 6 in lower
Right front _ 6 in higher _ 6 in lower
Right rear _ 6 in higher _ 6 in lower
Left rear _ 6 in higher _ 6 in lower
Right center _ 6 in higher _ 6 in lower
Left center _ 6 in higher _ 6 in lower
Comments
_ Windows No deficiencies.
_ Front Doors No deficiencies.
_ Rear Doors No deficiencies.
_ Escape Mechanisms/ Roof Vents No deficiencies.
_ Engine No deficiencies.
_ Handicapped Device/ SpecialSeating
Handicap ramp will not contact ground.
_ Undercarriage No deficiencies.
_ Service Doors No deficiencies.
_ Body No deficiencies.
_ Windows/ Body Leakage No deficiencies.
_ Steering Mechanism No deficiencies.

48
DISTORTION TEST INSPECTION FORM(Note: Ten copies of this data sheet are required)
Bus Number: 0706 Date: 6-5-07
Personnel: T.S., E.D. & S.C. Temperature(°F): 70
Wheel Position : (check one)
All wheels level _ before _ after
Left front _ 6 in higher _ 6 in lower
Right front _ 6 in higher _ 6 in lower
Right rear _ 6 in higher _ 6 in lower
Left rear _ 6 in higher _ 6 in lower
Right center _ 6 in higher _ 6 in lower
Left center _ 6 in higher _ 6 in lower
Comments
_ Windows No deficiencies.
_ Front Doors No deficiencies.
_ Rear Doors No deficiencies.
_ Escape Mechanisms/ Roof Vents No deficiencies.
_ Engine No deficiencies.
_ Handicapped Device/ SpecialSeating
Handicap ramp will not contact ground.
_ Undercarriage No deficiencies.
_ Service Doors No deficiencies.
_ Body No deficiencies.
_ Windows/ Body Leakage No deficiencies.
_ Steering Mechanism No deficiencies.

49
DISTORTION TEST INSPECTION FORM(Note: Ten copies of this data sheet are required)
Bus Number: 0706 Date: 6-5-07
Personnel: T.S., E.D. & S.C. Temperature(°F): 70
Wheel Position : (check one)
All wheels level _ before _ after
Left front _ 6 in higher _ 6 in lower
Right front _ 6 in higher _ 6 in lower
Right rear _ 6 in higher _ 6 in lower
Left rear _ 6 in higher _ 6 in lower
Right center _ 6 in higher _ 6 in lower
Left center _ 6 in higher _ 6 in lower
Comments
_ Windows No deficiencies.
_ Front Doors No deficiencies.
_ Rear Doors No deficiencies.
_ Escape Mechanisms/ Roof Vents No deficiencies.
_ Engine No deficiencies.
_ Handicapped Device/ SpecialSeating
No deficiencies.
_ Undercarriage No deficiencies.
_ Service Doors No deficiencies.
_ Body No deficiencies.
_ Windows/ Body Leakage No deficiencies.
_ Steering Mechanism No deficiencies.

50
DISTORTION TEST INSPECTION FORM(Note: Ten copies of this data sheet are required)
Bus Number: 0706 Date: 6-5-07
Personnel: T.S., E.D. & S.C. Temperature(°F): 70
Wheel Position : (check one)
All wheels level _ before _ after
Left front _ 6 in higher _ 6 in lower
Right front _ 6 in higher _ 6 in lower
Right rear _ 6 in higher _ 6 in lower
Left rear _ 6 in higher _ 6 in lower
Right center _ 6 in higher _ 6 in lower
Left center _ 6 in higher _ 6 in lower
Comments
_ Windows No deficiencies.
_ Front Doors No deficiencies.
_ Rear Doors No deficiencies.
_ Escape Mechanisms/ Roof Vents No deficiencies.
_ Engine No deficiencies.
_ Handicapped Device/ SpecialSeating
No deficiencies.
_ Undercarriage No deficiencies.
_ Service Doors No deficiencies.
_ Body No deficiencies.
_ Windows/ Body Leakage No deficiencies.
_ Steering Mechanism No deficiencies.

51
DISTORTION TEST INSPECTION FORM(Note: Ten copies of this data sheet are required)
Bus Number: 0706 Date: 6-5-07
Personnel: T.S., E.D. & S.C. Temperature(°F): 70
Wheel Position : (check one)
All wheels level _ before _ after
Left front _ 6 in higher _ 6 in lower
Right front _ 6 in higher _6 in lower
Right rear _ 6 in higher _ 6 in lower
Left rear _ 6 in higher _ 6 in lower
Right center _ 6 in higher _ 6 in lower
Left center _ 6 in higher _ 6 in lower
Comments
_ Windows No deficiencies.
_ Front Doors No deficiencies.
_ Rear Doors No deficiencies.
_ Escape Mechanisms/ Roof Vents No deficiencies.
_ Engine No deficiencies.
_ Handicapped Device/ SpecialSeating
No deficiencies.
_ Undercarriage No deficiencies.
_ Service Doors No deficiencies.
_ Body No deficiencies.
_ Windows/ Body Leakage No deficiencies.
_ Steering Mechanism No deficiencies.

52
DISTORTION TEST INSPECTION FORM(Note: Ten copies of this data sheet are required)
Bus Number: 0706 Date: 6-5-07
Personnel: T.S., E.D. & S.C. Temperature(°F): 70
Wheel Position : (check one)
All wheels level _ before _ after
Left front _ 6 in higher _ 6 in lower
Right front _ 6 in higher _ 6 in lower
Right rear _ 6 in higher _ 6 in lower
Left rear _ 6 in higher _ 6 in lower
Right center _ 6 in higher _ 6 in lower
Left center _ 6 in higher _ 6 in lower
Comments
_ Windows No deficiencies.
_ Front Doors No deficiencies.
_ Rear Doors No deficiencies.
_ Escape Mechanisms/ Roof Vents No deficiencies.
_ Engine No deficiencies.
_ Handicapped Device/ SpecialSeating
No deficiencies.
_ Undercarriage No deficiencies.
_ Service Doors No deficiencies.
_ Body No deficiencies.
_ Windows/ Body Leakage No deficiencies.
_ Steering Mechanism No deficiencies.

53
DISTORTION TEST INSPECTION FORM(Note: Ten copies of this data sheet are required)
Bus Number: 0706 Date: 6-5-07
Personnel: T.S., E.D. & S.C. Temperature(°F): 70
Wheel Position : (check one)
All wheels level _ before _ after
Left front _ 6 in higher _ 6 in lower
Right front _ 6 in higher _ 6 in lower
Right rear _ 6 in higher _ 6 in lower
Left rear _ 6 in higher _ 6 in lower
Right center _ 6 in higher _ 6 in lower
Left center _ 6 in higher _ 6 in lower
Comments
_ Windows No deficiencies.
_ Front Doors No deficiencies.
_ Rear Doors No deficiencies.
_ Escape Mechanisms/ Roof Vents No deficiencies.
_ Engine No deficiencies.
_ Handicapped Device/ SpecialSeating
No deficiencies.
_ Undercarriage No deficiencies
_ Service Doors No deficiencies.
_ Body No deficiencies.
_ Windows/ Body Leakage No deficiencies.
_ Steering Mechanism No deficiencies.

54
5.2 STRUCTURAL DISTORTION TEST
RIGHT FRONT WHEEL SIX INCHES HIGHER
LEFT REAR WHEEL SIX INCHES HIGHER

55
5.3 STRUCTURAL STRENGTH AND DISTORTIONTESTS - STATIC TOWING TEST
5.3-I. TEST OBJECTIVE
The objective of this test is to determine the characteristics of the bus towingmechanisms under static loading conditions.
5.3-II. TEST DESCRIPTION
Utilizing a load-distributing yoke, a hydraulic cylinder is used to apply a statictension load equal to 1.2 times the bus curb weight. The load will be applied to both thefront and rear, if applicable, towing fixtures at an angle of 20 degrees with thelongitudinal axis of the bus, first to one side then the other in the horizontal plane, andthen upward and downward in the vertical plane. Any permanent deformation ordamage to the tow eyes or adjoining structure will be recorded.
5.3-III. DISCUSSION
The load-distributing yoke was incorporated as the interface between the StaticTow apparatus and the test bus tow hook/eyes. The front test was performed to the fulltarget test weight of 14,784 lbs (1.2 x 12,320 lbs CW). No damage or deformation wasobserved during all four pulls of the test. The test bus was not equipped with rear toweyes or tow hooks, therefore, a rear test was not performed.

56
STATIC TOWING TEST DATA FORM
Bus Number: 0706 Date: 8-29-07
Personnel: S.C. Temperature (°F): 78
Inspect right front tow eye and adjoining structure.
Comments: No damage or deformation.
Check the torque of all bolts attaching tow eye and surrounding structure.
Comments: Torques verified.
Inspect left tow eye and adjoining structure.
Comments: No damage or deformation.
Check the torque of all bolts attaching tow eye and surrounding structure.
Comments: Torques verified.
Inspect right rear tow eye and adjoining structure.
Comments: N/A
Check the torque of all bolts attaching tow eye and surrounding structure.
Comments: N/A
Inspect left rear tow eye and adjoining structure.
Comments: N/A
Check the torque of all bolts attaching tow eye and surrounding structure.
Comments: N/A
General comments of any other structure deformation or failure: All four front
pulls were completed to the full target test load of 14,784 lbs. (1.2 x 12,320 lbs CW).
No damage or deformation was observed. The test bus was not equipped with rear
tow eyes or tow hooks, therefore, a rear test was not performed.

57
5.3 STATIC TOWING TEST
FRONT 20° UPWARD PULL
FRONT 20°DOWN PULL

58
5.3 STATIC TOWING TEST CONT.
FRONT 20° LEFT PULL
FRONT 20° RIGHT PULL

59
5.4 STRUCTURAL STRENGTH AND DISTORTION TESTS -DYNAMIC TOWING TEST
5.4-I. TEST OBJECTIVE
The objective of this test is to verify the integrity of the towing fixtures anddetermine the feasibility of towing the bus under manufacturer specified procedures.
5.4-II. TEST DESCRIPTION
This test requires the bus be towed at curb weight using the specified equipmentand instructions provided by the manufacturer and a heavy-duty wrecker. The bus willbe towed for 5 miles at a speed of 20 mph for each recommended towing configuration.After releasing the bus from the wrecker, the bus will be visually inspected for anystructural damage or permanent deformation. All doors, windows and passengerescape mechanisms will be inspected for proper operation.
5.4-III. DISCUSSION
The bus was towed using a heavy-duty wrecker. The towing interface wasaccomplished by incorporating a hydraulic under lift. A front lift tow was performed.Rear towing is not recommended. No problems, deformation, or damage was notedduring testing.

60
DYNAMIC TOWING TEST DATA FORM
Bus Number: 0706 Date: 8-30-07
Personnel: S.C.
Temperature (°F): 78 Humidity (%): 74
Wind Direction: S.E. Wind Speed (mph): 5
Barometric Pressure (in.Hg): 30.12
Inspect tow equipment-bus interface.
Comments: A safe and adequate connection was made between the tow equipment
and the bus.
Inspect tow equipment-wrecker interface.
Comments: A safe and adequate connection was made between the tow equipment
and the wrecker.
Towing Comments: A front lift tow was performed incorporating a hydraulic under
lift wrecker.
Description and location of any structural damage: No damage or deformation
was observed.
General Comments: No problems with the towing interface or tow were
encountered during testing.

61
5.4 DYNAMIC TOWING TEST
TOWING INTERFACE
TEST BUS IN TOW

62
5.5 STRUCTURAL STRENGTH AND DISTORTIONTESTS – JACKING TEST
5.5-I. TEST OBJECTIVE
The objective of this test is to inspect for damage due to the deflated tire, anddetermine the feasibility of jacking the bus with a portable hydraulic jack to a heightsufficient to replace a deflated tire.
5.5-II. TEST DESCRIPTION
With the bus at curb weight, the tire(s) at one corner of the bus are replaced withdeflated tire(s) of the appropriate type. A portable hydraulic floor jack is then positionedin a manner and location specified by the manufacturer and used to raise the bus to aheight sufficient to provide 3-in clearance between the floor and an inflated tire. Thedeflated tire(s) are replaced with the original tire(s) and the hack is lowered. Anystructural damage or permanent deformation is recorded on the test data sheet. Thisprocedure is repeated for each corner of the bus.
5.5-III. DISCUSSION
The jack used for this test has a minimum height of 8.75 inches. During thedeflated portion of the test, the jacking point clearances ranged from 22.5 inches to 3.5inches. No deformation or damage was observed during testing. A complete listing ofjacking point clearances is provided in the Jacking Test Data Form.
JACKING CLEARANCE SUMMARY
Condition Frame Point Clearance
Front axle – one tire flat 22.5”
Rear axle – one tire flat 4.6”
Rear axle – two tires flat NA

63
JACKING TEST DATA FORM
Bus Number: 0706 Date: 5-21-07
Personnel: T.S. & E.L. Temperature (°F): 70
Record any permanent deformation or damage to bus as well as any difficultyencountered during jacking procedure.
DeflatedTire
Jacking PadClearance
Body/Frame(in)
Jacking PadClearance
Axle/Suspension(in)
Comments
Right front 24.0 “ I 22.5 “ D
13.0 “ I 10.9 “ D
Left front 24.0 “ I 22.5 “ D
13.0 “ I 10.9 “ D
Right rear 7.0 “ I 4.6 “ D
6.2 “ I 3.5 “ D
Right rear—both NA NA
Left rear—outside 7.0 “ I 4.6 “ D
6.2 “ I 3.5 “ D
Left rear---both NA NA
Right middle ortag—outside
NA NA
Right middle ortag—both
NA NA
Left middle ortag—outside
NA NA
Left middle ortag—both
NA NA
Additional comments of any deformation or difficulty during jacking:
None noted.

64
5.6 STRUCTURAL STRENGTH AND DISTORTIONTESTS - HOISTING TEST
5.6-I. TEST OBJECTIVE
The objective of this test is to determine possible damage or deformation causedby the jack/stands.
5.6-II. TEST DESCRIPTION
With the bus at curb weight, the front end of the bus is raised to a height sufficientto allow manufacturer-specified placement of jack stands under the axles or jackingpads independent of the hoist system. The bus will be checked for stability on the jackstands and for any damage to the jacking pads or bulkheads. The procedure isrepeated for the rear end of the bus. The procedure is then repeated for the front andrear simultaneously.
5.6-III. DISCUSSION
The test was conducted using four posts of a six-post electric lift and standard 19inch jack stands. The bus was hoisted from the front wheel, rear wheel, and then thefront and rear wheels simultaneously and placed on jack stands.
The bus easily accommodated the placement of the vehicle lifts and jack standsand the procedure was performed without any instability noted.

65
HOISTING TEST DATA FORM
Bus Number: 0706 Date: 5-21-07
Personnel: T.S. & E.L. Temperature (°F): 70
Comments of any structural damage to the jacking pads or axles while boththe front wheels are supported by the jack stands:
None noted.
Comments of any structural damage to the jacking pads or axles while boththe rear wheels are supported by the jack stands:
None noted.
Comments of any structural damage to the jacking pads or axles while boththe front and rear wheels are supported by the jack stands:
None noted.

66
5.7 STRUCTURAL DURABILITY TEST
5.7-I. TEST OBJECTIVE
The objective of this test is to perform an accelerated durability test thatapproximates up to 25 percent of the service life of the vehicle.
5.7-II. TEST DESCRIPTION
The test vehicle is driven a total of 7,500 miles; approximately 5,000 miles on thePSBRTF Durability Test Track and approximately 2,500 miscellaneous other miles. Thetest will be conducted with the bus operated under three different loading conditions. Thefirst segment will consist of approximately 3,000 miles with the bus operated at GVW. Thesecond segment will consist of approximately 1,500 miles with the bus operated at SLW.The remainder of the test, approximately 3,000 miles, will be conducted with the bus loadedto CW. If GVW exceeds the axle design weights, then the load will be adjusted to the axledesign weights and the change will be recorded. All subsystems are run during these testsin their normal operating modes. All recommended manufacturers servicing is to befollowed and noted on the vehicle maintainability log. Servicing items accelerated by thedurability tests will be compressed by 10:1; all others will be done on a 1:1 mi/mi basis.Unscheduled breakdowns and repairs are recorded on the same log as are any unusualoccurrences as noted by the driver. Once a week the test vehicle shall be washed downand thoroughly inspected for any signs of failure.
5.7-III. DISCUSSION
The Structural Durability Test was started on June 7, 2007 and was conducted untilAugust 30, 2007. The first 3,000 miles were performed at a GVW of 16,750 lbs. andcompleted on August 7, 2007. The next 1,500 mile SLW segment was performed at14,420 lbs and completed on August 15, 2007, and the final 3,000 mile segment wasperformed at a CW of 12,320 lbs and completed on August 30, 2007.
The following mileage summary presents the accumulation of miles during theStructural Durability Test. The driving schedule is included, showing the operating dutycycle. A detailed plan view of the Test Track Facility and Durability Test Track are attachedfor reference. Also, a durability element profile detail shows all the measurements of thedifferent conditions. Finally, photographs illustrating some of the failures that wereencountered during the Structural Durability Test are included.

67

68

69

70

71

72

73
74
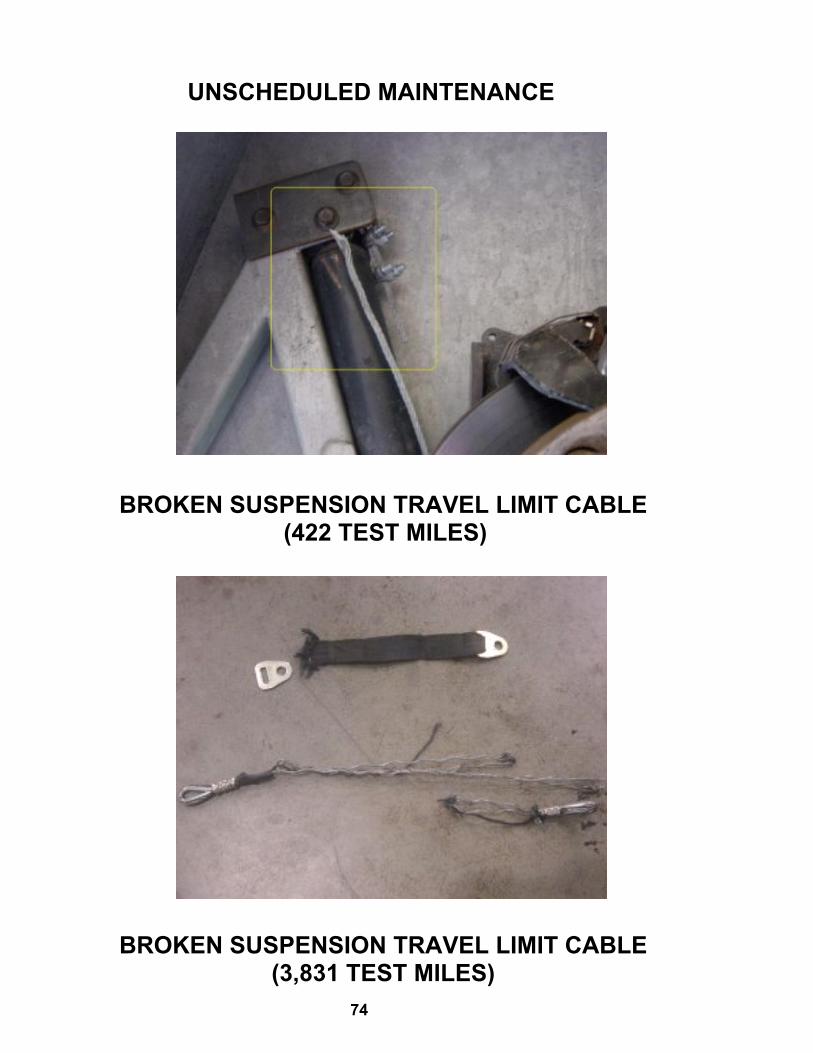
UNSCHEDULED MAINTENANCE
BROKEN SUSPENSION TRAVEL LIMIT CABLE (422 TEST MILES)
BROKEN SUSPENSION TRAVEL LIMIT CABLE(3,831 TEST MILES)

75
UNSCHEDULED MAINTENANCE CONT.
BATTERY CABLE PULLED FROM LUG(5,940 TEST MILES)

76
6. FUEL ECONOMY TEST - A FUEL CONSUMPTIONTEST USING AN APPROPRIATE OPERATING CYCLE
6-I. TEST OBJECTIVE
The objective of this test is to provide accurate comparable fuel consumption dataon transit buses produced by different manufacturers. This fuel economy test bears norelation to the calculations done by the Environmental Protection Agency (EPA) todetermine levels for the Corporate Average Fuel Economy Program. EPA's calculationsare based on tests conducted under laboratory conditions intended to simulate city andhighway driving. This fuel economy test, as designated here, is a measurement of thefuel expended by a vehicle traveling a specified test loop under specified operatingconditions. The results of this test will not represent actual mileage but will provide datathat can be used by recipients to compare buses tested by this procedure.
6-II. TEST DESCRIPTION
This test requires operation of the bus over a course based on the Transit CoachOperating Duty Cycle (ADB Cycle) at seated load weight using a procedure based onthe Fuel Economy Measurement Test (Engineering Type) For Trucks and Buses: SAE1376 July 82. The procedure has been modified by elimination of the control vehicleand by modifications as described below. The inherent uncertainty and expense ofutilizing a control vehicle over the operating life of the facility is impractical.
The fuel economy test will be performed as soon as possible (weather permitting)after the completion of the GVW portion of the structural durability test. It will beconducted on the bus test lane at the Penn State Test Facility. Signs are erected atcarefully measured points which delineate the test course. A test run will comprise 3CBD phases, 2 Arterial phases, and 1 Commuter phase. An electronic fuel measuringsystem will indicate the amount of fuel consumed during each phase of the test. Thetest runs will be repeated until there are at least two runs in both the clockwise andcounterclockwise directions in which the fuel consumed for each run is within ∀ 4percent of the average total fuel used over the 4 runs. A 20-minute idle consumptiontest is performed just prior to and immediately after the driven portion of the fueleconomy test. The amount of fuel consumed while operating at normal/low idle isrecorded on the Fuel Economy Data Form. This set of four valid runs along with idleconsumption data comprise a valid test.

77
The test procedure is the ADB cycle with the following four modifications:
1. The ADB cycle is structured as a set number of miles in a fixed time in thefollowing order: CBD, Arterial, CBD, Arterial, CBD, and Commuter. Aseparate idle fuel consumption measurement is performed at the beginningand end of the fuel economy test. This phase sequence permits the reportingof fuel consumption for each of these phases separately, making the datamore useful to bus manufacturers and transit properties.
2. The operating profile for testing purposes shall consist of simulated transittype service at seated load weight. The three test phases (figure 6-1) are: acentral business district (CBD) phase of 2 miles with 7 stops per mile and atop speed of 20 mph; an arterial phase of 2 miles with 2 stops per mile and atop speed of 40 mph; and a commuter phase of 4 miles with 1 stop and amaximum speed of 40 mph. At each designated stop the bus will remainstationary for seven seconds. During this time, the passenger doors shall beopened and closed.
3. The individual ADB phases remain unaltered with the exception that 1 milehas been changed to 1 lap on the Penn State Test Track. One lap is equal to5,042 feet. This change is accommodated by adjusting the cruise distanceand time.
4. The acceleration profile, for practical purposes and to achieve better repeatability, has been changed to "full throttle acceleration to cruise speed".
Several changes were made to the Fuel Economy Measurement Test(Engineering Type) For Trucks and Buses: SAE 1376 July 82:
1. Sections 1.1, and 1.2 only apply to diesel, gasoline, methanol, and any otherfuel in the liquid state (excluding cryogenic fuels).
1.1 SAE 1376 July 82 requires the use of at least a 16-gal fuel tank. Sucha fuel tank when full would weigh approximately 160 lb. It is judged that a 12-gal tankweighing approximately 120 lb will be sufficient for this test and much easier for thetechnician and test personnel to handle.
78
1.2 SAE 1376 July 82 mentions the use of a mechanical scale or a flowmeter system. This test procedure uses a load cell readout combination that providesan accuracy of 0.5 percent in weight and permits on-board weighing of the gravimetrictanks at the end of each phase. This modification permits the determination of a fueleconomy value for each phase as well as the overall cycle.
2. Section 2.1 applies to compressed natural gas (CNG), liquefied natural gas(LNG), cryogenic fuels, and other fuels in the vapor state.
2.1 A laminar type flow meter will be used to determine the fuelconsumption. The pressure and temperature across the flow element will be monitoredby the flow computer. The flow computer will use this data to calculate the gas flowrate. The flow computer will also display the flow rate (scfm) as well as the total fuelused (scf). The total fuel used (scf) for each phase will be recorded on the FuelEconomy Data Form.
3. Use both Sections 1 and 2 for dual fuel systems.
FUEL ECONOMY CALCULATION PROCEDURE
A. For diesel, gasoline, methanol and fuels in the liquid state.
The reported fuel economy is based on the following: measured test quantities--distance traveled (miles) and fuel consumed (pounds); standard reference values--density of water at 60ΕF (8.3373 lbs/gal) and volumetric heating value of standard fuel;and test fuel specific gravity (unitless) and volumetric heating value (BTU/gal). Thesecombine to give a fuel economy in miles per gallon (mpg) which is corrected to astandard gallon of fuel referenced to water at 60ΕF. This eliminates fluctuations in fueleconomy due to fluctuations in fuel quality. This calculation has been programmed intoa computer and the data processing is performed automatically.
The fuel economy correction consists of three steps:
1.) Divide the number of miles of the phase by the number of pounds of fuelconsumed
total milesphase miles per phase per runCBD 1.9097 5.7291ART 1.9097 3.8193COM 3.8193 3.8193
FEomi/lb = Observed fuel economy = miles lb of fuel

79
2.) Convert the observed fuel economy to miles per gallon [mpg] by multiplyingby the specific gravity of the test fuel Gs (referred to water) at 60ΕF andmultiply by the density of water at 60ΕF
FEompg = FEcmi/lb x Gs x Gw
where Gs = Specific gravity of test fuel at 60ΕF (referred to water)
Gw = 8.3373 lb/gal
3.) Correct to a standard gallon of fuel by dividing by the volumetric heatingvalue of the test fuel (H) and multiplying by the volumetric heating value ofstandard reference fuel (Q). Both heating values must have the same units.
FEc = FEompg x Q Hwhere
H = Volumetric heating value of test fuel [BTU/gal] Q = Volumetric heating value of standard reference fuel
Combining steps 1-3 yields
==> FEc = miles x (Gs x Gw) x Q lbs H
4.) Covert the fuel economy from mpg to an energy equivalent of miles perBTU. Since the number would be extremely small in magnitude, the energyequivalent will be represented as miles/BTUx106.
Eq = Energy equivalent of converting mpg to mile/BTUx106.
Eq = ((mpg)/(H))x106
B. CNG, LNG, cryogenic and other fuels in the vapor state.
The reported fuel economy is based on the following: measured test quantities--distance traveled (miles) and fuel consumed (scf); density of test fuel, and volumetricheating value (BTU/lb) of test fuel at standard conditions (P=14.73 psia and T=60 ΕF).

80
These combine to give a fuel economy in miles per lb. The energy equivalent(mile/BTUx106) will also be provided so that the results can be compared to buses thatuse other fuels.
1.) Divide the number of miles of the phase by the number of standard cubicfeet (scf) of fuel consumed.
total milesphase miles per phase per runCBD 1.9097 5.7291ART 1.9097 3.8193COM 3.8193 3.8193
FEomi/scf = Observed fuel economy = miles scf of fuel
2.) Convert the observed fuel economy to miles per lb by dividing FEo by thedensity of the test fuel at standard conditions (Lb/ft3).
Note: The density of test fuel must be determined at standardconditions as described above. If the density is not defined at theabove standard conditions, then a correction will be needed before thefuel economy can be calculated.
FEomi/lb = FEo / Gm
where Gm = Density of test fuel at standard conditions
3.) Convert the observed fuel economy (FEomi/lb) to an energy equivalent of(miles/BTUx106) by dividing the observed fuel economy (FEomi/lb) by theheating value of the test fuel at standard conditions.
Eq = ((FEomi/lb)/H)x106
where
Eq = Energy equivalent of miles/lb to mile/BTUx106
H = Volumetric heating value of test fuel at standard conditions

81
6-III. DISCUSSION
This is a comparative test of fuel economy using diesel fuel with a heating value of19,631 btu/lb. The driving cycle consists of Central Business District (CBD), Arterial(ART), and Commuter (COM) phases as described in 6-II. The fuel consumption foreach driving cycle and for idle is measured separately. The results are corrected to areference fuel with a volumetric heating value of 127,700.0 btu/gal.
An extensive pretest maintenance check is made including the replacement of alllubrication fluids. The details of the pretest maintenance are given in the first threePretest Maintenance Forms. The fourth sheet shows the Pretest Inspection. The nextsheet shows the correction calculation for the test fuel. The next four Fuel EconomyForms provide the data from the four test runs. Finally, the summary sheet provides theaverage fuel consumption. The overall average is based on total fuel and total mileagefor each phase. The overall average fuel consumption values were; CBD – 7.40 mpg,ART – 7.99 mpg, and COM – 13.74 mpg. Average fuel consumption at idle was 0.43gph.

82
FUEL ECONOMY PRE-TEST MAINTENANCE FORM
Bus Number: 0706 Date: 8-27-07 SLW (lbs): 14,420
Personnel: S.C. & T.S.
FUEL SYSTEM OK Date Initials
Install fuel measurement system
8-27-07 S.C.
Replace fuel filter
8-27-07 S.C.
Check for fuel leaks
8-27-07 S.C.
Specify fuel type (refer to fuel analysis)
Remarks: None noted.
BRAKES/TIRES OK Date Initials
Inspect hoses
8-27-07 S.C.
Inspect brakes
8-27-07 S.C.
Relube wheel bearings
8-27-07 T.S.
Check tire inflation pressures (mfg. specs.)
8-27-07 T.S.
Remarks: None noted.
COOLING SYSTEM OK Date Initials
Check hoses and connections
8-27-07 S.C.
Check system for coolant leaks
8-27-07 S.C.
Remarks: None noted.

83
FUEL ECONOMY PRE-TEST MAINTENANCE FORM (page 2)
Bus Number: 0706 Date: 8-27-07
Personnel: S.C. & T.S.
ELECTRICAL SYSTEMS OK Date Initials
Check battery
8-27-07 S.C.
Inspect wiring
8-27-07 S.C.
Inspect terminals
8-27-07 S.C.
Check lighting
8-27-07 S.C.
Remarks: None noted.
DRIVE SYSTEM OK Date Initials
Drain transmission fluid
8-27-07 T.S.
Replace filter/gasket
8-27-07 T.S.
Check hoses and connections
8-27-07 T.S.
Replace transmission fluid
8-27-07 T.S.
Check for fluid leaks
8-27-07 T.S.
Remarks: None noted.
LUBRICATION OK Date Initials
Drain crankcase oil
8-27-07 T.S.
Replace filters
8-27-07 T.S.
Replace crankcase oil
8-27-07 T.S.
Check for oil leaks
8-27-07 T.S.
Check oil level
8-27-07 T.S.
Lube all chassis grease fittings
8-27-07 T.S.
Lube universal joints
8-27-07 T.S.
Replace differential lube including axles
8-27-07 T.S.
Remarks: None noted.

84
FUEL ECONOMY PRE-TEST MAINTENANCE FORM (page 3)
Bus Number: 0706 Date: 8-27-07
Personnel: S.C. & T.S.
EXHAUST/EMISSION SYSTEM OK Date Initials
Check for exhaust leaks 8-27-07 S.C.
Remarks: None noted.
ENGINE OK Date Initials
Replace air filter
8-27-07 T.S.
Inspect air compressor and air system
8-27-07 T.S.
Inspect vacuum system, if applicable
8-27-07 T.S.
Check and adjust all drive belts
8-27-07 T.S.
Check cold start assist, if applicable
8-27-07 T.S.
Remarks: None noted.
STEERING SYSTEM OK Date Initials
Check power steering hoses and connectors
8-27-07 S.C.
Service fluid level
8-27-07 S.C.
Check power steering operation
8-27-07 S.C.
Remarks: None noted.
OK Date Initials
Ballast bus to seated load weight 8-27-07 S.C.
TEST DRIVE OK Date Initials
Check brake operation
8-27-07 S.C.
Check transmission operation
8-27-07 S.C.
Remarks: None noted.

85
FUEL ECONOMY PRE-TEST INSPECTION FORM
Bus Number: 0706 Date: 8-28-07
Personnel: S.C.
PRE WARM-UP If OK, Initial
Fuel Economy Pre-Test Maintenance Form is complete S.C.
Cold tire pressure (psi): Front 95 Middle N/A Rear 95 S.C.
Tire wear: S.C.
Engine oil level S.C.
Engine coolant level S.C.
Interior and exterior lights on, evaporator fan on S.C.
Fuel economy instrumentation installed and working properly. S.C.
Fuel line -- no leaks or kinks S.C.
Speed measuring system installed on bus. Speed indicatorinstalled in front of bus and accessible to TECH and Driver.
S.C.
Bus is loaded to SLW S.C.
WARM-UP If OK, Initial
Bus driven for at least one hour warm-up S.C.
No extensive or black smoke from exhaust S.C.
POST WARM-UP If OK, Initial
Warm tire pressure (psi): Front 99 Middle N/A Rear 98 S.C.
Environmental conditions Average wind speed <12 mph and maximum gusts <15 mph Ambient temperature between 30°F(-1C°) and 90°F(32°C) Track surface is dry Track is free of extraneous material and clear of interfering traffic
S.C.

86

87

88

89

90

91
7. NOISE
7.1 INTERIOR NOISE AND VIBRATION TESTS
7.1-I. TEST OBJECTIVE
The objective of these tests is to measure and record interior noise levels andcheck for audible vibration under various operating conditions.
7.1-II. TEST DESCRIPTION
During this series of tests, the interior noise level will be measured at severallocations with the bus operating under the following three conditions:
1. With the bus stationary, a white noise generating system shall provide a uniform sound pressure level equal to 80 dB(A) on the left, exterior side of the bus. The engine and all accessories will be switched off and all openings including doors and windows will be closed. This test will be performed at the ABTC.
2. The bus accelerating at full throttle from a standing start to 35 mph on a levelpavement. All openings will be closed and all accessories will be operating duringthe test. This test will be performed on the track at the Test Track Facility.
3. The bus will be operated at various speeds from 0 to 55 mph with and without the air conditioning and accessories on. Any audible vibration or rattles will be noted. This test will be performed on the test segment between the Test Track and the Bus Testing Center.
All tests will be performed in an area free from extraneous sound-making sourcesor reflecting surfaces. The ambient sound level as well as the surrounding weatherconditions will be recorded in the test data.
7.1-III. DISCUSSION
This test is performed in three parts. The first part exposes the exterior of thevehicle to 80.0 dB(A) on the left side of the bus and the noise transmitted to the interioris measured. The overall average of the six measurements was 54.7 dB(A); rangingfrom 54.1 dB(A) at the front passenger seats to 55.9 dB(A) at the rear passenger seats.The interior ambient noise level for this test was < 34.0 dB(A).
The second test measures interior noise during acceleration from 0 to 35 mph.This noise level ranged from 73.6 dB(A) at the front passenger seats to 74.6 dB(A) atthe middle passenger seats. The overall average was 74.3 dB(A). The interior ambientnoise level for this test was < 34.0 dB(A).

92
The third part of the test is to listen for resonant vibrations, rattles, and other noisesources while operating over the road. No vibrations or rattles were noted.

93
INTERIOR NOISE TEST DATA FORMTest Condition 1: 80 dB(A) Stationary White Noise
Bus Number: 0706 Date: 5-10-07
Personnel: S.C. & T.S.
Temperature (°F): 76 Humidity (%): 65
Wind Speed (mph): Calm Wind Direction: Calm
Barometric Pressure (in.Hg): 30.11
Initial Sound Level Meter Calibration: _ checked by: S.C.
Interior AmbientNoise Level dB(A): < 34.0
Exterior AmbientNoise Level dB(A): 44.6
Microphone Height During Testing (in): 48.0
Measurement Location Measured Sound Level dB(A)
Driver's Seat 54.5
Front Passenger Seats 54.1
In Line with Front Speaker 55.0
In Line with Middle Speaker 54.4
In Line with Rear Speaker 54.3
Rear Passenger Seats 55.9
Final Sound Level Meter Calibration: _ checked by: S.C.
Comments: All readings taken in the center aisle.

94
INTERIOR NOISE TEST DATA FORMTest Condition 2: 0 to 35 mph Acceleration Test
Bus Number: 0706 Date: 8-29-07
Personnel: B.S., T.S. & S.C.
Temperature (°F): 70 Humidity (%): 85
Wind Speed (mph): Calm Wind Direction: Calm
Barometric Pressure (in.Hg): 30.15
Initial Sound Level Meter Calibration: _ checked by: S.C.
Interior AmbientNoise Level dB(A): < 34.0
Exterior AmbientNoise Level dB(A): 41.1
Microphone Height During Testing (in): 48.0
Measurement Location Measured Sound Level dB(A)
Driver's Seat 74.4
Front Passenger Seats 73.6
Middle Passenger Seats 74.6
Rear Passenger Seats 74.5
Final Sound Level Meter Calibration: _ checked by: S.C.
Comments: All readings taken in the center aisle.

95
INTERIOR NOISE TEST DATA FORMTest Condition 3: Audible Vibration Test
Bus Number: 0706 Date: 8-29-07
Personnel: B.S., T.S. & S.C.
Temperature (°F): 70 Humidity (%): 85
Wind Speed (mph): Clam Wind Direction: Calm
Barometric Pressure (in.Hg): 30.15
Describe the following possible sources of noise and give the relative location on thebus.
Source of Noise Location
Engine and Accessories None noted.
Windows and Doors None noted.
Seats and Wheel Chair lifts None noted.
Comment on any other vibration or noise source which may have occurredthat is not described above:
None noted.

96
7.1 INTERIOR NOISE TEST
TEST BUS SET-UP FOR 80 dB(A)INTERIOR NOISE TEST

97
7.2 EXTERIOR NOISE TESTS
7.2-I. TEST OBJECTIVE
The objective of this test is to record exterior noise levels when a bus is operatedunder various conditions.
7.2-II. TEST DESCRIPTION
In the exterior noise tests, the bus will be operated at a SLW in three differentconditions using a smooth, straight and level roadway:
1. Accelerating at full throttle from a constant speed at or below 35 mph and justprior to transmission up shift.
2. Accelerating at full throttle from standstill.3. Stationary, with the engine at low idle, high idle, and wide open throttle.
In addition, the buses will be tested with and without the air conditioning and allaccessories operating. The exterior noise levels will be recorded.
The test site is at the PSBRTF and the test procedures will be in accordance withSAE Standards SAE J366b, Exterior Sound Level for Heavy Trucks and Buses. The testsite is an open space free of large reflecting surfaces. A noise meter placed at aspecified location outside the bus will measure the noise level.
During the test, special attention should be paid to:
1. The test site characteristics regarding parked vehicles, signboards, buildings, or other sound-reflecting surfaces
2. Proper usage of all test equipment including set-up and calibration3. The ambient sound level
7.2-III. DISCUSSION
The Exterior Noise Test determines the noise level generated by the vehicle underdifferent driving conditions and at stationary low and high idle, with and without airconditioning and accessories operating. The test site is a large, level, bituminous pavedarea with no reflecting surfaces nearby.
With an exterior ambient noise level of 40.9 dB(A), the average test result obtainedwhile accelerating from a constant speed was 70.9 dB(A) on the right side and 76.3dB(A) on the left side.

98
When accelerating from a standstill with an exterior ambient noise level of 40.2dB(A), the average of the results obtained were 68.8 dB(A) on the right side and 71.0dB(A) on the left side.
With the vehicle stationary and the engine, accessories, and air conditioning on,the measurements averaged 57.0 dB(A) at low idle, 61.7 dB(A) at high idle, and 71.7dB(A) at wide open throttle. With the accessories and air conditioning off, the readingsaveraged 0.3 dB(A) lower at low idle and 0.4 dB(A) lower at wide open throttle. Theexterior ambient noise level measured during this test was 40.6 dB(A). Note; The airconditioning must be on to activated the high idle mode.

99
EXTERIOR NOISE TEST DATA FORMAccelerating from Constant Speed
Bus Number: 0706 Date: 8-29-07
Personnel: B.S., T.S. & S.C.
Temperature (°F): 72 Humidity (%): 85
Wind Speed (mph): Calm Wind Direction: Calm
Barometric Pressure (in.Hg): 30.15
Verify that microphone height is 4 feet, wind speed is less than 12 mph and ambienttemperature is between 30°F and 90°F: _ checked by: S.C.
Initial Sound Level Meter Calibration: _ checked by: S.C.
Exterior Ambient Noise Level dB(A): 40.9
Accelerating from Constant SpeedCurb (Right) Side
Accelerating from Constant SpeedStreet (Left) Side
Run # Measured NoiseLevel dB(A)
Run # Measured Noise LeveldB(A)
1 71.0 1 75.4
2 70.9 2 75.8
3 70.8 3 76.8
4 70.8 4 75.2
5 70.7 5 75.7
Average of two highest actualnoise levels = 70.9 dB(A)
Average of two highest actualnoise levels = 76.3 dB(A)
Final Sound Level Meter Calibration Check: _ checked by: S.C.
Comments: None noted.

100
EXTERIOR NOISE TEST DATA FORMAccelerating from Standstill
Bus Number: 0706 Date: 8-29-07
Personnel: B.S., T.S. & S.C.
Temperature (°F): 72 Humidity (%): 85
Wind Speed (mph): Calm Wind Direction: Calm
Barometric Pressure (in.Hg): 30.15
Verify that microphone height is 4 feet, wind speed is less than 12 mph and ambienttemperature is between 30°F and 90°F: _ checked by: S.C.
Initial Sound Level Meter Calibration: _ checked by: S.C.
Exterior Ambient Noise Level dB(A): 40.2
Accelerating from StandstillCurb (Right) Side
Accelerating from StandstillStreet (Left) Side
Run # Measured NoiseLevel dB(A)
Run # MeasuredNoise Level
dB(A)
1 67.8 1 70.7
2 68.8 2 71.2
3 67.5 3 70.1
4 68.8 4 69.5
5 67.5 5 69.9
Average of two highest actual noiselevels = 68.8 dB(A)
Average of two highest actual noiselevels = 71.0 dB(A)
Final Sound Level Meter Calibration Check: _ checked by: S.C.
Comments: None noted.

101
EXTERIOR NOISE TEST DATA FORMStationary
Bus Number: 0706 Date: 8-29-07
Personnel: B.S., T.S. & S.C.
Temperature (°F): 72 Humidity (%): 85
Wind Speed (mph): Calm Wind Direction: Calm
Barometric Pressure (in.Hg): 30.15
Verify that microphone height is 4 feet, wind speed is less than 12 mph and ambienttemperature is between 30°F and 90°F: _ checked by: S.C.
Initial Sound Level Meter Calibration: _ checked by: S.C.
Exterior Ambient Noise Level dB(A): 40.6
Accessories and Air Conditioning ON
Curb (Right) SidedB(A)
Street (Left) Sidedb(A)Throttle Position Engine RPM
Measured Measured
Low Idle 705 57.5 56.5
High Idle 1,159 60.3 63.0
Wide Open Throttle 3,995 70.7 72.6
Accessories and Air Conditioning OFF
Curb (Right) SidedB(A)
Street (Left) Sidedb(A)Throttle Position Engine RPM
Measured Measured
Low Idle 703 56.9 56.4
High Idle N/A N/A N/A
Wide Open Throttle 3,995 71.1 73.0
Final Sound Level Meter Calibration Check: _ checked by: S.C.
Comments: A/C must be activated for high idle to run.
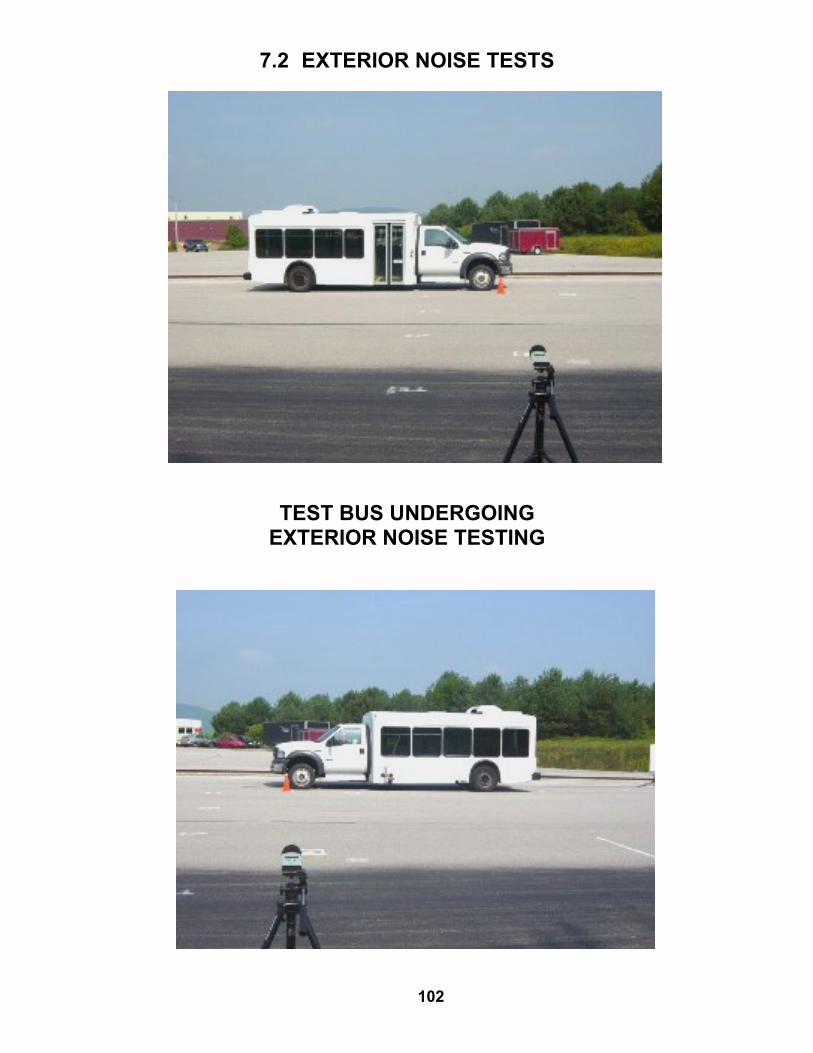
102
7.2 EXTERIOR NOISE TESTS
TEST BUS UNDERGOINGEXTERIOR NOISE TESTING