stylized rendering of 3d scanned real world environments€¦ · · 2012-08-16stylized rendering...
TRANSCRIPT
Stylized Rendering of 3D Scanned Real World Environments
Hui Xu Baoquan Chen
University of Minnesota at Twin Cities ∗
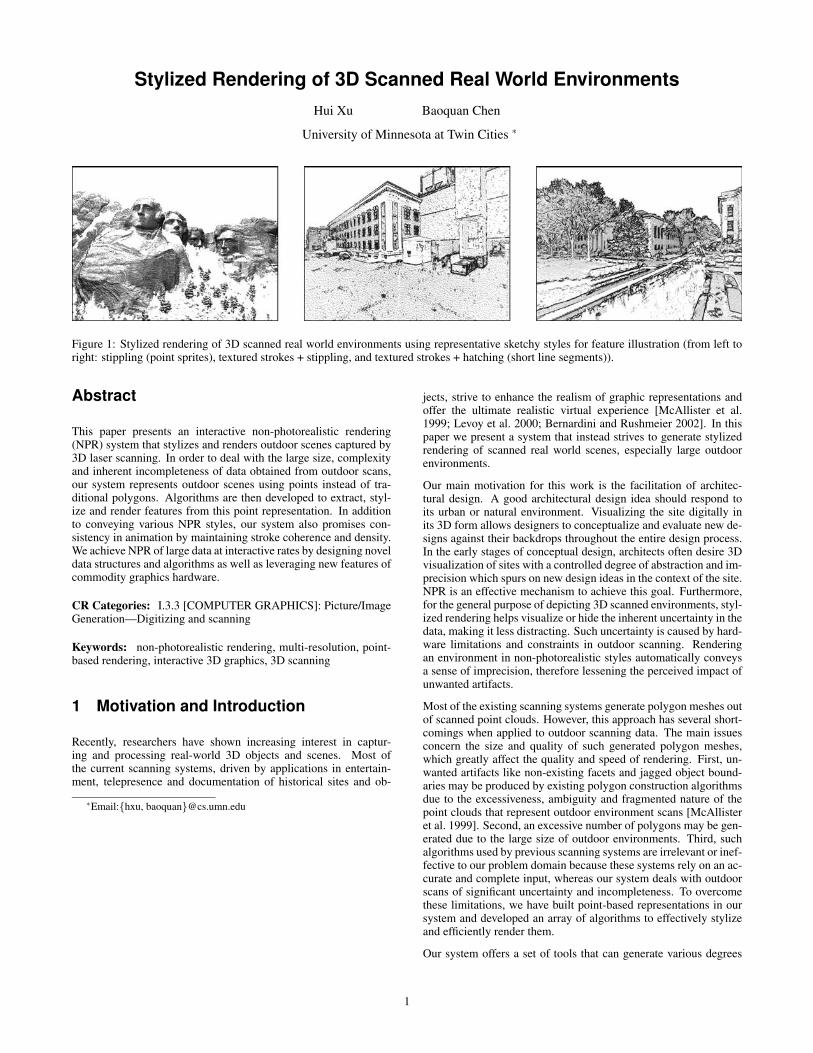
Figure 1: Stylized rendering of 3D scanned real world environments using representative sketchy styles for feature illustration (from left toright: stippling (point sprites), textured strokes + stippling, and textured strokes + hatching (short line segments)).
Abstract
This paper presents an interactive non-photorealistic rendering(NPR) system that stylizes and renders outdoor scenes captured by3D laser scanning. In order to deal with the large size, complexityand inherent incompleteness of data obtained from outdoor scans,our system represents outdoor scenes using points instead of tra-ditional polygons. Algorithms are then developed to extract, styl-ize and render features from this point representation. In additionto conveying various NPR styles, our system also promises con-sistency in animation by maintaining stroke coherence and density.We achieve NPR of large data at interactive rates by designing noveldata structures and algorithms as well as leveraging new features ofcommodity graphics hardware.
CR Categories: I.3.3 [COMPUTER GRAPHICS]: Picture/ImageGeneration—Digitizing and scanning
Keywords: non-photorealistic rendering, multi-resolution, point-based rendering, interactive 3D graphics, 3D scanning
1 Motivation and Introduction
Recently, researchers have shown increasing interest in captur-ing and processing real-world 3D objects and scenes. Most ofthe current scanning systems, driven by applications in entertain-ment, telepresence and documentation of historical sites and ob-
∗Email:{hxu, baoquan}@cs.umn.edu
jects, strive to enhance the realism of graphic representations andoffer the ultimate realistic virtual experience [McAllister et al.1999; Levoy et al. 2000; Bernardini and Rushmeier 2002]. In thispaper we present a system that instead strives to generate stylizedrendering of scanned real world scenes, especially large outdoorenvironments.
Our main motivation for this work is the facilitation of architec-tural design. A good architectural design idea should respond toits urban or natural environment. Visualizing the site digitally inits 3D form allows designers to conceptualize and evaluate new de-signs against their backdrops throughout the entire design process.In the early stages of conceptual design, architects often desire 3Dvisualization of sites with a controlled degree of abstraction and im-precision which spurs on new design ideas in the context of the site.NPR is an effective mechanism to achieve this goal. Furthermore,for the general purpose of depicting 3D scanned environments, styl-ized rendering helps visualize or hide the inherent uncertainty in thedata, making it less distracting. Such uncertainty is caused by hard-ware limitations and constraints in outdoor scanning. Renderingan environment in non-photorealistic styles automatically conveysa sense of imprecision, therefore lessening the perceived impact ofunwanted artifacts.
Most of the existing scanning systems generate polygon meshes outof scanned point clouds. However, this approach has several short-comings when applied to outdoor scanning data. The main issuesconcern the size and quality of such generated polygon meshes,which greatly affect the quality and speed of rendering. First, un-wanted artifacts like non-existing facets and jagged object bound-aries may be produced by existing polygon construction algorithmsdue to the excessiveness, ambiguity and fragmented nature of thepoint clouds that represent outdoor environment scans [McAllisteret al. 1999]. Second, an excessive number of polygons may be gen-erated due to the large size of outdoor environments. Third, suchalgorithms used by previous scanning systems are irrelevant or inef-fective to our problem domain because these systems rely on an ac-curate and complete input, whereas our system deals with outdoorscans of significant uncertainty and incompleteness. To overcomethese limitations, we have built point-based representations in oursystem and developed an array of algorithms to effectively stylizeand efficiently render them.
Our system offers a set of tools that can generate various degrees
1
and styles of abstraction. Visual attributes can be changed throughinteractive operations. Overall, our system offers four main fea-tures:
1. Effective feature extraction: Features for NPR illustrations areefficiently and effectively extracted from the large and uncer-tain data sets of outdoor scans.
2. Flexibility in stylization and rendering: Various NPR stylesare supported and can be easily changed during navigation.
3. Coherent animation: Smooth animation and a consistent NPRquality (e.g., stroke coherence and stroke density consistency)are provided during navigation.
4. Interactive navigation: Easy navigation through scenes ofmillions of primitives on a regular PC using commoditygraphics hardware is made possible.
The rest of the paper is organized as follows. We first discuss priorwork (Section 2) in this area, and then briefly describe our dataacquisition and processing pipeline (Section 3). After giving anoverview of our NPR system (Section 4), we introduce two mainoperations involved, namely feature point extraction (Section 5) andillustration (Section 6). We discuss some implementation details,especially regarding hardware implementation (Section 7), presentour results (Section 8), and conclude with a discussion and plansfor future work (Section 9).
2 Prior Work
3D Scanning and Processing:
To process scanned data, most existing systems reconstruct polygonmeshes from scanned sample points, extract corresponding texturemaps out of camera-taken images, and then render textured poly-gons on conventional graphics hardware to achieve photorealism[Bernardini and Rushmeier 2002; Levoy et al. 2000]. The justi-fication for constructing polygons has been the rendering supportoffered by available graphics hardware. However, this often resultsin an excessive number of polygons. The high resolution neces-sary for scanning large environments leads to a high polygon-per-pixel ratio during the rendering of novel views. Furthermore, fittingmeshes into points, especially those of natural phenomena, maycreate unwanted artifacts by producing non-existing structures orjagged boundaries between objects [McAllister et al. 1999].
Point-Based Rendering:
Using points as alternative modelling primitives has been exploredfor over a decade and has recently received increasing attention.Points have been shown to be advantageous over polygons whenrepresenting highly detailed features [Grossman and Dally 1998;Pfister et al. 2000; Rusinkiewicz and Levoy 2000]. Thus as moderngraphics hardware provides more support for the rendering of pointprimitives, point-based rendering will undoubtedly continue to gainpopularity. Besides the efficiency points provide for rendering, theyare also more flexible primitives for visualizing and modelling largescanned environments, especially for stylized rendering.
Non-Photorealistic Rendering (NPR):
Non-Photorealistic rendering has become an important branch ofcomputer graphics in recent years. Most NPR techniques attemptto create images or virtual worlds visually comparable to render-ings produced by artists. Many artwork styles have been exploredin the NPR literature, such as pen and ink [Salisbury et al. 1997;Winkenbach and Salesin 1994], painting [Meier 1996], informal
sketching [Raskar and Cohen 1999], and charcoal drawing [Cor-nish et al. 2001]. Cornish et al. summarize several commonalitiesin NPR techniques for generating some highly varied artistic effects[Cornish et al. 2001]. The first common feature is selecting andplacing strokes, ranging from dabs with a paintbrush and streaks ofcharcoal to lines drawn with a pen or pencil. These strokes are usu-ally placed with some randomness to imitate the nonuniformity inthe drawing styles of human artists, but this randomness can causeflickering during animation due to the lack of consistency. Meier[Meier 1996] solved this problem by associating strokes with parti-cles defined on the surface of objects. Since the strokes are associ-ated with actual locations in space, they move smoothly across thescreen in a consistent manner as the view point shifts. Many NPRsystems have since incorporated this idea. The second common fea-ture is defining the orientation of strokes, which can be defined byeither a user-specified vector field [Salisbury et al. 1997], or normaland curvature information from a 3D model [Saito and Takahashi1990; Meier 1996; Kalnins et al. 2003]. The third common fea-ture is controlling the screen-space density of strokes [Raskar andCohen 1999]. Too many or too few strokes can create a clutteredeffect or fail to convey the underlying shape respectively. In stylessuch as pen-and-ink, stroke density also controls tone [Praun et al.2001; Salisbury et al. 1997; Winkenbach and Salesin 1994]. Sim-ply associating strokes with screen-space increases particle densityas objects recede into the distance. An adaptive way of changingthe density of the particles according to object distance is desirable.
3 Data Acquisition and Processing
We acquire real world environments through laser scanning. Herewe only provide a brief introduction to our scanning and modellingsystem as most of the operations are conventional. Details aboutsome issues are explained in later sections of the paper togetherwith other operations. Our pipeline of the data acquisition and pro-cessing system mainly includes acquisition, registration, segmenta-tion, geometry estimation, and model construction.
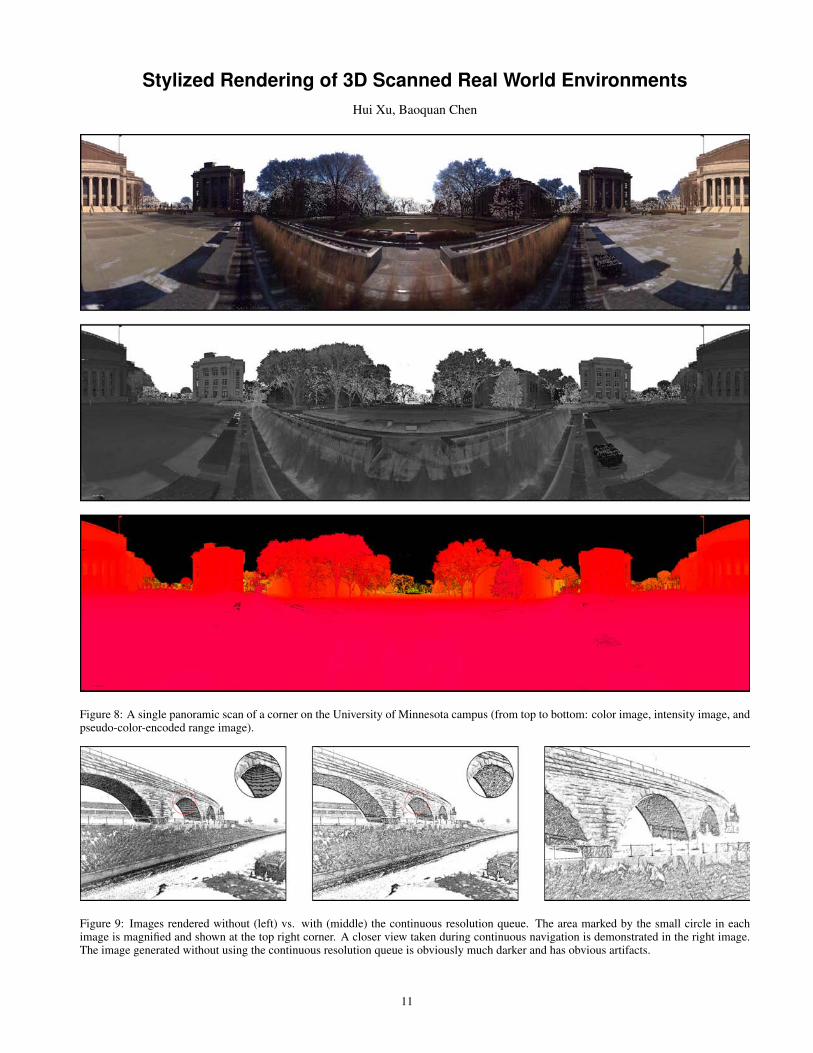
• Acquisition - Our scanning device is the Riegl Inc’s LMS-Z360 3D imaging sensor, which can measure a distanceup to 200m with 12mm precision. A full panoramic scan(360o × 90o) at 3000× 792 resolution takes about four min-utes and data in the form of range, intensity, and color imagesis simultaneously obtained as demonstrated in color plate Fig-ure 8.
• Registration - Multiple scans are needed to build up a uni-fied representation of a complex environment. A pair of scansare registered in an interactive way as follows. First, a useridentifies some common points existing in both scans. Then,a matrix that transforms one scan into the other is computedbased on these common points by the least-squares method[Arun et al. 1987]. Finally, this transformation matrix is usedas the initial guess for the iterative closest point (ICP) methodto refine the alignment [Besl and McKay 1992]. Pair wiseregistration is used iteratively to align multiple scans.
• Segmentation - The scanned data is in the form of point sets.The purpose of segmentation is to divide the point sets into ob-jects such as buildings, trees, etc. Points in each object can befurther segmented to represent subparts. In this way, an objecthierarchy is established, which can be used for model editing,efficient view frustum culling, geometry estimation etc. In oursystem, segmentation is done for every scan by user-assistedimage processing methods such as edge detection. Specifi-cally, utilizing different information from the color, intensity
2
and range images improves the accuracy and efficiency of seg-mentation.
• Geometry estimation - Geometric information regarding eachpoint is necessary for operations such as visibility detection,back-face culling, and stroke placement for NPR etc. Eachpixel scanned represents a 3D point with a certain size. Thissize can be estimated based on the range value and the pixelazimuth/altitude angle. We discuss some other geometry esti-mation aspects like approximating normals in Section 5.
• Model construction - Different from most existing scanningsystems, we build point-based models as the final environ-ment representation. These hierarchical, unified and non-redundant point-based models are constructed based on theaforementioned procedures of registration, segmentation andgeometry estimation.
In summary, our system scans real world environments, merges dataobtained from multiple scanning spots, and builds point-based rep-resentations with geometric information estimated at every point.
4 System Overview
Similar to most existing NPR systems, our system includes twomain steps: feature point extraction and illustration. We start ourprocess by calculating a “feature degree” for each point based onsome criteria, such as data accuracy and/or geometric propertiesetc. Then, we choose a threshold to obtain a subset of points thatare of high feature degree, termed feature points. Thus, feature de-gree characterizes the probability of a point to be demonstrated asa feature point. Further operations such as detecting directions toplace strokes are conducted on the feature points if necessary. Oncethe features are extracted, we employ strokes of different styles toillustrate them. The fact that the points are grouped into objectsis used to facilitate rendering efficiency and quality. For exam-ple, we implement efficient view frustum culling by testing if thebounding box of an object is in the current view. We estimate anobject’s screen projection area and render a suitable number of fea-ture points in order to ensure consistent screen space density. Wedesign and employ a special data structure called a continuous res-olution queue to further maintain coherence in animation. Finally,we develop strategies to leverage modern graphics hardware andachieve interactive rendering rates of environments with millionsof points.
5 Feature Point Extraction
Feature points are a subset of our point model. The feature pointsin our system resemble particles in [Meier 1996] for indicating thelocations of strokes on an object. The general features we wishto illustrate include object boundaries, sharp corners and high fre-quency areas. Our observation suggests that such features largelyexist in the area where the error in normal estimation varies sig-nificantly. For example, the estimated normals of leaves are some-what random, hence the estimation error changes largely. They areamong the features we are likely to illustrate. On the other hand,when estimating the normals of points on a smooth area (e.g., acurved or flat surface etc), the estimation error remains relativelyconstant. They are the parts we are unlikely to emphasize in therendering. According to this observation, we define a feature de-gree for every point in our model based on the variation of the nor-mal estimation error. This feature degree represents the likelihoodof a point to be selected as a feature point. Although this method is
A Point Set
Feature Points
Non-feature Points
Other Points
Non-directional Points
Dithering Points
Directional Points
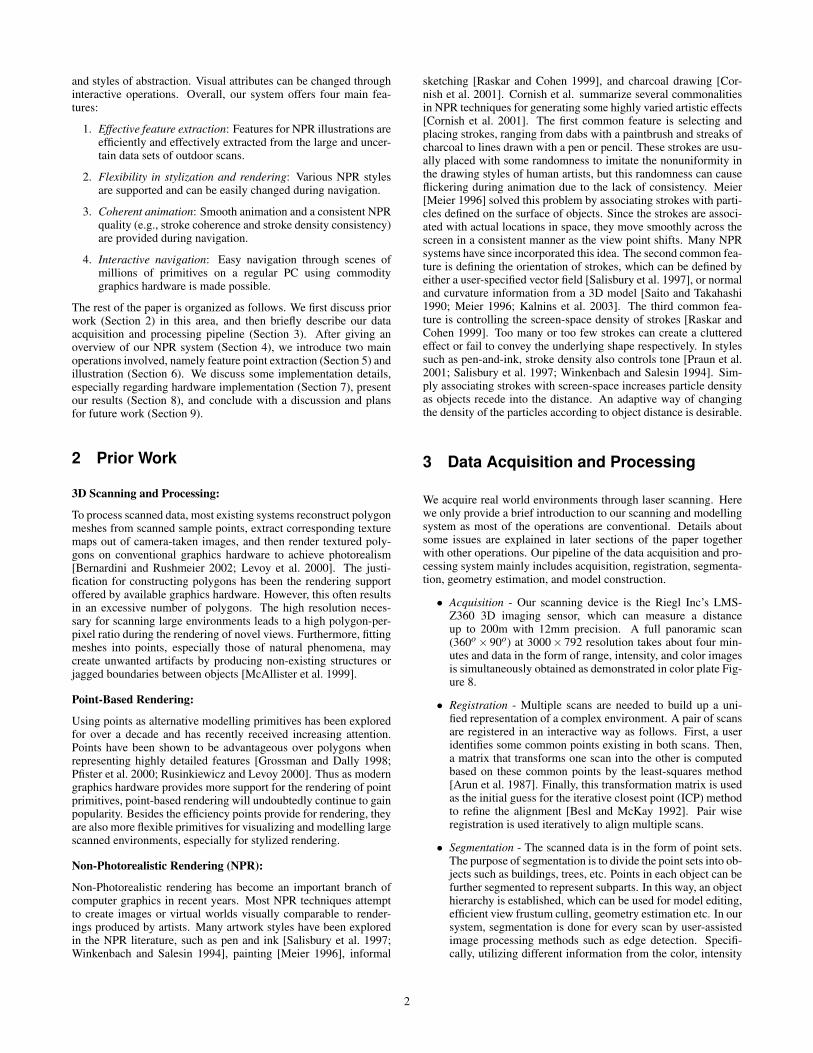
Figure 2: Classification of points (points in the shaded rectanglesare used in NPR).
somewhat empirical, our experiments show that it is very effectivefor feature extraction when combined with other properties such aspoint color and intensity.
In this section, we first provide the details of point normal esti-mation. Then, we use the variation of the estimation error to de-fine the feature degree of each point. Next, we extract featurepoints based on these feature degrees. Finally, we further classifythe feature points. Figure 2 shows the overall classification of ourpoint model. Points in the shaded rectangles are used to stylize thescanned scene.
5.1 Normal Estimation
For a point P0 in our model, we first find the points adjacent to it.Then we calculate the least-squares fitting plane for these pointsincluding P0, and we use the normal of the plane to represent thenormal of the point.
The adjacent points can be located efficiently by taking advantageof the fact that input scans are stored as 2D images as shown in colorplate Figure 8. With the registration information, we can projectP0 onto every scan and find its neighborhood. The union of theseneighborhoods from all scans contains the candidates of the adja-cent points of P0. Then, segmentation information and the distancethreshold are used to exclude candidate points belonging to objectsor surfaces different from that of P0.
We denote the adjacent points of P0 by P1,P2, · · · ,Pn. We constructa 3×3 positive semi-definite matrix
M =n
∑i=0
(Pi − P̄)(Pi − P̄)T, (1)
where P̄ = 1n+1 ∑
ni=0 Pi is the centroid of all the points. The eigen-
vector v corresponding to the smallest eigenvalue of matrix M is thedesired direction [Hoppe et al. 1992]. The smallest eigenvalue alsoindicates the least-squares error of fitting the plane. Notice that thenormal can be decided by either +v or −v. Here we pick up the onepointing towards the corresponding scanner position to obtain theconsistently oriented normals.
5.2 Feature Point Generation
For every point, we calculate a value (the feature degree) between0.0 and 1.0 to indicate its likelihood of being a feature point.
A criterion used to define this value is based on the variation ofthe normal estimation error. As discussed earlier in this section,an increase in the variation in the normal estimation error acrosspoints in a certain area increases their likelihood of being featurepoints. To measure the variation of error, we generate 2D “error
3
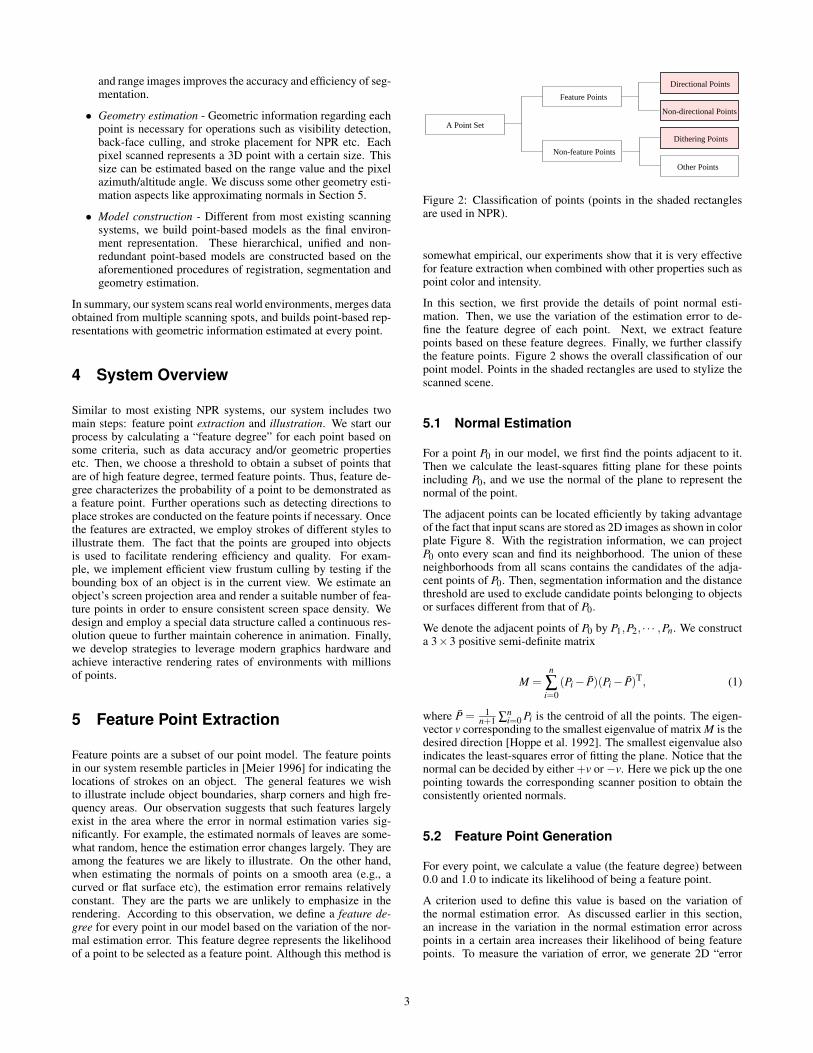
Figure 3: Feature extraction of the panoramic scan shown in colorplate Figure 8. From top to bottom: image encoded by the featuredegree, the feature points, and dithering points.
maps” of the points based on their 2D coordinates in the originalscans. Then we process them using an edge detection filter. Theresults are scaled from 0.0 to 1.0 and could be defined directly asthe feature degrees.
The feature degree defined as above is only based on the geometricinformation of the points. However, this is not sufficient to describeother features related to the color or intensity of the points. Forexample, the above process does not detect a boundary between twoareas with different colors on a flat surface. Therefore, to extractfeatures more effectively, we take into account the color or intensity.We do this by applying the edge detection filter on the color orintensity image to obtain a gray scale map (black is 0.0 and whiteis 1.0), and then linearly combine it with the feature value obtainedfrom the error map. We use the values in the final combined imageas feature degrees. In this way, features related to both the geometryand the color can be described. The gray scale image at the top inFigure 3 shows an example of the encoded feature degrees, wherebrighter color indicates higher feature degree.
Once the feature degree for each point is decided, we pick a thresh-old between 0.0 and 1.0 to extract the feature points. If the featuredegree of a point is greater than the threshold, then it is a featurepoint, otherwise it is a non-feature point.
Although we emphasize feature points, non-feature points are alsoimportant to maintain shading patterns. Since rendering too manynon-feature points would interfere with the NPR effect, we select asfew of them as necessary to approximate the shading tones. To dothis, we apply a dithering method on the set of non-feature pointsto extract a subset called dithering points. It is worth noticing that adirect dithering method would generate dithering points of uniformdistribution in the 2D space, but non-uniform distribution in 3Dspace. Therefore, we combine information from the range imageto solve this problem. We apply denser dithering patterns to pixelswith higher range values, and sparser dithering patterns to thosewith smaller range values. A strategy to simplify this procedure isthat we first blend the color image with the range image by treatingthe range value as a scalar or weight to adjust the RGB value ofthe pixel on the color image. We then apply the standard dither
algorithm on the blended image. In this way, the range value of thenon-feature point is automatically considered.
The two bottom images in Figure 3 show examples of the extractedfeature points (middle) and the dithering points (bottom) respec-tively.
5.3 Feature Point Classification
Not all the feature points belong to meaningful edges that we intendto illustrate using directional strokes. For example, even thoughpoints representing wavering leaves of a tree are likely to be de-tected as feature points, they unlikely demonstrate consistent direc-tions among multiple scans. Therefore, we wish to deemphasizetheir orientations. On the other hand, for feature points represent-ing tree trunks and building edges which do demonstrate consistentorientation, we must compute their on-screen directions to orientthe strokes to form continuous edges on object boundaries. Be-cause of this, we further classify feature points and computer theirorientations if necessary.
The method to address this issue is as follows. As discussed inSection 5.1, for a given feature point P0, we can efficiently locateits adjacent feature points P1,P2, · · · ,Pn. We then fit a 3D line to{Pi, i = 0,1, · · · ,n} using the least-squares method. The errors aremeasured orthogonal to the proposed line. This line indicates thepotential direction to place the stroke, while the least-squares errorindicates the likelihood of its placement.
Let P̄ = 1n+1 ∑
ni=0 Pi be the centroid of the points. The least-squares
fitting line can be calculated by constructing a 3×3 matrix
M′ = σ I −n
∑i=0
(Pi − P̄)(Pi − P̄)T, (2)
where σ = ∑ni=0 (Pi − P̄)T(Pi − P̄) is a scalar. Similar to the plane
fit, the desired line direction is the eigenvector corresponding to thesmallest eigenvalue (in absolute value) of matrix M′, which alsoindicates the error of fitting this line.
Thresholds are then set to classify feature points based on the errorof fitting the stroke directions. In this paper, we use one thresholdto classify them into two categories: directional feature points andnon-directional feature points.
6 Feature Point Illustration
Various NPR styles are achieved by illustrating feature points usingdifferent graphics primitives. The directional points are emphasizedas long textured strokes while non-directional and dithering pointsare generally illustrated as short line segments of a constant direc-tion or even points (point sprites). In our system, dithering pointsare rendered in the same way as non-directional points. Therefore,we only discuss the illustration of feature points (i.e., directionalpoints and non-directional points).
We first present our NPR pipeline. We then introduce the graphicsprimitives used in this paper to illustrate feature points. Finally, wedemonstrate the strategies used to ensure coherent animation andconsistent stroke density.
4
(a) (b) (c) (d)
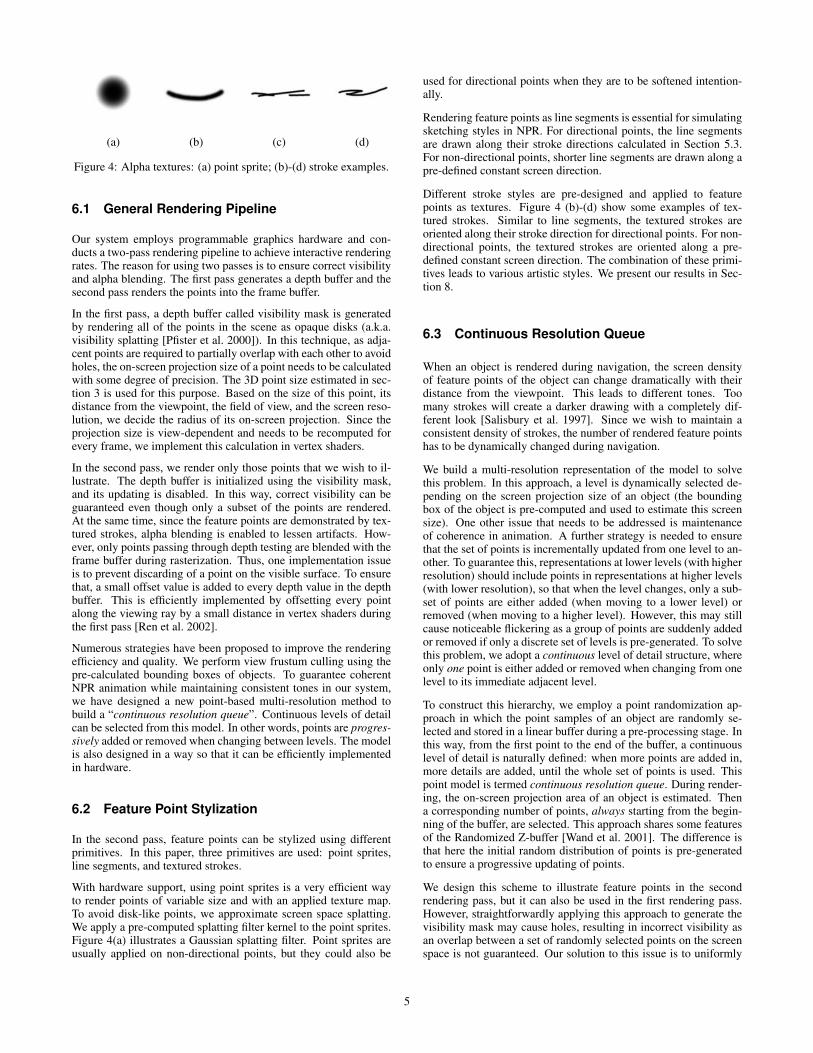
Figure 4: Alpha textures: (a) point sprite; (b)-(d) stroke examples.
6.1 General Rendering Pipeline
Our system employs programmable graphics hardware and con-ducts a two-pass rendering pipeline to achieve interactive renderingrates. The reason for using two passes is to ensure correct visibilityand alpha blending. The first pass generates a depth buffer and thesecond pass renders the points into the frame buffer.
In the first pass, a depth buffer called visibility mask is generatedby rendering all of the points in the scene as opaque disks (a.k.a.visibility splatting [Pfister et al. 2000]). In this technique, as adja-cent points are required to partially overlap with each other to avoidholes, the on-screen projection size of a point needs to be calculatedwith some degree of precision. The 3D point size estimated in sec-tion 3 is used for this purpose. Based on the size of this point, itsdistance from the viewpoint, the field of view, and the screen reso-lution, we decide the radius of its on-screen projection. Since theprojection size is view-dependent and needs to be recomputed forevery frame, we implement this calculation in vertex shaders.
In the second pass, we render only those points that we wish to il-lustrate. The depth buffer is initialized using the visibility mask,and its updating is disabled. In this way, correct visibility can beguaranteed even though only a subset of the points are rendered.At the same time, since the feature points are demonstrated by tex-tured strokes, alpha blending is enabled to lessen artifacts. How-ever, only points passing through depth testing are blended with theframe buffer during rasterization. Thus, one implementation issueis to prevent discarding of a point on the visible surface. To ensurethat, a small offset value is added to every depth value in the depthbuffer. This is efficiently implemented by offsetting every pointalong the viewing ray by a small distance in vertex shaders duringthe first pass [Ren et al. 2002].
Numerous strategies have been proposed to improve the renderingefficiency and quality. We perform view frustum culling using thepre-calculated bounding boxes of objects. To guarantee coherentNPR animation while maintaining consistent tones in our system,we have designed a new point-based multi-resolution method tobuild a “continuous resolution queue”. Continuous levels of detailcan be selected from this model. In other words, points are progres-sively added or removed when changing between levels. The modelis also designed in a way so that it can be efficiently implementedin hardware.
6.2 Feature Point Stylization
In the second pass, feature points can be stylized using differentprimitives. In this paper, three primitives are used: point sprites,line segments, and textured strokes.
With hardware support, using point sprites is a very efficient wayto render points of variable size and with an applied texture map.To avoid disk-like points, we approximate screen space splatting.We apply a pre-computed splatting filter kernel to the point sprites.Figure 4(a) illustrates a Gaussian splatting filter. Point sprites areusually applied on non-directional points, but they could also be
used for directional points when they are to be softened intention-ally.
Rendering feature points as line segments is essential for simulatingsketching styles in NPR. For directional points, the line segmentsare drawn along their stroke directions calculated in Section 5.3.For non-directional points, shorter line segments are drawn along apre-defined constant screen direction.
Different stroke styles are pre-designed and applied to featurepoints as textures. Figure 4 (b)-(d) show some examples of tex-tured strokes. Similar to line segments, the textured strokes areoriented along their stroke direction for directional points. For non-directional points, the textured strokes are oriented along a pre-defined constant screen direction. The combination of these primi-tives leads to various artistic styles. We present our results in Sec-tion 8.
6.3 Continuous Resolution Queue
When an object is rendered during navigation, the screen densityof feature points of the object can change dramatically with theirdistance from the viewpoint. This leads to different tones. Toomany strokes will create a darker drawing with a completely dif-ferent look [Salisbury et al. 1997]. Since we wish to maintain aconsistent density of strokes, the number of rendered feature pointshas to be dynamically changed during navigation.
We build a multi-resolution representation of the model to solvethis problem. In this approach, a level is dynamically selected de-pending on the screen projection size of an object (the boundingbox of the object is pre-computed and used to estimate this screensize). One other issue that needs to be addressed is maintenanceof coherence in animation. A further strategy is needed to ensurethat the set of points is incrementally updated from one level to an-other. To guarantee this, representations at lower levels (with higherresolution) should include points in representations at higher levels(with lower resolution), so that when the level changes, only a sub-set of points are either added (when moving to a lower level) orremoved (when moving to a higher level). However, this may stillcause noticeable flickering as a group of points are suddenly addedor removed if only a discrete set of levels is pre-generated. To solvethis problem, we adopt a continuous level of detail structure, whereonly one point is either added or removed when changing from onelevel to its immediate adjacent level.
To construct this hierarchy, we employ a point randomization ap-proach in which the point samples of an object are randomly se-lected and stored in a linear buffer during a pre-processing stage. Inthis way, from the first point to the end of the buffer, a continuouslevel of detail is naturally defined: when more points are added in,more details are added, until the whole set of points is used. Thispoint model is termed continuous resolution queue. During render-ing, the on-screen projection area of an object is estimated. Thena corresponding number of points, always starting from the begin-ning of the buffer, are selected. This approach shares some featuresof the Randomized Z-buffer [Wand et al. 2001]. The difference isthat here the initial random distribution of points is pre-generatedto ensure a progressive updating of points.
We design this scheme to illustrate feature points in the secondrendering pass, but it can also be used in the first rendering pass.However, straightforwardly applying this approach to generate thevisibility mask may cause holes, resulting in incorrect visibility asan overlap between a set of randomly selected points on the screenspace is not guaranteed. Our solution to this issue is to uniformly
5
r1
r2
(0,0)
-r1+r2
r1+r2(0,1)
(1,0)-r1-r2
r1-r2(1,1)
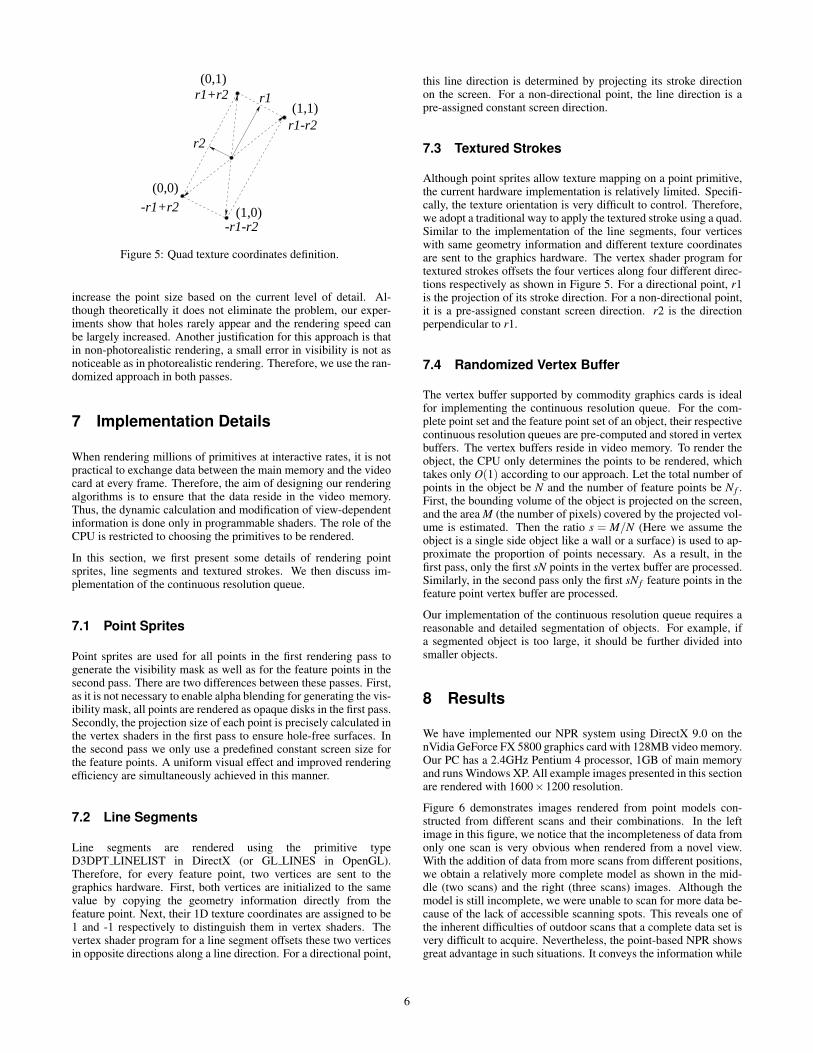
Figure 5: Quad texture coordinates definition.
increase the point size based on the current level of detail. Al-though theoretically it does not eliminate the problem, our exper-iments show that holes rarely appear and the rendering speed canbe largely increased. Another justification for this approach is thatin non-photorealistic rendering, a small error in visibility is not asnoticeable as in photorealistic rendering. Therefore, we use the ran-domized approach in both passes.
7 Implementation Details
When rendering millions of primitives at interactive rates, it is notpractical to exchange data between the main memory and the videocard at every frame. Therefore, the aim of designing our renderingalgorithms is to ensure that the data reside in the video memory.Thus, the dynamic calculation and modification of view-dependentinformation is done only in programmable shaders. The role of theCPU is restricted to choosing the primitives to be rendered.
In this section, we first present some details of rendering pointsprites, line segments and textured strokes. We then discuss im-plementation of the continuous resolution queue.
7.1 Point Sprites
Point sprites are used for all points in the first rendering pass togenerate the visibility mask as well as for the feature points in thesecond pass. There are two differences between these passes. First,as it is not necessary to enable alpha blending for generating the vis-ibility mask, all points are rendered as opaque disks in the first pass.Secondly, the projection size of each point is precisely calculated inthe vertex shaders in the first pass to ensure hole-free surfaces. Inthe second pass we only use a predefined constant screen size forthe feature points. A uniform visual effect and improved renderingefficiency are simultaneously achieved in this manner.
7.2 Line Segments
Line segments are rendered using the primitive typeD3DPT LINELIST in DirectX (or GL LINES in OpenGL).Therefore, for every feature point, two vertices are sent to thegraphics hardware. First, both vertices are initialized to the samevalue by copying the geometry information directly from thefeature point. Next, their 1D texture coordinates are assigned to be1 and -1 respectively to distinguish them in vertex shaders. Thevertex shader program for a line segment offsets these two verticesin opposite directions along a line direction. For a directional point,
this line direction is determined by projecting its stroke directionon the screen. For a non-directional point, the line direction is apre-assigned constant screen direction.
7.3 Textured Strokes
Although point sprites allow texture mapping on a point primitive,the current hardware implementation is relatively limited. Specifi-cally, the texture orientation is very difficult to control. Therefore,we adopt a traditional way to apply the textured stroke using a quad.Similar to the implementation of the line segments, four verticeswith same geometry information and different texture coordinatesare sent to the graphics hardware. The vertex shader program fortextured strokes offsets the four vertices along four different direc-tions respectively as shown in Figure 5. For a directional point, r1is the projection of its stroke direction. For a non-directional point,it is a pre-assigned constant screen direction. r2 is the directionperpendicular to r1.
7.4 Randomized Vertex Buffer
The vertex buffer supported by commodity graphics cards is idealfor implementing the continuous resolution queue. For the com-plete point set and the feature point set of an object, their respectivecontinuous resolution queues are pre-computed and stored in vertexbuffers. The vertex buffers reside in video memory. To render theobject, the CPU only determines the points to be rendered, whichtakes only O(1) according to our approach. Let the total number ofpoints in the object be N and the number of feature points be N f .First, the bounding volume of the object is projected on the screen,and the area M (the number of pixels) covered by the projected vol-ume is estimated. Then the ratio s = M/N (Here we assume theobject is a single side object like a wall or a surface) is used to ap-proximate the proportion of points necessary. As a result, in thefirst pass, only the first sN points in the vertex buffer are processed.Similarly, in the second pass only the first sN f feature points in thefeature point vertex buffer are processed.
Our implementation of the continuous resolution queue requires areasonable and detailed segmentation of objects. For example, ifa segmented object is too large, it should be further divided intosmaller objects.
8 Results
We have implemented our NPR system using DirectX 9.0 on thenVidia GeForce FX 5800 graphics card with 128MB video memory.Our PC has a 2.4GHz Pentium 4 processor, 1GB of main memoryand runs Windows XP. All example images presented in this sectionare rendered with 1600×1200 resolution.
Figure 6 demonstrates images rendered from point models con-structed from different scans and their combinations. In the leftimage in this figure, we notice that the incompleteness of data fromonly one scan is very obvious when rendered from a novel view.With the addition of data from more scans from different positions,we obtain a relatively more complete model as shown in the mid-dle (two scans) and the right (three scans) images. Although themodel is still incomplete, we were unable to scan for more data be-cause of the lack of accessible scanning spots. This reveals one ofthe inherent difficulties of outdoor scans that a complete data set isvery difficult to acquire. Nevertheless, the point-based NPR showsgreat advantage in such situations. It conveys the information while
6
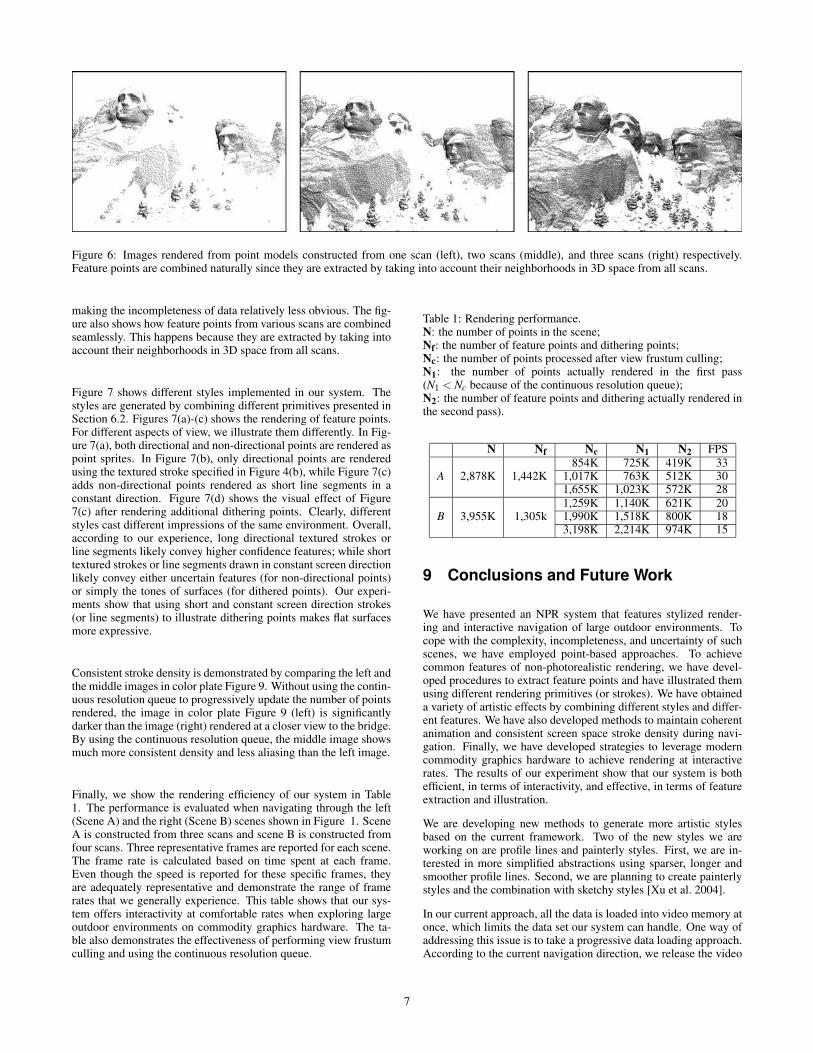
Figure 6: Images rendered from point models constructed from one scan (left), two scans (middle), and three scans (right) respectively.Feature points are combined naturally since they are extracted by taking into account their neighborhoods in 3D space from all scans.
making the incompleteness of data relatively less obvious. The fig-ure also shows how feature points from various scans are combinedseamlessly. This happens because they are extracted by taking intoaccount their neighborhoods in 3D space from all scans.
Figure 7 shows different styles implemented in our system. Thestyles are generated by combining different primitives presented inSection 6.2. Figures 7(a)-(c) shows the rendering of feature points.For different aspects of view, we illustrate them differently. In Fig-ure 7(a), both directional and non-directional points are rendered aspoint sprites. In Figure 7(b), only directional points are renderedusing the textured stroke specified in Figure 4(b), while Figure 7(c)adds non-directional points rendered as short line segments in aconstant direction. Figure 7(d) shows the visual effect of Figure7(c) after rendering additional dithering points. Clearly, differentstyles cast different impressions of the same environment. Overall,according to our experience, long directional textured strokes orline segments likely convey higher confidence features; while shorttextured strokes or line segments drawn in constant screen directionlikely convey either uncertain features (for non-directional points)or simply the tones of surfaces (for dithered points). Our experi-ments show that using short and constant screen direction strokes(or line segments) to illustrate dithering points makes flat surfacesmore expressive.
Consistent stroke density is demonstrated by comparing the left andthe middle images in color plate Figure 9. Without using the contin-uous resolution queue to progressively update the number of pointsrendered, the image in color plate Figure 9 (left) is significantlydarker than the image (right) rendered at a closer view to the bridge.By using the continuous resolution queue, the middle image showsmuch more consistent density and less aliasing than the left image.
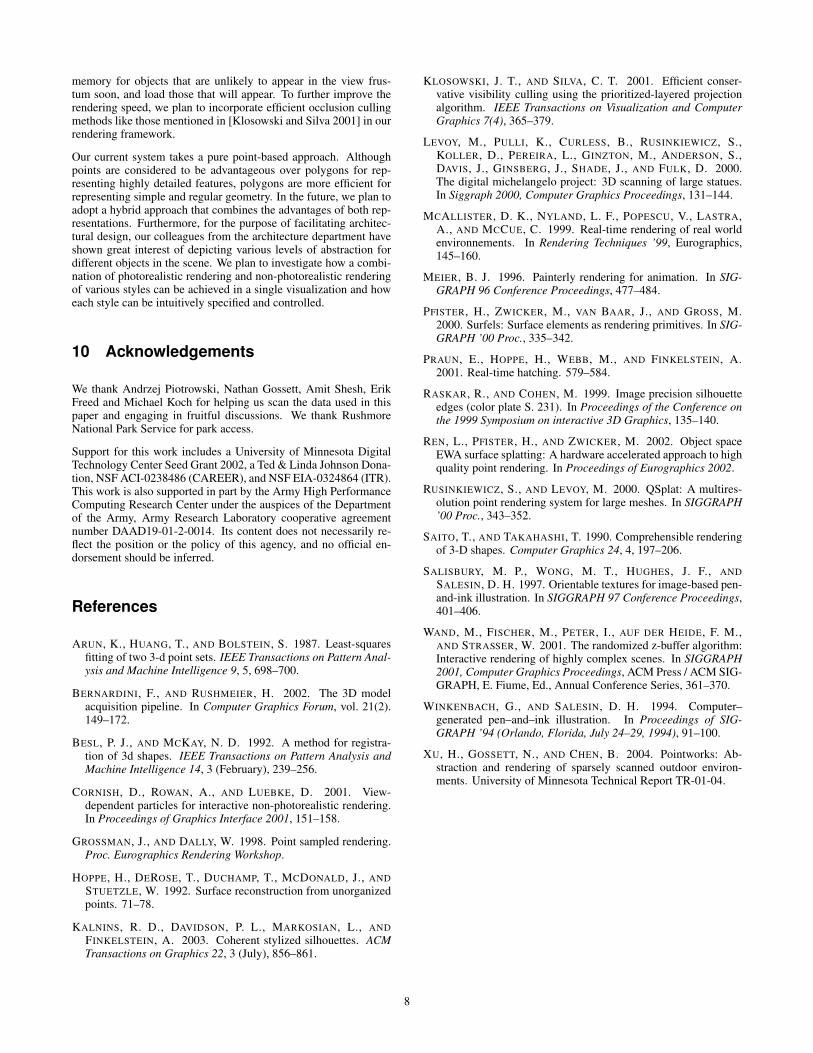
Finally, we show the rendering efficiency of our system in Table1. The performance is evaluated when navigating through the left(Scene A) and the right (Scene B) scenes shown in Figure 1. SceneA is constructed from three scans and scene B is constructed fromfour scans. Three representative frames are reported for each scene.The frame rate is calculated based on time spent at each frame.Even though the speed is reported for these specific frames, theyare adequately representative and demonstrate the range of framerates that we generally experience. This table shows that our sys-tem offers interactivity at comfortable rates when exploring largeoutdoor environments on commodity graphics hardware. The ta-ble also demonstrates the effectiveness of performing view frustumculling and using the continuous resolution queue.
Table 1: Rendering performance.N: the number of points in the scene;Nf: the number of feature points and dithering points;Nc: the number of points processed after view frustum culling;N1: the number of points actually rendered in the first pass(N1 < Nc because of the continuous resolution queue);N2: the number of feature points and dithering actually rendered inthe second pass).
N Nf Nc N1 N2 FPS
854K 725K 419K 33A 2,878K 1,442K 1,017K 763K 512K 30
1,655K 1,023K 572K 28
1,259K 1,140K 621K 20B 3,955K 1,305k 1,990K 1,518K 800K 18
3,198K 2,214K 974K 15
9 Conclusions and Future Work
We have presented an NPR system that features stylized render-ing and interactive navigation of large outdoor environments. Tocope with the complexity, incompleteness, and uncertainty of suchscenes, we have employed point-based approaches. To achievecommon features of non-photorealistic rendering, we have devel-oped procedures to extract feature points and have illustrated themusing different rendering primitives (or strokes). We have obtaineda variety of artistic effects by combining different styles and differ-ent features. We have also developed methods to maintain coherentanimation and consistent screen space stroke density during navi-gation. Finally, we have developed strategies to leverage moderncommodity graphics hardware to achieve rendering at interactiverates. The results of our experiment show that our system is bothefficient, in terms of interactivity, and effective, in terms of featureextraction and illustration.
We are developing new methods to generate more artistic stylesbased on the current framework. Two of the new styles we areworking on are profile lines and painterly styles. First, we are in-terested in more simplified abstractions using sparser, longer andsmoother profile lines. Second, we are planning to create painterlystyles and the combination with sketchy styles [Xu et al. 2004].
In our current approach, all the data is loaded into video memory atonce, which limits the data set our system can handle. One way ofaddressing this issue is to take a progressive data loading approach.According to the current navigation direction, we release the video
7
memory for objects that are unlikely to appear in the view frus-tum soon, and load those that will appear. To further improve therendering speed, we plan to incorporate efficient occlusion cullingmethods like those mentioned in [Klosowski and Silva 2001] in ourrendering framework.
Our current system takes a pure point-based approach. Althoughpoints are considered to be advantageous over polygons for rep-resenting highly detailed features, polygons are more efficient forrepresenting simple and regular geometry. In the future, we plan toadopt a hybrid approach that combines the advantages of both rep-resentations. Furthermore, for the purpose of facilitating architec-tural design, our colleagues from the architecture department haveshown great interest of depicting various levels of abstraction fordifferent objects in the scene. We plan to investigate how a combi-nation of photorealistic rendering and non-photorealistic renderingof various styles can be achieved in a single visualization and howeach style can be intuitively specified and controlled.
10 Acknowledgements
We thank Andrzej Piotrowski, Nathan Gossett, Amit Shesh, ErikFreed and Michael Koch for helping us scan the data used in thispaper and engaging in fruitful discussions. We thank RushmoreNational Park Service for park access.
Support for this work includes a University of Minnesota DigitalTechnology Center Seed Grant 2002, a Ted & Linda Johnson Dona-tion, NSF ACI-0238486 (CAREER), and NSF EIA-0324864 (ITR).This work is also supported in part by the Army High PerformanceComputing Research Center under the auspices of the Departmentof the Army, Army Research Laboratory cooperative agreementnumber DAAD19-01-2-0014. Its content does not necessarily re-flect the position or the policy of this agency, and no official en-dorsement should be inferred.
References
ARUN, K., HUANG, T., AND BOLSTEIN, S. 1987. Least-squaresfitting of two 3-d point sets. IEEE Transactions on Pattern Anal-ysis and Machine Intelligence 9, 5, 698–700.
BERNARDINI, F., AND RUSHMEIER, H. 2002. The 3D modelacquisition pipeline. In Computer Graphics Forum, vol. 21(2).149–172.
BESL, P. J., AND MCKAY, N. D. 1992. A method for registra-tion of 3d shapes. IEEE Transactions on Pattern Analysis andMachine Intelligence 14, 3 (February), 239–256.
CORNISH, D., ROWAN, A., AND LUEBKE, D. 2001. View-dependent particles for interactive non-photorealistic rendering.In Proceedings of Graphics Interface 2001, 151–158.
GROSSMAN, J., AND DALLY, W. 1998. Point sampled rendering.Proc. Eurographics Rendering Workshop.
HOPPE, H., DEROSE, T., DUCHAMP, T., MCDONALD, J., AND
STUETZLE, W. 1992. Surface reconstruction from unorganizedpoints. 71–78.
KALNINS, R. D., DAVIDSON, P. L., MARKOSIAN, L., AND
FINKELSTEIN, A. 2003. Coherent stylized silhouettes. ACMTransactions on Graphics 22, 3 (July), 856–861.
KLOSOWSKI, J. T., AND SILVA, C. T. 2001. Efficient conser-vative visibility culling using the prioritized-layered projectionalgorithm. IEEE Transactions on Visualization and ComputerGraphics 7(4), 365–379.
LEVOY, M., PULLI, K., CURLESS, B., RUSINKIEWICZ, S.,KOLLER, D., PEREIRA, L., GINZTON, M., ANDERSON, S.,DAVIS, J., GINSBERG, J., SHADE, J., AND FULK, D. 2000.The digital michelangelo project: 3D scanning of large statues.In Siggraph 2000, Computer Graphics Proceedings, 131–144.
MCALLISTER, D. K., NYLAND, L. F., POPESCU, V., LASTRA,A., AND MCCUE, C. 1999. Real-time rendering of real worldenvironnements. In Rendering Techniques ’99, Eurographics,145–160.
MEIER, B. J. 1996. Painterly rendering for animation. In SIG-GRAPH 96 Conference Proceedings, 477–484.
PFISTER, H., ZWICKER, M., VAN BAAR, J., AND GROSS, M.2000. Surfels: Surface elements as rendering primitives. In SIG-GRAPH ’00 Proc., 335–342.
PRAUN, E., HOPPE, H., WEBB, M., AND FINKELSTEIN, A.2001. Real-time hatching. 579–584.
RASKAR, R., AND COHEN, M. 1999. Image precision silhouetteedges (color plate S. 231). In Proceedings of the Conference onthe 1999 Symposium on interactive 3D Graphics, 135–140.
REN, L., PFISTER, H., AND ZWICKER, M. 2002. Object spaceEWA surface splatting: A hardware accelerated approach to highquality point rendering. In Proceedings of Eurographics 2002.
RUSINKIEWICZ, S., AND LEVOY, M. 2000. QSplat: A multires-olution point rendering system for large meshes. In SIGGRAPH’00 Proc., 343–352.
SAITO, T., AND TAKAHASHI, T. 1990. Comprehensible renderingof 3-D shapes. Computer Graphics 24, 4, 197–206.
SALISBURY, M. P., WONG, M. T., HUGHES, J. F., AND
SALESIN, D. H. 1997. Orientable textures for image-based pen-and-ink illustration. In SIGGRAPH 97 Conference Proceedings,401–406.
WAND, M., FISCHER, M., PETER, I., AUF DER HEIDE, F. M.,AND STRASSER, W. 2001. The randomized z-buffer algorithm:Interactive rendering of highly complex scenes. In SIGGRAPH2001, Computer Graphics Proceedings, ACM Press / ACM SIG-GRAPH, E. Fiume, Ed., Annual Conference Series, 361–370.
WINKENBACH, G., AND SALESIN, D. H. 1994. Computer–generated pen–and–ink illustration. In Proceedings of SIG-GRAPH ’94 (Orlando, Florida, July 24–29, 1994), 91–100.
XU, H., GOSSETT, N., AND CHEN, B. 2004. Pointworks: Ab-straction and rendering of sparsely scanned outdoor environ-ments. University of Minnesota Technical Report TR-01-04.
8
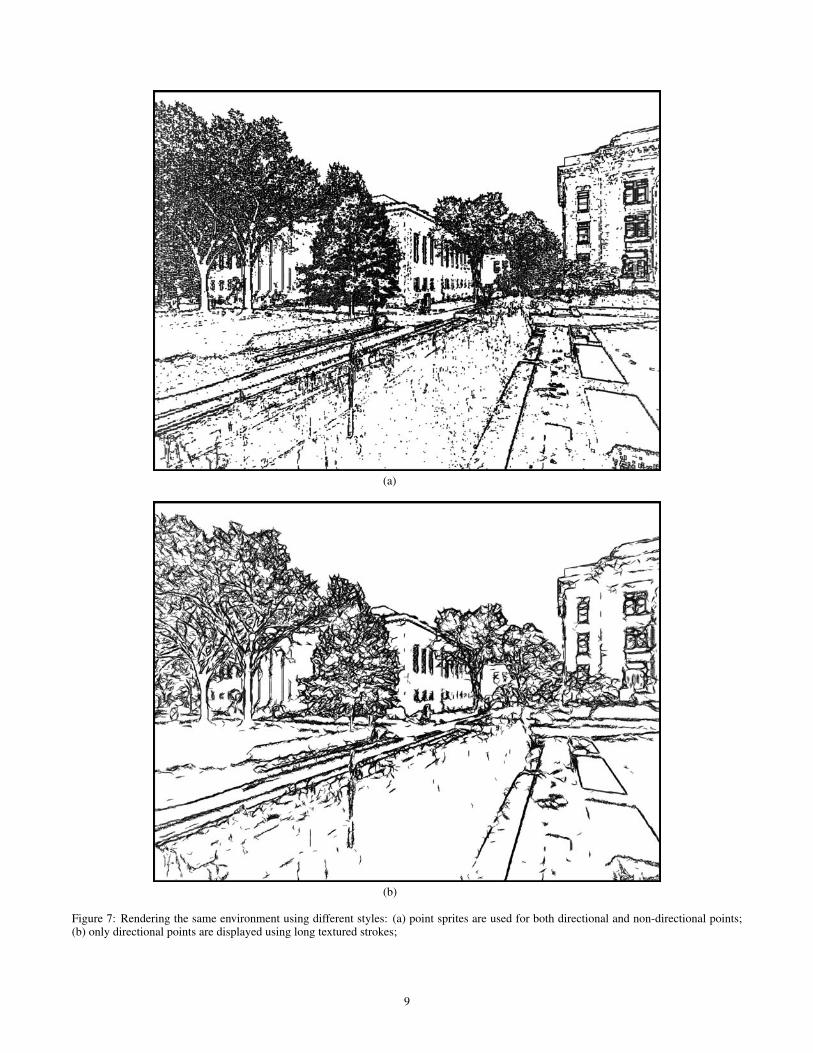
(a)
(b)
Figure 7: Rendering the same environment using different styles: (a) point sprites are used for both directional and non-directional points;(b) only directional points are displayed using long textured strokes;
9
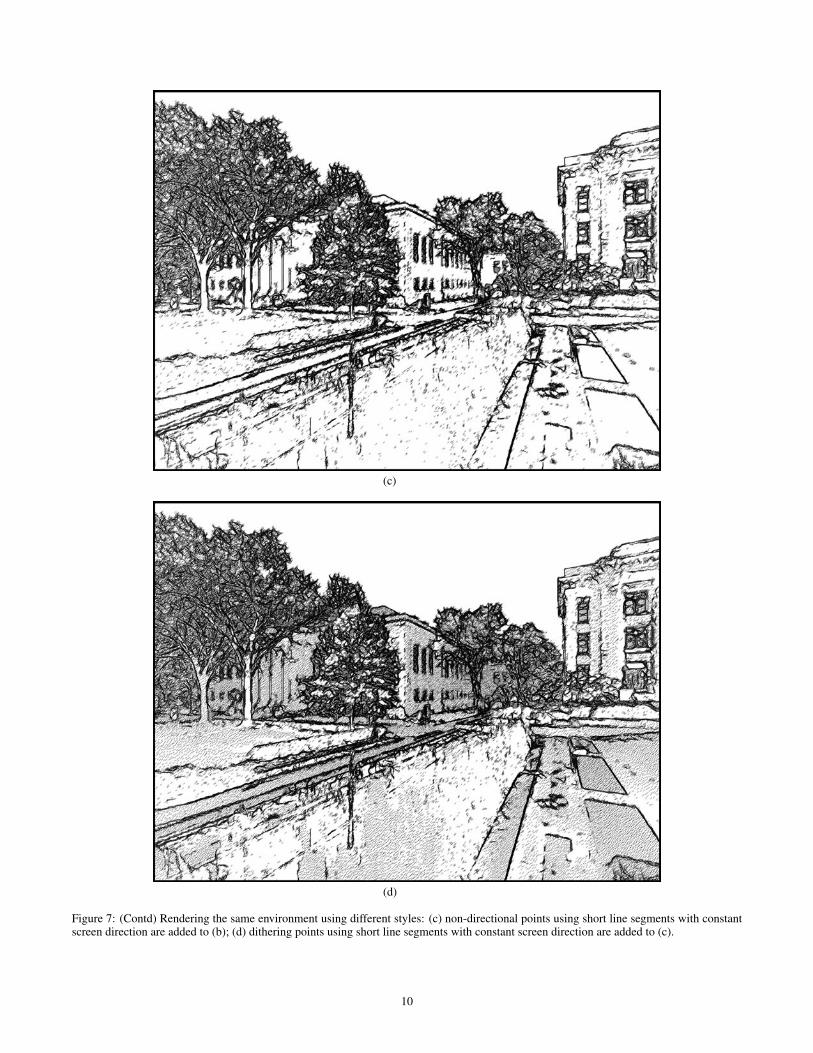
(c)
(d)
Figure 7: (Contd) Rendering the same environment using different styles: (c) non-directional points using short line segments with constantscreen direction are added to (b); (d) dithering points using short line segments with constant screen direction are added to (c).
10
Stylized Rendering of 3D Scanned Real World Environments
Hui Xu, Baoquan Chen
Figure 8: A single panoramic scan of a corner on the University of Minnesota campus (from top to bottom: color image, intensity image, andpseudo-color-encoded range image).
Figure 9: Images rendered without (left) vs. with (middle) the continuous resolution queue. The area marked by the small circle in eachimage is magnified and shown at the top right corner. A closer view taken during continuous navigation is demonstrated in the right image.The image generated without using the continuous resolution queue is obviously much darker and has obvious artifacts.
11