subarea report 3-11-05
TRANSCRIPT

Krome Avenue TodayKrome Avenue TodayKrome Avenue Today
Krome Avenue 1900’sKrome Avenue 1900Krome Avenue 1900’’ss
PROJECT DEVELOPMENT & ENVIRONMENT STUDYSR 997 / SW 177TH AVENUE / KROME AVENUE SOUTH
From SW 296th Street (Avocado Drive) to SW 136th Street (Howard Drive)
SUB-AREA MODEL VALIDATION REPORT AND DEVELOPMENT OF DESIGN HOUR VOLUMES
PROJECT DEVELOPMENT & ENVIRONMENT STUDYSR 997 / SW 177TH AVENUE / KROME AVENUE SOUTH
From SW 296th Street (Avocado Drive) to SW 136th Street (Howard Drive)
SUBSUB--AREA MODEL VALIDATION REPORT AND AREA MODEL VALIDATION REPORT AND DEVELOPMENT OF DESIGN HOUR VOLUMESDEVELOPMENT OF DESIGN HOUR VOLUMES
April 2005April 2005
FLORIDA DEPARTMENT OF TRANSPORTATIONDistrict VI1000 NW 111th AvenueMiami, Florida 33172
FM Number (s): 249614-4-22-01FAP No. : Not AssignedMiami-Dade County
FLORIDA DEPARTMENT OF TRANSPORTATIONDistrict VI1000 NW 111th AvenueMiami, Florida 33172
FM Number (s): 249614-4-22-01FAP No. : Not AssignedMiami-Dade County

PROJECT DEVELOPMENT & ENVIRONMENT STUDY SR 997 / KROME AVENUE / SW 177TH AVENUE
FROM SW 296TH STREET TO US 27 (OKEECHOBEE ROAD)
SUB-AREA MODEL VALIDATION REPORT AND DEVELOPMENT OF DESIGN HOUR VOLUMES
Submitted to:
Florida Department of Transportation District VI
Submitted by: URS Corporation Southern
April 2005

Model Validation Report SR-997/Krome Avenue South PD&E Study
ii
TABLE OF CONTENTS Section Page
1.0 Introduction..............................................................................1
2.0 Model Validation Considerations......................................... 3
2.1 Sub-Area Model Validation for the Krome Avenue Study Area.... 3 2.2 Field Inventory/Data Collection ........................................... 4 2.3 Study Area Network Adjustments ...................................... 13 2.4 Year 2004 Model Results ................................................. 15
3.0 Future Year Travel Demand....................................................20
3.1 Corridor Alternatives ..............................................................20 3.2 Network, Area, and Facility Type Adjustments.........................20 3.3 Opening Year 2010................................................................22 3.4 Future Year 2030...................................................................36 3.5 Directional Design Hour Volumes............................................50
3.5.1 K Factor ....................................................................50 3.5.2 Directional Factor.......................................................50 3.5.3 Truck Factor ..............................................................54
Appendix A Methodology Papers Appendix B Land Use Update Documentation Appendix C Model Volume Adjustment Procedures
LIST OF TABLES Table Page 2.1-A 1999 Model to 1999 Count Comparison.........................................4 2.2-A Land Use Information ..................................................................7 2.2-B Base Year 2004 Model ZDATA1 and ZDATA2 ............................... 11 2.2-C DRI Information ........................................................................ 12 2.4-A Base Year 2004 Model Volumes to Count Ratio............................ 15 3.2-A Area Type and Facility Type Descriptions..................................... 21 3.3-A Opening Year 2010 Model ZDATA1 and ZDATA2.......................... 23 3.3-B AADT Comparison for 2010 FSUTMS Model Scenarios .................. 23 3.4-A Opening Year 2030 Model ZDATA1 and ZDATA2.......................... 37 3.4-B AADT Comparison for 2030 FSUTMS Model Scenarios .................. 37 3.5-A K30 Observed Minimum/Maximum Values .................................... 51 3.5-B D30 Observed Minimum/Maximum Values .................................... 52 3.5-C Directional Distribution from 2003/2004 Traffic Counts ................ 53 3.5-D T24 Factors ................................................................................ 55

Model Validation Report SR-997/Krome Avenue South PD&E Study
iii
LIST OF EXHIBITS Exhibit Page 1.0-A Project Location Map ...................................................................2 2.2-A Traffic Analysis Zone Location Map ...............................................5 2.3-A Centroid Relocation Map ............................................................ 14 2.4-A Base Year 2004 Validation - AADT .............................................. 16 2.4-B Base Year 2004 Validation - AADT .............................................. 17 2.4-C Base Year 2004 Validation - AADT .............................................. 18 2.4-D Base Year 2004 Validation - AADT .............................................. 19 3.3-A Opening Year 2010 No-Build - AADT ........................................... 24 3.3-B Opening Year 2010 No-Build - AADT ........................................... 25 3.3-C Opening Year 2010 No-Build - AADT ........................................... 26 3.3-D Opening Year 2010 No-Build - AADT ........................................... 27 3.3-E Opening Year 2010 Two-Lane Enhanced - AADT.......................... 28 3.3-F Opening Year 2010 Two-Lane Enhanced - AADT.......................... 29 3.3-G Opening Year 2010 Two-Lane Enhanced - AADT.......................... 30 3.3-H Opening Year 2010 Two-Lane Enhanced - AADT.......................... 31 3.3-I Opening Year 2010 Four-Lane - AADT......................................... 32 3.3-J Opening Year 2010 Four-Lane - AADT......................................... 33 3.3-K Opening Year 2010 Four-Lane - AADT......................................... 34 3.3-L Opening Year 2010 Four-Lane - AADT......................................... 35 3.4-A Future Year 2030 No-Build - AADT.............................................. 38 3.4-B Future Year 2030 No-Build - AADT.............................................. 39 3.4-C Future Year 2030 No-Build - AADT.............................................. 40 3.4-D Future Year 2030 No-Build - AADT.............................................. 41 3.4-E Future Year 2030 Two-Lane Enhanced - AADT ............................ 42 3.4-F Future Year 2030 Two-Lane Enhanced - AADT ............................ 43 3.4-G Future Year 2030 Two-Lane Enhanced - AADT ............................ 44 3.4-H Future Year 2030 Two-Lane Enhanced - AADT ............................ 45 3.4-I Future Year 2030 Four-Lane - AADT ........................................... 46 3.4-J Future Year 2030 Four-Lane - AADT ........................................... 47 3.4-K Future Year 2030 Four-Lane - AADT ........................................... 48 3.4-L Future Year 2030 Four-Lane - AADT ........................................... 49

Model Validation Report SR-997/Krome Avenue South PD&E Study
Page 1
1.0 Introduction
The purpose of this memorandum is to present the findings of the sub-area travel demand model validation study done in support of the Project Development and Environment (PD&E) study for the SR 997 (Krome Avenue) corridor. This study includes the section of Krome Avenue from SW 296th Street to Okeechobee Road. The efforts performed as part of this study and summarized in this report include field inventory/data collection of existing land uses in the study area, data analysis, travel demand modeling of existing and future conditions, and development of design hour volumes. This effort is in accordance with specific Florida Department of Transportation (FDOT) procedures and technical criteria used to forecast traffic demand.1
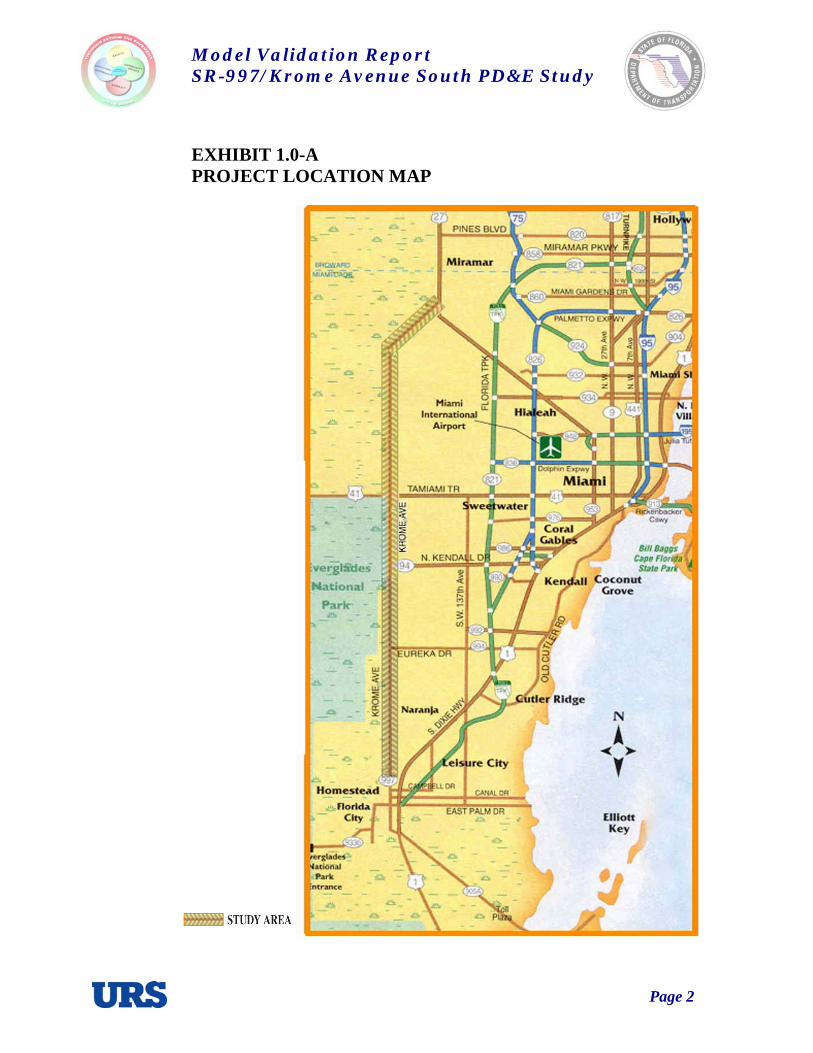
The sub-area roadways and intersections have been identified based on approximately a one-mile radius of influence around the corridor, as depicted on Exhibit 1.0-A. This technical memorandum includes the following sections:
• Base Year Model Validation,
• Future Travel Demand Projections, and
• Development of Design Hour Traffic Projections (to be provided after approval of K, D, and T factors).
1 Sources and references used:
• National Cooperative Highway Research Program Report 255, “Highway Traffic Data for Urbanized Area Project Planning and Design,” December 1982.
• Model Validation and Reasonableness Checking Manual, Barton-Aschman Associates, Inc. and Cambridge Systematics, Inc., prepared for TMIP and FHWA, 1997.
• Project Traffic Forecasting Handbook, Florida Department of Transportation. • FDOT Project Traffic Forecasting Procedure 525-030-120.
Model Validation Report SR-997/Krome Avenue South PD&E Study
Page 2
EXHIBIT 1.0-A PROJECT LOCATION MAP

Model Validation Report SR-997/Krome Avenue South PD&E Study
Page 3
2.0 Model Validation Considerations
Project model validation is the process by which the selected regional travel demand model is refined until it closely replicates existing travel patterns within the study area. Base year model runs are compared against observed base year ground counts. Usually, a set of refinements for a specific study area are required in order to ensure that the model is reasonably replicating the existing conditions as observed from the traffic counts.
The travel demand model used to develop future travel projections is the Miami-Dade Planning Area Model. The Miami-Dade model is based on the Florida Standard Urban Transportation Modeling Structure (FSUTMS). The model is recognized by FDOT and area Metropolitan Planning Organizations (MPOs) as one of the accepted travel demand modeling tools for the Miami-Dade region.
The Miami-Dade modeling area is specific to Miami-Dade County. The Miami-Dade Planning Area Model was originally validated to reflect year 1999 conditions. It should be noted that the Miami-Dade MPO recently released updated socioeconomic data projections for the year 2000 Miami-Dade Planning Area Model validation, as well as for the years 2015 and 2030. The zone structure used in the new socioeconomic data is consistent with the 1999 model’s zonal structure. These socioeconomic data projections precede the release of the MPO’s updated travel demand model, due for release in early 2005.
2.1 Sub-Area Model Validation for the Krome Avenue Study Area
Based on an evaluation of the 1999 model traffic volumes, it was evident that a sub-area model validation would be required for the Krome Avenue study area, given the disparity between existing counts and 1999 model results. A comparison of the existing counts against the model results in the study area is included in Table 2.1-A. As seen in this table, the counts in the study area (on the average) were significantly higher than the model results. After discussion and coordination efforts with District VI and the URS project team, the methodology for the validation effort was agreed upon. This methodology is included in Appendix A. The validation will result in a base model year 2004. Prior to running the model, it was necessary to convert the socioeconomic data for the 2000 model to the year 2004. This step was accomplished by interpolating the socioeconomic data between the years 2000 and 2015.
Model Validation Report SR-997/Krome Avenue South PD&E Study
Page 4
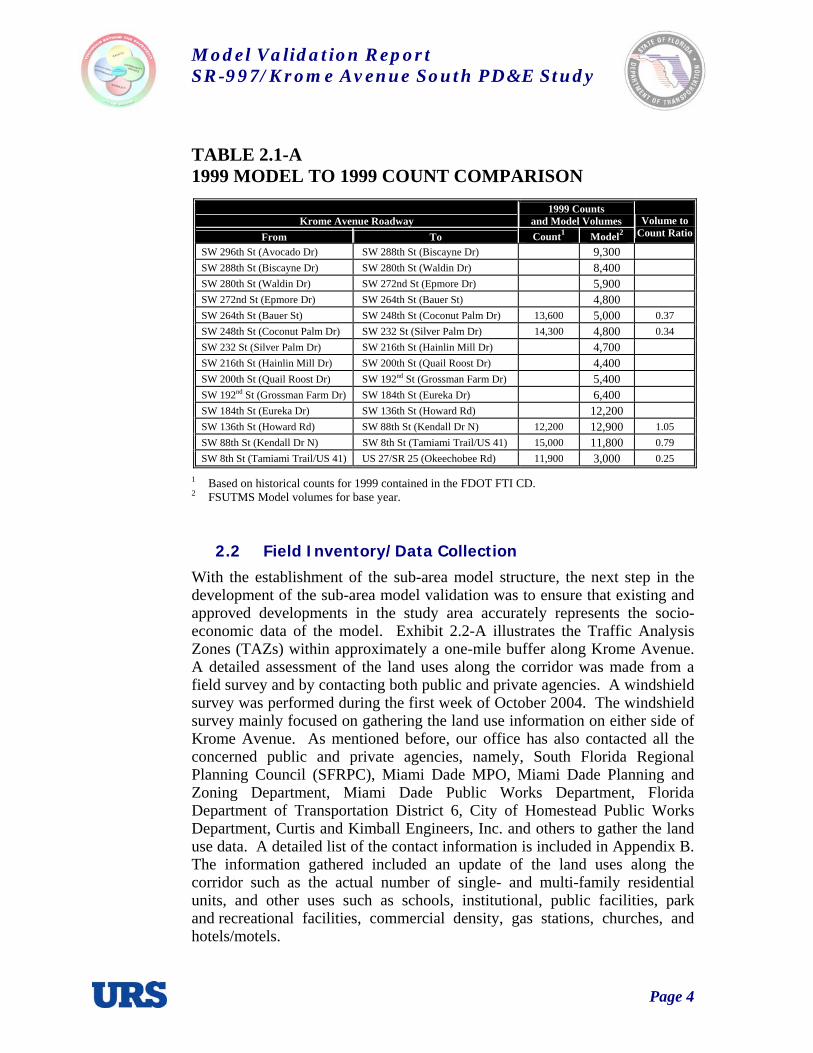
TABLE 2.1-A 1999 MODEL TO 1999 COUNT COMPARISON
Krome Avenue Roadway 1999 Counts
and Model Volumes From To Count1 Model2
Volume to Count Ratio
SW 296th St (Avocado Dr) SW 288th St (Biscayne Dr) 9,300 SW 288th St (Biscayne Dr) SW 280th St (Waldin Dr) 8,400 SW 280th St (Waldin Dr) SW 272nd St (Epmore Dr) 5,900 SW 272nd St (Epmore Dr) SW 264th St (Bauer St) 4,800 SW 264th St (Bauer St) SW 248th St (Coconut Palm Dr) 13,600 5,000 0.37 SW 248th St (Coconut Palm Dr) SW 232 St (Silver Palm Dr) 14,300 4,800 0.34 SW 232 St (Silver Palm Dr) SW 216th St (Hainlin Mill Dr) 4,700 SW 216th St (Hainlin Mill Dr) SW 200th St (Quail Roost Dr) 4,400 SW 200th St (Quail Roost Dr) SW 192nd St (Grossman Farm Dr) 5,400 SW 192nd St (Grossman Farm Dr) SW 184th St (Eureka Dr) 6,400 SW 184th St (Eureka Dr) SW 136th St (Howard Rd) 12,200 SW 136th St (Howard Rd) SW 88th St (Kendall Dr N) 12,200 12,900 1.05 SW 88th St (Kendall Dr N) SW 8th St (Tamiami Trail/US 41) 15,000 11,800 0.79 SW 8th St (Tamiami Trail/US 41) US 27/SR 25 (Okeechobee Rd) 11,900 3,000 0.25
1 Based on historical counts for 1999 contained in the FDOT FTI CD. 2 FSUTMS Model volumes for base year.
2.2 Field Inventory/Data Collection
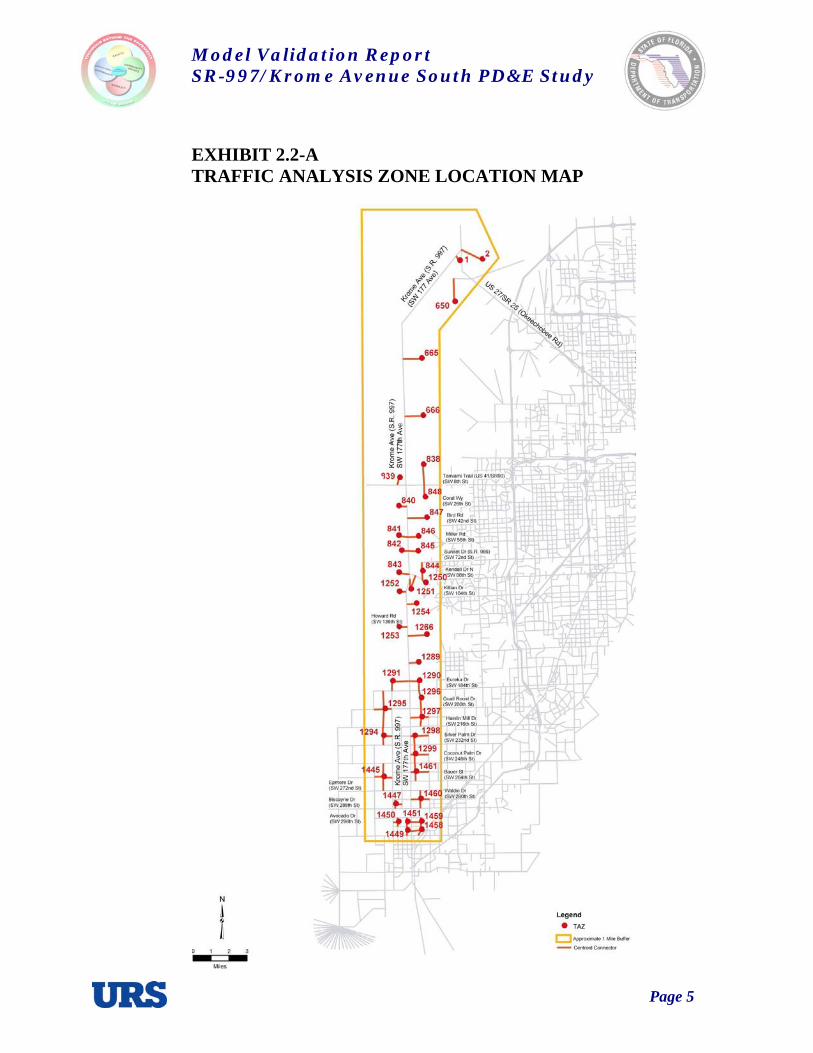
With the establishment of the sub-area model structure, the next step in the development of the sub-area model validation was to ensure that existing and approved developments in the study area accurately represents the socio-economic data of the model. Exhibit 2.2-A illustrates the Traffic Analysis Zones (TAZs) within approximately a one-mile buffer along Krome Avenue. A detailed assessment of the land uses along the corridor was made from a field survey and by contacting both public and private agencies. A windshield survey was performed during the first week of October 2004. The windshield survey mainly focused on gathering the land use information on either side of Krome Avenue. As mentioned before, our office has also contacted all the concerned public and private agencies, namely, South Florida Regional Planning Council (SFRPC), Miami Dade MPO, Miami Dade Planning and Zoning Department, Miami Dade Public Works Department, Florida Department of Transportation District 6, City of Homestead Public Works Department, Curtis and Kimball Engineers, Inc. and others to gather the land use data. A detailed list of the contact information is included in Appendix B. The information gathered included an update of the land uses along the corridor such as the actual number of single- and multi-family residential units, and other uses such as schools, institutional, public facilities, park and recreational facilities, commercial density, gas stations, churches, and hotels/motels.
Model Validation Report SR-997/Krome Avenue South PD&E Study
Page 5
EXHIBIT 2.2-A TRAFFIC ANALYSIS ZONE LOCATION MAP

Model Validation Report SR-997/Krome Avenue South PD&E Study
Page 6
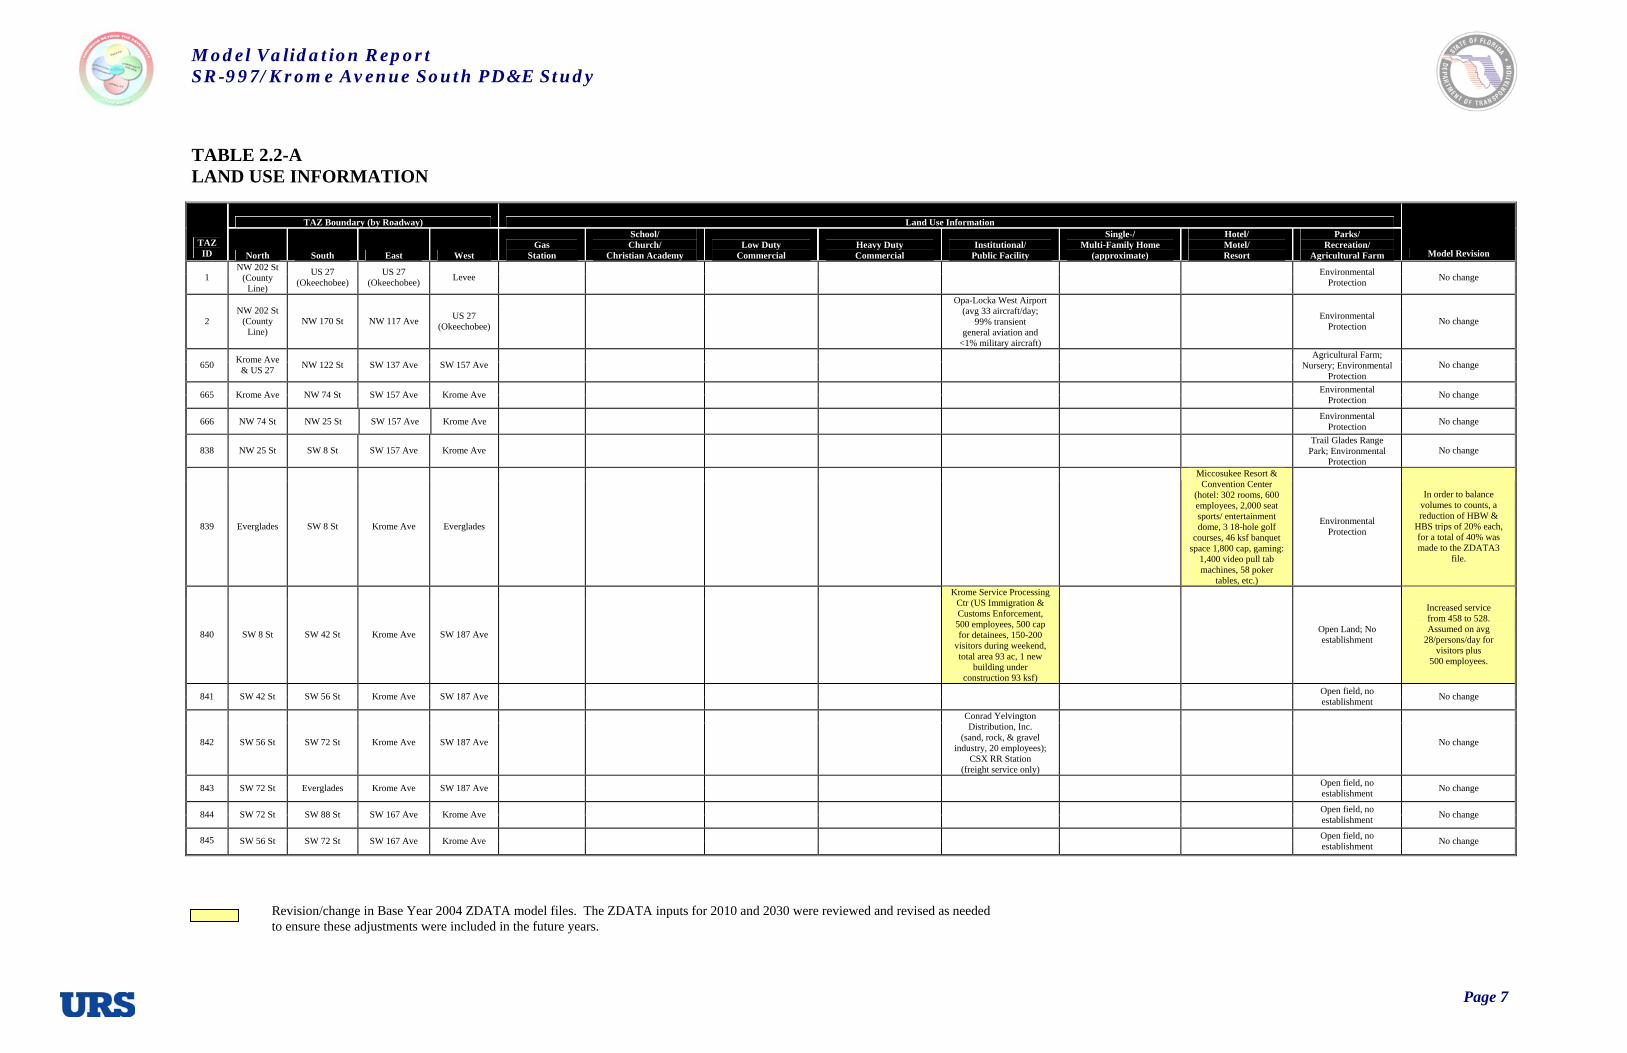
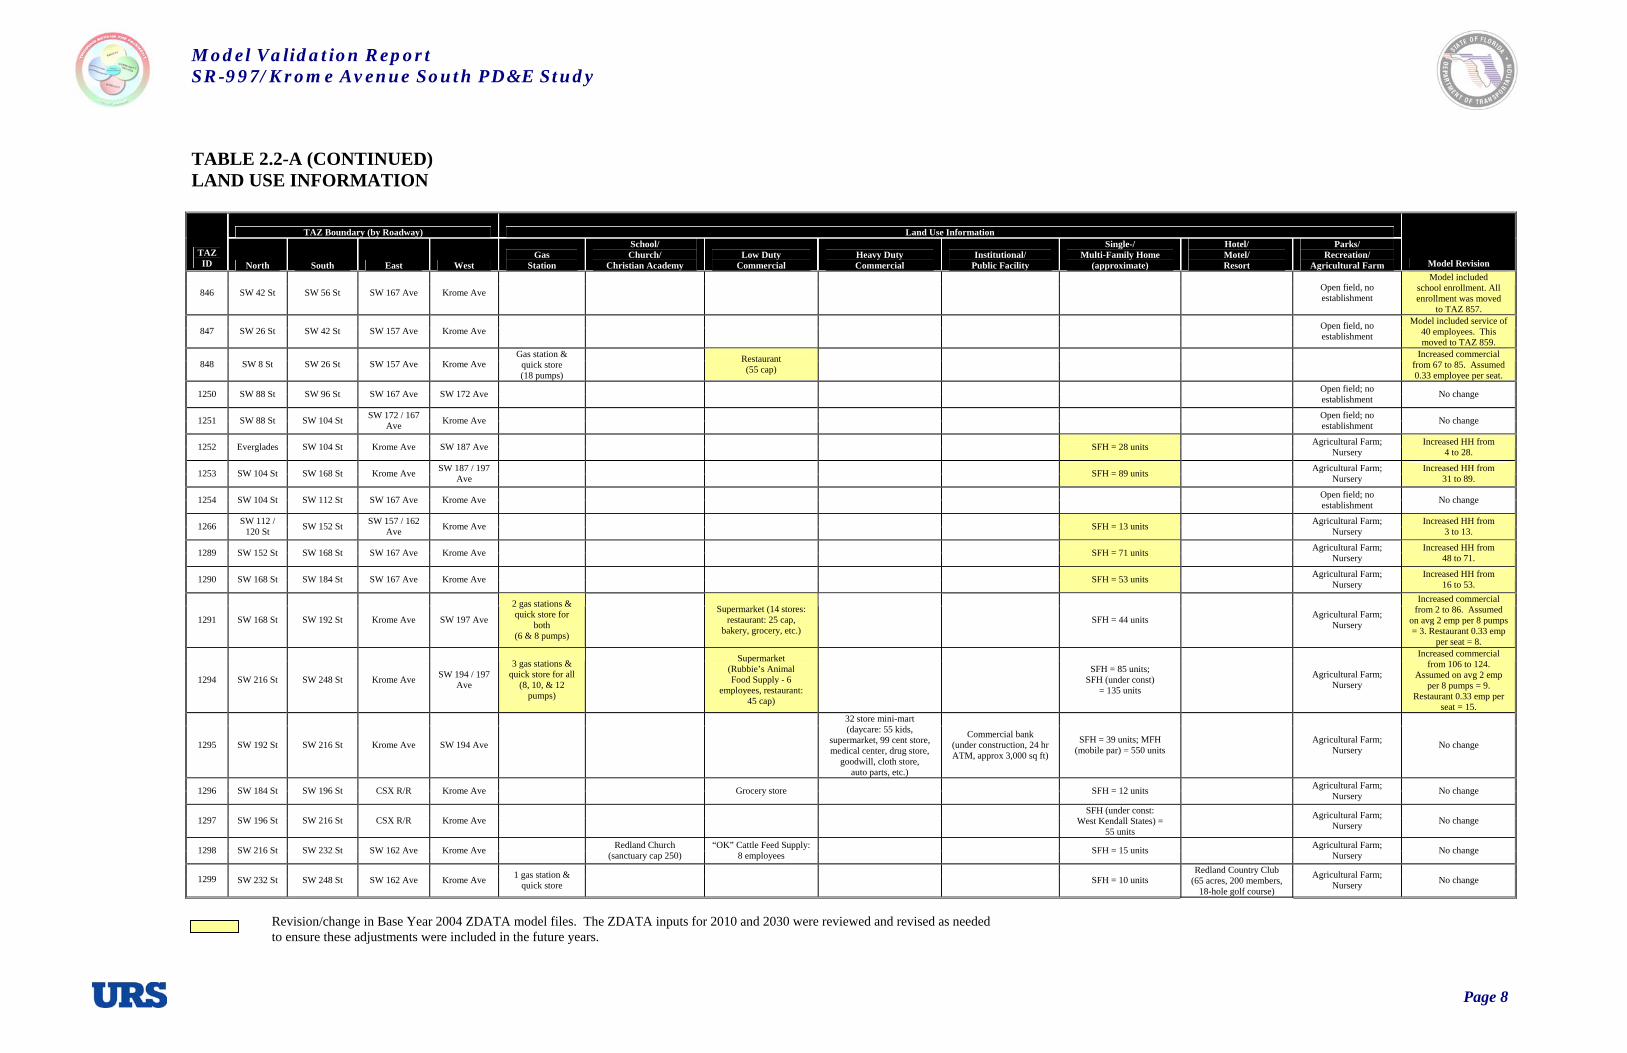
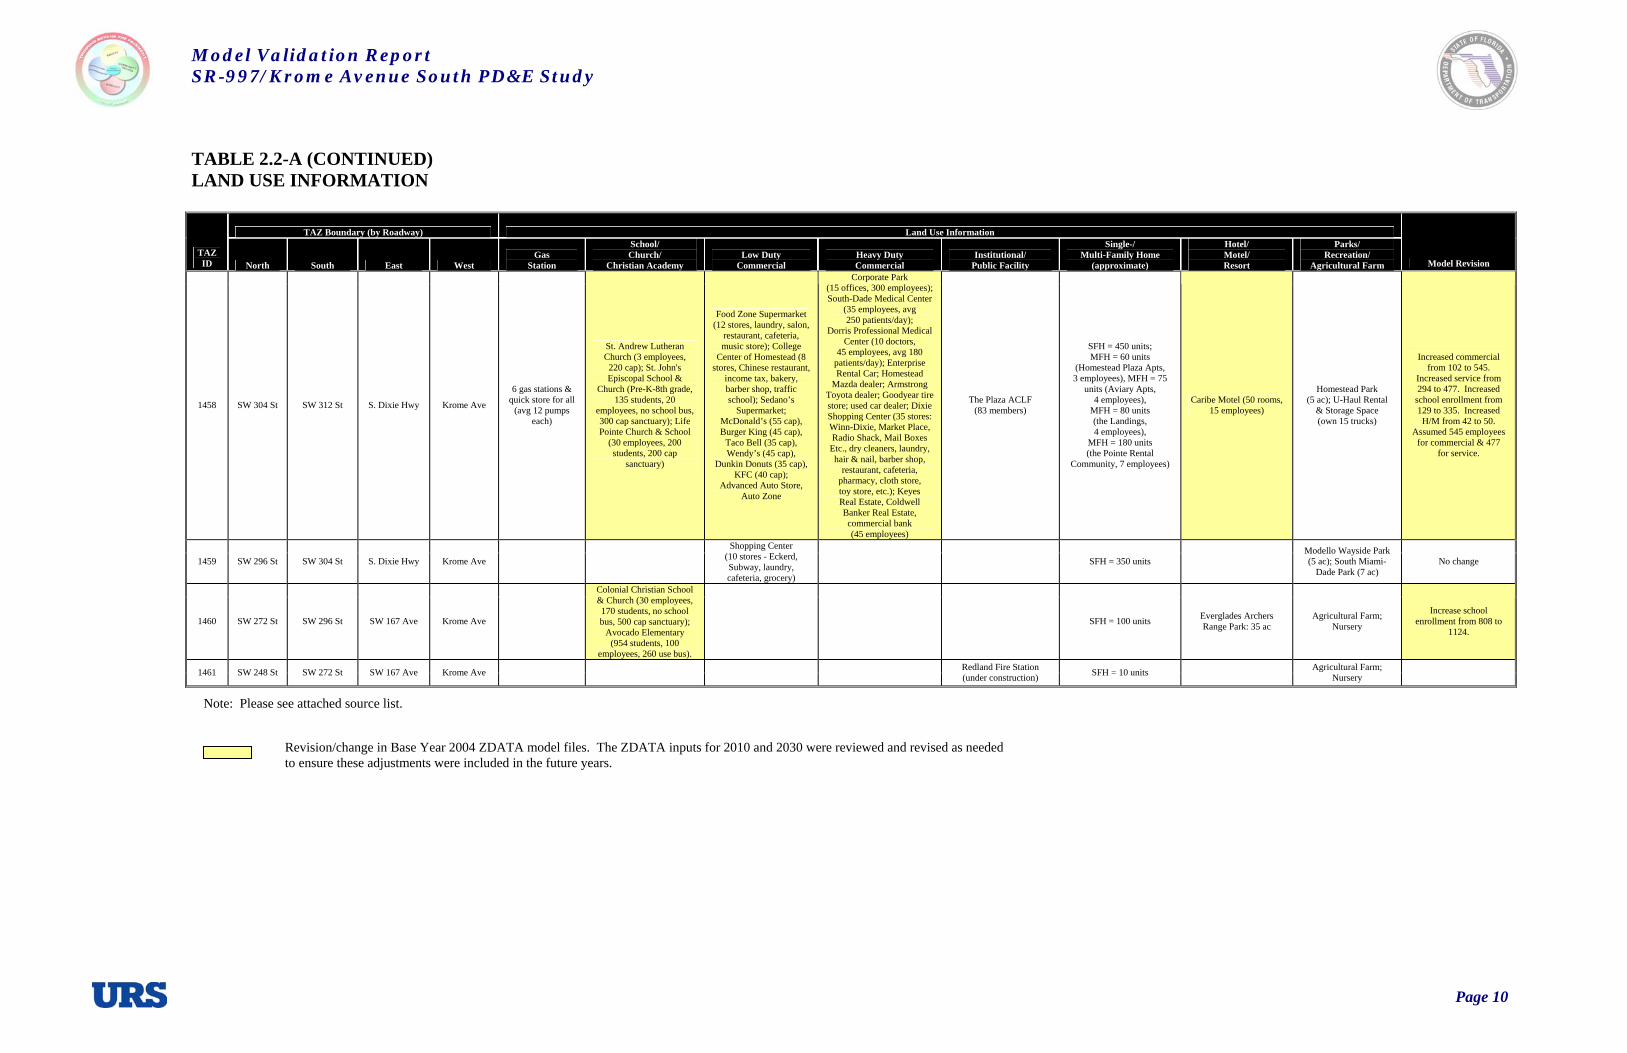
Table 2.2-A describes (for each TAZ identified along the corridor) the boundaries along with the various types of land uses. With the information obtained from the field “truthing” of land uses, the model files ZDATA1 and ZDATA2 for the Base Year 2004 interpolated model were revised in order to properly include the actual levels of development.
Table 2.2-B provides a summary of the modifications made to the ZDATA files for the base year condition with respect to land use data collected for the TAZs identified within the sub-area. The detailed land use updates for the sub-area TAZs within the study area are included in Appendix B.
There are three proposed Developments of Regional Impact (DRIs) identified as being within close proximity of Krome Avenue. These developments include the Beacon Lakes DRI located within TAZ 832, Providence DRI located within TAZ 1254, and Kendall Town Center DRI located within TAZs 1245 and 1246. Table 2.2-C provides detailed land uses associated for each development.
Based on the information collected from the South Florida Regional Planning Council (SFRPC), to date, no activity has occurred at Beacon Lakes or Kendall Town Center DRIs, both of which have a buildout date of 2008. As for the Providence DRI, it is currently in the sufficiency stage with a buildout date of 2013. Adjustments were made to the Opening Year 2010 and Future Year 2030 ZDATA1 and ZDATA2 files to reflect these projects. No adjustments were made to the Base Year 2004 model.
Model Validation Report SR-997/Krome Avenue South PD&E Study
Page 7
TABLE 2.2-A LAND USE INFORMATION
TAZ Boundary (by Roadway) Land Use Information
TAZ ID North South East West
Gas Station
School/ Church/
Christian Academy Low Duty
Commercial Heavy Duty Commercial
Institutional/ Public Facility
Single-/ Multi-Family Home
(approximate)
Hotel/ Motel/ Resort
Parks/ Recreation/
Agricultural Farm Model Revision
1 NW 202 St
(County Line)
US 27 (Okeechobee)
US 27 (Okeechobee) Levee Environmental
Protection No change
2 NW 202 St
(County Line)
NW 170 St NW 117 Ave US 27 (Okeechobee)
Opa-Locka West Airport (avg 33 aircraft/day;
99% transient general aviation and
<1% military aircraft)
Environmental Protection No change
650 Krome Ave & US 27 NW 122 St SW 137 Ave SW 157 Ave
Agricultural Farm; Nursery; Environmental
Protection No change
665 Krome Ave NW 74 St SW 157 Ave Krome Ave Environmental Protection No change
666 NW 74 St NW 25 St SW 157 Ave Krome Ave Environmental Protection No change
838 NW 25 St SW 8 St SW 157 Ave Krome Ave Trail Glades Range
Park; Environmental Protection
No change
839 Everglades SW 8 St Krome Ave Everglades
Miccosukee Resort & Convention Center
(hotel: 302 rooms, 600 employees, 2,000 seat sports/ entertainment dome, 3 18-hole golf
courses, 46 ksf banquet space 1,800 cap, gaming:
1,400 video pull tab machines, 58 poker
tables, etc.)
Environmental Protection
In order to balance volumes to counts, a reduction of HBW &
HBS trips of 20% each, for a total of 40% was made to the ZDATA3
file.
840 SW 8 St SW 42 St Krome Ave SW 187 Ave
Krome Service Processing Ctr (US Immigration & Customs Enforcement, 500 employees, 500 cap for detainees, 150-200
visitors during weekend, total area 93 ac, 1 new
building under construction 93 ksf)
Open Land; No establishment
Increased service from 458 to 528. Assumed on avg
28/persons/day for visitors plus
500 employees.
841 SW 42 St SW 56 St Krome Ave SW 187 Ave Open field, no establishment No change
842 SW 56 St SW 72 St Krome Ave SW 187 Ave
Conrad Yelvington Distribution, Inc.
(sand, rock, & gravel industry, 20 employees);
CSX RR Station (freight service only)
No change
843 SW 72 St Everglades Krome Ave SW 187 Ave Open field, no establishment No change
844 SW 72 St SW 88 St SW 167 Ave Krome Ave Open field, no establishment No change
845 SW 56 St SW 72 St SW 167 Ave Krome Ave Open field, no establishment No change
Revision/change in Base Year 2004 ZDATA model files. The ZDATA inputs for 2010 and 2030 were reviewed and revised as needed to ensure these adjustments were included in the future years.
Model Validation Report SR-997/Krome Avenue South PD&E Study TABLE 2.2-A (CONTINUED) LAND USE INFORMATION
Page 8
TAZ Boundary (by Roadway) Land Use Information
TAZ ID North South East West
Gas Station
School/ Church/
Christian Academy Low Duty
Commercial Heavy Duty Commercial
Institutional/ Public Facility
Single-/ Multi-Family Home
(approximate)
Hotel/ Motel/ Resort
Parks/ Recreation/
Agricultural Farm Model Revision
846 SW 42 St SW 56 St SW 167 Ave Krome Ave Open field, no establishment
Model included school enrollment. All enrollment was moved
to TAZ 857.
847 SW 26 St SW 42 St SW 157 Ave Krome Ave Open field, no establishment
Model included service of 40 employees. This moved to TAZ 859.
848 SW 8 St SW 26 St SW 157 Ave Krome Ave Gas station &
quick store (18 pumps)
Restaurant (55 cap)
Increased commercial from 67 to 85. Assumed 0.33 employee per seat.
1250 SW 88 St SW 96 St SW 167 Ave SW 172 Ave Open field; no establishment No change
1251 SW 88 St SW 104 St SW 172 / 167 Ave Krome Ave Open field; no
establishment No change
1252 Everglades SW 104 St Krome Ave SW 187 Ave SFH = 28 units Agricultural Farm; Nursery
Increased HH from 4 to 28.
1253 SW 104 St SW 168 St Krome Ave SW 187 / 197 Ave SFH = 89 units Agricultural Farm;
Nursery Increased HH from
31 to 89.
1254 SW 104 St SW 112 St SW 167 Ave Krome Ave Open field; no establishment No change
1266 SW 112 / 120 St SW 152 St SW 157 / 162
Ave Krome Ave SFH = 13 units Agricultural Farm; Nursery
Increased HH from 3 to 13.
1289 SW 152 St SW 168 St SW 167 Ave Krome Ave SFH = 71 units Agricultural Farm; Nursery
Increased HH from 48 to 71.
1290 SW 168 St SW 184 St SW 167 Ave Krome Ave SFH = 53 units Agricultural Farm; Nursery
Increased HH from 16 to 53.
1291 SW 168 St SW 192 St Krome Ave SW 197 Ave
2 gas stations & quick store for
both (6 & 8 pumps)
Supermarket (14 stores:
restaurant: 25 cap, bakery, grocery, etc.)
SFH = 44 units Agricultural Farm; Nursery
Increased commercial from 2 to 86. Assumed
on avg 2 emp per 8 pumps = 3. Restaurant 0.33 emp
per seat = 8.
1294 SW 216 St SW 248 St Krome Ave SW 194 / 197 Ave
3 gas stations & quick store for all
(8, 10, & 12 pumps)
Supermarket (Rubbie’s Animal Food Supply - 6
employees, restaurant: 45 cap)
SFH = 85 units;
SFH (under const) = 135 units
Agricultural Farm; Nursery
Increased commercial from 106 to 124.
Assumed on avg 2 emp per 8 pumps = 9.
Restaurant 0.33 emp per seat = 15.
1295 SW 192 St SW 216 St Krome Ave SW 194 Ave
32 store mini-mart (daycare: 55 kids,
supermarket, 99 cent store, medical center, drug store,
goodwill, cloth store, auto parts, etc.)
Commercial bank (under construction, 24 hr ATM, approx 3,000 sq ft)
SFH = 39 units; MFH (mobile par) = 550 units Agricultural Farm;
Nursery No change
1296 SW 184 St SW 196 St CSX R/R Krome Ave Grocery store SFH = 12 units Agricultural Farm; Nursery No change
1297 SW 196 St SW 216 St CSX R/R Krome Ave SFH (under const:
West Kendall States) = 55 units
Agricultural Farm; Nursery No change
1298 SW 216 St SW 232 St SW 162 Ave Krome Ave Redland Church (sanctuary cap 250)
“OK” Cattle Feed Supply: 8 employees SFH = 15 units Agricultural Farm;
Nursery No change
1299 SW 232 St SW 248 St SW 162 Ave Krome Ave 1 gas station &
quick store SFH = 10 units Redland Country Club
(65 acres, 200 members, 18-hole golf course)
Agricultural Farm; Nursery No change
Revision/change in Base Year 2004 ZDATA model files. The ZDATA inputs for 2010 and 2030 were reviewed and revised as needed to ensure these adjustments were included in the future years.

Model Validation Report SR-997/Krome Avenue South PD&E Study TABLE 2.2-A (CONTINUED) LAND USE INFORMATION
Page 9
TAZ Boundary (by Roadway) Land Use Information
TAZ ID North South East West
Gas Station
School/ Church/
Christian Academy Low Duty
Commercial Heavy Duty Commercial
Institutional/ Public Facility
Single-/ Multi-Family Home
(approximate)
Hotel/ Motel/ Resort
Parks/ Recreation/
Agricultural Farm Model Revision
1424 Flagler Ave SW 312 St SW 167 Ave Flagler Ave
Hotel Floridian (150 rooms, 79 employees); Inn of Homestead (50 rooms, 16 employees).
Increase H/M from 48 to 200. Assumed no
additional increase to Service.
1446 SW 248 St SW 272 St Krome Ave SW 197 Ave 1 gas station & quick store
28 store strip mall (restaurant: 45 cap, animal hospital, golf supply, snack
bar: 15 cap, etc.)
SFH = 15 units Agricultural Farm; Nursery
Increased commercial from 91 to 108. Assumes 2 emp per 8 pumps = 2. Restaurant 0.33 emp per
seat = 15.
1447 SW 272 St SW 292 / 296 St Krome Ave SW 197 Ave 1 gas station &
quick store
Redland Christian Academy (280 students,
35 f/t employees, 30 students use bus, 10 ac
land); Homestead Church of Christ (300 cap); First
Baptist Church of Homestead, Inc.
(300 cap, 5 employees)
Farm Country departmental store (3 stores: grocery,
fruit store)
Brooks Tropical Industry (40 ac, 150 f/t employees,
daily 20/25 trailer: 18 wheeler trips, daily
200-250 harvest vehicle trips); Homestead General
Aviation Airport (4 mi west of Krome Ave
on SW 280 St)
SFH = 150 units Cocktail Bar (cap 45 people)
Agricultural Farm; Nursery
Increased service from 74 to 224. Assumed
additional 150 employees. Increase school
enrollment from 146 to 280.
1449 SW 292 St SW 304 St SW 182 Ave SW 187 Ave Faith Church at Redland (sanctuary cap 250)
Biscayne Growers, Inc. wholesale store
Miami-Dade County Agricultural Info Center (20 employees, 250 cap
conf hall, yearly 200-225 seminar, mtg, conf)
SFH = 55 units Agricultural Farm; Nursery No change
1450 SW 292 St SW 304 St Krome Ave SW 182 Ave SFH = 50 units Agricultural Farm; Nursery No change
1451 SW 304 St SW 314 St Krome Ave SW 182 Ave
3 gas stations & departmental stores for all
(avg 12 pumps each)
First Presbyterian Church & School (K-5th grade,
79 students, 20 employees, no school bus, sanctuary
cap 450); Redland Elementary (800 students, 75 employees, 40 students
use school bus)
Charles A. Kosove Medical Center
(2 doctors, 4 employees, avg 45 patients/day);
Frank J. Spinell (Dentist, 5 employees,
20 patients/day)
First National Bank (35 employees); 10 separate
shopping complexes (total 150 stores: restaurant, cafeteria, fast food, dollar store, liquor store, small
offices at avg 10-15 employees, gift shop,
laundry, grocery, supermarket, sports shop, auto supply, animal food supply, medical center, pharmacy, book store,
animal clinic, salon, hair & nail, musical instruments,
etc.); South Miami Homestead Hospital
(120 beds, 500 employees).
Brenam Funeral Home (10 employees, 2 chapels:
500 cap, 3-5 svcs/wk, own 6 vehicles)
SFH = 400 units; MFH = 10 units (Lady M. Apts, 2 employees)
Trade Wind Motel (16 rooms, 9 employees); Belaire Motel (11 rooms,
4 employees)
South Miami Vita Park (3 ac)
Increased service from 664 to 700.
Reduced H/M from 32 to 27. Assumed additional 36 employees. Service
increase assumes medical center only. No additional employment assumed for
H/M.
Revision/change in Base Year 2004 ZDATA model files. The ZDATA inputs for 2010 and 2030 were reviewed and revised as needed to ensure these adjustments were included in the future years.
Model Validation Report SR-997/Krome Avenue South PD&E Study TABLE 2.2-A (CONTINUED) LAND USE INFORMATION
Page 10
TAZ Boundary (by Roadway) Land Use Information
TAZ ID North South East West
Gas Station
School/ Church/
Christian Academy Low Duty
Commercial Heavy Duty Commercial
Institutional/ Public Facility
Single-/ Multi-Family Home
(approximate)
Hotel/ Motel/ Resort
Parks/ Recreation/
Agricultural Farm Model Revision
1458 SW 304 St SW 312 St S. Dixie Hwy Krome Ave
6 gas stations & quick store for all
(avg 12 pumps each)
St. Andrew Lutheran Church (3 employees, 220 cap); St. John's Episcopal School &
Church (Pre-K-8th grade, 135 students, 20
employees, no school bus, 300 cap sanctuary); Life Pointe Church & School
(30 employees, 200 students, 200 cap
sanctuary)
Food Zone Supermarket (12 stores, laundry, salon,
restaurant, cafeteria, music store); College
Center of Homestead (8 stores, Chinese restaurant,
income tax, bakery, barber shop, traffic school); Sedano’s
Supermarket; McDonald’s (55 cap), Burger King (45 cap),
Taco Bell (35 cap), Wendy’s (45 cap),
Dunkin Donuts (35 cap), KFC (40 cap);
Advanced Auto Store, Auto Zone
Corporate Park (15 offices, 300 employees); South-Dade Medical Center
(35 employees, avg 250 patients/day);
Dorris Professional Medical Center (10 doctors,
45 employees, avg 180 patients/day); Enterprise Rental Car; Homestead
Mazda dealer; Armstrong Toyota dealer; Goodyear tire store; used car dealer; Dixie Shopping Center (35 stores: Winn-Dixie, Market Place, Radio Shack, Mail Boxes
Etc., dry cleaners, laundry, hair & nail, barber shop,
restaurant, cafeteria, pharmacy, cloth store, toy store, etc.); Keyes Real Estate, Coldwell Banker Real Estate, commercial bank (45 employees)
The Plaza ACLF (83 members)
SFH = 450 units; MFH = 60 units
(Homestead Plaza Apts, 3 employees), MFH = 75
units (Aviary Apts, 4 employees),
MFH = 80 units (the Landings, 4 employees),
MFH = 180 units (the Pointe Rental
Community, 7 employees)
Caribe Motel (50 rooms, 15 employees)
Homestead Park (5 ac); U-Haul Rental
& Storage Space (own 15 trucks)
Increased commercial from 102 to 545.
Increased service from 294 to 477. Increased
school enrollment from 129 to 335. Increased H/M from 42 to 50.
Assumed 545 employees for commercial & 477
for service.
1459 SW 296 St SW 304 St S. Dixie Hwy Krome Ave
Shopping Center (10 stores - Eckerd, Subway, laundry, cafeteria, grocery)
SFH = 350 units Modello Wayside Park (5 ac); South Miami-
Dade Park (7 ac) No change
1460 SW 272 St SW 296 St SW 167 Ave Krome Ave
Colonial Christian School & Church (30 employees, 170 students, no school bus, 500 cap sanctuary);
Avocado Elementary (954 students, 100
employees, 260 use bus).
SFH = 100 units Everglades Archers Range Park: 35 ac
Agricultural Farm; Nursery
Increase school enrollment from 808 to
1124.
1461 SW 248 St SW 272 St SW 167 Ave Krome Ave Redland Fire Station (under construction) SFH = 10 units Agricultural Farm;
Nursery
Note: Please see attached source list.
Revision/change in Base Year 2004 ZDATA model files. The ZDATA inputs for 2010 and 2030 were reviewed and revised as needed to ensure these adjustments were included in the future years.

Model Validation Report SR-997/Krome Avenue South PD&E Study
Page 11
TABLE 2.2-B BASE YEAR 2004 MODEL ZDATA1 AND ZDATA2 REVISIONS1
2004 Model Categories Original Revised2
Percent Increase
Households without Children (Dwelling Units) 4,243 4,325 1.9 Households with Children (Dwelling Units) 3,042 3,112 2.3 Vehicles in Households without Children (Vehicles) 8,098 8,261 2.0 Vehicles in Households with Children (Vehicles) 8,065 8,242 2.2 Workers in Households without Children (Workers) 6,218 6,342 2.0 Workers in Households with Children (Workers) 5,694 5,815 2.1 Persons in Households without Children (Persons) 9,124 9,303 2.0 Persons in Households with Children (Persons) 12,846 13,126 2.2
ZDATA1
“ALL”-Type Occupied Hotel/Motel Rooms (Rooms) 397 591 48.9 Industrial Employment (Employees) 2,923 2,923 0.0 Commercial Employment (Employees) 2,390 2,970 24.3 Service Employment (Employees) 4,766 5,165 8.4 Total Employment (Employees) 10,079 11,058 9.7
ZDATA2
School Enrollment (Enrollment) 3,940 4,118 4.5 1 Table reflects only the data of the TAZs in the Krome Avenue study area. 2 Revisions were only made to the TAZs within the study area.

Model Validation Report SR-997/Krome Avenue South PD&E Study
Page 12
TABLE 2.2-C DRI INFORMATION
Construction
Date Name Project Location Proposed Land Use Begin End Contact Information
Kendall Town Center DRI
Roadway Boundary: SW 88th St to North, SW 96th St to South, SW 157th Ave to East, and SW 162nd Ave to West
Total 158 acres. Land Use: Retail (1,350 ksf), Municipal (50 ksf), Office Building (300 ksf), Community Medical Facility (200 ksf), Community Recreation Center (50 ksf), Assisted Living Facility for Seniors (200 du’s), Movie Theaters without Matinee (10-12 screens and 2,400 seats), Hotel (200 rooms), Transit Hub (1 acre), Public Area (10 acres)
2001 2008
Approved Applicant: West
Kendall Center, L.P. 2655 LeJeune Road
Suite 514 Coral Gables, FL 33134
Contact Person: Ann E. Pope
Approved Applicant: C/WDL, Ltd.
Two Alhambra Plaza, PH-2
Coral Gables, FL 33134 Beacon Lakes DRI
Roadway Boundary: NW 25th St to North, NW 12th St to South, Florida’s Turnpike to East, and NW 137th Ave to West
Total 436 Acres. Land Use: Industrial Warehouse Space (6,600 ksf), Retail (75 ksf), Office (150 ksf)
2001 2008 Authorized Agent Rafael Rodon, P.E.,
President Codina Consulting, Inc. Two Alhambra Plaza,
PH-II Coral Gables, FL 33134
Providence DRI
Roadway Boundary: SW 104th St to North, SW 120th St to South, SW 167th Ave to East, and Krome Ave to West
Total 900 acres. Land Use: Multi-family residential townhomes (5,500 du’s), Retail (450 ksf), Office (250 ksf), Civic Community for Police, Fire, and Library (100 ksf), School: K-8th grade for 2,600 students, High School for 3,000 students, College/university for 1,000 FTE Students
2005 2013
Not Yet Approved Currently in the
pre-application stage, expected to submit the
final application by 10/31/04. Applicant:
D.R. Horton Homes Planning Consultant:
Curtis & Kimball Contact Person: Mr. Rob Curtis 305.669.3172
Model Validation Report SR-997/Krome Avenue South PD&E Study
Page 13
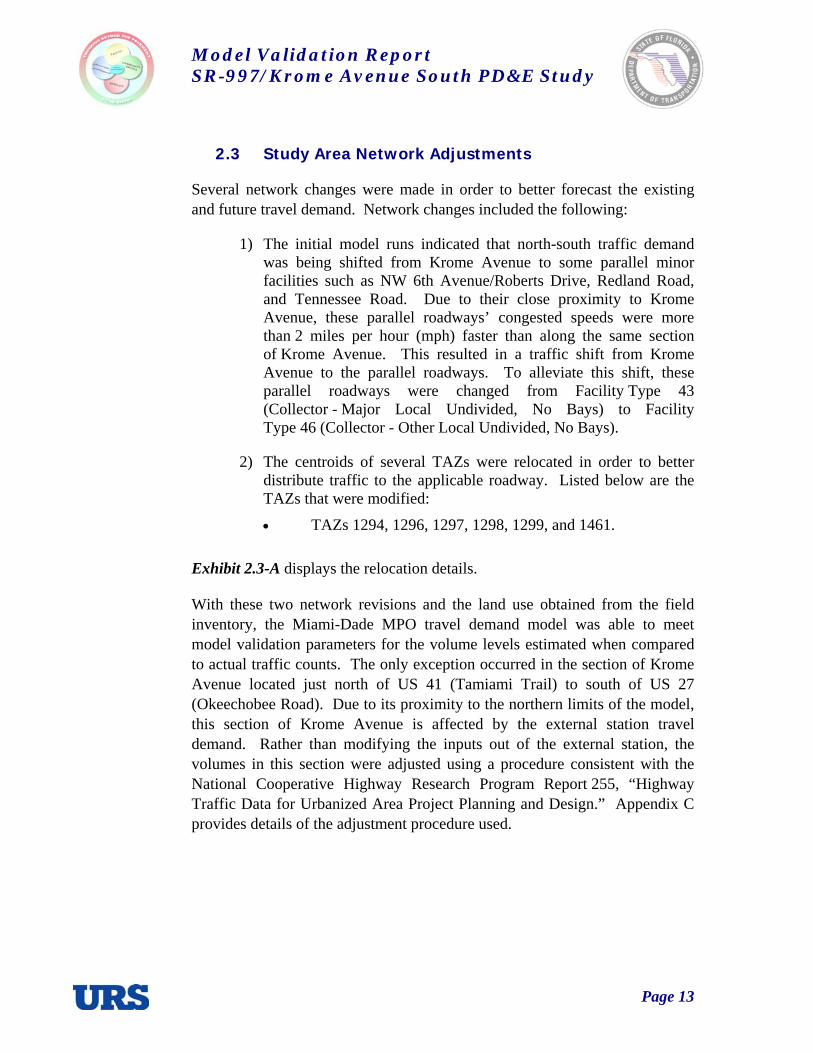
2.3 Study Area Network Adjustments
Several network changes were made in order to better forecast the existing and future travel demand. Network changes included the following:
1) The initial model runs indicated that north-south traffic demand was being shifted from Krome Avenue to some parallel minor facilities such as NW 6th Avenue/Roberts Drive, Redland Road, and Tennessee Road. Due to their close proximity to Krome Avenue, these parallel roadways’ congested speeds were more than 2 miles per hour (mph) faster than along the same section of Krome Avenue. This resulted in a traffic shift from Krome Avenue to the parallel roadways. To alleviate this shift, these parallel roadways were changed from Facility Type 43 (Collector - Major Local Undivided, No Bays) to Facility Type 46 (Collector - Other Local Undivided, No Bays).
2) The centroids of several TAZs were relocated in order to better distribute traffic to the applicable roadway. Listed below are the TAZs that were modified:
• TAZs 1294, 1296, 1297, 1298, 1299, and 1461.
Exhibit 2.3-A displays the relocation details.
With these two network revisions and the land use obtained from the field inventory, the Miami-Dade MPO travel demand model was able to meet model validation parameters for the volume levels estimated when compared to actual traffic counts. The only exception occurred in the section of Krome Avenue located just north of US 41 (Tamiami Trail) to south of US 27 (Okeechobee Road). Due to its proximity to the northern limits of the model, this section of Krome Avenue is affected by the external station travel demand. Rather than modifying the inputs out of the external station, the volumes in this section were adjusted using a procedure consistent with the National Cooperative Highway Research Program Report 255, “Highway Traffic Data for Urbanized Area Project Planning and Design.” Appendix C provides details of the adjustment procedure used.

Model Validation Report SR-997/Krome Avenue South PD&E Study
Page 14
EXHIBIT 2.3-A CENTROID RELOCATION MAP

Model Validation Report SR-997/Krome Avenue South PD&E Study
Page 15
2.4 Year 2004 Model Results
Table 2.4-A provides a comparison of the average daily traffic volumes between the model result and the counts, as well as the volume to count ratio. As seen in this table, the updated 2004 model is now closely replicating the traffic counts and can be considered validated and adequate for use as the basis for projection of future travel demand. The model results for the study area links are included on Exhibits 2.4-A through 2.4-D.
TABLE 2.4-A BASE YEAR 2004 MODEL VOLUMES TO COUNT RATIO
Krome Avenue Roadway
From To 2004 Model Link AADT
2003/2004 Counts
Volume to Count Ratio
SW 296th St (Avocado Dr) SW 288th St (Biscayne Dr) 15,200 13,900 1.09 SW 288th St (Biscayne Dr) SW 280th St (Waldin Dr) 15,500 12,700 1.22 SW 280th St (Waldin Dr) SW 272nd St (Epmore Dr) 14,500 14,800 0.98 SW 272nd St (Epmore Dr) SW 264th St (Bauer St) 15,400 15,400 1.00 SW 264th St (Bauer St) SW 248th St (Coconut Palm Dr) 15,500 14,500 1.07 SW 248th St (Coconut Palm Dr) SW 232 St (Silver Palm Dr) 15,300 15,900 0.96 SW 232 St (Silver Palm Dr) SW 216th St (Hainlin Mill Dr) 15,400 16,100 0.96 SW 216th St (Hainlin Mill Dr) SW 200th St (Quail Roost Dr) 14,000 14,400 0.97 SW 200th St (Quail Roost Dr) SW 184th St (Eureka Dr) 14,000 14,800 0.95 SW 184th St (Eureka Dr) SW 136th St (Howard Rd) 18,000 17,300 1.04 SW 136th St (Howard Rd) SW 88th St (Kendall Dr N) 18,700 15,500 1.21
17,900 15,700 1.14 SW 88th St (Kendall Dr N) SW 8th St (Tamiami Trail/US 41) 17,700 14,100 1.26 8,400 8,000 1.05 SW 8th St (Tamiami Trail/US 41) US 27/SR 25 (Okeechobee Rd) 6,100 8,700 0.70
Average Volume/Count Ratio 1.04

Model Validation Report SR-997/Krome Avenue South PD&E Study
Page 16
EXHIBIT 2.4-A BASE YEAR 2004 VALIDATION – AADT

Model Validation Report SR-997/Krome Avenue South PD&E Study
Page 17
EXHIBIT 2.4-B BASE YEAR 2004 VALIDATION – AADT

Model Validation Report SR-997/Krome Avenue South PD&E Study
Page 18
EXHIBIT 2.4-C BASE YEAR 2004 VALIDATION - AADT

Model Validation Report SR-997/Krome Avenue South PD&E Study
Page 19
EXHIBIT 2.4-D BASE YEAR 2004 VALIDATION - AADT
Model Validation Report SR-997/Krome Avenue South PD&E Study
Page 20
3.0 Future Year Travel Demand
The next step in the study effort consisted of estimating the travel demand for the analysis years, namely:
• Opening Year (2010),
• Intermediate Year (2020), and
• Design Year (2030).
3.1 Corridor Alternatives
The following network alternatives were considered for each of the analysis years:
1) No-Build Alternative: Maintains the existing two-lane geometry for the entire section of Krome Avenue.
2) Two-Lane Enhanced Alternative: Two-lane geometry with enhancements, representative of Transportation System Management (TSM) or safety-related improvements which can include intersection improvements, signal optimization timings, and/or a continuous middle lane. These types of improvements will not necessarily provide a great deal of additional capacity but will result in a safer roadway and more efficient traffic operations.
3) Four-Lane Alternative: This alternative assumes that four lanes (two lanes in each direction) will be built throughout the study limits (from SW 296th Street to Okeechobee Road).
3.2 Network, Area, and Facility Type Adjustments
The specific FSUTMS area types (AT) and facility types (FT) to be applied in the development of the three corridor alternatives along Krome Avenue are shown in Table 3.2-A.

Model Validation Report SR-997/Krome Avenue South PD&E Study
Page 21
TABLE 3.2-A AREA TYPE AND FACILITY TYPE DESCRIPTIONS
Categories AT 32 Residential Areas - Undeveloped Portions of Urbanized Areas AT 51 Rural Areas - Developed Rural Areas/Small Cities under 5,000 Population FT 21 Divided Arterial - Divided Arterial Unsignalized (55 mph) FT 22 Divided Arterial - Divided Arterial Unsignalized (45 mph) FT 23 Divided Arterial - Divided Arterial Class Ia FT 31 Undivided Arterial - Undivided Arterial Unsignalized with Turn Bays FT 32 Undivided Arterial - Undivided Arterial Class Ia with Turn Bays FT 33 Undivided Arterial - Undivided Arterial Class Ib with Turn Bays
Source: Highway Network (HNET) Procedural Enhancement Study, Executive Summary, March 1998.
No-Build Alternative • AT 51 - From US 27 (Okeechobee Road) to north of
Biscayne Drive (SW 288th Street),
• AT 32 - From Biscayne Drive (SW 288th Street) to Avocado Drive (SW 296th Street),
• FT 31 - From US 27 (Okeechobee Road) to north of Eureka Drive (SW 184th Street),
• FT 32 - From Eureka Drive (SW 184th Street) to north of Biscayne Drive (SW 288th Street), and
• FT 33 - From Biscayne Drive (SW 288th Street) to Avocado Drive (SW 296th Street).
Two-Lane Enhanced Alternative • AT 51 - Same as No-Build Alternative,
• AT 32 - Same as No-Build Alternative,
• FT 21 - From US 27 (Okeechobee Road) to north of Eureka Drive (SW 184th Street),
• FT 22 - From Eureka Drive (SW 184th Street) to north of Biscayne Drive (SW 288th Street), and
• FT 23 - From Biscayne Drive (SW 288th Street) to Avocado Drive (SW 296th Street).

Model Validation Report SR-997/Krome Avenue South PD&E Study
Page 22
Four-Lane Alternative • AT 51 - Same as No-Build Alternative,
• AT 32 - Same as No-Build Alternative,
• FT 21 - Same as Two-Lane Enhanced Alternative,
• FT 22 - Same as Two-Lane Enhanced Alternative, and
• FT 23 - Same as Two-Lane Enhanced Alternative.
3.3 Opening Year 2010
The previously described changes in area types and facility types were made to the existing 2010 model structure provided by the Miami-Dade MPO. The ZDATA1 and ZDATA2 files were interpolated and revised using the 2004 interpolated data and the forecasted 2015 data received from the Miami-Dade MPO. After the interpolation was made, the specific TAZ changes and modifications made to the 2004 Base Year model were also applied to the 2010 zonal data. In other words, all applicable TAZs were checked and revised to ensure that the existing development levels obtained from the land use update phase were properly reflected in the model.
The overall changes to the TAZs within the study area for the model files ZDATA1 and ZDATA2 are shown in Table 3.3-A. Appendix B provides details of the adjustments made to the individual TAZs.
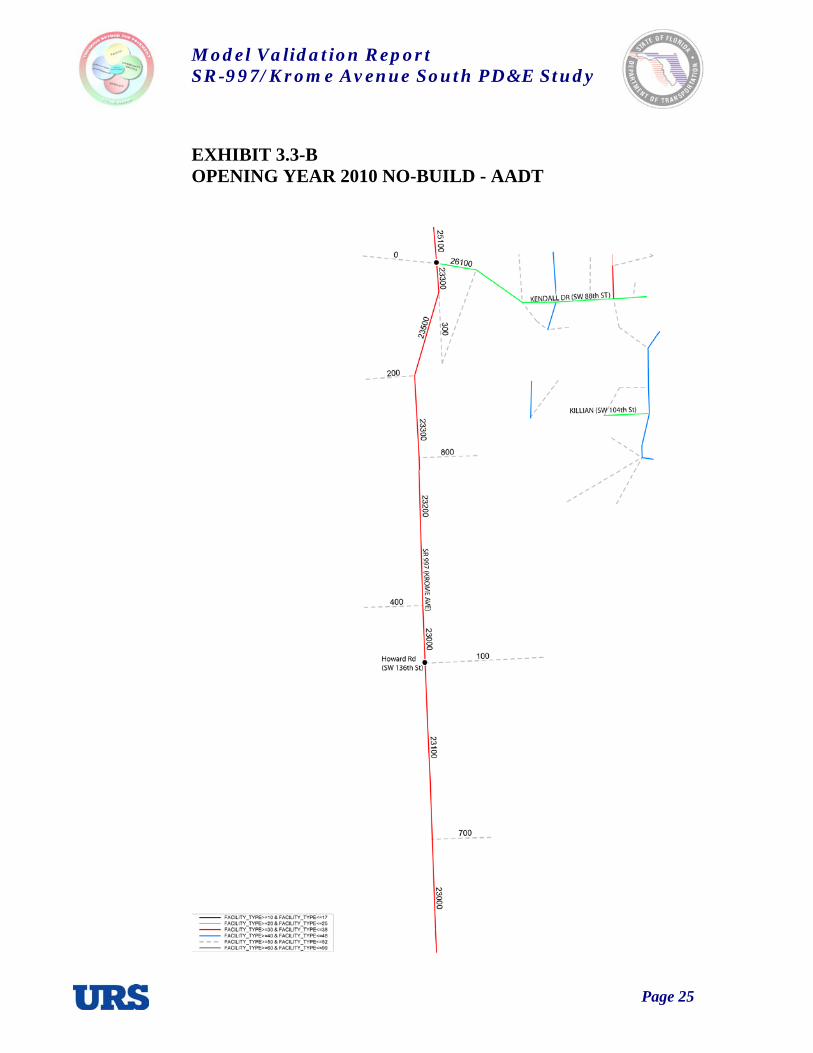
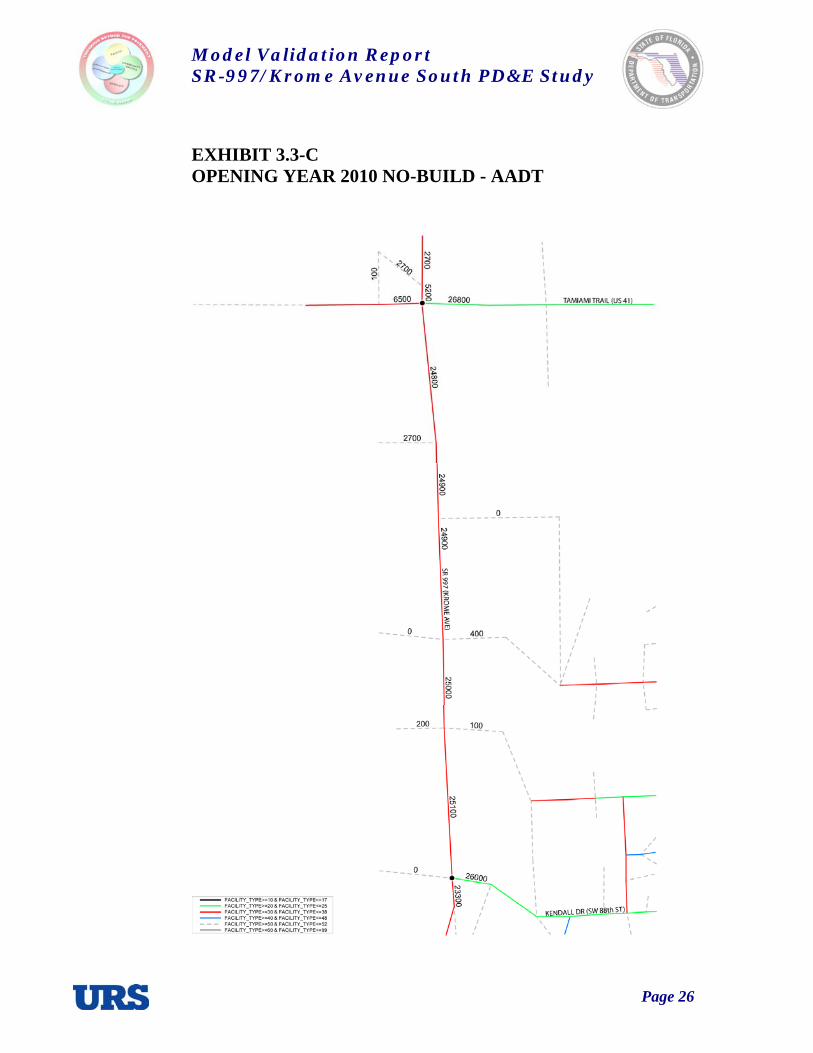
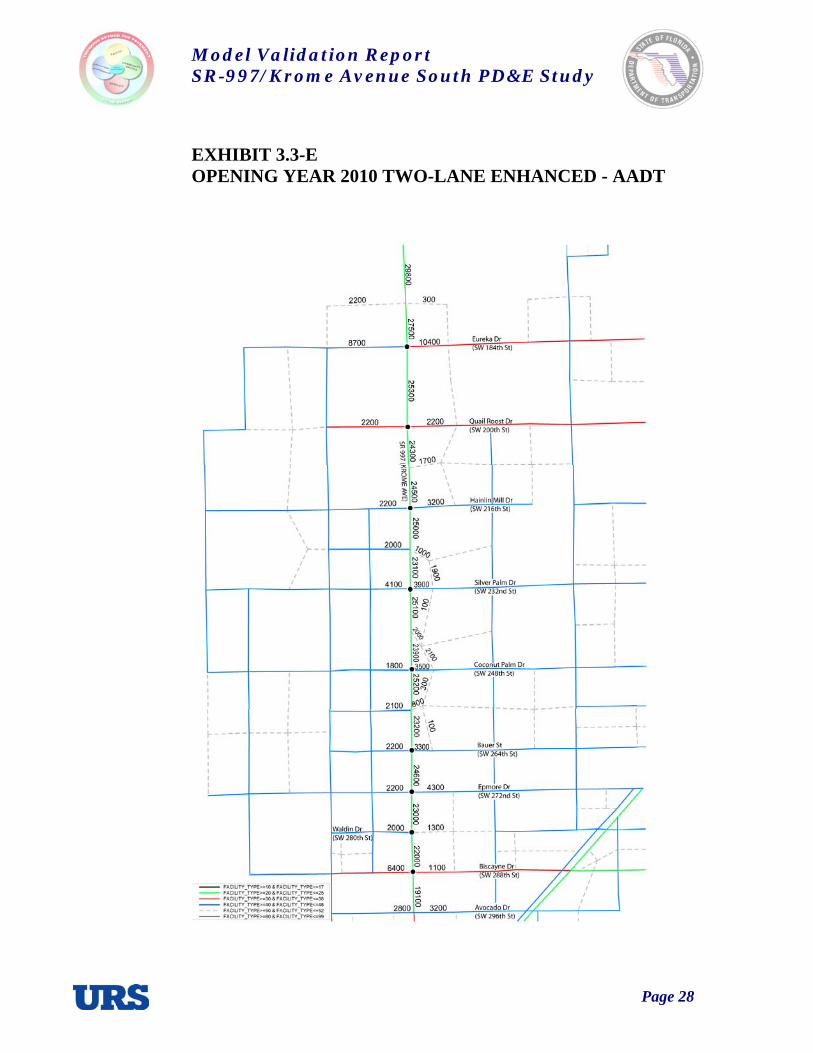
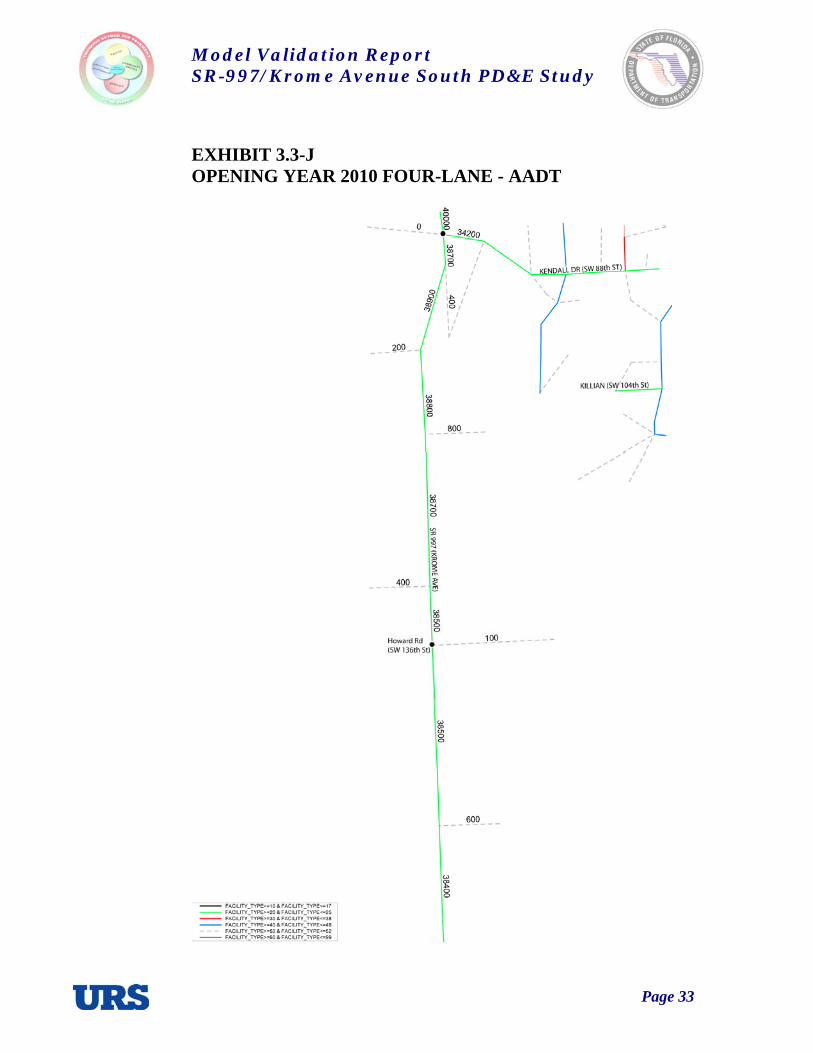
Table 3.3-B provides a comparison of volumes between the counts and the three alternatives for the Opening Year 2010. Exhibits 3.3-A through 3.3-L illustrate the AADTs for each of the three alternatives for Opening Year 2010.

Model Validation Report SR-997/Krome Avenue South PD&E Study
Page 23
TABLE 3.3-A OPENING YEAR 2010 MODEL ZDATA1 AND ZDATA2 REVISIONS1
2010 Model
Categories Original Revised2 Percent Increase
Households without Children (Dwelling Units) 4,553 4,882 7.2 Households with Children (Dwelling Units) 3,513 3,770 7.3 Vehicles in Households without Children (Vehicles) 8,827 9,470 7.3 Vehicles in Households with Children (Vehicles) 9,426 10,097 7.1 Workers in Households without Children (Workers) 6,722 7,208 7.2 Workers in Households with Children (Workers) 6,592 7,058 7.1 Persons in Households without Children (Persons) 9,803 10,503 7.1 Persons in Households with Children (Persons) 14,863 15,924 7.1
ZDATA1
“ALL”-Type Occupied Hotel/Motel Rooms (Rooms) 346 774 123.7 Industrial Employment (Employees) 2,856 2,856 0.0 Commercial Employment (Employees) 1,428 2,517 76.3 Service Employment (Employees) 4,903 5,451 11.2 Total Employment (Employees) 9,187 10,824 17.8
ZDATA2
School Enrollment (Enrollment) 6,070 9,245 52.3 1 Table reflects only the data of the TAZs in the Krome Avenue study area. 2 Revisions were only made to the TAZs within the study area.
TABLE 3.3-B AVERAGE ANNUAL DAILY TRAFFIC COMPARISON FOR 2010 FSUTMS MODEL SCENARIOS
Krome Avenue Roadway 2010 FSUTMS Model
From To Existing Count
No-Build
Two-Lane Enhanced
Four-Lane Divided
SW 296th St (Avocado Dr) SW 288th St (Biscayne Dr) 13,900 16,600 19,100 26,200 SW 288th St (Biscayne Dr) SW 280th St (Waldin Dr) 12,700 18,400 22,000 30,700 SW 280th St (Waldin Dr) SW 272nd St (Epmore Dr) 14,800 16,900 23,000 32,600 SW 272nd St (Epmore Dr) SW 264th St (Bauer St) 15,400 17,800 24,600 36,600 SW 264th St (Bauer St) SW 248th St (Coconut Palm Dr) 14,500 17,500 23,200 36,200 SW 248th St (Coconut Palm Dr) SW 232 St (Silver Palm Dr) 15,900 18,400 24,500 38,400 SW 232 St (Silver Palm Dr) SW 216th St (Hainlin Mill Dr) 16,100 16,900 24,000 40,500 SW 216th St (Hainlin Mill Dr) SW 200th St (Quail Roost Dr) 14,400 17,900 24,400 39,800 SW 200th St (Quail Roost Dr) SW 184th St (Eureka Dr) 14,800 18,200 25,300 40,000 SW 184th St (Eureka Dr) SW 136th St (Howard Rd) 17,300 21,000 27,500 36,000 SW 136th St (Howard Rd) SW 88th St (Kendall Dr N) 15,500 23,300 30,100 38,700
15,700 25,100 31,300 40,000 SW 88th St (Kendall Dr N) SW 8th St (Tamiami Trail/US 41)14,100 24,800 31,000 39,700 8,000 8,6001 9,0002 10,1002 US 41 (Tamiami Trail/SW 8th St) US 27/SR 25 (Okeechobee Rd)
8,700 9,5001 10,0002 11,5002 1 Future volumes for this link were adjusted interpolating the Two-Lane Enhanced/Existing growth ratio from the
Kendall to US 41 roadway segment. 2 Future volumes for this link were adjusted using the NCHRP 255 procedure.

Model Validation Report SR-997/Krome Avenue South PD&E Study
Page 24
EXHIBIT 3.3-A OPENING YEAR 2010 NO-BUILD - AADT
Model Validation Report SR-997/Krome Avenue South PD&E Study
Page 25
EXHIBIT 3.3-B OPENING YEAR 2010 NO-BUILD - AADT
Model Validation Report SR-997/Krome Avenue South PD&E Study
Page 26
EXHIBIT 3.3-C OPENING YEAR 2010 NO-BUILD - AADT

Model Validation Report SR-997/Krome Avenue South PD&E Study
Page 27
EXHIBIT 3.3-D OPENING YEAR 2010 NO-BUILD - AADT
Model Validation Report SR-997/Krome Avenue South PD&E Study
Page 28
EXHIBIT 3.3-E OPENING YEAR 2010 TWO-LANE ENHANCED - AADT

Model Validation Report SR-997/Krome Avenue South PD&E Study
Page 29
EXHIBIT 3.3-F OPENING YEAR 2010 TWO-LANE ENHANCED - AADT

Model Validation Report SR-997/Krome Avenue South PD&E Study
Page 30
EXHIBIT 3.3-G OPENING YEAR 2010 TWO-LANE ENHANCED - AADT

Model Validation Report SR-997/Krome Avenue South PD&E Study
Page 31
EXHIBIT 3.3-H OPENING YEAR 2010 TWO-LANE ENHANCED - AADT

Model Validation Report SR-997/Krome Avenue South PD&E Study
Page 32
EXHIBIT 3.3-I OPENING YEAR 2010 FOUR-LANE - AADT
Model Validation Report SR-997/Krome Avenue South PD&E Study
Page 33
EXHIBIT 3.3-J OPENING YEAR 2010 FOUR-LANE - AADT

Model Validation Report SR-997/Krome Avenue South PD&E Study
Page 34
EXHIBIT 3.3-K OPENING YEAR 2010 FOUR-LANE - AADT

Model Validation Report SR-997/Krome Avenue South PD&E Study
Page 35
EXHIBIT 3.3-L OPENING YEAR 2010 FOUR-LANE - AADT

Model Validation Report SR-997/Krome Avenue South PD&E Study
Page 36
3.4 Future Year 2030
The changes in area types and facility types made to the model years 2004 and 2010 were also applied to the 2025 model network with the socioeconomic data received from the Miami-Dade MPO for the forecasted year 2030.
The 2030 socioeconomic data was checked (and revised as necessary) to ensure that the land use updates made to the 2004 and 2010 models were properly reflected in the 2030 model.
The overall socioeconomic changes for the TAZs within the study area for the model files ZDATA1 and ZDATA2 are shown in Table 3.4-A. Appendix B provides details of the actual adjustments made to the individual TAZs in the study area.
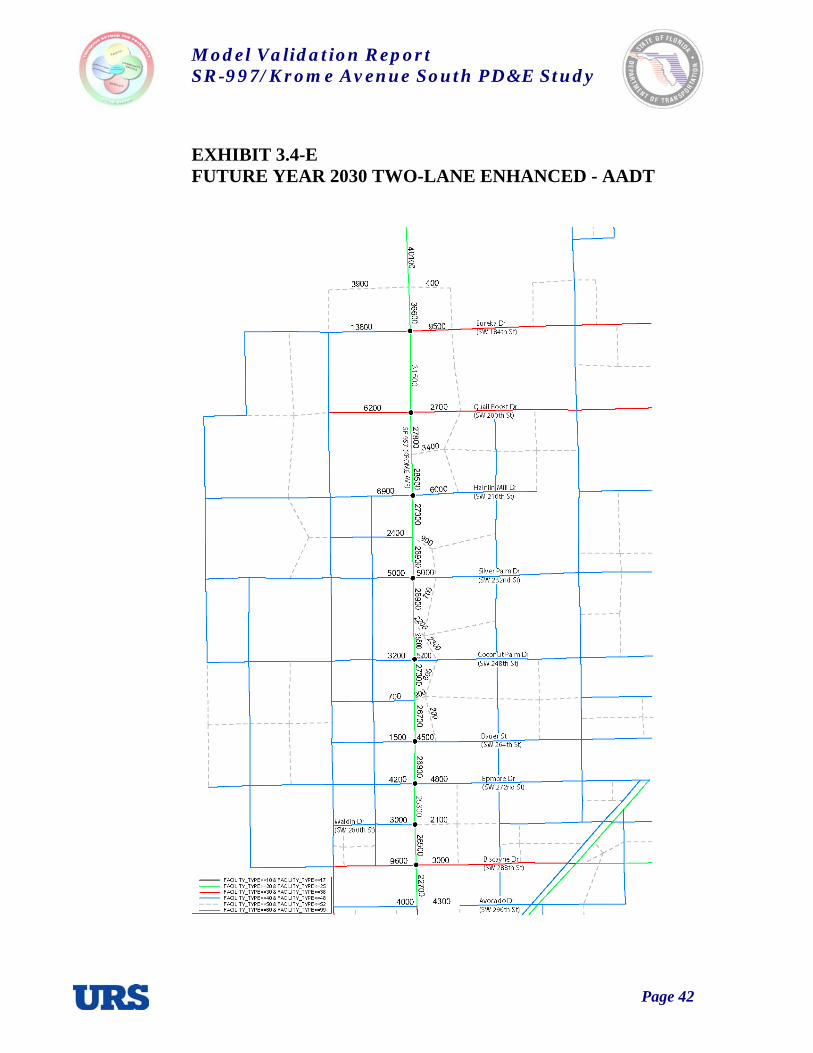
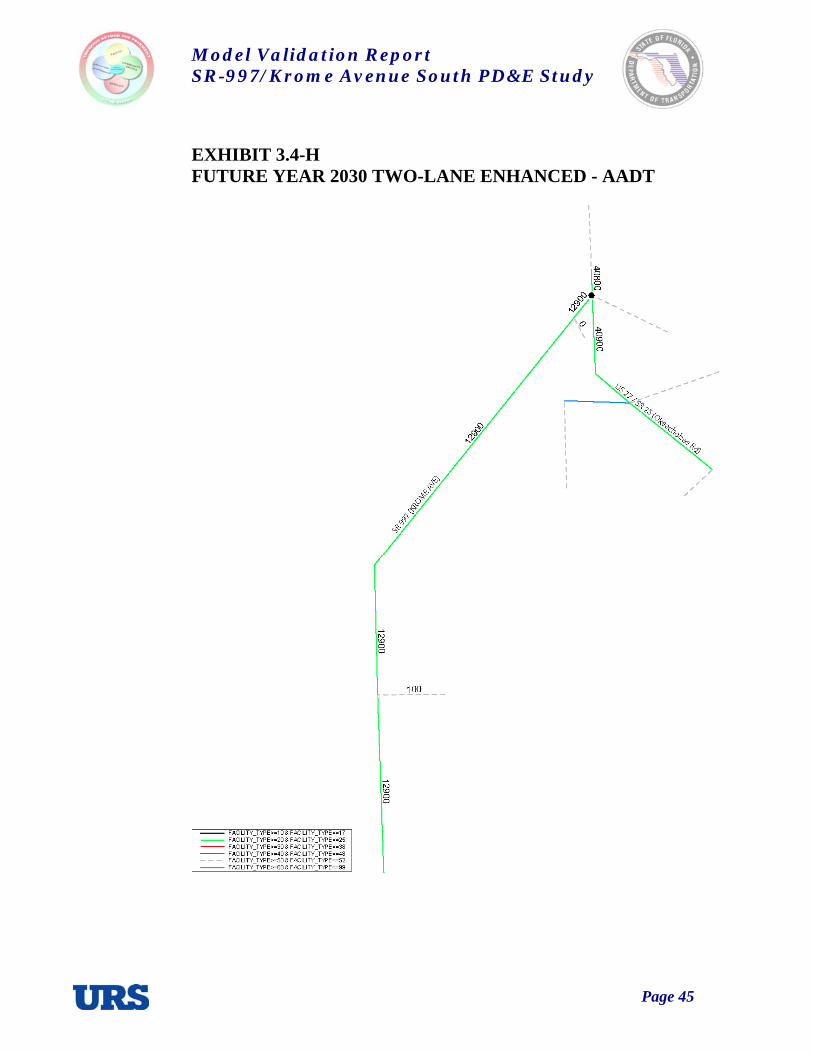
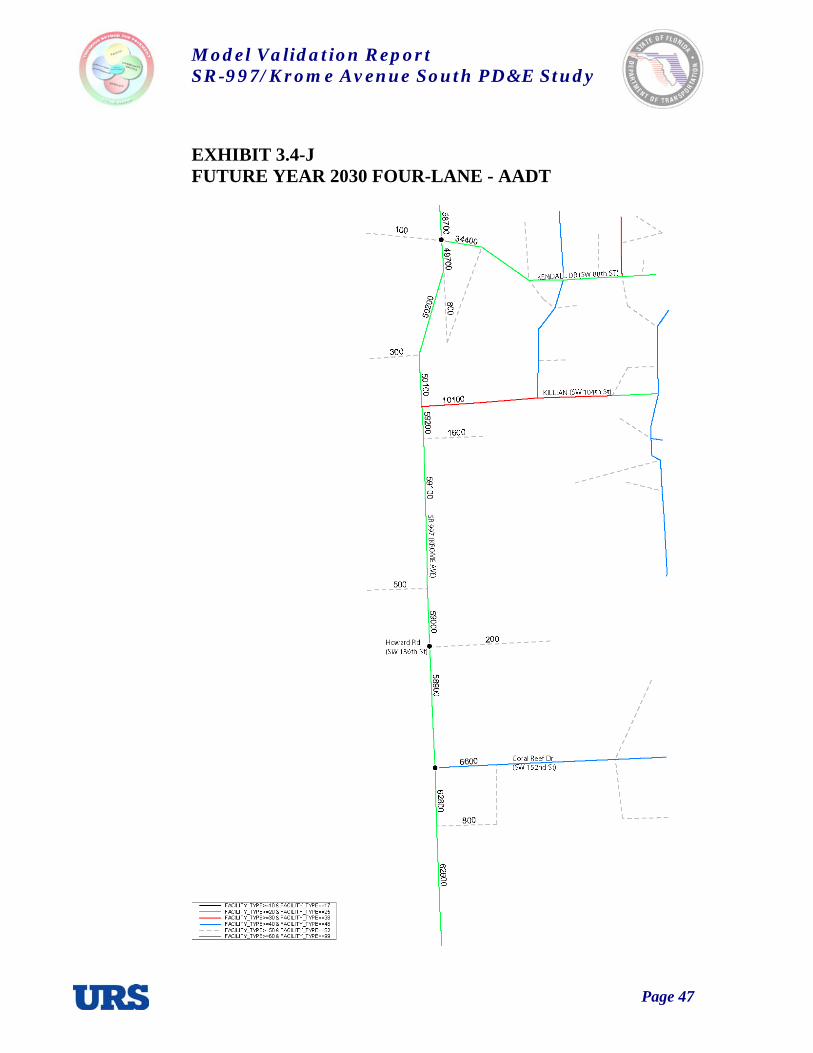
Table 3.4-B provides a comparison of volumes between the counts, and the three alternatives for the 2030. Based on the results of the model, it appears that a need for four lanes throughout the corridor is solidly justified. Exhibits 3.4-A through 3.4-L provide the AADTs for the future year 2030.

Model Validation Report SR-997/Krome Avenue South PD&E Study
Page 37
TABLE 3.4-A OPENING YEAR 2030 MODEL ZDATA1 AND ZDATA2 REVISIONS1
2030 Model
Categories Original Revised2 Percent Increase
Households without Children (Dwelling Units) 7,180 7,500 4.5 Households with Children (Dwelling Units) 5,443 5,709 4.9 Vehicles in Households without Children (Vehicles) 14,134 14,767 4.5 Vehicles in Households with Children (Vehicles) 14,789 15,513 4.9 Workers in Households without Children (Workers) 10,705 11,184 4.5 Workers in Households with Children (Workers) 10,247 10,751 4.9 Persons in Households without Children (Persons) 15,566 16,255 4.4 Persons in Households with Children (Persons) 23,061 24,188 4.9
ZDATA1
“ALL”-Type Occupied Hotel/Motel Rooms (Rooms) 466 858 84.1 Industrial Employment (Employees) 2,691 2,691 0.0 Commercial Employment (Employees) 1,976 3,065 55.1 Service Employment (Employees) 5,470 6,013 9.9 Total Employment (Employees) 10,137 11,769 16.1
ZDATA2
School Enrollment (Enrollment) 8,195 10,703 30.6 1 Table reflects only the data of the TAZs in the Krome Avenue study area. 2 Revisions were only made to the TAZs within the study area.
TABLE 3.4-B AVERAGE ANNUAL DAILY TRAFFIC COMPARISON FOR 2030 FSUTMS MODEL SCENARIOS
Krome Avenue Roadway 2030 FSUTMS Model
From To Existing Count
No-Build
Two-Lane Enhanced
Four-Lane Divided
SW 296th St (Avocado Dr) SW 288th St (Biscayne Dr) 13,900 21,600 22,700 36,900 SW 288th St (Biscayne Dr) SW 280th St (Waldin Dr) 12,700 24,100 26,500 44,000 SW 280th St (Waldin Dr) SW 272nd St (Epmore Dr) 14,800 21,600 25,300 47,500 SW 272nd St (Epmore Dr) SW 264th St (Bauer St) 15,400 22,200 26,900 54,600 SW 264th St (Bauer St) SW 248th St (Coconut Palm Dr) 14,500 22,000 27,000 53,800 SW 248th St (Coconut Palm Dr) SW 232 St (Silver Palm Dr) 15,900 20,800 26,200 55,000 SW 232 St (Silver Palm Dr) SW 216th St (Hainlin Mill Dr) 16,100 22,500 27,100 58,800 SW 216th St (Hainlin Mill Dr) SW 200th St (Quail Roost Dr) 14,400 23,800 28,200 56,900 SW 200th St (Quail Roost Dr) SW 184th St (Eureka Dr) 14,800 27,900 31,500 58,300 SW 184th St (Eureka Dr) SW 136th St (Howard Rd) 17,300 31,400 36,600 58,300 SW 136th St (Howard Rd) SW 104th St (Killian Dr) NA 31,500 36,100 59,100 SW 104th St (Killian Dr) SW 88th St (Kendall Dr N) 15,500 22,500 28,400 50,000
15,700 31,100 35,800 58,700 SW 88th St (Kendall Dr N) SW 8th St (Tamiami Trail/US 41)14,100 30,900 35,500 58,300 8,000 17,0001 18,8002 22,1002 US 41 (Tamiami Trail/SW 8th St) US 27/SR 25 (Okeechobee Rd)
8,700 15,5001 16,9002 21,1002 1 Future volumes for this link were adjusted interpolating the Two-Lane Enhanced/Existing growth ratio from the
Kendall to US 41 roadway segment. 2 Future volumes for this link were adjusted using the NCHRP 255 procedure.

Model Validation Report SR-997/Krome Avenue South PD&E Study
Page 38
EXHIBIT 3.4-A FUTURE YEAR 2030 NO-BUILD - AADT

Model Validation Report SR-997/Krome Avenue South PD&E Study
Page 39
EXHIBIT 3.4-B FUTURE YEAR 2030 NO-BUILD - AADT

Model Validation Report SR-997/Krome Avenue South PD&E Study
Page 40
EXHIBIT 3.4-C FUTURE YEAR 2030 NO-BUILD - AADT

Model Validation Report SR-997/Krome Avenue South PD&E Study
Page 41
EXHIBIT 3.4-D FUTURE YEAR 2030 NO-BUILD - AADT
Model Validation Report SR-997/Krome Avenue South PD&E Study
Page 42
EXHIBIT 3.4-E FUTURE YEAR 2030 TWO-LANE ENHANCED - AADT

Model Validation Report SR-997/Krome Avenue South PD&E Study
Page 43
EXHIBIT 3.4-F FUTURE YEAR 2030 TWO-LANE ENHANCED - AADT

Model Validation Report SR-997/Krome Avenue South PD&E Study
Page 44
EXHIBIT 3.4-G FUTURE YEAR 2030 TWO-LANE ENHANCED - AADT
Model Validation Report SR-997/Krome Avenue South PD&E Study
Page 45
EXHIBIT 3.4-H FUTURE YEAR 2030 TWO-LANE ENHANCED - AADT

Model Validation Report SR-997/Krome Avenue South PD&E Study
Page 46
EXHIBIT 3.4-I FUTURE YEAR 2030 FOUR-LANE - AADT
Model Validation Report SR-997/Krome Avenue South PD&E Study
Page 47
EXHIBIT 3.4-J FUTURE YEAR 2030 FOUR-LANE - AADT

Model Validation Report SR-997/Krome Avenue South PD&E Study
Page 48
EXHIBIT 3.4-K FUTURE YEAR 2030 FOUR-LANE - AADT

Model Validation Report SR-997/Krome Avenue South PD&E Study
Page 49
EXHIBIT 3.4-L FUTURE YEAR 2030 FOUR-LANE - AADT
Model Validation Report SR-997/Krome Avenue South PD&E Study
Page 50
3.5 Directional Design Hour Volumes
The evaluation of future traffic operating conditions for the proposed Krome Avenue improvement alternatives requires the use of directional design hourly volumes (DDHVs). DDHVs are obtained by applying a number of traffic factors to the future AADT volumes. These factors include the design hour factor (K30), the directional factor (D30), and the percentage of trucks (DHT).
3.5.1 K Factor
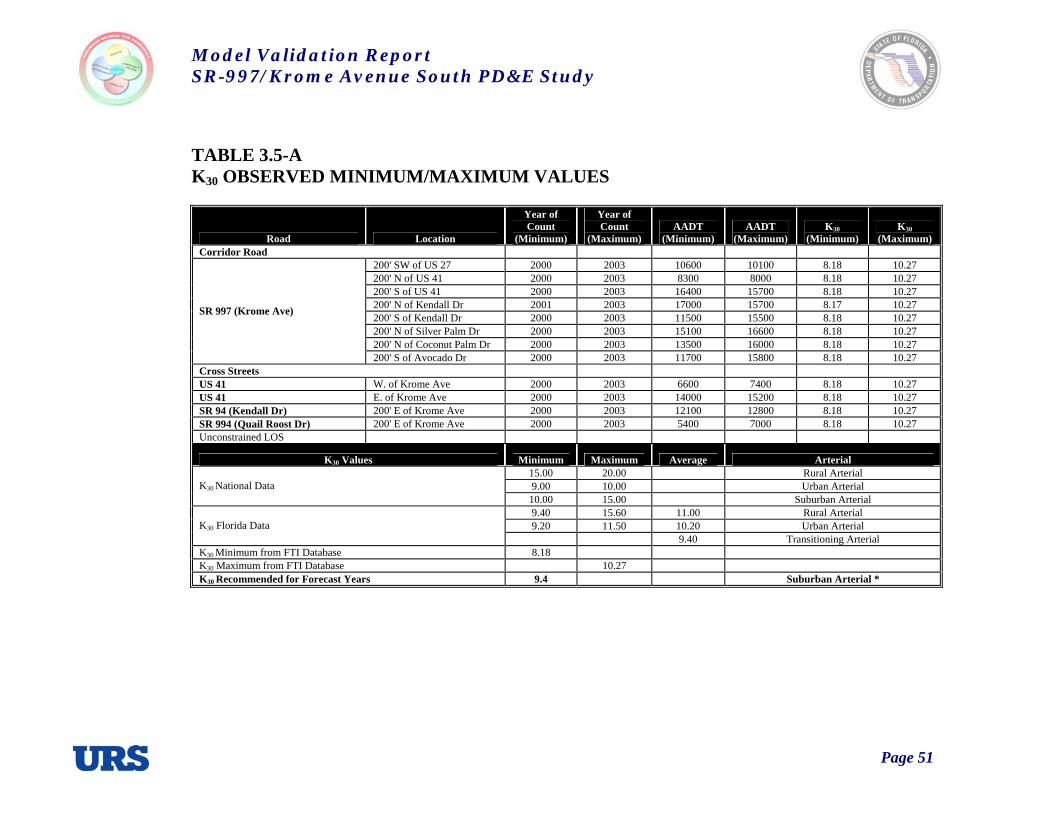
A review of the FDOT Florida Traffic Information (FTI) database along with 2003/04 traffic counts was conducted to obtain the design hour volumes. Table 3.5-A provides a summary of K30 factors for roadway segments in the study limits. As seen in this table, the K30 factors along Krome Avenue range from a minimum of 8.17 to a maximum of 10.27. The FDOT’s K30 factor for transitioning areas is an average value of 9.4.
Based on these considerations, it is recommended that a K30 factor of 9.4 be used for the forecast years (Opening Year, Intermediate Year, and Design Year).
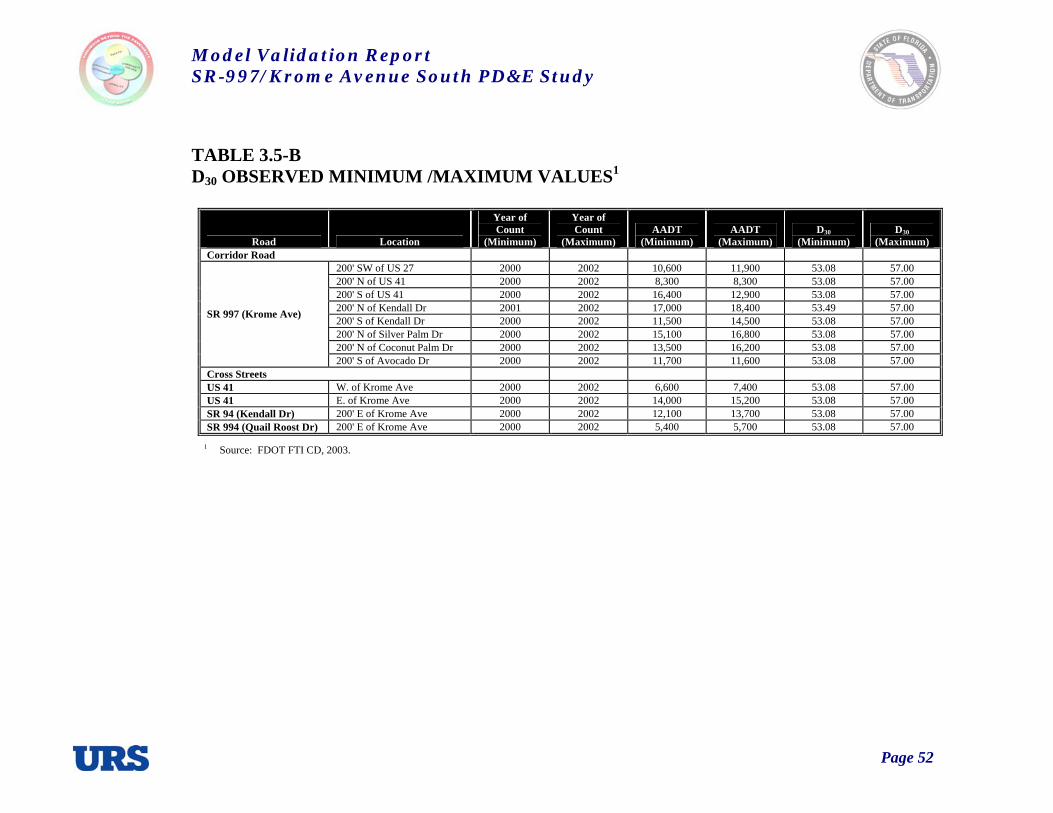
3.5.2 Directional Factor
From a review of the last four years of available FDOT traffic data, the D30 factor ranges from a low of 53.08 to a high of 57.00, as illustrated in Table 3.5-B. Also, a review from the traffic counts conducted along Krome Avenue for the existing conditions analysis was made. Table 3.5-C illustrates the directional distribution of the 2003/2004 traffic counts conducted along Krome Avenue.
As seen in this table, the average directional factors are as follows:
• 45.3 percent southbound/54.7 percent northbound in the a.m. peak hour, and
• 54.2 percent southbound/45.8 percent northbound in the p.m. peak hour.
Model Validation Report SR-997/Krome Avenue South PD&E Study
Page 51
TABLE 3.5-A K30 OBSERVED MINIMUM/MAXIMUM VALUES
Road Location
Year of Count
(Minimum)
Year of Count
(Maximum) AADT
(Minimum) AADT
(Maximum) K30
(Minimum) K30
(Maximum) Corridor Road
200' SW of US 27 2000 2003 10600 10100 8.18 10.27 200' N of US 41 2000 2003 8300 8000 8.18 10.27 200' S of US 41 2000 2003 16400 15700 8.18 10.27 200' N of Kendall Dr 2001 2003 17000 15700 8.17 10.27 200' S of Kendall Dr 2000 2003 11500 15500 8.18 10.27 200' N of Silver Palm Dr 2000 2003 15100 16600 8.18 10.27 200' N of Coconut Palm Dr 2000 2003 13500 16000 8.18 10.27
SR 997 (Krome Ave)
200' S of Avocado Dr 2000 2003 11700 15800 8.18 10.27 Cross Streets US 41 W. of Krome Ave 2000 2003 6600 7400 8.18 10.27 US 41 E. of Krome Ave 2000 2003 14000 15200 8.18 10.27 SR 94 (Kendall Dr) 200' E of Krome Ave 2000 2003 12100 12800 8.18 10.27 SR 994 (Quail Roost Dr) 200' E of Krome Ave 2000 2003 5400 7000 8.18 10.27 Unconstrained LOS
K30 Values Minimum Maximum Average Arterial 15.00 20.00 Rural Arterial 9.00 10.00 Urban Arterial K30 National Data
10.00 15.00 Suburban Arterial 9.40 15.60 11.00 Rural Arterial 9.20 11.50 10.20 Urban Arterial K30 Florida Data
9.40 Transitioning Arterial K30 Minimum from FTI Database 8.18 K30 Maximum from FTI Database 10.27 K30 Recommended for Forecast Years 9.4 Suburban Arterial *
Model Validation Report SR-997/Krome Avenue South PD&E Study
Page 52
TABLE 3.5-B D30 OBSERVED MINIMUM /MAXIMUM VALUES1
Road Location
Year of Count
(Minimum)
Year of Count
(Maximum) AADT
(Minimum) AADT
(Maximum) D30
(Minimum) D30
(Maximum) Corridor Road
200' SW of US 27 2000 2002 10,600 11,900 53.08 57.00 200' N of US 41 2000 2002 8,300 8,300 53.08 57.00 200' S of US 41 2000 2002 16,400 12,900 53.08 57.00 200' N of Kendall Dr 2001 2002 17,000 18,400 53.49 57.00 200' S of Kendall Dr 2000 2002 11,500 14,500 53.08 57.00 200' N of Silver Palm Dr 2000 2002 15,100 16,800 53.08 57.00 200' N of Coconut Palm Dr 2000 2002 13,500 16,200 53.08 57.00
SR 997 (Krome Ave)
200' S of Avocado Dr 2000 2002 11,700 11,600 53.08 57.00 Cross Streets US 41 W. of Krome Ave 2000 2002 6,600 7,400 53.08 57.00 US 41 E. of Krome Ave 2000 2002 14,000 15,200 53.08 57.00 SR 94 (Kendall Dr) 200' E of Krome Ave 2000 2002 12,100 13,700 53.08 57.00 SR 994 (Quail Roost Dr) 200' E of Krome Ave 2000 2002 5,400 5,700 53.08 57.00
1 Source: FDOT FTI CD, 2003.

Model Validation Report SR-997/Krome Avenue South PD&E Study
Page 53
TABLE 3.5-C DIRECTIONAL DISTRIBUTION FROM 2003/2004 TRAFFIC COUNTS1
AM Peak Hour
Roadway Links From To
2003/2004 Two-Way
2003/2004 SB
2003/2004 NB
2003/2004 SB %
2003/2004 NB %
SW 296th St (Avocado Dr) SW 288th St (Biscayne Dr) 1127 500 627 44.4% 55.6% SW 288th St (Biscayne Dr) SW 280th St (Waldin Dr) 1217 552 665 45.4% 54.6% SW 280th St (Waldin Dr) SW 272nd St (Epmore Dr) 1187 562 625 47.3% 52.7% SW 272nd St (Epmore Dr) SW 264th St (Bauer St) 1201 577 624 48.0% 52.0% SW 264th St (Bauer St) SW 248th St (Coconut Palm Dr) 1168 572 596 49.0% 51.0%
1153 604 549 52.4% 47.6% SW 248th St (Coconut Palm Dr) SW 232 St (Silver Palm Dr) 1158 579 579 50.0% 50.0% 1247 606 641 48.6% 51.4% SW 232 St (Silver Palm Dr) SW 216th St (Hainlin Mill Dr) 1036 474 562 45.8% 54.2%
SW 216th St (Hainlin Mill Dr) SW 200th St (Quail Roost Dr) 1074 485 589 45.2% 54.8% SW 200th St (Quail Roost Dr) SW 192nd St (Grossmans Farm Dr) 1225 680 545 55.5% 44.5% SW 192nd St (Grossmans Farm Dr) SW 184th St (Eureka Dr) 1297 713 584 55.0% 45.0% SW 184th St (Eureka Dr) SW 136th St (Howard Rd) 1071 506 565 47.2% 52.8% SW 136th St (Howard Rd) SW 88th St (Kendall Dr N) 1249 571 678 45.7% 54.3%
1515 465 1050 30.7% 69.3% SW 88th St (Kendall Dr N) SW 8th St (Tamiami Trail/US 41) 1296 375 921 28.9% 71.1% 817 291 526 35.6% 64.4% SW 8th St (Tamiami Trail/US 41) US 27/SR 25 (Okeechobee Rd) 911 382 529 41.9% 58.1%
Krome Avenue Entire Corridor AM Peak Hour Average 20,949 9,494 11,455 45.3% 54.7%
PM Peak Hour Roadway Links
From To 2003/2004 Two-Way
2003/2004 SB
2003/2004 NB
2003/2004 SB %
2003/2004 NB %
SW 296th St (Avocado Dr) SW 288th St (Biscayne Dr) 1222 662 560 54.2% 45.8% SW 288th St (Biscayne Dr) SW 280th St (Waldin Dr) 1357 768 589 56.6% 43.4% SW 280th St (Waldin Dr) SW 272nd St (Epmore Dr) 1346 746 600 55.4% 44.6% SW 272nd St (Epmore Dr) SW 264th St (Bauer St) 1330 749 581 56.3% 43.7% SW 264th St (Bauer St) SW 248th St (Coconut Palm Dr) 1320 758 562 57.4% 42.6%
1372 701 671 51.1% 48.9% SW 248th St (Coconut Palm Dr) SW 232 St (Silver Palm Dr) 1323 698 625 52.8% 47.2% 1294 679 615 52.5% 47.5% SW 232 St (Silver Palm Dr) SW 216th St (Hainlin Mill Dr) 1134 572 562 50.4% 49.6%
SW 216th St (Hainlin Mill Dr) SW 200th St (Quail Roost Dr) 1215 626 589 51.5% 48.5% SW 200th St (Quail Roost Dr) SW 192nd St (Grossmans Farm Dr) 1385 694 691 50.1% 49.9% SW 192nd St (Grossmans Farm Dr) SW 184th St (Eureka Dr) 1459 762 697 52.2% 47.8% SW 184th St (Eureka Dr) SW 136th St (Howard Rd) 1259 705 554 56.0% 44.0% SW 136th St (Howard Rd) SW 88th St (Kendall Dr N) 1276 658 618 51.6% 48.4%
1223 750 473 61.3% 38.7% SW 88th St (Kendall Dr N) SW 8th St (Tamiami Trail/US 41) 862 531 331 61.6% 38.4% 846 515 331 60.9% 39.1% SW 8th St (Tamiami Trail/US 41) US 27/SR 25 (Okeechobee Rd) 1022 491 531 48.0% 52.0%
Krome Avenue Entire Corridor PM Peak Hour Average 22,245 12,065 10,180 54.2% 45.8%
1 Source: Counts by URS, Kitelson Associates, or F.R. Aleman Associates, 2003 or 2004.

Model Validation Report SR-997/Krome Avenue South PD&E Study
Page 54
While there is some fluctuation in the directionality of traffic flows along individual links, the predominant direction of traffic generally occurs in the northbound direction during the a.m. peak hour. During the p.m. peak hour, the travel pattern reverses and the peak direction occurs generally in the southbound direction of travel. It is recommended that a D30 factor of 55/45 be used in the development of DDHVs for the forecast years (Opening Year, Intermediate Year, and Design Year). The peak directional traffic flow will be assumed to maintain the existing trend, i.e., the peak directions of traffic will be northbound during the a.m. peak hour and southbound during the p.m. peak hour.
3.5.3 Truck Factor
Table 3.5-D summarizes the percentage of daily trucks (T24) along the corridor, as reported in FDOT’s FTI database for the traffic count locations along Krome Avenue.
As seen in this table, the averaged T24 along the corridor is 16.9 percent. It is recommended that this be used to determine design hour trucks. It should be noted that the percent of trucks occurring during the peak hour is generally much lower than the amount of trucks occurring throughout an average day. Based on recommendations from recent FDOT studies2, approximately one-half of the T24 has been deemed acceptable for use in establishing the percent of design hour trucks (DHT). Consequently, it is recommended that the DHT value of 8.45 percent, or 50 percent of the average T24 percent, be used for the DHT.
2 CR 581 PD&E, East-West Road PD&E, I-75 PD&E, Tampa, Florida, FDOT District VII.

Model Validation Report SR-997/Krome Avenue South PD&E Study
Page 55
TABLE 3.5-D T24 FACTORS
Corridor Road Location Daily T24 Percent
200' SW of US 27 15.3 200' N of US 41 17.1 200' S of US 41 22.3 200' N of Kendall Dr 16.1 200' S of Kendall Dr 14.7 200' N of Silver Palm Dr 14.6 200' N of Coconut Palm Dr 15.3
SR 997 (Krome Ave)
200' S of Avocado Dr 19.4 Average T24 16.9
Cross Streets Location Daily T24 Percent
US 41 W of Krome Ave 8.0 US 41 E of Krome Ave 11.4 SR 94 (Kendall Dr) 200' E of Krome Ave 8.6 SR 994 (Quail Roost Dr) 200' E of Krome Ave 4.7

APPENDIX A Methodology Papers

S.R. 997/Krome Avenue/SW 177th Avenue Traffic Demand Model Methodology
Traffic Demand Methodology Scope of Services Krome Avenue North & South PD&E Study – Sub Area Model
August 20, 2004
BASE YEAR TRAVEL DEMAND MODEL VALIDATION
Travel demand for the corridor will be estimated using the Miami-Dade Travel Demand Model. A base year sub-area model validation effort has been requested by FDOT, since a comparison of the available 1999 traffic counts to the 1999 model runs indicates significant differences between the counts and the model volumes. From the 1999 model, the ZDATA for the traffic analysis zones (TAZs) located approximately within a one-mile radius of the study corridor will be studied in detail.
The TAZ’s in the study area will be modified to ensure that the existing development is accurately represented. A field inventory/data collection effort will be taken to identify the current development levels for each TAZ. Corrections will be made to the socioeconomic data for the affected TAZs or centroid connector locations, where necessary. The model validation year will be 2004. The ZDATA for TAZ’s outside the study area will be converted from 1999 to 2004 by interpolating them between the 1999 and the 2010 model years. As part of this effort the model TAZ structure within the sub-area may be updated to allow for a more detailed analysis in the model. FUTURE YEAR MODELING After the 2004 model data has been validated, year 2010, 2020 and 2025 projections will be estimated. The future year models will incorporate the adjustments and network changes introduced in the base year model. All ZDATA forecasts will be approved by FDOT before they are used in the model and reasonableness checks will be performed. Any additional information incorporated into the current 2025 LRTP or the Draft 2005 Transportation Improvement Program, published February 5, 2004 by the Miami-Dade MPO will also be utilized for the project. The following is a detail of the proposed modeling for each of the project’s phases:
Opening Year (2010)
Traffic volumes will be determined for the proposed corridor alternatives using the year 2010 ZDATA and model network consistent with planned roadway improvements within the study area. Directional design hour volumes (DDHV) will be calculated using the FDOT-published K and D factors.
S.R. 997/Krome Avenue/SW 177th Avenue Traffic Demand Model Methodology
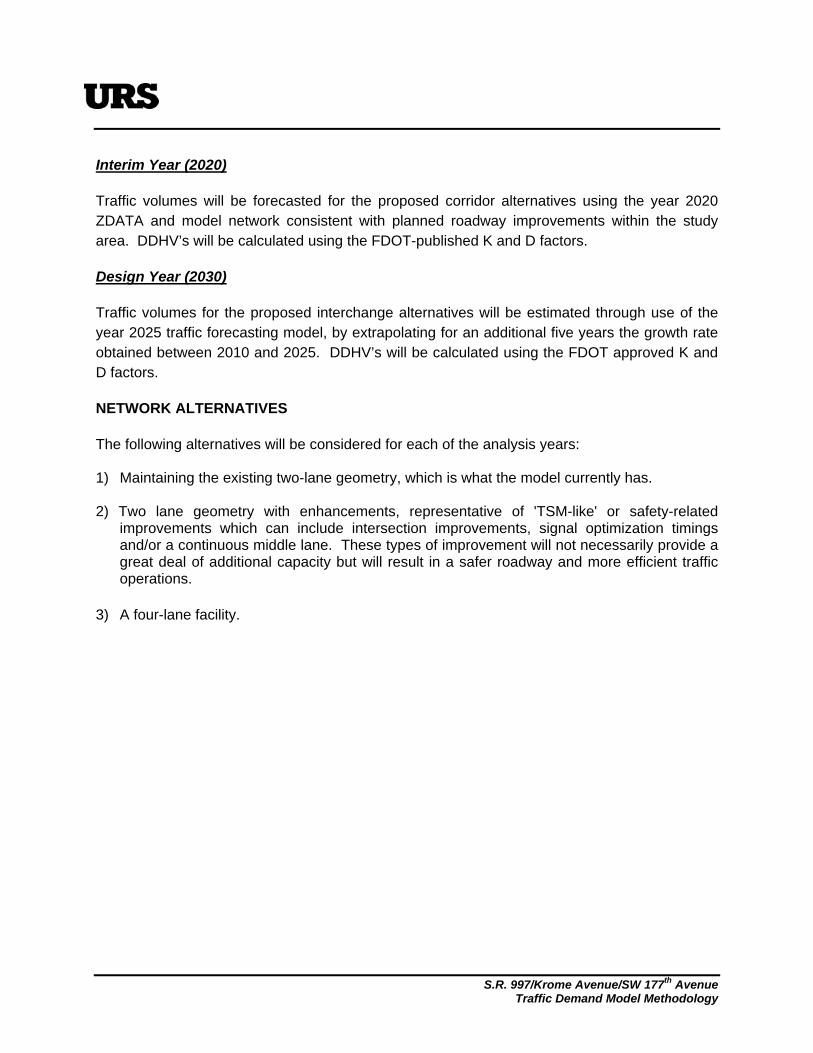
Interim Year (2020)
Traffic volumes will be forecasted for the proposed corridor alternatives using the year 2020 ZDATA and model network consistent with planned roadway improvements within the study area. DDHV’s will be calculated using the FDOT-published K and D factors.
Design Year (2030)
Traffic volumes for the proposed interchange alternatives will be estimated through use of the year 2025 traffic forecasting model, by extrapolating for an additional five years the growth rate obtained between 2010 and 2025. DDHV’s will be calculated using the FDOT approved K and D factors.
NETWORK ALTERNATIVES
The following alternatives will be considered for each of the analysis years:
1) Maintaining the existing two-lane geometry, which is what the model currently has. 2) Two lane geometry with enhancements, representative of 'TSM-like' or safety-related
improvements which can include intersection improvements, signal optimization timings and/or a continuous middle lane. These types of improvement will not necessarily provide a great deal of additional capacity but will result in a safer roadway and more efficient traffic operations.
3) A four-lane facility.

S.R. 997/Krome Avenue/SW 177th Avenue Traffic Demand Model Methodology
OTHER MODEL REVISIONS The specific FSUTMS area types (AT) and facility types (FT) to be applied in the development of the three corridor scenarios are as follows1: No-Build Scenario – 2-Lane
• AT 32 – from Avocado Dr. (SW 296th St) to Biscayne Dr. (SW 288th St) • AT 51 – from north of Biscayne Dr. (SW 288th St) to south of Howard Dr. (SW 136th St) • FT 33 – from Avocado Dr. (SW 296th St) to Biscayne Dr. (SW 288th St) • FT 32 – from north of Biscayne Dr. (SW 288th St) to Eureka Dr. (SW 184th St) • FT 31 – from north of Eureka Dr. (SW 184th St) to south of Howard Dr. (SW 136th St)
2-Lane Enhanced Scenario: • AT 32 – from Avocado Dr. (SW 296th St) to Biscayne Dr. (SW 288th St) • AT 51 – from north of Biscayne Dr. (SW 288th St) to south of Howard Dr. (SW 136th St) • FT 23 – from Avocado Dr. (SW 296th St) to Biscayne Dr. (SW 288th St) • FT 22 – from north of Biscayne Dr. (SW 288th St) to Eureka Dr. (SW 184th St) • FT 21 – from north of Eureka Dr. (SW 184th St) to south of Howard Dr. (SW 136th St)
4-Lane Scenario:
• AT 32 – from Avocado Dr. (SW 296th St) to Biscayne Dr. (SW 288th St) • AT 51 – from north of Biscayne Dr. (SW 288th St) to south of Howard Dr (SW 136th St) • FT 23 – from Avocado Dr. (SW 296th St) to Biscayne Dr. (SW 288th St) • FT 22 – from north of Biscayne Dr. (SW 288th St) to Eureka Dr. (SW 184th St) • FT 21 – from north of Eureka Dr. (SW 184th St) to south of Howard Dr. (SW 136th St)
OTHER CONSIDERATIONS
NORTH SECTION PD&E
FDOT is conducting a PD&E study for the section of Krome Avenue between SW 136th Street (URS northern project limit) and US 27/Okeechobee Rd. It is envisioned that the modeling effort for the URS portion of the study will also incorporate the proposed geometry/alternatives considered in this other study if they are obtained in a timely basis. Otherwise, the same alternatives considered for the south section (no-build, TSM and four lanes) will be tested in the SW 136th to US 27 section.
1 Model Characteristics for Area Type and Facility Type
AT 32 Residential Areas – Undeveloped Portions of Urbanized Areas AT 51 Rural Areas – Developed Rural Areas / Small Cities under 5,000 Population FT 21 Divided Arterials – Divided Arterial Unsignalized (55 mph) FT 22 Divided Arterials – Divided Arterial Unsignalized (45 mph) FT 23 Divided Arterials – Divided Arterial Class Ia FT 31 Undivided Arterials – Undivided Arterial Unsignalized with Turn Bays FT 32 Undivided Arterials – Undivided Arterial Class Ia with Turn Bays FT 33 Undivided Arterials – Undivided Arterial Class Ib with Turn Bays FT 35 Undivided Arterial – No Bays Urban LOS Unsignalized or No Bays Rural LOS (55 mph) FT 36 Undivided Arterial – No Bays Urban LOS Class Ia or No Bays Rural LOS (45 mph)

S.R. 997/Krome Avenue/SW 177th Avenue Traffic Demand Model Methodology
LINKS IN THE SECTION NORTH OF THE URS PD&E:
From Howard Dr. (SW 136th St) to south of Kendall Drive (SR 94) • FT 35 – No-Build and 2-Lane Enhancement • FT 21 – 4-Lane Enhancement
From south of Kendall Drive (SR 94) to north of Kendall Drive (SR 94)
• FT 36 – No-Build and 2-Lane Enhancement • FT 22 – 4-Lane Enhancement
From north of Kendall Drive (SR 94) to Okeechobee Road (US 27) • FT 31 – No-Build and 2-Lane Enhancement FT 21 – 4-Lane Enhancement
MIAMI DADE MPO 2030 MODEL UPDATE
The Miami-Dade MPO has released updated socioeconomic data projections for the new Miami-Dade model. These files precede the release of the updated travel demand model (which is supposed to be released/adopted by the end of this year, 2004). The new zone structure is different from the one in the existing model, therefore, in order to use this new ZDATA files, it will be necessary to convert them using an equivalency table (to be provided by Miami-Dade MPO).

APPENDIX B Land Use Update Documentation

Name Designation Organization Remarks Tel
305.247.313128 Ms. Gloria Fernendez Office Manager Brenam Funeral Home
305.247.739927 Ms. Sharon Waldbilling Administrator Redland Christian Academy
954.985.4416
2 Mr. Carlos Roa Transportation Systems Manager Miami-Dade MPO 305.375.4507
South Florida Regional Planning Council (SFRPC) Senior PlannerMr. John Hosly1
305.375.1522
5 Mr. Frank Bauman Principal Planner Miami-Dade Department of Planning and Zoning 350.375.1859
4 Mr. Frank Baron Transportation Systems Manager Miami-Dade MPO
350.375.1859
7 Mr. Frank L. McCune Senior Planner Miami-Dade Department of Planning and Zoning 305.375.2835
6 Mr. Nicholas Needy Evaluator Miami-Dade Department of Planning and Zoning
305.375.1808
9 Mr. A. A. (Tony) Toledo Supervisor Miami-Dade County Public Works Department, Land Development Division
305.375.2141
8 Ms. Michell Mapp Processor Miami-Dade Department of Planning and Zoning
305.470.5489
11 Mr. Robert Landan Assistant Director Homestead Public Works Department 305.224.4842
10 Mr. Thomas Barnal Assistant District ROW Surveyor FDOT - 6
305.552.1845 (x151)
14 Mr. Donald W. Pybas County Extension Director
Miami-Dade County Extension (University of Florida IFAS Extension)
305.248.3311 (x241)
13 Mr. David L. Scroggs Building Management Specialist
US Department of Homeland Security
305.245.8023
16 Mr. William M. Duquette Vice Pesident Baptist Homestead Hospital 786.243.8355
15 Mr. Michael Hunt Vice President Brooks Tropicals Agricultural Industry
305.925.2555
18 Ms. Valerie Wideman Principal St. John's Episcopal School 305.247.5445
17 Ms. Susan Romera Night Manager Miccosukee Resort & Convention Center
305.247.5943 (x112)
20 Mr. Lawrence Kennedy III Assistant Principal South Dade Senior High 305.247.4244 (X2279)
19 Ms. Harriet Carr Secretary Redondo Elementary School
Director First Presbyterian Church School 305.246.4094
21 Ms. ---------- Secretary Frank J. Spinelli Dentistry
Provided relevant information
SR 997/Krome Avenue Field StudySource List
305.248.0027
22 Ms. Marleen M. Whittington
12 Mr. Rob Curtis President & CEO Curtis & Kimball 305.669.3172
305.246.8608
24 Mr. Howard A. Harden Pastor First Baptist Church of Homestead 305.247.1662
23 Mr. Stephen M. Hager Athletic Director Colonial Shristian School
305.247.4942
29 Internet - Opa-Locka West Airport
25 Mr. Patrick J. Doyle Principal Avocado Elementary School
305.386.971326 Mr. Mario Bedencourt Manager Conrad Yelvington Distribution, Inc.
Provided DRI Information
Adviced to contact Miami-Dade Planning and Zoning Department
Adviced to cantact Miami-Dade Planning and Zoning Department
Provided Zoning information
Provided Zoning information
Provided hard copy of 2005 and 2015 adopted Land Use Plan for Miami-Dade CountyProvided information about Miami-Dade Zoning Maps
Could not provide any specific information
Could not provide any specific information
Homestead PWD has not received any new development proposal along SR 997/Krome Avenue between SW 296 Street and SW 308 Street since 1985.
Provided Information about the Providence DRI
Provided Information about Krome Service Processing Center
Provided information abount Miami-Dade County Agricultural Center
Provided information about Brooks Agricultural Industry
Provided Hospital information
Provided information about the Resort & Gaming
Provided relevant information
Provided relevant information
Provided relevant information
Provided information about doctor's office
http://www.airnav.com/airport/X46#svcs
Provided relevant information
Provided relevant information
Provided relevant information
Provided information about the industry
Provided relevant information
Provided information about the Funeral Services
Appendix A - Field Datasheet_Source List 11/8/2004
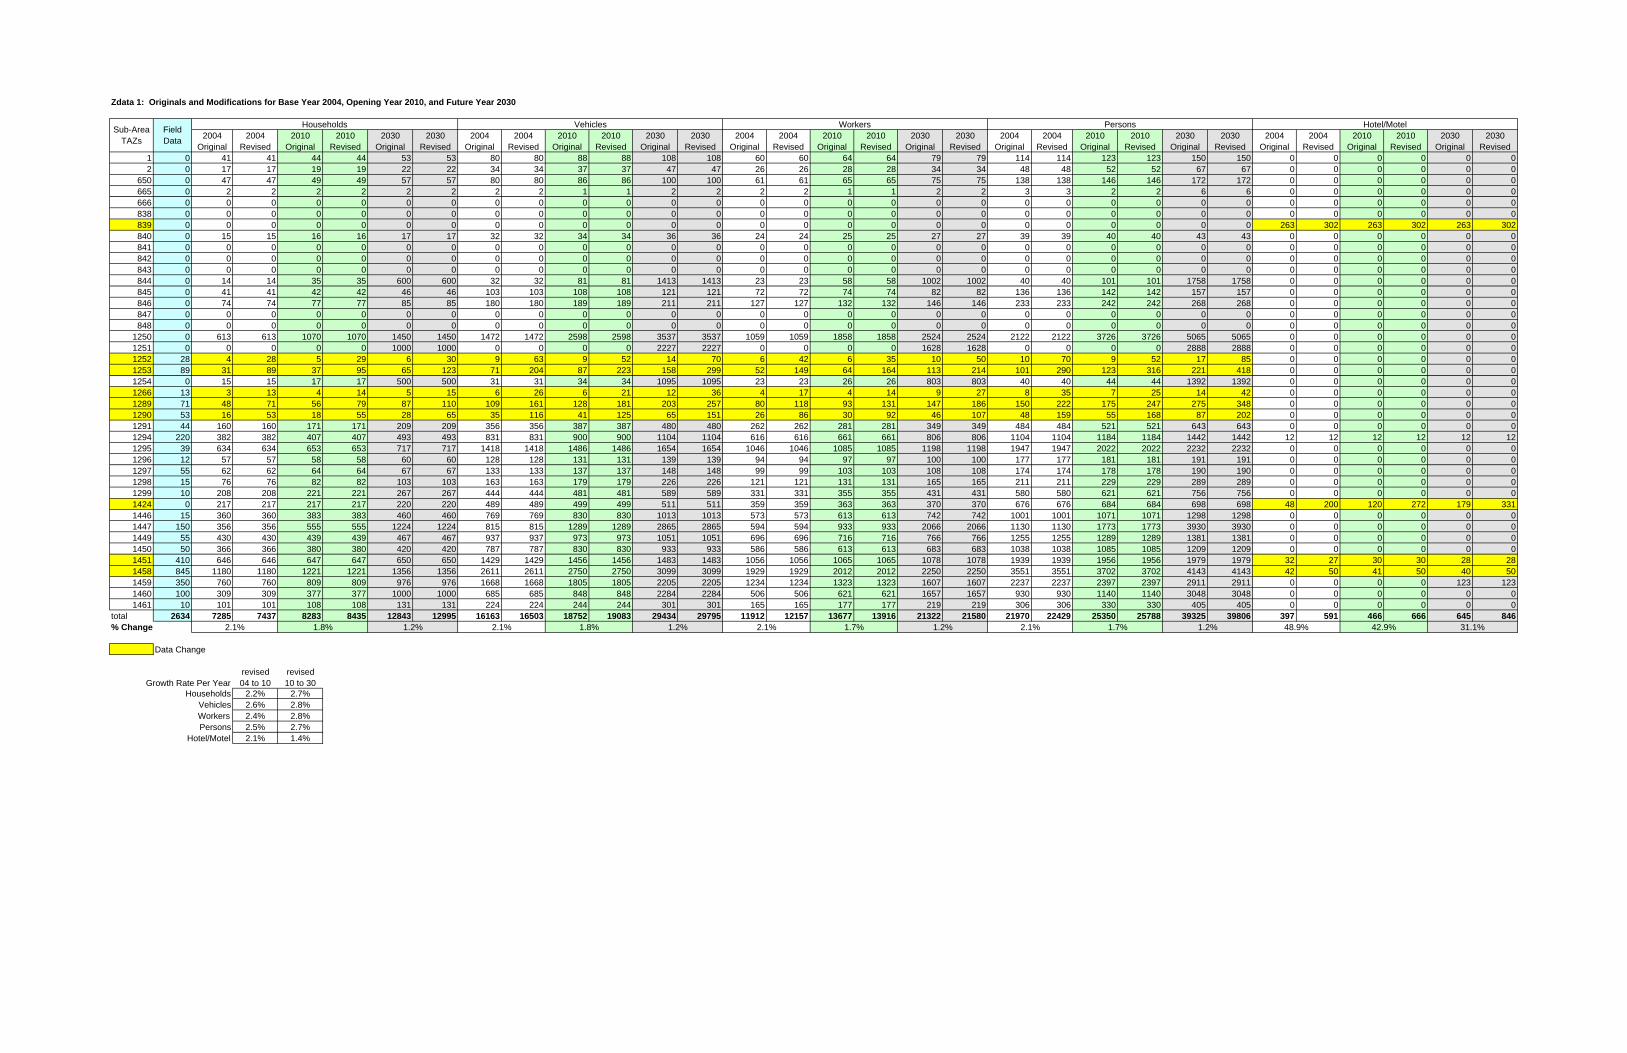
Zdata 1: Originals and Modifications for Base Year 2004, Opening Year 2010, and Future Year 2030
2004 Original
2004 Revised
2010 Original
2010 Revised
2030 Original
2030 Revised
2004 Original
2004 Revised
2010 Original
2010 Revised
2030 Original
2030 Revised
2004 Original
2004 Revised
2010 Original
2010 Revised
2030 Original
2030 Revised
2004 Original
2004 Revised
2010 Original
2010 Revised
2030 Original
2030 Revised
2004 Original
2004 Revised
2010 Original
2010 Revised
2030 Original
2030 Revised
1 0 41 41 44 44 53 53 80 80 88 88 108 108 60 60 64 64 79 79 114 114 123 123 150 150 0 0 0 0 0 02 0 17 17 19 19 22 22 34 34 37 37 47 47 26 26 28 28 34 34 48 48 52 52 67 67 0 0 0 0 0 0
650 0 47 47 49 49 57 57 80 80 86 86 100 100 61 61 65 65 75 75 138 138 146 146 172 172 0 0 0 0 0 0665 0 2 2 2 2 2 2 2 2 1 1 2 2 2 2 1 1 2 2 3 3 2 2 6 6 0 0 0 0 0 0666 0 0 0 0 0 0 0 0 0 0 0 0 0 0 0 0 0 0 0 0 0 0 0 0 0 0 0 0 0 0 0838 0 0 0 0 0 0 0 0 0 0 0 0 0 0 0 0 0 0 0 0 0 0 0 0 0 0 0 0 0 0 0839 0 0 0 0 0 0 0 0 0 0 0 0 0 0 0 0 0 0 0 0 0 0 0 0 0 263 302 263 302 263 302840 0 15 15 16 16 17 17 32 32 34 34 36 36 24 24 25 25 27 27 39 39 40 40 43 43 0 0 0 0 0 0841 0 0 0 0 0 0 0 0 0 0 0 0 0 0 0 0 0 0 0 0 0 0 0 0 0 0 0 0 0 0 0842 0 0 0 0 0 0 0 0 0 0 0 0 0 0 0 0 0 0 0 0 0 0 0 0 0 0 0 0 0 0 0843 0 0 0 0 0 0 0 0 0 0 0 0 0 0 0 0 0 0 0 0 0 0 0 0 0 0 0 0 0 0 0844 0 14 14 35 35 600 600 32 32 81 81 1413 1413 23 23 58 58 1002 1002 40 40 101 101 1758 1758 0 0 0 0 0 0845 0 41 41 42 42 46 46 103 103 108 108 121 121 72 72 74 74 82 82 136 136 142 142 157 157 0 0 0 0 0 0846 0 74 74 77 77 85 85 180 180 189 189 211 211 127 127 132 132 146 146 233 233 242 242 268 268 0 0 0 0 0 0847 0 0 0 0 0 0 0 0 0 0 0 0 0 0 0 0 0 0 0 0 0 0 0 0 0 0 0 0 0 0 0848 0 0 0 0 0 0 0 0 0 0 0 0 0 0 0 0 0 0 0 0 0 0 0 0 0 0 0 0 0 0 0
1250 0 613 613 1070 1070 1450 1450 1472 1472 2598 2598 3537 3537 1059 1059 1858 1858 2524 2524 2122 2122 3726 3726 5065 5065 0 0 0 0 0 01251 0 0 0 0 0 1000 1000 0 0 0 0 2227 2227 0 0 0 0 1628 1628 0 0 0 0 2888 2888 0 0 0 0 0 01252 28 4 28 5 29 6 30 9 63 9 52 14 70 6 42 6 35 10 50 10 70 9 52 17 85 0 0 0 0 0 01253 89 31 89 37 95 65 123 71 204 87 223 158 299 52 149 64 164 113 214 101 290 123 316 221 418 0 0 0 0 0 01254 0 15 15 17 17 500 500 31 31 34 34 1095 1095 23 23 26 26 803 803 40 40 44 44 1392 1392 0 0 0 0 0 01266 13 3 13 4 14 5 15 6 26 6 21 12 36 4 17 4 14 9 27 8 35 7 25 14 42 0 0 0 0 0 01289 71 48 71 56 79 87 110 109 161 128 181 203 257 80 118 93 131 147 186 150 222 175 247 275 348 0 0 0 0 0 01290 53 16 53 18 55 28 65 35 116 41 125 65 151 26 86 30 92 46 107 48 159 55 168 87 202 0 0 0 0 0 01291 44 160 160 171 171 209 209 356 356 387 387 480 480 262 262 281 281 349 349 484 484 521 521 643 643 0 0 0 0 0 01294 220 382 382 407 407 493 493 831 831 900 900 1104 1104 616 616 661 661 806 806 1104 1104 1184 1184 1442 1442 12 12 12 12 12 121295 39 634 634 653 653 717 717 1418 1418 1486 1486 1654 1654 1046 1046 1085 1085 1198 1198 1947 1947 2022 2022 2232 2232 0 0 0 0 0 01296 12 57 57 58 58 60 60 128 128 131 131 139 139 94 94 97 97 100 100 177 177 181 181 191 191 0 0 0 0 0 01297 55 62 62 64 64 67 67 133 133 137 137 148 148 99 99 103 103 108 108 174 174 178 178 190 190 0 0 0 0 0 01298 15 76 76 82 82 103 103 163 163 179 179 226 226 121 121 131 131 165 165 211 211 229 229 289 289 0 0 0 0 0 01299 10 208 208 221 221 267 267 444 444 481 481 589 589 331 331 355 355 431 431 580 580 621 621 756 756 0 0 0 0 0 01424 0 217 217 217 217 220 220 489 489 499 499 511 511 359 359 363 363 370 370 676 676 684 684 698 698 48 200 120 272 179 3311446 15 360 360 383 383 460 460 769 769 830 830 1013 1013 573 573 613 613 742 742 1001 1001 1071 1071 1298 1298 0 0 0 0 0 01447 150 356 356 555 555 1224 1224 815 815 1289 1289 2865 2865 594 594 933 933 2066 2066 1130 1130 1773 1773 3930 3930 0 0 0 0 0 01449 55 430 430 439 439 467 467 937 937 973 973 1051 1051 696 696 716 716 766 766 1255 1255 1289 1289 1381 1381 0 0 0 0 0 01450 50 366 366 380 380 420 420 787 787 830 830 933 933 586 586 613 613 683 683 1038 1038 1085 1085 1209 1209 0 0 0 0 0 01451 410 646 646 647 647 650 650 1429 1429 1456 1456 1483 1483 1056 1056 1065 1065 1078 1078 1939 1939 1956 1956 1979 1979 32 27 30 30 28 281458 845 1180 1180 1221 1221 1356 1356 2611 2611 2750 2750 3099 3099 1929 1929 2012 2012 2250 2250 3551 3551 3702 3702 4143 4143 42 50 41 50 40 501459 350 760 760 809 809 976 976 1668 1668 1805 1805 2205 2205 1234 1234 1323 1323 1607 1607 2237 2237 2397 2397 2911 2911 0 0 0 0 123 1231460 100 309 309 377 377 1000 1000 685 685 848 848 2284 2284 506 506 621 621 1657 1657 930 930 1140 1140 3048 3048 0 0 0 0 0 01461 10 101 101 108 108 131 131 224 224 244 244 301 301 165 165 177 177 219 219 306 306 330 330 405 405 0 0 0 0 0 0
total 2634 7285 7437 8283 8435 12843 12995 16163 16503 18752 19083 29434 29795 11912 12157 13677 13916 21322 21580 21970 22429 25350 25788 39325 39806 397 591 466 666 645 846% Change
Data Change
revised revisedGrowth Rate Per Year 04 to 10 10 to 30
Households 2.2% 2.7%Vehicles 2.6% 2.8%Workers 2.4% 2.8%Persons 2.5% 2.7%
Hotel/Motel 2.1% 1.4%
1.7%
Households Vehicles Workers Persons
1.2%1.7%1.2%
Sub-Area TAZs
1.2% 2.1%2.1% 1.8% 1.2% 2.1%
Field Data
2.1% 1.8% 48.9% 42.9% 31.1%
Hotel/Motel

Zdata 2: Originals and Modifications for Base Year 2004, Opening Year 2010, and Future Year 2030
2004 Original
2004 Revised
2010 Original
2010 Revised
2030 Original
2030 Revised
2004 Original
2004 Revised
2010 Original
2010 Revised
2030 Original
2030 Revised
2004 Original
2004 Revised
2010 Original
2010 Revised
2030 Original
2030 Revised
2004 Original
2004 Revised
2010 Original
2010 Revised
2030 Original
2030 Revised
2004 Original
2004 Revised
2010 Original
2010 Revised
2030 Original
2030 Revised
1 3 3 3 3 3 3 0 0 0 0 0 0 0 0 0 0 0 0 3 3 3 3 3 3 0 0 0 0 0 02 20 20 19 19 18 18 45 45 46 46 63 63 86 86 93 93 103 103 151 151 158 158 184 184 0 0 0 0 0 0
650 0 0 0 0 0 0 0 0 0 0 0 0 0 0 0 0 0 0 0 0 0 0 0 0 0 0 0 0 0 0665 0 0 0 0 0 0 0 0 0 0 0 0 0 0 0 0 0 0 0 0 0 0 0 0 0 0 0 0 0 0666 0 0 0 0 0 0 0 0 0 0 0 0 0 0 0 0 0 0 0 0 0 0 0 0 0 0 0 0 0 0838 0 0 0 0 0 0 0 0 0 0 0 0 74 74 80 80 88 88 74 74 80 80 88 88 0 0 0 0 0 0839 1 1 1 1 1 1 51 51 52 52 71 71 1402 1402 1519 1519 1677 1677 1454 1454 1572 1572 1749 1749 0 0 0 0 0 0840 12 12 11 11 11 11 0 0 0 0 0 0 458 528 496 566 547 617 470 540 507 577 558 628 0 0 0 0 0 0841 9 9 9 9 9 9 0 0 0 0 0 0 0 0 0 0 0 0 9 9 9 9 9 9 0 0 0 0 0 0842 46 46 45 45 43 43 1 1 2 2 0 0 1 1 2 2 6 6 48 48 49 49 49 49 0 0 0 0 0 0843 0 0 0 0 0 0 0 0 0 0 0 0 0 0 0 0 0 0 0 0 0 0 0 0 0 0 0 0 0 0844 0 0 0 0 0 0 0 0 0 0 0 0 0 0 0 0 0 0 0 0 0 0 0 0 0 0 0 0 0 0845 65 65 64 64 60 60 0 0 0 0 0 0 1 1 3 3 8 8 66 66 67 67 68 68 0 0 0 0 0 0846 0 0 0 0 0 0 10 10 11 11 15 15 0 0 0 0 0 0 10 10 11 11 15 15 533 0 1333 0 2000 0 school -zone 857847 0 0 0 0 0 0 0 0 0 0 0 0 40 0 43 0 48 0 40 0 43 0 48 0 0 0 0 0 0 0 service -zone 859848 9 9 9 9 9 9 67 85 69 87 94 112 0 0 0 0 0 0 76 94 78 96 103 121 0 0 0 0 0 0
1250 9 9 9 9 9 9 5 5 13 13 25 25 18 18 22 22 26 26 32 32 44 44 60 60 0 0 0 0 0 01251 0 0 0 0 0 0 0 0 0 0 0 0 44 44 48 48 53 53 44 44 48 48 53 53 367 367 917 917 1375 13751252 7 7 7 7 7 7 0 0 0 0 0 0 2 2 2 2 2 2 9 9 9 9 9 9 0 0 0 0 0 01253 18 18 17 17 16 16 4 4 4 4 5 5 17 17 19 19 21 21 39 39 40 40 42 42 0 0 0 0 0 01254 0 0 0 0 0 0 0 0 0 0 0 0 0 0 0 0 0 0 0 0 0 0 0 0 427 427 1067 1067 1600 16001266 14 14 13 13 12 12 0 0 0 0 0 0 1 1 2 2 4 4 15 15 15 15 16 16 0 0 0 0 0 01289 49 49 48 48 46 46 1 1 2 2 0 0 1 1 2 2 5 5 51 51 52 52 51 51 0 0 0 0 0 01290 65 65 64 64 60 60 0 0 0 0 0 0 1 1 3 3 8 8 66 66 67 67 68 68 0 0 0 0 0 01291 105 105 103 103 97 97 2 86 2 86 3 87 46 46 50 50 55 55 153 237 155 239 155 239 0 55 0 55 0 551294 247 247 243 243 228 228 106 124 109 127 149 167 23 23 25 25 28 28 376 394 377 395 405 423 0 0 0 0 0 01295 126 126 124 124 117 117 136 136 140 140 191 191 86 86 93 93 103 103 348 348 357 357 411 411 93 93 233 233 700 7001296 35 35 34 34 32 32 18 18 19 19 25 25 0 0 0 0 0 0 53 53 53 53 57 57 0 0 0 0 0 01297 304 304 299 299 281 281 83 83 85 85 116 116 229 229 248 248 274 274 616 616 632 632 671 671 0 0 0 0 0 01298 698 698 685 685 645 645 1 1 1 1 1 1 160 160 173 173 216 216 859 859 859 859 862 862 0 0 0 0 0 01299 136 136 134 134 126 126 17 17 18 18 24 24 321 321 348 348 384 384 474 474 500 500 534 534 0 0 0 0 0 01424 11 11 11 11 11 11 1035 1035 1067 1067 1463 1463 253 253 275 275 304 304 1299 1299 1353 1353 1778 1778 0 0 0 0 0 01446 249 249 245 245 230 230 91 108 93 110 127 144 22 22 24 24 27 27 362 379 362 379 384 401 0 0 0 0 0 01447 133 133 131 131 123 123 25 25 26 26 35 35 74 195 80 201 88 209 232 353 237 358 246 367 146 146 146 146 146 1461449 15 15 14 14 13 13 0 0 0 0 0 0 23 23 25 25 28 28 38 38 39 39 41 41 0 0 0 0 0 01450 13 13 12 12 11 11 83 83 90 90 127 127 57 57 62 62 70 70 153 153 164 164 208 208 0 270 0 270 0 2701451 13 13 12 12 11 11 219 219 224 224 307 307 664 700 720 756 794 830 896 932 956 992 1112 1148 1437 1437 1437 1437 1437 14371458 349 349 342 342 322 322 102 545 113 556 163 606 294 477 321 504 360 543 745 1371 776 1402 845 1471 129 335 129 335 129 3351459 39 39 38 38 36 36 270 270 290 290 410 410 208 208 227 227 254 254 517 517 555 555 700 700 0 0 0 0 0 01460 68 68 67 67 63 63 0 0 0 0 0 0 131 131 142 142 159 159 199 199 209 209 222 222 808 1124 808 1124 808 11241461 55 55 54 54 52 52 18 18 19 19 25 25 29 29 31 31 34 34 102 102 104 104 111 111 0 0 0 0 0 0
total 2923 2923 2867 2867 2702 2702 2390 2970 2495 3075 3439 4019 4766 5136 5178 5545 5774 6136 10079 11029 10540 11487 11915 12857 3940 4254 6070 5584 8195 7042% Change
Data Change
Revised RevisedGrowth Rate Per Year 04 to 10 10 to 30
Industrial -0.3% -0.3%Service 0.6% 1.5%
Commercial 1.3% 0.5%Total 0.7% 0.6%
School Enrollment 5.2% 1.3%
Sub-Area TAZs
Industrial Commercial Service School Enroll
0.0% 0.0% 0.0% 24.3% 23.2% 16.9% 7.8% 7.1%
Total
8.0% -8.0% -14.1%6.3% 9.4% 9.0% 7.9%

Subarea TAZs (2004 interpolated)
Number of Households
Without Children
Number of Households
With Children
Number of Vehicles in
Households Without
Children
Number of Vehicles in
Households With
Children
Number of Workers in Households
Without Children
Number of Workers in Households
With Children
Number of Persons in
Households Without
Children
Number of Persons in
Households With
Children
Number of "ALL"
type Occupied
Hotel/Motel Rooms
Industrial Employmen
t
Commercial Employmen
t
Service Employmen
tTotal
EmploymentSchool
Enrollment1 28 13 47 33 36 24 62 52 0 3 0 0 3 02 11 6 17 17 14 12 23 25 0 20 45 86 151 0
650 29 18 42 38 32 29 63 75 0 0 0 0 0 0665 2 0 2 0 2 0 3 0 0 0 0 0 0 0666 0 0 0 0 0 0 0 0 0 0 0 0 0 0838 0 0 0 0 0 0 0 0 0 0 0 74 74 0839 0 0 0 0 0 0 0 0 263 1 51 1402 1454 0840 13 2 26 6 20 4 31 8 0 12 0 458 470 0841 0 0 0 0 0 0 0 0 0 9 0 0 9 0842 0 0 0 0 0 0 0 0 0 46 1 1 48 0843 0 0 0 0 0 0 0 0 0 0 0 0 0 0844 9 5 18 14 14 9 21 19 0 0 0 0 0 0845 16 25 31 72 24 48 37 99 0 65 0 1 66 0846 39 35 78 102 60 67 92 141 0 0 10 0 10 533847 0 0 0 0 0 0 0 0 0 0 0 40 40 0848 0 0 0 0 0 0 0 0 0 9 67 0 76 0
1250 229 384 443 1029 338 721 492 1630 0 9 5 18 32 01251 0 0 0 0 0 0 0 0 0 0 0 44 44 3671252 3 1 7 2 5 1 7 3 0 7 0 2 9 01253 13 18 24 47 19 33 27 74 0 18 4 17 39 01254 11 4 20 11 15 8 22 18 0 0 0 0 0 4271266 2 1 4 2 3 1 5 3 0 14 0 1 15 01289 25 23 49 60 38 42 54 96 0 49 1 1 51 01290 9 7 17 18 13 13 19 29 0 65 0 1 66 01291 92 68 177 179 135 127 197 287 0 105 2 46 153 01294 247 135 472 359 362 254 530 574 12 247 106 23 376 01295 354 280 677 741 521 525 761 1186 0 126 136 86 348 931296 30 27 57 71 44 50 65 112 0 35 18 0 53 01297 42 20 81 52 62 37 91 83 0 304 83 229 616 01298 53 23 103 60 78 43 115 96 0 698 1 160 859 01299 143 65 273 171 210 121 307 273 0 136 17 321 474 01424 115 102 220 269 169 190 247 429 48 11 1035 253 1299 01446 250 110 478 291 367 206 536 465 0 249 91 22 362 01447 181 175 349 466 266 328 388 742 0 133 25 74 232 1461449 271 159 517 420 398 298 582 673 0 15 0 23 38 01450 244 122 465 322 358 228 523 515 0 13 83 57 153 01451 382 264 730 699 561 495 820 1119 32 13 219 664 896 14371458 691 489 1319 1292 1014 915 1483 2068 42 349 102 294 745 1291459 470 290 899 769 690 544 1009 1228 0 39 270 208 517 01460 182 127 347 338 267 239 390 540 0 68 0 131 199 8081461 57 44 109 115 83 82 122 184 0 55 18 29 102 0
total 4243 3042 8098 8065 6218 5694 9124 12846 397 2923 2390 4766 10079 3940

Subarea TAZs (2004 interpolated) REVISED PER LANDUSE SURVEY
Number of Households
Without Children
Number of Households
With Children
Number of Vehicles in
Households Without
Children
Number of Vehicles in
Households With
Children
Number of Workers in Households
Without Children
Number of Workers in Households
With Children
Number of Persons in
Households Without
Children
Number of Persons in
Households With
Children
Number of "ALL"
type Occupied
Hotel/Motel Rooms
Industrial Employmen
t
Commercial Employmen
t
Service Employmen
t
Total Employmen
tSchool
Enrollment1 28 13 47 33 36 24 62 52 0 3 0 0 3 02 11 6 17 17 14 12 23 25 0 20 45 86 151 0
650 29 18 42 38 32 29 63 75 0 0 0 0 0 0665 2 0 2 0 2 0 3 0 0 0 0 0 0 0666 0 0 0 0 0 0 0 0 0 0 0 0 0 0838 0 0 0 0 0 0 0 0 0 0 0 74 74 0839 0 0 0 0 0 0 0 0 302 1 51 1402 1454 0840 13 2 26 6 20 4 31 8 0 12 0 528 540 0841 0 0 0 0 0 0 0 0 0 9 0 0 9 0842 0 0 0 0 0 0 0 0 0 46 1 1 48 0843 0 0 0 0 0 0 0 0 0 0 0 0 0 0844 9 5 18 14 14 9 21 19 0 0 0 0 0 0845 16 25 31 72 24 48 37 99 0 65 0 1 66 0846 39 35 78 102 60 67 92 141 0 0 10 0 10 0847 0 0 0 0 0 0 0 0 0 0 0 0 0 0848 0 0 0 0 0 0 0 0 0 9 85 0 94 0
1250 229 384 443 1029 338 721 492 1630 0 9 5 18 32 01251 0 0 0 0 0 0 0 0 0 0 0 44 44 3671252 21 7 49 14 35 7 49 21 0 7 0 2 9 01253 37 52 69 135 55 95 78 212 0 18 4 17 39 01254 11 4 20 11 15 8 22 18 0 0 0 0 0 4271266 9 4 17 9 13 4 22 13 0 14 0 1 15 01289 37 34 72 89 56 62 80 142 0 49 1 1 51 01290 30 23 56 60 43 43 63 96 0 65 0 1 66 01291 92 68 177 179 135 127 197 287 0 105 86 46 237 551294 247 135 472 359 362 254 530 574 12 247 124 23 394 01295 354 280 677 741 521 525 761 1186 0 126 136 86 348 931296 30 27 57 71 44 50 65 112 0 35 18 0 53 01297 42 20 81 52 62 37 91 83 0 304 83 229 616 01298 53 23 103 60 78 43 115 96 0 698 1 160 859 01299 143 65 273 171 210 121 307 273 0 136 17 321 474 01424 115 102 220 269 169 190 247 429 200 11 1035 253 1299 01446 250 110 478 291 367 206 536 465 0 249 108 22 379 01447 181 175 349 466 266 328 388 742 0 133 25 224 382 2801449 271 159 517 420 398 298 582 673 0 15 0 23 38 01450 244 122 465 322 358 228 523 515 0 13 83 57 153 01451 382 264 730 699 561 495 820 1119 27 13 219 700 932 14371458 691 489 1319 1292 1014 915 1483 2068 50 349 545 477 1371 3351459 470 290 899 769 690 544 1009 1228 0 39 270 208 517 01460 182 127 347 338 267 239 390 540 0 68 0 131 199 11241461 57 44 109 115 83 82 122 184 0 55 18 29 102 0
total 4325 3112 8261 8242 6342 5815 9303 13126 591 2923 2970 5165 11058 4118

Subarea TAZs 2010 Opening Year (interpolated)
Number ofHouseholds
WithoutChildren
Number ofHouseholds
WithChildren
Number ofVehicles in
HouseholdsWithoutChildren
Number ofVehicles in
HouseholdsWith
Children
Number ofWorkers inHouseholds
WithoutChildren
Number ofWorkers inHouseholds
WithChildren
Number ofPersons in
HouseholdsWithoutChildren
Number ofPersons in
HouseholdsWith
Children
Number of"ALL" type
Occupied Hotel/Motel
RoomsIndustrial
EmploymentCommercial
Employment
ServiceEmploymen
t
Total Employmen
tSchool
Enrollment1 30 14 51 37 38 26 66 57 0 3 0 0 3 02 12 7 19 18 15 13 25 27 0 19 46 93 158 0
650 30 19 45 41 34 31 66 80 0 0 0 0 0 0665 1 1 1 0 1 0 2 0 0 0 0 0 0 0666 0 0 0 0 0 0 0 0 0 0 0 0 0 0838 0 0 0 0 0 0 0 0 0 0 0 80 80 0839 0 0 0 0 0 0 0 0 263 1 52 1519 1572 0840 14 2 28 6 21 4 32 8 0 11 0 496 507 0841 0 0 0 0 0 0 0 0 0 9 0 0 9 0842 0 0 0 0 0 0 0 0 0 45 2 2 49 0843 0 0 0 0 0 0 0 0 0 0 0 0 0 0844 23 12 46 35 35 23 53 48 0 0 0 0 0 0845 16 26 32 76 24 50 38 104 0 64 0 3 67 0846 40 37 80 109 61 71 93 149 0 0 11 0 11 1333847 0 0 0 0 0 0 0 0 0 0 0 43 43 0848 0 0 0 0 0 0 0 0 0 9 69 0 78 0
1250 391 679 766 1832 581 1277 842 2884 0 9 13 22 44 01251 0 0 0 0 0 0 0 0 0 0 0 48 48 9171252 4 1 8 1 6 0 8 1 0 7 0 2 9 01253 15 22 29 58 23 41 32 91 0 17 4 19 40 01254 12 5 22 12 17 9 24 20 0 0 0 0 0 10671266 3 1 5 1 4 0 6 1 0 13 0 2 15 01289 29 27 57 71 43 50 62 113 0 48 2 2 52 01290 10 8 20 21 15 15 21 34 0 64 0 3 67 01291 97 74 190 197 143 138 208 313 0 103 2 50 155 01294 261 146 506 394 385 276 561 623 12 243 109 25 377 01295 359 294 698 788 533 552 774 1248 0 124 140 93 357 2331296 30 28 58 73 45 52 65 116 0 34 19 0 53 01297 43 21 83 54 64 39 92 86 0 299 85 248 632 01298 57 25 112 67 84 47 123 106 0 685 1 173 859 01299 151 70 293 188 224 131 325 296 0 134 18 348 500 01424 113 104 221 278 168 195 244 440 120 11 1067 275 1353 01446 264 119 512 318 390 223 567 504 0 245 93 24 362 01447 278 277 543 746 412 521 597 1176 0 131 26 80 237 1461449 274 165 531 442 405 311 589 700 0 14 0 25 39 01450 251 129 486 344 371 242 539 546 0 12 90 62 164 01451 378 269 734 722 559 506 812 1144 30 12 224 720 956 14371458 706 515 1370 1380 1045 967 1518 2184 41 342 113 321 776 1291459 495 314 961 844 732 591 1064 1333 0 38 290 227 555 01460 219 158 424 424 324 297 470 670 0 67 0 142 209 8081461 60 48 117 127 88 89 129 201 0 54 19 31 104 0
total 4666 3617 9048 9704 6890 6787 10047 15303 466 2867 2495 5178 10540 6070
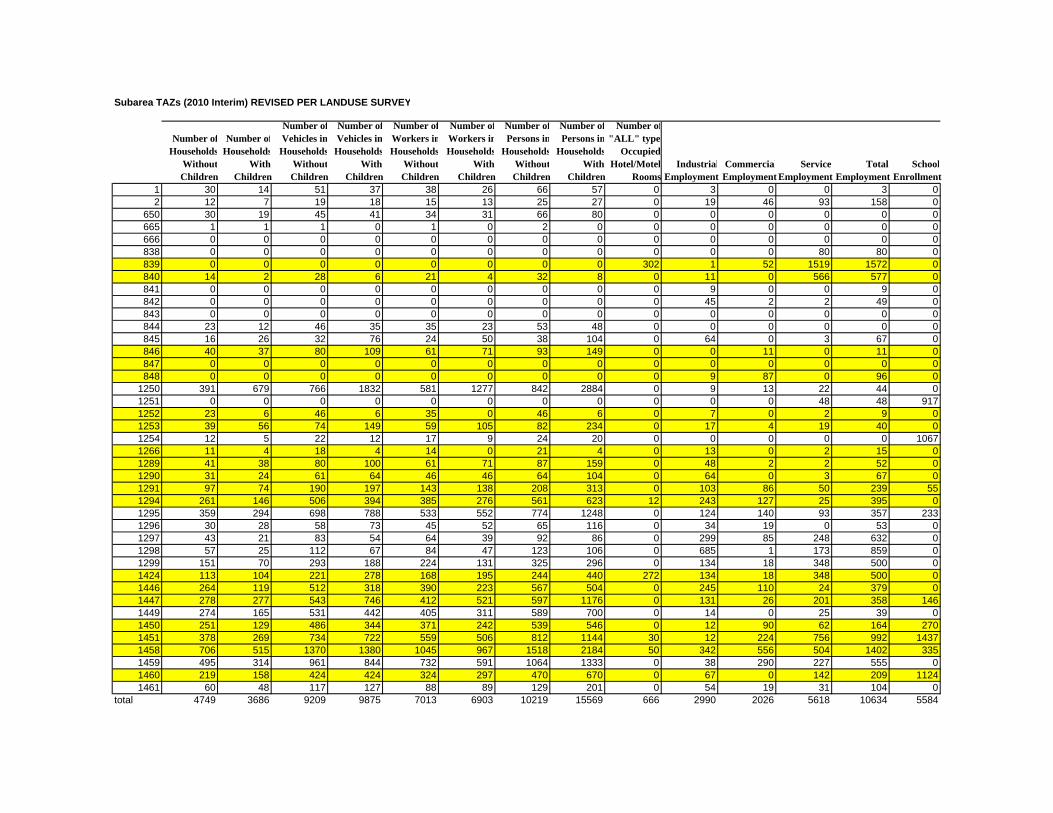
Subarea TAZs (2010 Interim) REVISED PER LANDUSE SURVEY
Number ofHouseholds
WithoutChildren
Number ofHouseholds
WithChildren
Number ofVehicles in
HouseholdsWithoutChildren
Number ofVehicles in
HouseholdsWith
Children
Number ofWorkers inHouseholds
WithoutChildren
Number ofWorkers inHouseholds
WithChildren
Number ofPersons in
HouseholdsWithoutChildren
Number ofPersons in
HouseholdsWith
Children
Number of"ALL" type
Occupied Hotel/Motel
RoomsIndustrial
EmploymentCommercial
EmploymentService
EmploymentTotal
EmploymentSchool
Enrollment1 30 14 51 37 38 26 66 57 0 3 0 0 3 02 12 7 19 18 15 13 25 27 0 19 46 93 158 0
650 30 19 45 41 34 31 66 80 0 0 0 0 0 0665 1 1 1 0 1 0 2 0 0 0 0 0 0 0666 0 0 0 0 0 0 0 0 0 0 0 0 0 0838 0 0 0 0 0 0 0 0 0 0 0 80 80 0839 0 0 0 0 0 0 0 0 302 1 52 1519 1572 0840 14 2 28 6 21 4 32 8 0 11 0 566 577 0841 0 0 0 0 0 0 0 0 0 9 0 0 9 0842 0 0 0 0 0 0 0 0 0 45 2 2 49 0843 0 0 0 0 0 0 0 0 0 0 0 0 0 0844 23 12 46 35 35 23 53 48 0 0 0 0 0 0845 16 26 32 76 24 50 38 104 0 64 0 3 67 0846 40 37 80 109 61 71 93 149 0 0 11 0 11 0847 0 0 0 0 0 0 0 0 0 0 0 0 0 0848 0 0 0 0 0 0 0 0 0 9 87 0 96 0
1250 391 679 766 1832 581 1277 842 2884 0 9 13 22 44 01251 0 0 0 0 0 0 0 0 0 0 0 48 48 9171252 23 6 46 6 35 0 46 6 0 7 0 2 9 01253 39 56 74 149 59 105 82 234 0 17 4 19 40 01254 12 5 22 12 17 9 24 20 0 0 0 0 0 10671266 11 4 18 4 14 0 21 4 0 13 0 2 15 01289 41 38 80 100 61 71 87 159 0 48 2 2 52 01290 31 24 61 64 46 46 64 104 0 64 0 3 67 01291 97 74 190 197 143 138 208 313 0 103 86 50 239 551294 261 146 506 394 385 276 561 623 12 243 127 25 395 01295 359 294 698 788 533 552 774 1248 0 124 140 93 357 2331296 30 28 58 73 45 52 65 116 0 34 19 0 53 01297 43 21 83 54 64 39 92 86 0 299 85 248 632 01298 57 25 112 67 84 47 123 106 0 685 1 173 859 01299 151 70 293 188 224 131 325 296 0 134 18 348 500 01424 113 104 221 278 168 195 244 440 272 134 18 348 500 01446 264 119 512 318 390 223 567 504 0 245 110 24 379 01447 278 277 543 746 412 521 597 1176 0 131 26 201 358 1461449 274 165 531 442 405 311 589 700 0 14 0 25 39 01450 251 129 486 344 371 242 539 546 0 12 90 62 164 2701451 378 269 734 722 559 506 812 1144 30 12 224 756 992 14371458 706 515 1370 1380 1045 967 1518 2184 50 342 556 504 1402 3351459 495 314 961 844 732 591 1064 1333 0 38 290 227 555 01460 219 158 424 424 324 297 470 670 0 67 0 142 209 11241461 60 48 117 127 88 89 129 201 0 54 19 31 104 0
total 4749 3686 9209 9875 7013 6903 10219 15569 666 2990 2026 5618 10634 5584

Subarea TAZs 2030 Future Year (Forecasted)
Number ofHouseholds
WithoutChildren
Number ofHouseholds
WithChildren
Number ofVehicles in
HouseholdsWithoutChildren
Number ofVehicles in
HouseholdsWith
Children
Number ofWorkers inHouseholds
WithoutChildren
Number ofWorkers inHouseholds
With Children
Number ofPersons in
HouseholdsWithoutChildren
Number ofPersons in
HouseholdsWith
Children
Number of"ALL" type
Occupied Hotel/Motel
RoomsIndustrial
EmploymentCommercial
EmploymentService
EmploymentTotal
EmploymentSchool
Enrollment1 36 17 62 46 48 31 80 70 0 3 0 0 3 02 13 9 23 24 17 17 29 38 0 18 63 103 184 0
650 34 23 50 50 38 37 75 97 0 0 0 0 0 0665 1 1 1 1 1 1 2 4 0 0 0 0 0 0666 0 0 0 0 0 0 0 0 0 0 0 0 0 0838 0 0 0 0 0 0 0 0 0 0 0 88 88 0839 0 0 0 0 0 0 0 0 263 1 71 1677 1749 0840 15 2 30 6 23 4 35 8 0 11 0 547 558 0841 0 0 0 0 0 0 0 0 0 9 0 0 9 0842 0 0 0 0 0 0 0 0 0 43 0 6 49 0843 0 0 0 0 0 0 0 0 0 0 0 0 0 0844 390 210 790 623 603 399 915 843 0 0 0 0 0 0845 17 29 35 86 27 55 40 117 0 60 0 8 68 0846 43 42 87 124 66 80 100 168 0 0 15 0 15 2000847 0 0 0 0 0 0 0 0 0 0 0 48 48 0848 0 0 0 0 0 0 0 0 0 9 94 0 103 0
1250 524 926 1031 2506 781 1743 1129 3936 0 9 25 26 60 01251 650 350 1280 947 969 659 1401 1487 0 0 0 53 53 13751252 4 2 8 6 6 4 9 8 0 7 0 2 9 01253 26 39 52 106 39 74 56 165 0 16 5 21 42 01254 350 150 689 406 521 282 754 638 0 0 0 0 0 16001266 3 2 6 6 5 4 6 8 0 12 0 4 16 01289 45 42 89 114 67 80 97 178 0 46 0 5 51 01290 15 13 30 35 22 24 32 55 0 60 0 8 68 01291 117 92 231 249 175 174 252 391 0 97 3 55 155 01294 312 181 614 490 465 341 672 770 12 228 149 28 405 01295 389 328 766 888 580 618 838 1394 0 117 191 103 411 7001296 31 29 61 78 46 54 67 124 0 32 25 0 57 01297 45 22 89 59 67 41 97 93 0 281 116 274 671 01298 71 32 139 87 105 60 153 136 0 645 1 216 862 01299 181 86 356 233 269 162 390 366 0 126 24 384 534 01424 113 107 222 289 169 201 243 455 179 11 1463 304 1778 01446 314 146 618 395 467 275 677 621 0 230 127 27 384 01447 607 617 1195 1670 904 1162 1308 2622 0 123 35 88 246 1461449 288 179 567 484 429 337 621 760 0 13 0 28 41 01450 275 145 541 392 410 273 593 616 0 11 127 70 208 01451 374 276 737 746 558 520 806 1173 28 11 307 794 1112 14371458 774 582 1524 1575 1154 1096 1669 2474 40 322 163 360 845 1291459 590 386 1161 1044 880 727 1271 1640 123 36 410 254 700 01460 574 426 1130 1154 855 802 1237 1811 0 63 0 159 222 8081461 72 59 142 159 108 111 155 250 0 52 25 34 111 0
total 7293 5550 14356 15078 10874 10448 15809 23516 645.27 2702 3439 5774 11915 8195

Subarea TAZs (2030 Future) REVISED PER LANDUSE SURVEY
Number ofHouseholds
WithoutChildren
Number ofHouseholds
WithChildren
Number ofVehicles in
HouseholdsWithoutChildren
Number ofVehicles in
HouseholdsWith
Children
Number ofWorkers inHouseholds
WithoutChildren
Number ofWorkers inHouseholds
WithChildren
Number ofPersons in
HouseholdsWithoutChildren
Number ofPersons in
HouseholdsWith
Children
Number of"ALL" type
Occupied Hotel/Motel
RoomsIndustrial
EmploymentCommercial
Employment
ServiceEmploymen
tTotal
EmploymentSchool
Enrollment1 36 17 62 46 48 31 80 70 0 3 0 0 3 02 13 9 23 24 17 17 29 38 0 18 63 103 184 0
650 34 23 50 50 38 37 75 97 0 0 0 0 0 0665 1 1 1 1 1 1 2 4 0 0 0 0 0 0666 0 0 0 0 0 0 0 0 0 0 0 0 0 0838 0 0 0 0 0 0 0 0 0 0 0 88 88 0839 0 0 0 0 0 0 0 0 302 1 71 1677 1749 0840 15 2 30 6 23 4 35 8 0 11 0 617 628 0841 0 0 0 0 0 0 0 0 0 9 0 0 9 0842 0 0 0 0 0 0 0 0 0 43 0 6 49 0843 0 0 0 0 0 0 0 0 0 0 0 0 0 0844 390 210 790 623 603 399 915 843 0 0 0 0 0 0845 17 29 35 86 27 55 40 117 0 60 0 8 68 0846 43 42 87 124 66 80 100 168 0 0 15 0 15 0847 0 0 0 0 0 0 0 0 0 0 0 0 0 0848 0 0 0 0 0 0 0 0 0 9 112 0 121 0
1250 524 926 1031 2506 781 1743 1129 3936 0 9 25 26 60 01251 650 350 1280 947 969 659 1401 1487 0 0 0 53 53 13751252 20 10 40 30 30 20 45 40 0 7 0 2 9 01253 49 74 98 201 74 140 106 312 0 16 5 21 42 01254 350 150 689 406 521 282 754 638 0 0 0 0 0 16001266 9 6 18 18 15 12 18 24 0 12 0 4 16 01289 57 53 113 144 85 101 123 225 0 46 0 5 51 01290 35 30 70 81 51 56 74 128 0 60 0 8 68 01291 117 92 231 249 175 174 252 391 0 97 87 55 239 551294 312 181 614 490 465 341 672 770 12 228 167 28 423 01295 389 328 766 888 580 618 838 1394 0 117 191 103 411 7001296 31 29 61 78 46 54 67 124 0 32 25 0 57 01297 45 22 89 59 67 41 97 93 0 281 116 274 671 01298 71 32 139 87 105 60 153 136 0 645 1 216 862 01299 181 86 356 233 269 162 390 366 0 126 24 384 534 01424 113 107 222 289 169 201 243 455 331 230 144 27 401 01446 314 146 618 395 467 275 677 621 0 230 144 27 401 01447 607 617 1195 1670 904 1162 1308 2622 0 123 35 209 367 1461449 288 179 567 484 429 337 621 760 0 13 0 28 41 01450 275 145 541 392 410 273 593 616 0 11 127 70 208 2701451 374 276 737 746 558 520 806 1173 28 11 307 830 1148 14371458 774 582 1524 1575 1154 1096 1669 2474 50 322 606 543 1471 3351459 590 386 1161 1044 880 727 1271 1640 123 36 410 254 700 01460 574 426 1130 1154 855 802 1237 1811 0 63 0 159 222 11241461 72 59 142 159 108 111 155 250 0 52 25 34 111 0
total 7370 5625 14510 15285 10990 10591 15975 23831 846 2921 2700 5859 11480 7042

APPENDIX C Model Volume Adjustment Procedures

Screenline Procedure According to the Screenline Procedure, two types of adjustments, Ratio Adjustment and Difference Adjustment were calculated and finally the average of these two adjustments were used to calculate the actual adjusted volume at the links under consideration. The formula for the ratio adjustments and the difference adjustment are shown below: Ratio Adjustment
RATIO = (COUNT/Ab)
Difference Adjustment DIFFERENCE = (COUNT-Ab) + Af
Where, COUNT = Actual base year traffic count Ab = Base year traffic assignment Af = Future year traffic forecast RATIO = Ratio adjusted future year link forecast DIFFERENCE = Difference adjusted future year link forecast Now, the adjusted future year traffic forecast, RAf, is the average of these two results, as follows:
RAf = (RATIO + DIFFERENCE) / 2

Count Model 2-Lane Enhanced 4-Lane 2-Lane
Enhanced 4-Lane
8000 8400 9500 10700 19600 23000
8700 6100 7200 8400 12900 16300
Average Rounded2010 Ratio = 8000
2-Lane 8400Enhanced Difference = (8000 - 8400) + 9500 = 9100
2010 Ratio = 80004-Lane 8400
Difference = (8000 - 8400) + 10700 = 10300
2030 Ratio = 80002-Lane 8400
Enhanced Difference = (8000 - 8400) + 19600 = 19200
2030 Ratio = 80004-Lane 8400
Difference = (8000 - 8400) + 23000 = 22600
2010 Ratio = 87002-Lane 6100
Enhanced Difference = (8700 - 6100) + 7200 = 9800
2010 Ratio = 87004-Lane 6100
Difference = (8700 - 6100) + 8400 = 11000
2030 Ratio = 87002-Lane 6100
Enhanced Difference = (8700 - 6100) + 12900 = 15500
2030 Ratio = 87004-Lane 6100
Difference = (8700 - 6100) + 16300 = 18900
11980
( ) x 7200 =
( ) x 8400 =
( ) x 9500 =
12900 =
( ) x 16300 =
( ) x
9074 9100
18398
1019010245 10200
9048
18933 18900
10269
2324821074 21100
2.5 miles north of U.S. 41
16949 16900
10034 10000
11490 11500
2190522252 22300
( ) x 23000 =
Manual Adjustments for Links North of U.S. 41 (Tamiami Trail) and southwest of U.S. 27 (Okeechobee Road)
2.5 miles north of U.S. 41
200 feet north of U.S. 41
Link Segments
2004 2010 Model 2030 Model
200 feet north of U.S. 41
18667
=
19600 =
( ) x 10700
( ) x
