subgraph-based adversarial examples against graph-based ...alasmary/docs/csonet19.pdf · analyzed...
TRANSCRIPT
Subgraph-based Adversarial Examples AgainstGraph-based IoT Malware Detection Systems
Ahmed Abusnaina1, Hisham Alasmary1, Mohammed Abuhamad1,2
Saeed Salem3, DaeHun Nyang2, and Aziz Mohaisen1
1University of Central Florida, Orlando, FL 32816, USA2Inha University, Incheon, South Korea
3North Dakota State University, Fargo, ND 58105ahmed.abusnaina,hisham,[email protected]
[email protected], [email protected], [email protected]
Abstract. Internet of Things (IoT) has become widely adopted in many fields,including industry, social networks, health care, and smart homes, connecting bil-lions of IoT devices through the internet. Understanding and studying IoT mal-ware through analysis using various approaches, such as Control Flow Graph(CFG)-based features and then applying deep learning detection, are widely ex-plored. In this study, we investigate the robustness of such models against adver-sarial attacks. Our approach crafts the adversarial IoT software using the Sub-graph Embedding and Augmentation (SGEA) method that reduces the embeddedsize required to cause misclassification. Intensive experiments are conducted toevaluate the performance of the proposed method. We observed that SGEA ap-proach is able to misclassify all IoT malware samples as benign by embedding anaverage size of 6.8 nodes. This highlights that the current detection systems areprone to adversarial examples attacks; thus, there is a need to build more robustsystems to detect such manipulated features generated by adversarial examples.
Keywords: IoT Malware Detection, Adversarial Learning, Graph embedding
1 Introduction
Internet of Things (IoT) malware has emerged as one of the most challenging threatson the Internet today [1], and is expected to grow for many years to come. To cope withthis threat, there has been a lot of works in the literature on the analysis, characterizationand detection of IoT malware [2], falling under both static and dynamic analysis-basedapproaches [3]. One of the prominent static-based approaches to IoT analysis and de-tection uses abstract graph structures, such as the control flow graph (CFG) [4–6]. Inusing the CFGs for detecting IoT malware, defenders extract feature representations thatare capable of identifying those malware, including various graph properties, such asthe degree distribution, centrality measures, diameter, radius, etc. [4]. Those properties,represented as a feature vector, are used in tandem with machine learning algorithms toautomate the labeling and detection of IoT malware samples.
As with other machine learning algorithms and applications, machine learning-based IoT malware detection algorithms are prone to manipulation. The rise of adversar-ial machine learning has highlight the fragile nature of those algorithms to perturbation
2 Authors Suppressed Due to Excessive Length
attacks that would lead to misclassification: an adversary can introduce a small modi-fication to the input sample space that would make the classifier to identify a piece ofmalware as a benign sample (i.e., adversarial example; or AE). Indeed, there has beena large body of work exploring the generation of AEs in general image-based classifi-cation problems [7, 8] as well as in the context of malware classification [9–11].
In this work, we optimize the Graph Embedding and Augmentation (GEA), a recentwork on generating AEs in the context of CFG-based malware detection [11]. GEAaims to inject a piece of code into a target sample to alter its graph representation andthe resulting feature used by the machine learning algorithm. In this work, we introducesub-GEA (SGEA), an AE generation algorithm that mines for discriminative patterns(subgraphs) from a targeted class, and embeds such subgraphs in a sample towards gen-erating the AE. SGEA does not only result in a high misclassification rate, but achievesthe essence of AE generation: a small perturbation (as measured by the perturbationsize) to the sample to result in the misclassification.Contributions. Our contributions in this paper are as follows. First, we propose SGEA,a graph embedding technique to generate AEs with reduced injection size. Second, weshow the favorable performance of SGEA by comparing it to GEA for both IoT malwaredetection and classification. GEA and SGEA both generate adversarial IoT softwarethrough embedding representative target sample to the original CFG representation ofthe targeted sample, while maintaining its practicality and functionality. We evaluatethe performance of the methods via intensive experiments showing the effectiveness ofthe approach in producing successful AEs.Organization. In section 2, we discuss the related work. Then, the practical approachfor generating practical adversarial IoT software is described in section 3. The perfor-mance of the proposed approach, evaluated through intensive experiments, are in sec-tion 4. Finally, we conclude our work in section 5.
2 Related Work
Static analysis using various methods, including and CFGs, is well explored. Wuch-ner et al. [12] proposed a graph-based classification system that uses features generatedfrom the quantitative data flow graphs of system calls. Moreover, Alasmary et al. [4]analyzed Android and IoT malware based on CFG features and built a deep learning-based detection system for IoT malware utilizing these features. Caselden et al. [13]proposed an attack on the program binaries using static representations of hybrid infor-mation and CFG. Alam et al. [14] proposed a malware detection system that matchesCFGs of small malware samples and addresses changes occurred in opcodes’ frequen-cies using two methods. Bruschi et al. [15] proposed a CFG-based malware detectionsystem to compare extracted CFGs to known malware samples CFGs and then detectthe malware based on these graphs. Similarly, Yan et al. [16] classified malware samplesusing CFG-based representation with deep convolutional neural networks. Machine anddeep learning algorithms are widely deployed in malware detection [3,4,17]. However,deep learning-based models are vulnerable to adversarial attacks [9]. As a result, cur-rent malware detection systems can be fooled to misclassify crafted malware samplesthat are generated by applying small perturbation to the malware resulting in disastrousconsequences. For example, DeepFool attack was proposed by Moosavi et al. [8] thatuses iterative methods of L2 distance-based adversarial to generate AEs with minimal
Title Suppressed Due to Excessive Length 3
perturbation. Also, Goodfellow et al. [7] proposed fast method attacks, FGSM, to gen-erate AEs that fools the model. Moreover, three adversarial attacks, called C&W, wereproposed by Carlini et al. [18] to explore the robustness of neural networks and existingdefense techniques. Although AE generation approaches are well explored in image-based classifiers, limited research have been conducted on generating AE for malwaresamples [10, 19], such as GEA [11]
3 Generating Adversarial Examples
Adversarial examples are generated by applying perturbation to the input feature space,x′ = x + ε, where x is the input vector, and ε is the perturbation. The adversary aimsto misclassify the output of the targeted model, altering f(x) 6= f(x′), where f isthe model’s output. To reduce the detectability of the generated AEs, ε is minimizedwhile preserving the adversarial behavior, f(x) 6= f(x + δ), where δ = εmin. Todo so, multiple approaches have been proposed [8, 18]. In IoT malware, the processaims to generate realistic AEs that preserve the functionality of the original samples,although not maintained by the literature. Recently, Abusnaina et al. [11] proposed anew approach to highlight these issues, called Graph Embedding and Augmentation(GEA), in which the perturbation is applied at the code-level of the samples, ensuringthe practicality of the generated AE. In this study, SGEA is an enhanced approach togenerate AEs that reduces the perturbation overhead compared to GEA.
#include <stdio.h>void main(){
int a = 0;do{
a++;}while(a < 10);
}
Listing 1.1: C script (original)
#include <stdio.h>void main(){
int x = 0;int s = 0;if (x!=0){
s++;}
}
Listing 1.2: C script (original)
3.1 Graph Embedding and Augmentation (GEA)
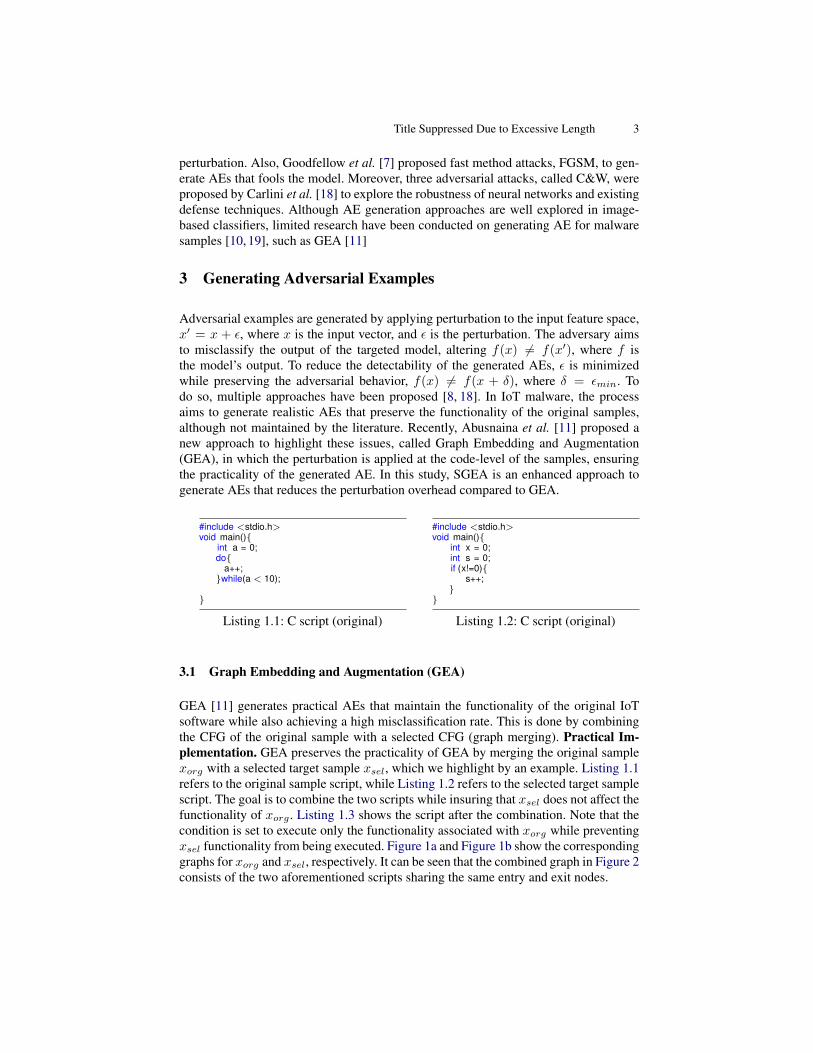
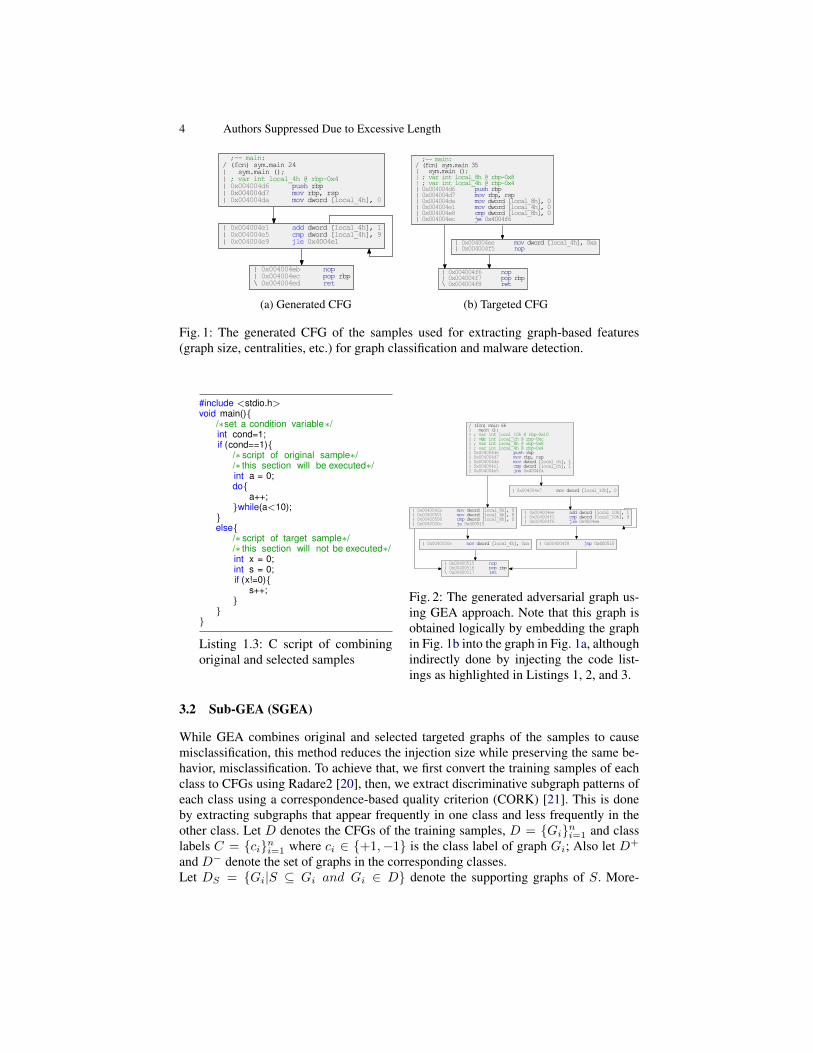
GEA [11] generates practical AEs that maintain the functionality of the original IoTsoftware while also achieving a high misclassification rate. This is done by combiningthe CFG of the original sample with a selected CFG (graph merging). Practical Im-plementation. GEA preserves the practicality of GEA by merging the original samplexorg with a selected target sample xsel, which we highlight by an example. Listing 1.1refers to the original sample script, while Listing 1.2 refers to the selected target samplescript. The goal is to combine the two scripts while insuring that xsel does not affect thefunctionality of xorg. Listing 1.3 shows the script after the combination. Note that thecondition is set to execute only the functionality associated with xorg while preventingxsel functionality from being executed. Figure 1a and Figure 1b show the correspondinggraphs for xorg and xsel, respectively. It can be seen that the combined graph in Figure 2consists of the two aforementioned scripts sharing the same entry and exit nodes.
4 Authors Suppressed Due to Excessive Length
;-- main:/ (fcn) sym.main 24| sym.main ();| ; var int local_4h @ rbp-0x4| 0x004004d6 push rbp| 0x004004d7 mov rbp, rsp| 0x004004da mov dword [local_4h], 0
| 0x004004e1 add dword [local_4h], 1| 0x004004e5 cmp dword [local_4h], 9| 0x004004e9 jle 0x4004e1
| 0x004004eb nop| 0x004004ec pop rbp\ 0x004004ed ret
(a) Generated CFG
;-- main:/ (fcn) sym.main 35| sym.main ();| ; var int local_8h @ rbp-0x8| ; var int local_4h @ rbp-0x4| 0x004004d6 push rbp| 0x004004d7 mov rbp, rsp| 0x004004da mov dword [local_8h], 0| 0x004004e1 mov dword [local_4h], 0| 0x004004e8 cmp dword [local_8h], 0| 0x004004ec je 0x4004f6
| 0x004004f6 nop| 0x004004f7 pop rbp\ 0x004004f8 ret
| 0x004004ee mov dword [local_4h], 0xa| 0x004004f5 nop
(b) Targeted CFG
Fig. 1: The generated CFG of the samples used for extracting graph-based features(graph size, centralities, etc.) for graph classification and malware detection.
#include <stdio.h>void main(){
/∗set a condition variable∗/int cond=1;if (cond==1){
/∗ script of original sample∗//∗ this section will be executed∗/int a = 0;do{
a++;}while(a<10);
}else{
/∗ script of target sample∗//∗ this section will not be executed∗/int x = 0;int s = 0;if (x!=0){
s++;}
}}
Listing 1.3: C script of combiningoriginal and selected samples
/ (fcn) main 66| main ();| ; var int local_10h @ rbp-0x10| ; va0r int local_ch @ rbp-0xc| ; var int local_8h @ rbp-0x8| ; var int local_4h @ rbp-0x4| 0x004004d6 push rbp| 0x004004d7 mov rbp, rsp| 0x004004da mov dword [local_ch], 1| 0x004004e1 cmp dword [local_ch], 1| 0x004004e5 jne 0x4004fa
| 0x004004fa mov dword [local_8h], 0| 0x00400501 mov dword [local_4h], 0| 0x00400508 cmp dword [local_8h], 0| 0x0040050c je 0x400515
| 0x004004e7 mov dword [local_10h], 0
| 0x00400515 nop| 0x00400516 pop rbp\ 0x00400517 ret
| 0x0040050e mov dword [local_4h], 0xa
| 0x004004ee add dword [local_10h], 1| 0x004004f2 cmp dword [local_10h], 9| 0x004004f6 jle 0x4004ee
| 0x004004f8 jmp 0x400515
Fig. 2: The generated adversarial graph us-ing GEA approach. Note that this graph isobtained logically by embedding the graphin Fig. 1b into the graph in Fig. 1a, althoughindirectly done by injecting the code list-ings as highlighted in Listings 1, 2, and 3.
3.2 Sub-GEA (SGEA)
While GEA combines original and selected targeted graphs of the samples to causemisclassification, this method reduces the injection size while preserving the same be-havior, misclassification. To achieve that, we first convert the training samples of eachclass to CFGs using Radare2 [20], then, we extract discriminative subgraph patterns ofeach class using a correspondence-based quality criterion (CORK) [21]. This is doneby extracting subgraphs that appear frequently in one class and less frequently in theother class. Let D denotes the CFGs of the training samples, D = {Gi}ni=1 and classlabels C = {ci}ni=1 where ci ∈ {+1,−1} is the class label of graph Gi; Also let D+
and D− denote the set of graphs in the corresponding classes.Let DS = {Gi|S ⊆ Gi and Gi ∈ D} denote the supporting graphs of S. More-
Title Suppressed Due to Excessive Length 5
over, let D+S and D−S , denote the supporting graphs of the subgraph in the positive
graphs and negative graphs, respectively. The CORK algorithm defines a submodu-lar quality criterion, q, for a subgraph based on the set of supporting graphs (‘hits’)and non-supporting graphs (‘misses’) in the two classes and is calculated as follows:q(Gs) = −(|D+∼
S | ∗ |D+∼S | + |D
+S | ∗ |D
−S |). The best quality score is achieved when
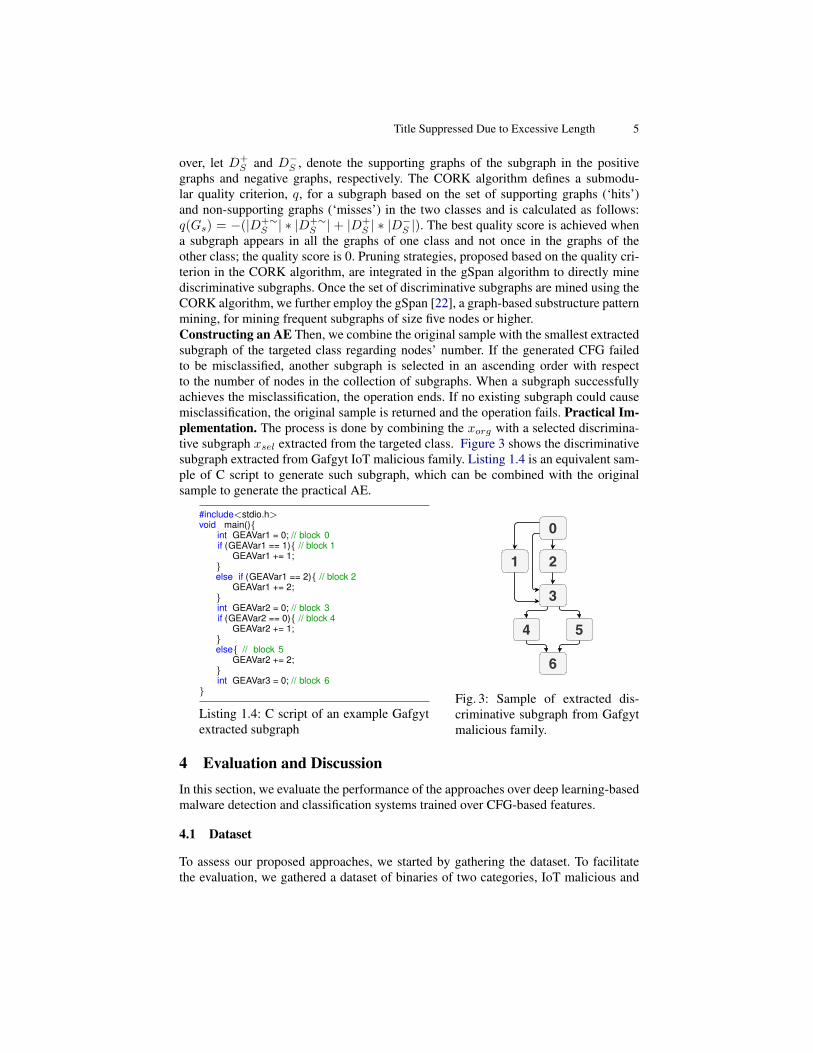
a subgraph appears in all the graphs of one class and not once in the graphs of theother class; the quality score is 0. Pruning strategies, proposed based on the quality cri-terion in the CORK algorithm, are integrated in the gSpan algorithm to directly minediscriminative subgraphs. Once the set of discriminative subgraphs are mined using theCORK algorithm, we further employ the gSpan [22], a graph-based substructure patternmining, for mining frequent subgraphs of size five nodes or higher.Constructing an AE Then, we combine the original sample with the smallest extractedsubgraph of the targeted class regarding nodes’ number. If the generated CFG failedto be misclassified, another subgraph is selected in an ascending order with respectto the number of nodes in the collection of subgraphs. When a subgraph successfullyachieves the misclassification, the operation ends. If no existing subgraph could causemisclassification, the original sample is returned and the operation fails. Practical Im-plementation. The process is done by combining the xorg with a selected discrimina-tive subgraph xsel extracted from the targeted class. Figure 3 shows the discriminativesubgraph extracted from Gafgyt IoT malicious family. Listing 1.4 is an equivalent sam-ple of C script to generate such subgraph, which can be combined with the originalsample to generate the practical AE.
#include<stdio.h>void main(){
int GEAVar1 = 0; // block 0if (GEAVar1 == 1){ // block 1
GEAVar1 += 1;}else if (GEAVar1 == 2){ // block 2
GEAVar1 += 2;}int GEAVar2 = 0; // block 3if (GEAVar2 == 0){ // block 4
GEAVar2 += 1;}else{ // block 5
GEAVar2 += 2;}int GEAVar3 = 0; // block 6
}
Listing 1.4: C script of an example Gafgytextracted subgraph
1 2
3
54
6
0
Fig. 3: Sample of extracted dis-criminative subgraph from Gafgytmalicious family.
4 Evaluation and DiscussionIn this section, we evaluate the performance of the approaches over deep learning-basedmalware detection and classification systems trained over CFG-based features.
4.1 Dataset
To assess our proposed approaches, we started by gathering the dataset. To facilitatethe evaluation, we gathered a dataset of binaries of two categories, IoT malicious and
6 Authors Suppressed Due to Excessive Length
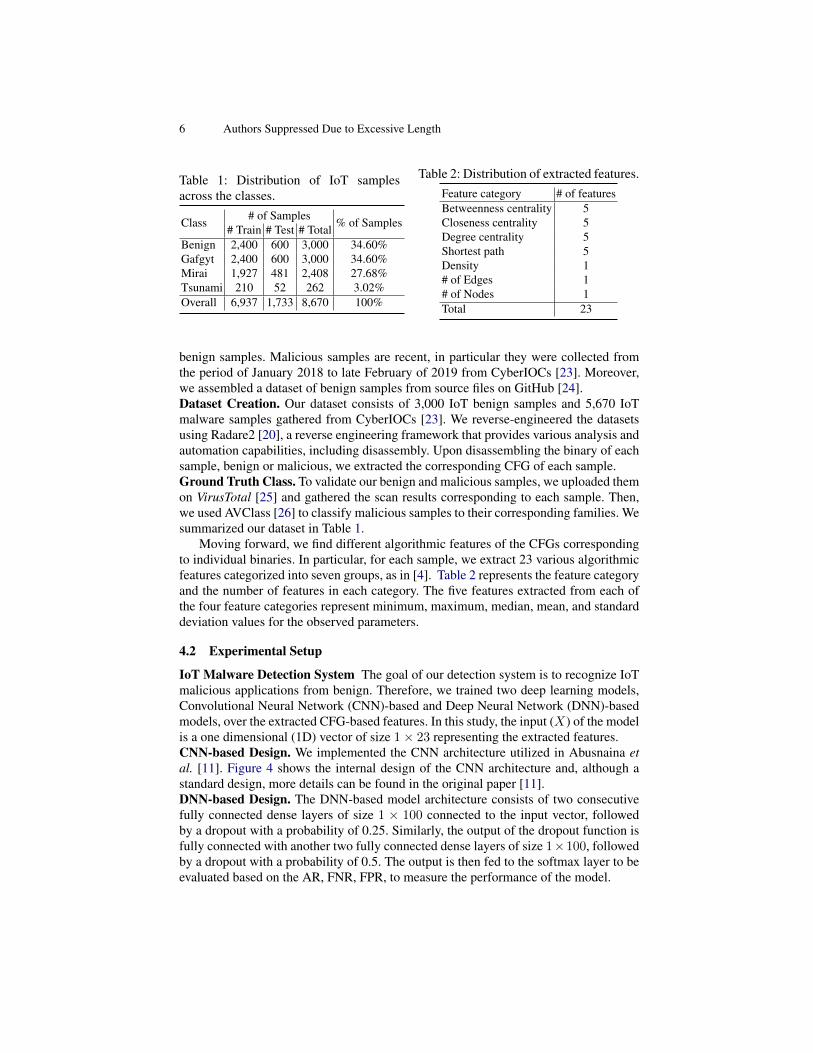
Table 1: Distribution of IoT samplesacross the classes.
Class # of Samples % of Samples# Train # Test # TotalBenign 2,400 600 3,000 34.60%Gafgyt 2,400 600 3,000 34.60%Mirai 1,927 481 2,408 27.68%Tsunami 210 52 262 3.02%Overall 6,937 1,733 8,670 100%
Table 2: Distribution of extracted features.Feature category # of featuresBetweenness centrality 5Closeness centrality 5Degree centrality 5Shortest path 5Density 1# of Edges 1# of Nodes 1Total 23
benign samples. Malicious samples are recent, in particular they were collected fromthe period of January 2018 to late February of 2019 from CyberIOCs [23]. Moreover,we assembled a dataset of benign samples from source files on GitHub [24].Dataset Creation. Our dataset consists of 3,000 IoT benign samples and 5,670 IoTmalware samples gathered from CyberIOCs [23]. We reverse-engineered the datasetsusing Radare2 [20], a reverse engineering framework that provides various analysis andautomation capabilities, including disassembly. Upon disassembling the binary of eachsample, benign or malicious, we extracted the corresponding CFG of each sample.Ground Truth Class. To validate our benign and malicious samples, we uploaded themon VirusTotal [25] and gathered the scan results corresponding to each sample. Then,we used AVClass [26] to classify malicious samples to their corresponding families. Wesummarized our dataset in Table 1.
Moving forward, we find different algorithmic features of the CFGs correspondingto individual binaries. In particular, for each sample, we extract 23 various algorithmicfeatures categorized into seven groups, as in [4]. Table 2 represents the feature categoryand the number of features in each category. The five features extracted from each ofthe four feature categories represent minimum, maximum, median, mean, and standarddeviation values for the observed parameters.
4.2 Experimental Setup
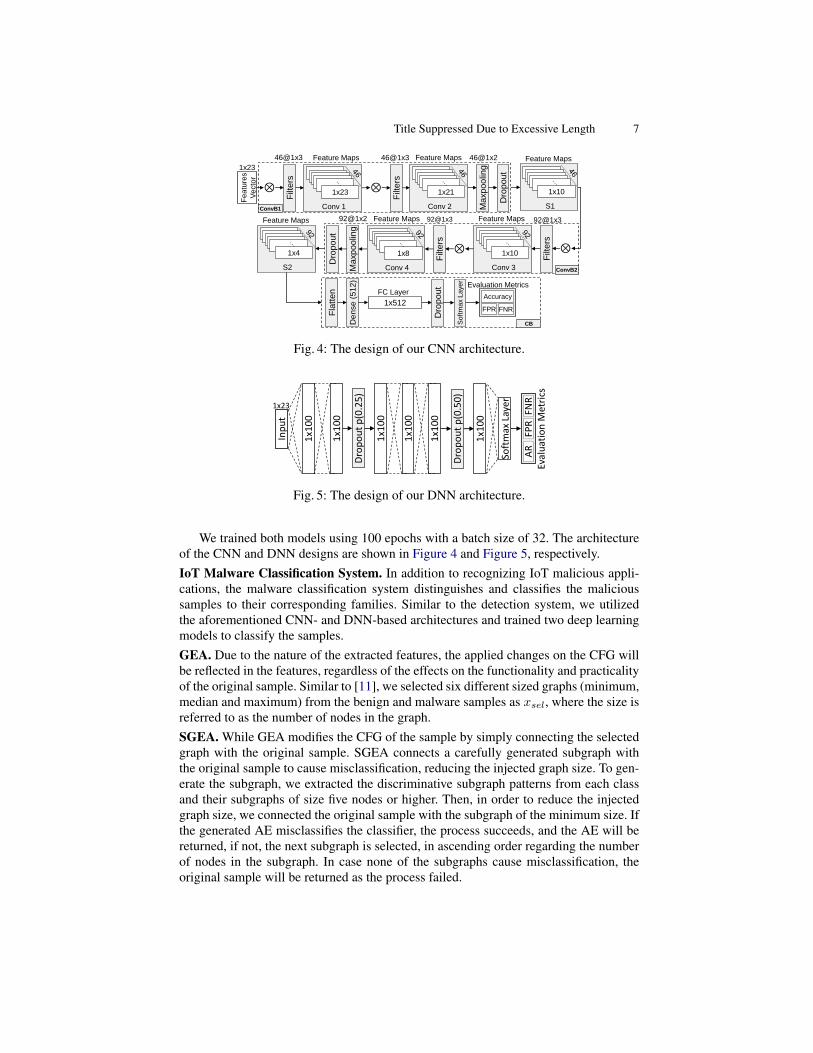
IoT Malware Detection System The goal of our detection system is to recognize IoTmalicious applications from benign. Therefore, we trained two deep learning models,Convolutional Neural Network (CNN)-based and Deep Neural Network (DNN)-basedmodels, over the extracted CFG-based features. In this study, the input (X) of the modelis a one dimensional (1D) vector of size 1× 23 representing the extracted features.CNN-based Design. We implemented the CNN architecture utilized in Abusnaina etal. [11]. Figure 4 shows the internal design of the CNN architecture and, although astandard design, more details can be found in the original paper [11].DNN-based Design. The DNN-based model architecture consists of two consecutivefully connected dense layers of size 1 × 100 connected to the input vector, followedby a dropout with a probability of 0.25. Similarly, the output of the dropout function isfully connected with another two fully connected dense layers of size 1×100, followedby a dropout with a probability of 0.5. The output is then fed to the softmax layer to beevaluated based on the AR, FNR, FPR, to measure the performance of the model.
Title Suppressed Due to Excessive Length 7
Fe
atu
res
Ve
cto
r
1x23
⊗ ⊗
46@1x3 Feature Maps
Ma
xp
oo
ling
46@1x3 Feature Maps 46@1x2
Dro
po
ut
FC Layer
ConvB1
Filt
ers
Filt
ers
⊗
Filt
ers
⊗
Filt
ers
Ma
xp
oo
ling
Dro
po
ut
ConvB2
Feature Maps 92@1x2 Feature Maps 92@1x3 Feature Maps 92@1x3
Fla
tte
n
De
nse
(5
12
)
1x512
Dro
po
ut
So
ftm
ax
Laye
r
Accuracy
FPR FNR
Evaluation Metrics
CB
Feature Maps
1x23
Conv 1
1x21
Conv 2
1x10
S1
1x4
S2
1x8
Conv 4
1x10
Conv 3
Fig. 4: The design of our CNN architecture.
1/21
Inp
ut
1x23
1x1
00
1x1
00
1x1
00
1x1
00
1x1
00
Soft
max
Laye
r
Dro
po
ut
p(0
.25
)
FPR
FNR
AR
Eval
uat
ion
Met
rics
1x1
00
Dro
po
ut
p(0
.50
)
Fig. 5: The design of our DNN architecture.
We trained both models using 100 epochs with a batch size of 32. The architectureof the CNN and DNN designs are shown in Figure 4 and Figure 5, respectively.IoT Malware Classification System. In addition to recognizing IoT malicious appli-cations, the malware classification system distinguishes and classifies the malicioussamples to their corresponding families. Similar to the detection system, we utilizedthe aforementioned CNN- and DNN-based architectures and trained two deep learningmodels to classify the samples.GEA. Due to the nature of the extracted features, the applied changes on the CFG willbe reflected in the features, regardless of the effects on the functionality and practicalityof the original sample. Similar to [11], we selected six different sized graphs (minimum,median and maximum) from the benign and malware samples as xsel, where the size isreferred to as the number of nodes in the graph.SGEA. While GEA modifies the CFG of the sample by simply connecting the selectedgraph with the original sample. SGEA connects a carefully generated subgraph withthe original sample to cause misclassification, reducing the injected graph size. To gen-erate the subgraph, we extracted the discriminative subgraph patterns from each classand their subgraphs of size five nodes or higher. Then, in order to reduce the injectedgraph size, we connected the original sample with the subgraph of the minimum size. Ifthe generated AE misclassifies the classifier, the process succeeds, and the AE will bereturned, if not, the next subgraph is selected, in ascending order regarding the numberof nodes in the subgraph. In case none of the subgraphs cause misclassification, theoriginal sample will be returned as the process failed.
8 Authors Suppressed Due to Excessive Length
Benign Gafgyt Mirai Tsunami
Benign
Gafgyt
Mirai
Tsunami
0.985 0 0.006 0.041
0.005 0.995 0.022 0
0.01 0.005 0.961 0
0 0 0.01 0.959
(a) CNN-based
Benign Gafgyt Mirai Tsunami
Benign
Gafgyt
Mirai
Tsunami
0.982 0.002 0.014 0
0.005 0.987 0.022 0
0.013 0.012 0.953 0
0 0 0.01 1
(b) DNN-based
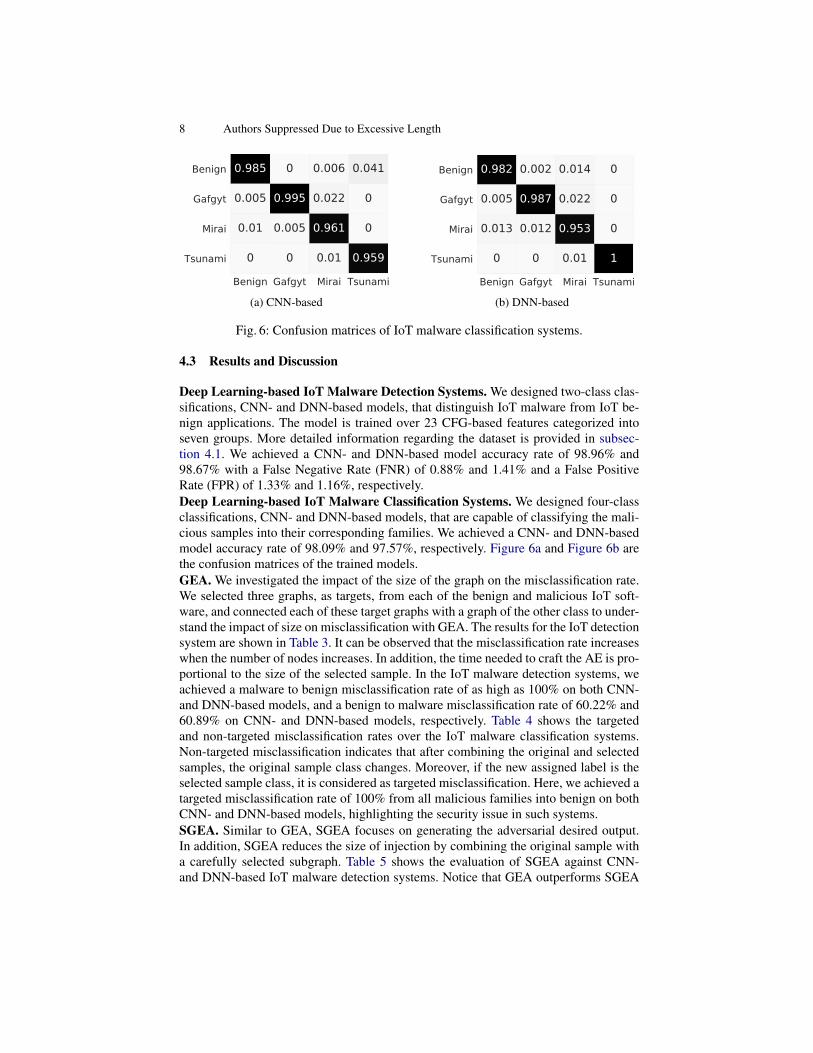
Fig. 6: Confusion matrices of IoT malware classification systems.
4.3 Results and Discussion
Deep Learning-based IoT Malware Detection Systems. We designed two-class clas-sifications, CNN- and DNN-based models, that distinguish IoT malware from IoT be-nign applications. The model is trained over 23 CFG-based features categorized intoseven groups. More detailed information regarding the dataset is provided in subsec-tion 4.1. We achieved a CNN- and DNN-based model accuracy rate of 98.96% and98.67% with a False Negative Rate (FNR) of 0.88% and 1.41% and a False PositiveRate (FPR) of 1.33% and 1.16%, respectively.Deep Learning-based IoT Malware Classification Systems. We designed four-classclassifications, CNN- and DNN-based models, that are capable of classifying the mali-cious samples into their corresponding families. We achieved a CNN- and DNN-basedmodel accuracy rate of 98.09% and 97.57%, respectively. Figure 6a and Figure 6b arethe confusion matrices of the trained models.GEA. We investigated the impact of the size of the graph on the misclassification rate.We selected three graphs, as targets, from each of the benign and malicious IoT soft-ware, and connected each of these target graphs with a graph of the other class to under-stand the impact of size on misclassification with GEA. The results for the IoT detectionsystem are shown in Table 3. It can be observed that the misclassification rate increaseswhen the number of nodes increases. In addition, the time needed to craft the AE is pro-portional to the size of the selected sample. In the IoT malware detection systems, weachieved a malware to benign misclassification rate of as high as 100% on both CNN-and DNN-based models, and a benign to malware misclassification rate of 60.22% and60.89% on CNN- and DNN-based models, respectively. Table 4 shows the targetedand non-targeted misclassification rates over the IoT malware classification systems.Non-targeted misclassification indicates that after combining the original and selectedsamples, the original sample class changes. Moreover, if the new assigned label is theselected sample class, it is considered as targeted misclassification. Here, we achieved atargeted misclassification rate of 100% from all malicious families into benign on bothCNN- and DNN-based models, highlighting the security issue in such systems.SGEA. Similar to GEA, SGEA focuses on generating the adversarial desired output.In addition, SGEA reduces the size of injection by combining the original sample witha carefully selected subgraph. Table 5 shows the evaluation of SGEA against CNN-and DNN-based IoT malware detection systems. Notice that GEA outperforms SGEA
Title Suppressed Due to Excessive Length 9
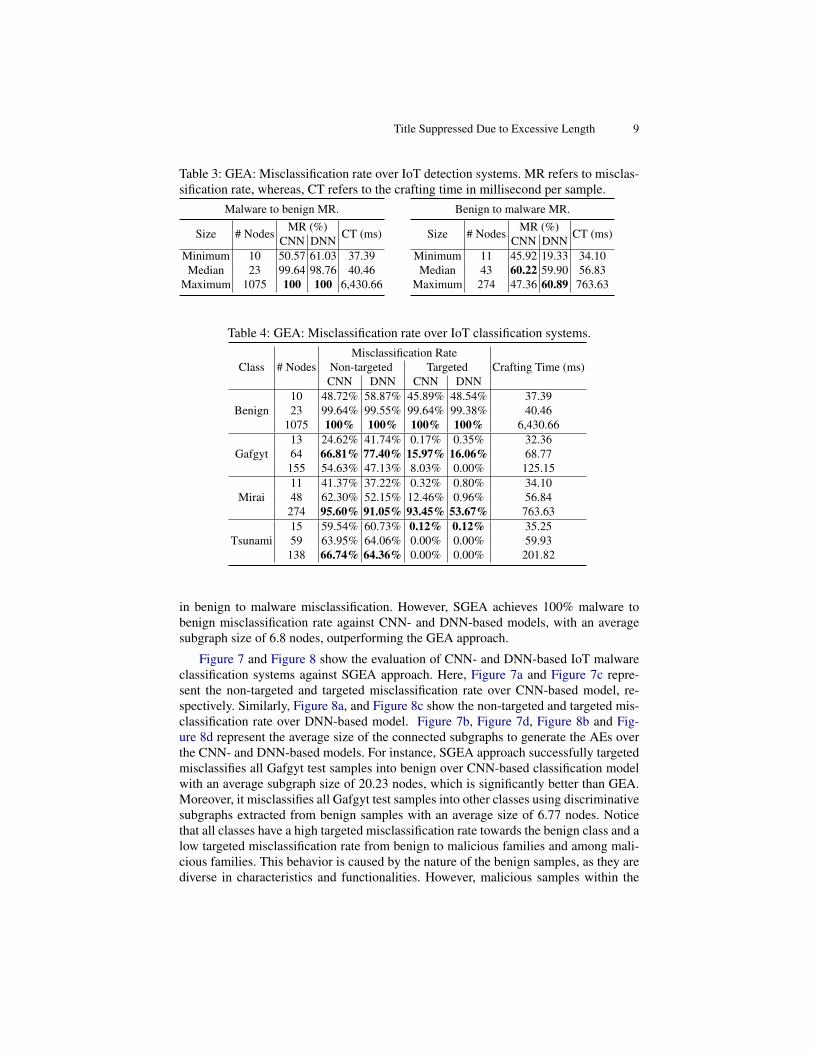
Table 3: GEA: Misclassification rate over IoT detection systems. MR refers to misclas-sification rate, whereas, CT refers to the crafting time in millisecond per sample.
Malware to benign MR.
Size # Nodes MR (%) CT (ms)CNN DNNMinimum 10 50.57 61.03 37.39Median 23 99.64 98.76 40.46
Maximum 1075 100 100 6,430.66
Benign to malware MR.
Size # Nodes MR (%) CT (ms)CNN DNNMinimum 11 45.92 19.33 34.10Median 43 60.22 59.90 56.83
Maximum 274 47.36 60.89 763.63
Table 4: GEA: Misclassification rate over IoT classification systems.
Class # NodesMisclassification Rate
Crafting Time (ms)Non-targeted TargetedCNN DNN CNN DNN
Benign10 48.72% 58.87% 45.89% 48.54% 37.3923 99.64% 99.55% 99.64% 99.38% 40.46
1075 100% 100% 100% 100% 6,430.66
Gafgyt13 24.62% 41.74% 0.17% 0.35% 32.3664 66.81% 77.40% 15.97% 16.06% 68.77
155 54.63% 47.13% 8.03% 0.00% 125.15
Mirai11 41.37% 37.22% 0.32% 0.80% 34.1048 62.30% 52.15% 12.46% 0.96% 56.84
274 95.60% 91.05% 93.45% 53.67% 763.63
Tsunami15 59.54% 60.73% 0.12% 0.12% 35.2559 63.95% 64.06% 0.00% 0.00% 59.93
138 66.74% 64.36% 0.00% 0.00% 201.82
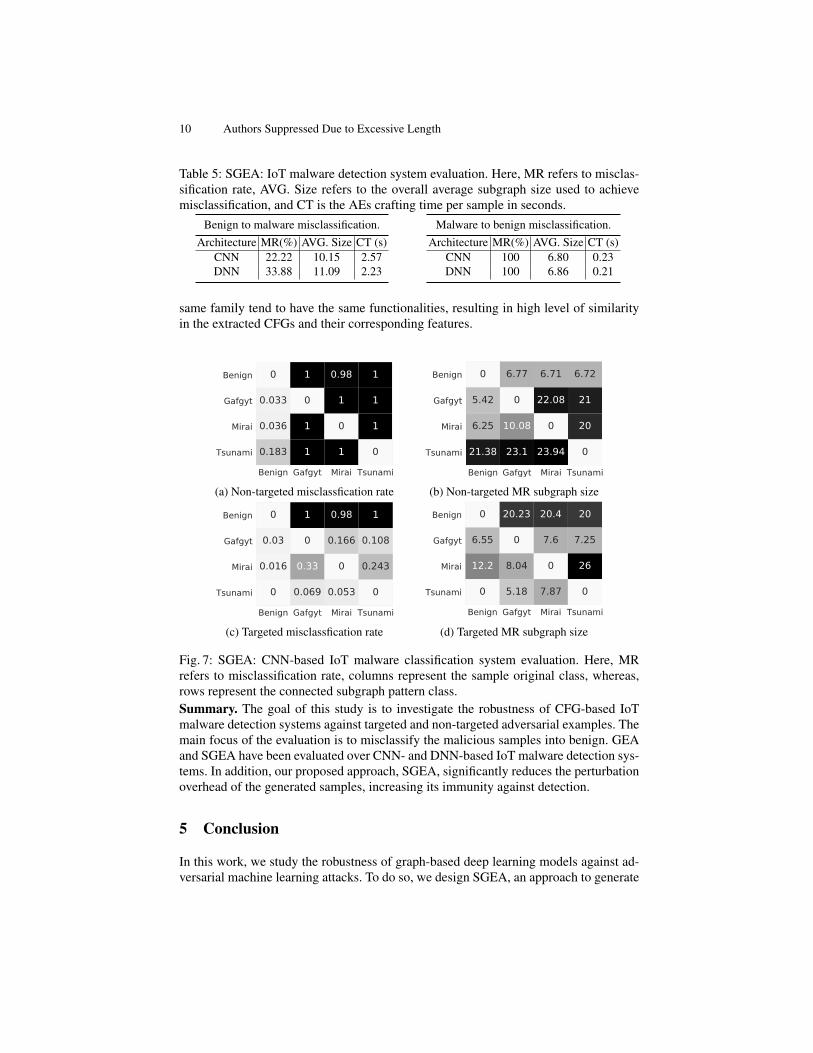
in benign to malware misclassification. However, SGEA achieves 100% malware tobenign misclassification rate against CNN- and DNN-based models, with an averagesubgraph size of 6.8 nodes, outperforming the GEA approach.
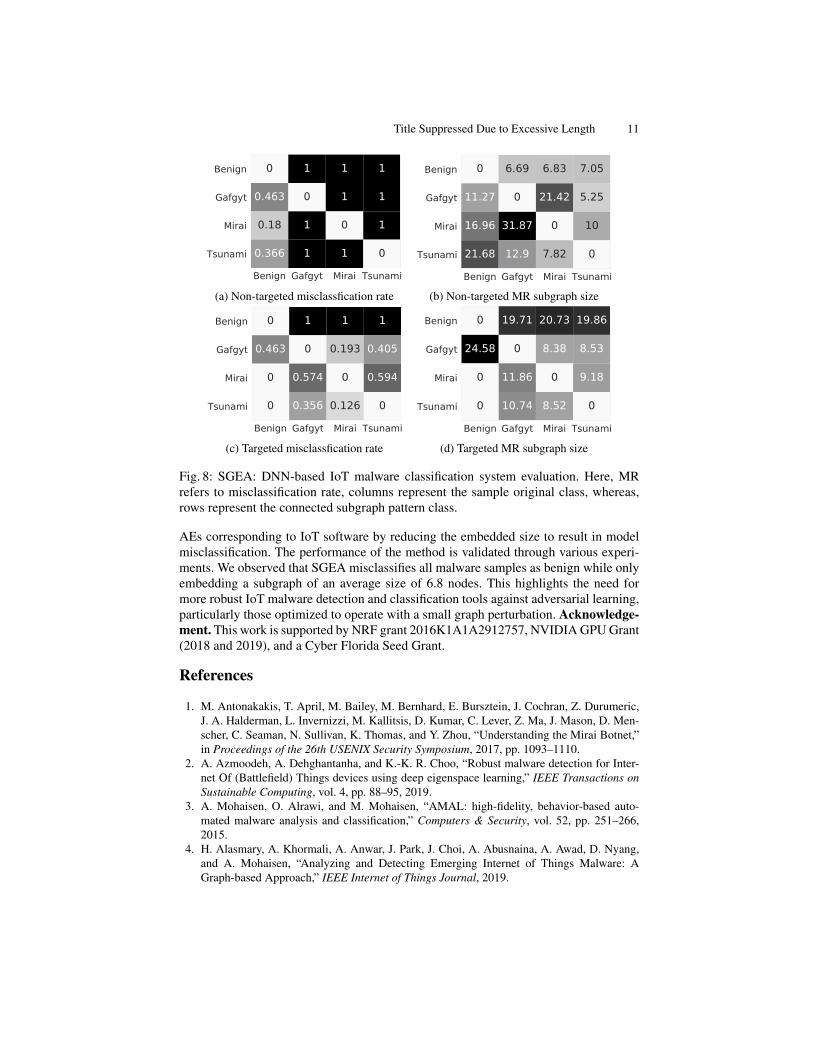
Figure 7 and Figure 8 show the evaluation of CNN- and DNN-based IoT malwareclassification systems against SGEA approach. Here, Figure 7a and Figure 7c repre-sent the non-targeted and targeted misclassification rate over CNN-based model, re-spectively. Similarly, Figure 8a, and Figure 8c show the non-targeted and targeted mis-classification rate over DNN-based model. Figure 7b, Figure 7d, Figure 8b and Fig-ure 8d represent the average size of the connected subgraphs to generate the AEs overthe CNN- and DNN-based models. For instance, SGEA approach successfully targetedmisclassifies all Gafgyt test samples into benign over CNN-based classification modelwith an average subgraph size of 20.23 nodes, which is significantly better than GEA.Moreover, it misclassifies all Gafgyt test samples into other classes using discriminativesubgraphs extracted from benign samples with an average size of 6.77 nodes. Noticethat all classes have a high targeted misclassification rate towards the benign class and alow targeted misclassification rate from benign to malicious families and among mali-cious families. This behavior is caused by the nature of the benign samples, as they arediverse in characteristics and functionalities. However, malicious samples within the
10 Authors Suppressed Due to Excessive Length
Table 5: SGEA: IoT malware detection system evaluation. Here, MR refers to misclas-sification rate, AVG. Size refers to the overall average subgraph size used to achievemisclassification, and CT is the AEs crafting time per sample in seconds.
Benign to malware misclassification.Architecture MR(%) AVG. Size CT (s)
CNN 22.22 10.15 2.57DNN 33.88 11.09 2.23
Malware to benign misclassification.Architecture MR(%) AVG. Size CT (s)
CNN 100 6.80 0.23DNN 100 6.86 0.21
same family tend to have the same functionalities, resulting in high level of similarityin the extracted CFGs and their corresponding features.
Benign Gafgyt Mirai Tsunami
Benign
Gafgyt
Mirai
Tsunami
0 1 0.98 1
0.033 0 1 1
0.036 1 0 1
0.183 1 1 0
(a) Non-targeted misclassfication rate
Benign Gafgyt Mirai Tsunami
Benign
Gafgyt
Mirai
Tsunami
0 6.77 6.71 6.72
5.42 0 22.08 21
6.25 10.08 0 20
21.38 23.1 23.94 0
(b) Non-targeted MR subgraph size
Benign Gafgyt Mirai Tsunami
Benign
Gafgyt
Mirai
Tsunami
0 1 0.98 1
0.03 0 0.166 0.108
0.016 0.33 0 0.243
0 0.069 0.053 0
(c) Targeted misclassfication rate
Benign Gafgyt Mirai Tsunami
Benign
Gafgyt
Mirai
Tsunami
0 20.23 20.4 20
6.55 0 7.6 7.25
12.2 8.04 0 26
0 5.18 7.87 0
(d) Targeted MR subgraph size
Fig. 7: SGEA: CNN-based IoT malware classification system evaluation. Here, MRrefers to misclassification rate, columns represent the sample original class, whereas,rows represent the connected subgraph pattern class.Summary. The goal of this study is to investigate the robustness of CFG-based IoTmalware detection systems against targeted and non-targeted adversarial examples. Themain focus of the evaluation is to misclassify the malicious samples into benign. GEAand SGEA have been evaluated over CNN- and DNN-based IoT malware detection sys-tems. In addition, our proposed approach, SGEA, significantly reduces the perturbationoverhead of the generated samples, increasing its immunity against detection.
5 Conclusion
In this work, we study the robustness of graph-based deep learning models against ad-versarial machine learning attacks. To do so, we design SGEA, an approach to generate
Title Suppressed Due to Excessive Length 11
Benign Gafgyt Mirai Tsunami
Benign
Gafgyt
Mirai
Tsunami
0 1 1 1
0.463 0 1 1
0.18 1 0 1
0.366 1 1 0
(a) Non-targeted misclassfication rate
Benign Gafgyt Mirai Tsunami
Benign
Gafgyt
Mirai
Tsunami
0 6.69 6.83 7.05
11.27 0 21.42 5.25
16.96 31.87 0 10
21.68 12.9 7.82 0
(b) Non-targeted MR subgraph size
Benign Gafgyt Mirai Tsunami
Benign
Gafgyt
Mirai
Tsunami
0 1 1 1
0.463 0 0.193 0.405
0 0.574 0 0.594
0 0.356 0.126 0
(c) Targeted misclassfication rate
Benign Gafgyt Mirai Tsunami
Benign
Gafgyt
Mirai
Tsunami
0 19.71 20.73 19.86
24.58 0 8.38 8.53
0 11.86 0 9.18
0 10.74 8.52 0
(d) Targeted MR subgraph size
Fig. 8: SGEA: DNN-based IoT malware classification system evaluation. Here, MRrefers to misclassification rate, columns represent the sample original class, whereas,rows represent the connected subgraph pattern class.
AEs corresponding to IoT software by reducing the embedded size to result in modelmisclassification. The performance of the method is validated through various experi-ments. We observed that SGEA misclassifies all malware samples as benign while onlyembedding a subgraph of an average size of 6.8 nodes. This highlights the need formore robust IoT malware detection and classification tools against adversarial learning,particularly those optimized to operate with a small graph perturbation. Acknowledge-ment. This work is supported by NRF grant 2016K1A1A2912757, NVIDIA GPU Grant(2018 and 2019), and a Cyber Florida Seed Grant.
References
1. M. Antonakakis, T. April, M. Bailey, M. Bernhard, E. Bursztein, J. Cochran, Z. Durumeric,J. A. Halderman, L. Invernizzi, M. Kallitsis, D. Kumar, C. Lever, Z. Ma, J. Mason, D. Men-scher, C. Seaman, N. Sullivan, K. Thomas, and Y. Zhou, “Understanding the Mirai Botnet,”in Proceedings of the 26th USENIX Security Symposium, 2017, pp. 1093–1110.
2. A. Azmoodeh, A. Dehghantanha, and K.-K. R. Choo, “Robust malware detection for Inter-net Of (Battlefield) Things devices using deep eigenspace learning,” IEEE Transactions onSustainable Computing, vol. 4, pp. 88–95, 2019.
3. A. Mohaisen, O. Alrawi, and M. Mohaisen, “AMAL: high-fidelity, behavior-based auto-mated malware analysis and classification,” Computers & Security, vol. 52, pp. 251–266,2015.
4. H. Alasmary, A. Khormali, A. Anwar, J. Park, J. Choi, A. Abusnaina, A. Awad, D. Nyang,and A. Mohaisen, “Analyzing and Detecting Emerging Internet of Things Malware: AGraph-based Approach,” IEEE Internet of Things Journal, 2019.
12 Authors Suppressed Due to Excessive Length
5. A. Mohaisen, A. Yun, and Y. Kim, “Measuring the mixing time of social graphs,” in ACMIMC, 2010, pp. 383–389.
6. A. Mohaisen, N. Hopper, and Y. Kim, “Keep your friends close: Incorporating trust intosocial network-based sybil defenses,” in Proceedings of the 30th IEEE International Confer-ence on Computer Communications, INFOCOM, 2011, pp. 1943–1951.
7. C. S. Ian J. Goodfellow, Jonathon Shlens, “Explaining and harnessing adversarial examples,”in International Conference on Learning Representations., 2015, pp. 1–11.
8. S. Moosavi-Dezfooli, A. Fawzi, and P. Frossard, “DeepFool: A simple and accurate methodto fool deep neural networks,” in IEEE Conference on Computer Vision and Pattern Recog-nition, 2016, pp. 2574–2582.
9. N. Papernot, P. D. McDaniel, S. Jha, M. Fredrikson, Z. B. Celik, and A. Swami, “The limi-tations of deep learning in adversarial settings,” in Proceedings of the IEEE European Sym-posium on Security and Privacy (EuroS&P), 2016, pp. 372–387.
10. K. Grosse, N. Papernot, P. Manoharan, M. Backes, and P. D. McDaniel, “Adversarial exam-ples for malware detection,” in ESORICS, 2017, pp. 62–79.
11. A. Abusnaina, A. Khormali, H. Alasmary, J. Park, A. Anwar, and A. Mohaisen, “Adversariallearning attacks on graph-based iot malware detection systems,” in 39th IEEE InternationalConference on Distributed Computing Systems, ICDCS, 2019.
12. T. Wuchner, M. Ochoa, and A. Pretschner, “Robust and effective malware detection throughquantitative data flow graph metrics,” in Proceedings of the Detection of Intrusions and Mal-ware, and Vulnerability Assessment Conference, DIMVA, 2015, pp. 98–118.
13. D. Caselden, A. Bazhanyuk, M. Payer, S. McCamant, and D. Song, “HI-CFG: constructionby binary analysis and application to attack polymorphism,” in Proceedings of the 18th Eu-ropean Symposium on Research in Computer Security. Springer, 2013, pp. 164–181.
14. S. Alam, R. N. Horspool, I. Traore, and I. Sogukpinar, “A framework for metamorphic mal-ware analysis and real-time detection,” Computers & Security, vol. 48, pp. 212–233, 2015.
15. D. Bruschi, L. Martignoni, and M. Monga, “Detecting self-mutating malware using control-flow graph matching,” in Proceedings of the Detection of Intrusions and Malware, and Vul-nerability Assessment Conference, DIMVA, 2006, pp. 129–143.
16. J. Yan, D. Jin, and G. Yan, “Classifying malware represented as control flow graphs usingdeep graph convolutional neural networks,” in IEEE/IFIP DSN, 2019, pp. 1–12.
17. M. Antonakakis, R. Perdisci, Y. Nadji, N. Vasiloglou, S. Abu-Nimeh, W. Lee, and D. Dagon,“From throw-away traffic to bots: Detecting the rise of DGA-based malware,” in Proceedingsof the 21th USENIX Security Symposium, 2012, pp. 491–506.
18. N. Carlini and D. A. Wagner, “Towards evaluating the robustness of neural networks,” inProceedings of the IEEE Symposium on Security and Privacy, 2017, pp. 39–57.
19. A. Khormali, A. Abusnaina, D. Nyang, M. Yuksel, and A. Mohaisen, “Examining the ro-bustness of learning-based ddos detection in software defined networks,” in Proceedings ofthe IEEE conference on dependable and secure computing, IDSC, 2019.
20. Developers. (2019) Radare2. Available at [Online]: http://www.radare.org/r/.21. M. Thoma, H. Cheng, A. Gretton, J. Han, H. Kriegel, A. J. Smola, L. Song, P. S. Yu, X. Yan,
and K. M. Borgwardt, “Discriminative frequent subgraph mining with optimality guaran-tees,” Statistical Analysis and Data Mining, vol. 3, no. 5, pp. 302–318, 2010.
22. X. Yan and J. Han, “gspan: Graph-based substructure pattern mining,” in Proceedings of the2002 IEEE International Conference on Data Mining, 2002. Proceedings., 2002, pp. 721–724.
23. Developers. (2019) Cyberiocs. Available at [Online]: https://freeiocs.cyberiocs.pro/.24. ——. (2019) Github. Available at [Online]: https://github.com/.25. ——. (2019) VirusTotal. Available at [Online]: https://www.virustotal.com.26. M. Sebastian, R. Rivera, P. Kotzias, and J. Caballero, “AVclass: A tool for massive malware
labeling,” in Proceedings of the International Symposium on Research in Attacks, Intrusions,and Defenses, RAID, 2016, pp. 230–253.