subhranshu sekhar das frost sullivan asia pacific market overview
DESCRIPTION
frostTRANSCRIPT

Regional Aircraft MRO Dynamics
Airlines E&M, Asia pacific
Frost & Sullivan
Aerospace & Defense Practice
Asia Pacific
Agenda of Presentation
2
Asia Pacific Fleet Dynamics 3
MRO Dynamics 14
Frost & Sullivan Value Proposition 20

Global Aircraft Fleet Dynamics
Special focus on Asia Pacific and North Asia

Global Aircraft Fleet Dynamics
4
7,550
North America
2,950
Latin
America 1,070
Africa
7,450
Europe
1,330
CIS &
Russia
13,460
Asia Pacific 2,950
Middle
East
(a) Open Skies agreements; and (b) New airlines expected to be certified in China, including
LCCs in all North Asia markets (c) Primary and secondary airports being built and upgraded
36,770 New Aircraft deliveries expected globally between 2014-2034
Source : Frost & Sullivan

Global Market Share of Aircraft Deliveries by Region (2014-2034)
5
26%
32%
21%
6% 6% 6%
3%
Asia Pacific 36%
North America 22%
Europe 18%
Middle East 8%
Latin America 9% CIS
4% Africa
3%
Global Market Share of Aircraft Deliveries by Region (2014-2034)
Region with
largest fleet
Region with 2nd
largest fleet
2014
2033
Nearly half of the world's air traffic growth will be driven by travel to, from, or within the Asia-
Pacific region in the next 20 years
Source : Frost & Sullivan
APAC share of world
GDP will expand
from its current 28%
to 36% by 2032

Manufacturing Market Forecast
6
The narrow and wide body aircraft market is large but the supply chain is set and entry is
challenging owing to certifications
$ 100 Billion in next 20 years CAGR 5% UAV
$ 360 Billion in next 20 years CAGR 2% General Aviation
Aircraft
$ 74 Billion in next 20 years CAGR 4% Regional
Turboprops
$ 80 Billion in next 20 years CAGR (1)% Regional Jets
$ 2.3 Trillion in next 20 years CAGR 5% Narrow Body
$ 2.5 Trillion in next 20 years CAGR 4% Wide Body
Source : Frost & Sullivan
Asia Pacific in greater detail
7
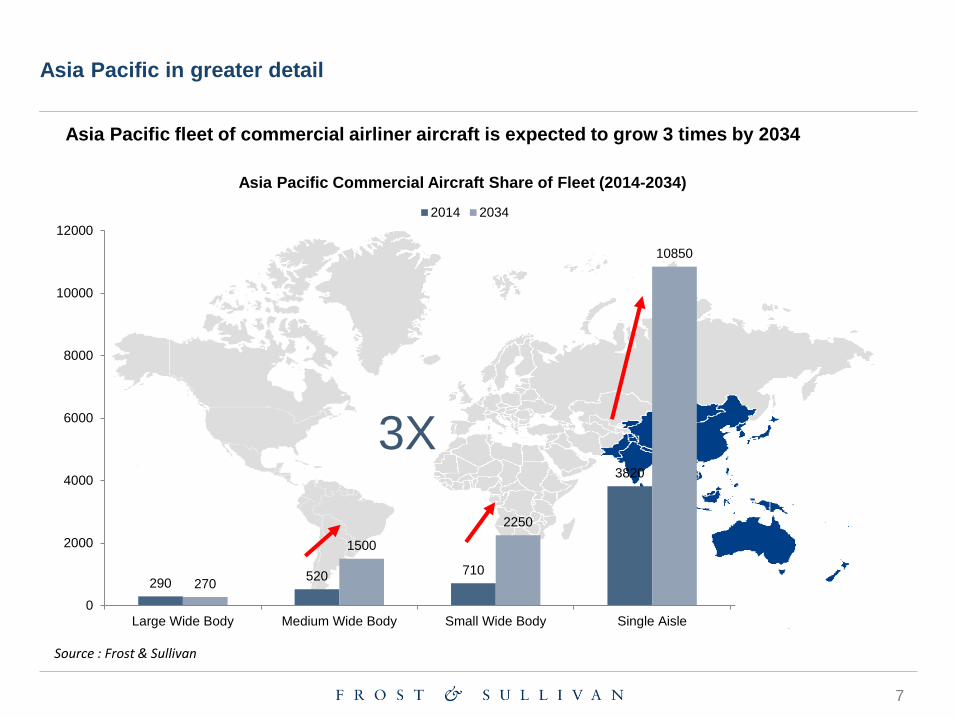
Asia Pacific fleet of commercial airliner aircraft is expected to grow 3 times by 2034
290 520 710
3820
270
1500
2250
10850
0
2000
4000
6000
8000
10000
12000
Large Wide Body Medium Wide Body Small Wide Body Single Aisle Regional Jets
3X
Asia Pacific Commercial Aircraft Share of Fleet (2014-2034)
2014 2034
Source : Frost & Sullivan

Global MRO Market
8
The total global MRO market is estimated to be close to $US 68.5 billion for 2015
The Asia Pacific region is ripe for investment into MRO business as it has the optimum market size with
strong growth rate as compared to Western Europe and North America
The Asia Pacific MRO market is forecasted to grow at 6.4% CAGR
The current MRO market size is forecasted at $US 12.3 billion
Middle East $77.97B
North America $209.92 B
Western Europe $191.63 B
Eastern Europe $41.6 B
Latin America $51.9 B
India $17.07 B
China $78.9 B
Asia Pacific $167.2 B
Africa $26.81 B
0
50
100
150
200
250
300
0.00% 2.00% 4.00% 6.00% 8.00% 10.00% 12.00% 14.00% 16.00% 18.00%
MR
O M
ark
et S
ize in $
US
mill
ion
Growth rate (CAGR) %
Global MRO Spending Forecast Comparison, By Region, 2015-2024

9
Asia Pacific region will receive a total of 2276 firm commercial aircraft orders from 2015-2024 which hold
potential for strong growth potential for MRO in the region
Majority of the orders are for single aisle aircraft, followed by twin-aisle long range
Regional Single AisleTwin Aisle -Long Range
Twin Aisle -MediumRange
Twin Aisle -Short Range
Twin Aisle -Ultra Large
2015-2024 148 1510 519 67 0 32
0
200
400
600
800
1000
1200
1400
1600
Air
cra
ft O
rde
rs
Aircraft Firm Orders, Asia Pacific (ex-China, India), 2015-2024
Asia Pacific Aircraft Orders
2,276 Aircraft deliveries

New Generation aircraft orders in Asia Pacific
10
The current generation fleet will be quickly replaced over next 10 years by new generation
aircraft ; MRO strategy needs to plan for future rather than present
Choice of MRO capacity to be developed should be A320neo & B737 MAX looking at large
orders and fleet commonality amongst operators
4341 Total Operating Fleet (2015)
7793 Total Operating Fleet (2024)
A320/321 neo (2) (1172)
B737MAX (0) (597)
ATR72-600 (88) (502)
A350-900/1000 (0) (383)
B777-8/9 (0) (96)
B787-8/9/10 (110) (493)
B777-300ER (179) (304)
6.03% CAGR Growth
Next Generation Most Promising Opportunities (Main Fleet Types Only)
Asia Pacific

Distribution between Airbus & Boeing in Asia Pacific
11
Single aisle aircraft are going to dominate the Asian skies with massive orders of close to
1510 aircraft to be delivered in next 10 years (approx ~ 150 aircraft a year) followed by 519
units of twin aisle long range aircraft (approx ~ 50 aircraft a year)
Airbus A320 and A320neo will together constitute
69.0% of the total orders.
Boeing 737 new generation aircraft such as B737-
8/9 and B737MAX are going to hold 30.0% of the
market share.
Others, 6, 1%
777-300ER, 56, 11%
787-8/9/10, 215, 41%
A350-900/1000, 242, 47%
Aircraft Firm Orders, Asia Pacific (ex-China, India), Twin Aisle Long Range, 2015-2024
737-6/7/8/900, 172, 11%
737-MAX, 284, 19%
A320/321, 250, 17%
A320/321NEO, 792, 52%
Others, 11, 1%
Aircraft Firm Orders, Asia Pacific (ex-China, India), Single Aisle 2015-2024
Airbus A350 will constitute 47.0% of the total wide
body long range aircraft orders.
Boeing 787 new generation aircraft such as B787-
8/9/10 and B777-30ER are going to hold 52.0% of
the market share.
Airbus Boeing Airbus
Boeing
Zooming into North East Asia (Fleet Growth)
12
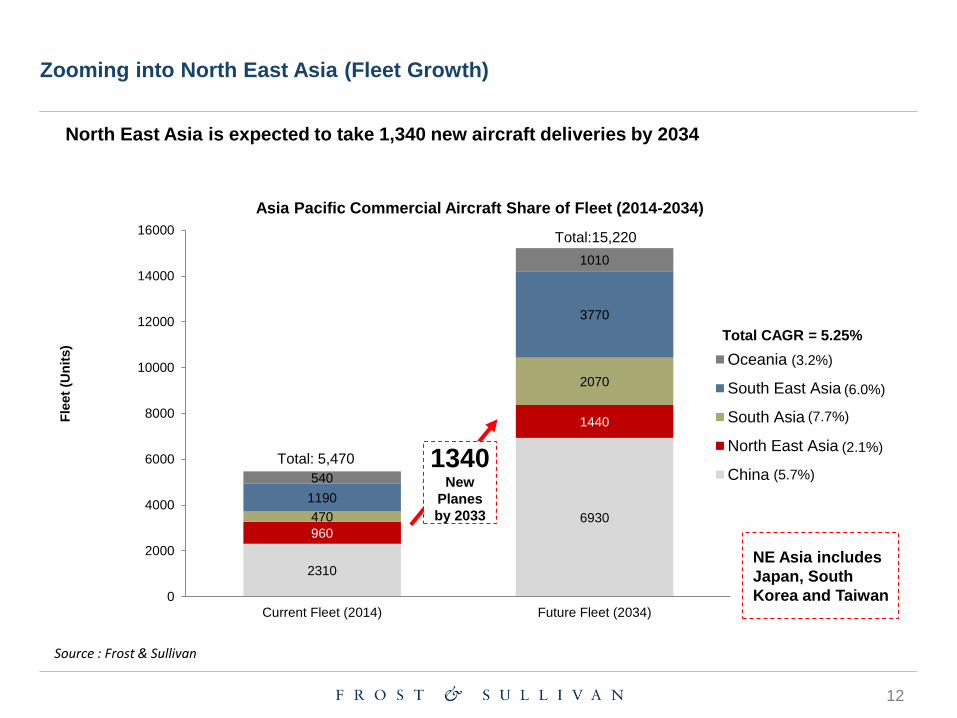
North East Asia is expected to take 1,340 new aircraft deliveries by 2034
2310
6930 960
1440
470
2070
1190
3770
540
1010
0
2000
4000
6000
8000
10000
12000
14000
16000
Current Fleet (2014) Future Fleet (2034)
Fle
et
(Un
its)
Asia Pacific Commercial Aircraft Share of Fleet (2014-2034)
Oceania
South East Asia
South Asia
North East Asia
China
NE Asia includes
Japan, South
Korea and Taiwan
1340 New
Planes
by 2033
Total:15,220
Total: 5,470
Total CAGR = 5.25%
(6.0%)
(7.7%)
(3.2%)
(2.1%)
(5.7%)
Source : Frost & Sullivan

Zooming into North East Asia (Type of Aircraft)
13
More concentration of wide body aircraft is expected as routes in North Asia will get thicker
Large Wide Body, 70
Medium Wide Body, 320
Small Wide Body, 340
Single Aisle, 560
Regional Jet, 50
0 100 200 300 400 500 600
New Aircraft Fleet (Units)
Asia Pacific Commercial Aircraft Share of Fleet (2014-2034)
Large
concentration
of Wide Body
Aircraft
1340 New
Planes
by 2033
Source : Frost & Sullivan

MRO Dynamics
How MRO is changing around the world

15
The Asia Pacific MRO suppliers have
historically concentrated more on Boeing
aircraft however Airbus capacity is increasing
rapidly.
In terms of engine or power plant MRO
capacity the focus has been on GE. Major
Rolls Royce facilities are SIA Engineering
Company, SAESL etc. HAESL though a major
Rolls Royce facility has not been considered
in APAC region and has been included in
China region. A small portion of Rolls Royce
engine MRO is done at Thai Airways as well.
Regional MRO Portfolio

16
Asia Pacific MRO suppliers provide airframe MRO services to other regions as well beyond Asia Pacific
mainly North America. However, apart from North America other operating regions such as India, China,
Latin America, Middle East do get their MRO services done in this part of the world.
Regional MRO Portfolio

17
Asia Pacific MRO suppliers provide a larger portion of engine repair and overhaul services beyond Asia
Pacific region. ERO services provided by Asia Pacific suppliers to APAC based airline carriers constitute
only 53.7% of the total capacity. They also serve China based airline operators constituting 11.9%, India
3.3%, Middle East based carriers 22.7% and Western Europe 4.8%. In conclusion, Asia Pacific based
ERO services have well established customers beyond the region.
Regional MRO Portfolio

MRO Dynamics - Standalone maintenance firms are under the greatest pressure because
they are increasingly squeezed between the OEMs and airline-affiliated MRO companies
18
OEM, 42% OEM, 50%
Independent, 33%
Independent, 40%
In-house, 20%
In-house, 10%
0%
10%
20%
30%
40%
50%
60%
70%
80%
90%
100%
2014 2020
OEM Presence in MRO Airlines
Lack of economies of scale
Need to squeeze out cost savings
Source : Frost & Sullivan
Independent MROs
Seeking partnerships with OEMs for new-
generation aircraft
Long history of cooperation but increasing
competition with OEMs now
OEMs
Aggressive vertical integration in to MRO
services – growing aftermarket influence
Relatively smaller presence in APAC but
growing rapidly

MRO Dynamics - APAC MRO market is projected to grow at 5.7% CAGR till 2023, driven by
an increasing share of the global airframe heavy maintenance market
19
2.12 2.32 3.14
4.01
14.04 13.91
18.85
3.61 2.97
5.51
10.26
25.86
16.20
20.67
0
5
10
15
20
25
30
Africa CIS & Russia Latin America Middle East APAC Europe North America
Global MRO Revenue by region ($ Billions) 2014 and 10 years CAGR
MRO Revenue, 2014
MRO Revenue, 2023
5.0%
2.3%
5.3%
8.9%
5.7%
1.4% 0.8%
Africa CIS & Russia Latin America Middle East APAC Europe North America
Source : Frost & Sullivan
MRO suppliers have been
signing JVs with APAC
airlines
Also setting up distribution
and repair centers in these
growth markets to be closer
to customers
E.g., Chinese airlines
prefer to have components
repaired in China

About Frost & Sullivan

Our Industry Coverage
21
Automotive &
Transportation
Aerospace & Defense Measurement &
Instrumentation
Information &
Communication Technologies
Healthcare Environment & Building
Technologies
Energy & Power
Systems
Chemicals, Materials
& Food
Electronics &
Security
Industrial Automation
& Process Control
Automotive
Transportation & Logistics
Consumer
Technologies
Minerals & Mining

Our Global Footprint: 40+ Offices
Scanning the Globe for Opportunities and Innovation
22

Our Coverage of the Aerospace, Defense and Security industries
23
Commercial Aviation Defense Civil Security

Frost & Sullivan, the Growth Partnership Company, works in collaboration with
clients to leverage visionary innovation that addresses the global challenges and
related growth opportunities that will make or break today’s market participants.
For more than 50 years, we have been developing growth strategies for the
Global 1000, emerging businesses, the public sector and the investment
community. Is your organization prepared for the next profound wave of industry
convergence, disruptive technologies, increasing competitive intensity, Mega
Trends, breakthrough best practices, changing customer dynamics and emerging
economies? Contact Us: Start the Discussion
www.frost.com