subject: action recommended: information
TRANSCRIPT

Agenda Item: III.B. DATE: January 24, 2008 SUBJECT: Challenge 2010: Master Plan Annual Progress Report ACTION RECOMMENDED: Information BACKGROUND INFORMATION: The Challenge 2010 report is the third in a series of five reports documenting progress toward meeting the 2010 goals of the 2005-2010 Master Plan for Tennessee Higher Education: Creating Partnerships for a Better Tennessee. Challenge 2010 replaces the Conditions Report and its predecessor, Challenge 2000, in responding to 1989 legislation calling for an annual accountability report on the status of higher education. The purpose for focusing Challenge 2010 on Master Plan aspirations is to underscore the centrality of the nineteen planning goals in guiding State efforts to improve access, student preparation, affordability, and ensure excellence in Tennessee post-secondary education. Challenge 2010 further integrates accountability reporting with existing accountability measures by embedding planning goal assessment into the THEC 2005-2010 Performance Funding Program. Staff will present the report as information.
T E N N E S S E E
H I G H E R
E D U C A T I O N
C O M M I S S I O N

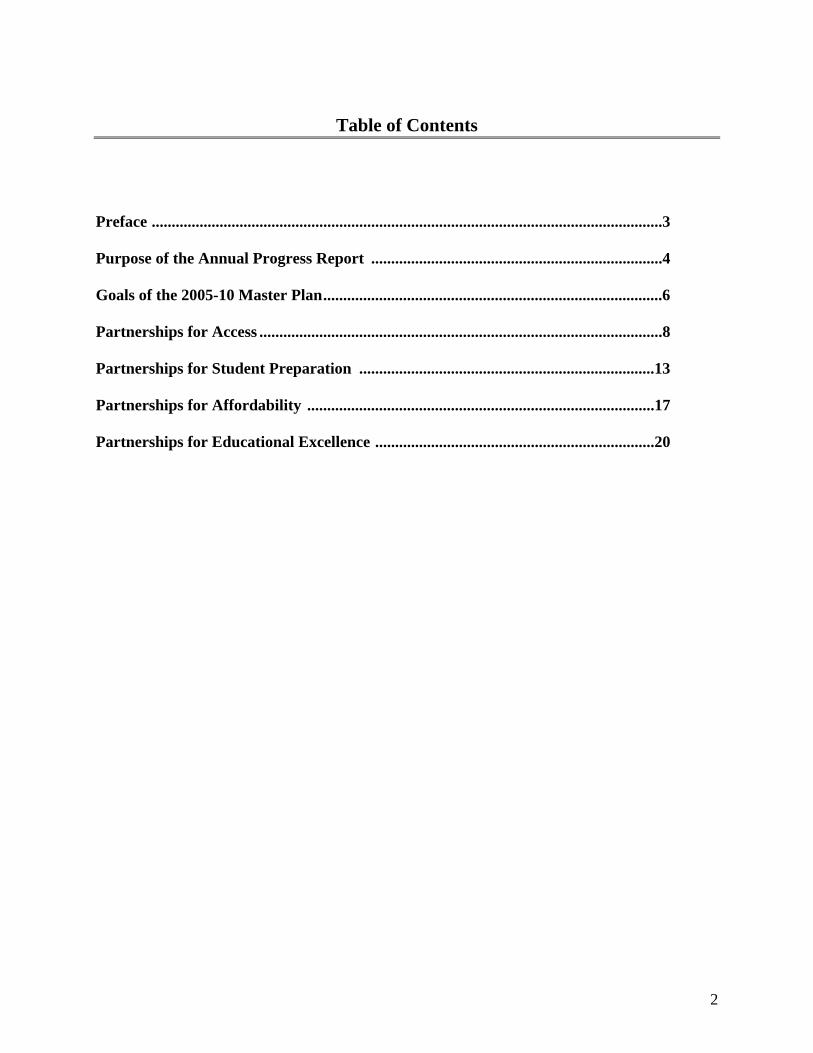
Table of Contents
Preface ................................................................................................................................3
Purpose of the Annual Progress Report .........................................................................4
Goals of the 2005-10 Master Plan.....................................................................................6
Partnerships for Access .....................................................................................................8
Partnerships for Student Preparation ..........................................................................13 Partnerships for Affordability .......................................................................................17 Partnerships for Educational Excellence ......................................................................20
2

Challenge 2010
Master Plan Progress 2008 Report
PREFACE
The coming years hold unprecedented opportunities for Tennessee higher education to forge new partnerships that will both broaden its scope and improve the fortunes of countless generations of Tennesseans. Through a focus on collaboration, the 2005-2010 Master Plan for Tennessee Higher Education introduces a broad-based public agenda that balances state and campus priorities and expands the role of higher education in improving the quality of life for all Tennesseans. The Plan challenges educational leaders to re-examine their traditional missions and create partnerships focusing on both statewide and institutional priorities. As Tennessee transitions into an economic era in which its fortunes will be determined more by the human capital potential of its citizens than by the state’s physical capital and natural resources, higher education must begin to play a larger role in critical policy areas such as public health, industrial training and recruitment, economic and community development, and adult literacy. Given the strong correlation between educational attainment and the accumulation of social and economic status, education is increasingly cited as a prime determinant of economic well-being. In order for all Tennesseans to realize the direct and indirect benefits of postsecondary opportunities, higher education must broaden its traditional institutional focus to include a focus on statewide needs and priorities. To assist Tennessee higher education in meeting the challenges of the coming decades, the Master Plan outlines a series of priorities that enhance the state’s human capital infrastructure. Correspondingly, it frames a public agenda for education that brings together diverse constituencies, promotes a broad vision for state efforts to nurture our human capital potential, and demonstrates the significant role that postsecondary education plays in providing the foundation for knowledge expansion and economic competitiveness.
3

Purpose of the Annual Progress Report 2008 Master Plan Annual Progress Report: The February 2008 Master Plan Annual Progress Report documents progress toward meeting the 2010 goals of The 2005-2010 Master Plan for Tennessee Higher Education: Creating Partnerships for a Better Tennessee. The Master Plan Annual Progress Report underscores the centrality of the nineteen Master Plan goals in guiding State efforts to improve access, student preparation, and affordability and to ensure excellence in Tennessee postsecondary education. The genesis of the current report and its precursors was legislation calling for accountability in public higher education. To respond to this call for accountability, the Master Plan Annual Progress Report communicates accomplishments of public higher education toward meeting the nineteen goals of the Plan. The success of the Master Plan will be measured by evidence in 2010 that these goals have been reached and the following core policy questions have been answered in the affirmative:
CORE POLICY QUESTIONS – THE PUBLIC AGENDA 1. Are more Tennesseans prepared for postsecondary education?
2. Are more students enrolling in postsecondary education?
3. Are more students progressing through the educational pipeline?
4. Does college remain affordable for the average Tennessean?
5. Are Tennessee’s local communities and economies benefiting from the policies articulated in the public agenda?
Integrated Accountability Reporting For the 2005-10 Master Plan, the Commission worked diligently to unify all aspects of its accountability framework for public higher education in Tennessee. The five areas of emphasis articulated in the public agenda are directly linked to the assessments and performance benchmarks articulated in this report. Additionally, for the first time in the state’s long and storied history of performance funding, the State Master Plan goals and associated assessment measures are directly tied to institutional performance measures. Institutional funding is implicitly linked to performance along a series of areas critical to the public agenda such as student retention and persistence, the expansion of college access opportunities to traditionally under-served groups, and the protection and promotion of financial aid opportunities for low-income Tennesseans. Additionally, a host of other existing quality evaluations central to the mission of higher education and of critical importance to the general public have been integrated into the Master Plan Annual Progress Report. Among these quality measures are research productivity by public universities; contributions of higher education to workforce development in preparing graduates for targeted employment fields; an array of Tennessee P-16 issues, such as increasing student readiness for college and improving the strength of teacher preparation; and institutional mission-related contributions by Centers and Chairs of Excellence. In short, Challenge 2010: the Master Plan Annual Progress Report proposes to keep key access, preparation, affordability, and excellence goals of the five-year plan continuously in the forefront
4

of State and institutional decision-making. By bringing continuity to reporting on Master Plan goals, the annual report will serve as a primary accountability document addressed to the General Assembly and to the public. Data Sources: Data for public institutions referred to in these reports are drawn from the state’s higher education data system and are carefully edited and audited. Financial data are drawn from records of the Commission and the Department of Finance and Administration. Information for independent colleges comes from several sources including the Southern Regional Education Board Fact Book and Data Exchange and the IPEDS (Integrated Postsecondary Education Data System collected by the U.S. Department of Education). A complete listing of data sources and the applicable goals can be found at the end of this report. History of Accountability Reports Responding to an Act of the General Assembly in 1989, the Tennessee Higher Education Commission developed goals for public higher education for the final decade of the 20th century. The Commission determined that an annual report, titled Tennessee Challenge 2000, would be made to the Legislature. In the Second Session of the 97th General Assembly, an act was passed (Public Chapter 739) which expanded the Challenge 2000 Report. The Condition of Higher Education in Tennessee (issued from 2002-2005) subsequently reported on progress toward accountability measures developed in concert with the University of Tennessee system, the Tennessee Board of Regents, and Tennessee independent colleges and universities. Effective with the implementation of the 2005–2010 Master Plan, the Challenge 2010 report is issued as its assessment component for the life of the planning cycle and has replaced the Conditions document as the annual accountability report.
5
Goals of the 2005-10 Master Plan The 2005-2010 Master Plan is built upon a rich tradition of educational excellence in Tennessee. Through the tireless efforts of faculty and staff in the state’s public and private institutions, the state was able to weather the difficult financial period of the late 1990s and maintains a complement of academic programs that are nationally recognized for excellence. However, while our state is recognized for institutional and programmatic excellence, a host of policy reports indicate that much work remains to create a statewide system of excellence that fosters the broad goals of a public agenda for higher education. It is from this framework that the Plan seeks to develop a new paradigm for Tennessee higher education that supports the vision articulated below.
Through the establishment of a public agenda built upon civic, corporate, and community partnerships, Tennessee higher education will be able to better serve the broad needs of the state and create a workforce that is able to compete in the Knowledge Economy. Such partnerships will ensure that all students are prepared for postsecondary education and have access to high quality educational programs that expand knowledge creation and civic responsibility.
To reach the goals of this vision, Tennessee must develop:
Partnerships for access that focus on the human capital aspects of increasing educational attainment levels. If the state is to move forward in the Knowledge Economy, it must make greater strides to ensure that more Tennesseans participate successfully in higher education.
Partnerships for student preparation that create an invigorated P-16 system which works to ensure that all students are prepared for postsecondary education and eventual entry into the workforce.
Partnerships for affordability through the construction of funding and finance policy which ensures that all students are able to participate in higher education. Given the funding shift from state support to student fees, greater attention and effort must be placed on the promotion and expansion of need-based aid programs. Furthermore, the state should establish system-level affordability through the broad utilization of community colleges and technology centers as enhanced access options for Tennesseans, especially non-traditional students, while concurrently working to strengthen and promote student transfer and articulation.
Partnerships for educational excellence that enable the state to become more competitive in the national market for sponsored research dollars. Tennessee has developed outstanding academic and research facilities and investing in and utilizing these facilities is crucial to excellence in research. Through the creation of targeted funding to enhance mission specific research initiatives, institutions will be able to attract world-renowned faculty, encourage economic and community development, and enhance teaching and research activities.
The broad areas of focus articulated in this Plan provide a vision for Tennessee higher education that enhances and expands the role of our colleges and universities in economic and community development, knowledge creation, job growth, and public health. The Plan serves as a blueprint for postsecondary education in Tennessee for 2005-2010.
6
The Challenge 2010: Master Plan Annual Progress Report is organized around the four partnership areas, each with specific goals. The 2006 Master Plan Progress Report established the reporting Baseline, which was current year data or most recent year available, and it identified the Assessment, the measure by which progress will be evaluated. The 2008 report marks the progress made on each goal and serves as an indication of the improvement necessary to reach the target in 2010. Notations after specific goals show where Performance Funding Program assessments serve as the accountability mechanism for Challenge 2010 (the asterisk by the goal indicates that goal attainment is measured through the 2005-2010 Performance Funding standards). The 2005-2010 Master Plan marked the first time priority was placed on integrating performance evaluation with State planning goal assessment toward creating an accountability document for the legislature and the general public.
7

PARTNERSHIPS FOR ACCESS More Tennesseans must reap the benefits of higher education if the state is to enhance its economic viability through an improved workforce and healthier citizenry. As Tennessee transitions into the Knowledge Economy, one important phenomenon should not be overlooked in the planning process: the need to expand significantly and enhance educational access opportunities for all Tennesseans. In addition to a burgeoning traditional college-aged population, the number of non-traditional students will need to increase in higher education. This new reality poses both challenges and opportunities for Tennessee. As a result, state policies and individual institutions must recognize this changing dynamic. Both the state and individual citizens stand to benefit from increased access to higher education. At the state level, a better educated citizenry yields: increases in personal income and thus state tax revenues; decreases in unemployment rates; improved workforce flexibility and better economic activity across the state; fewer demands on expensive social services and governmental financial support; and enhanced participation in civic and community life. Likewise, individuals will benefit as increases in educational attainment yield increased salaries and benefits, better employment opportunities, and, consequently, enhanced health and life expectancy. With greater attention placed on these mutual benefits, Tennessee must recognize higher education as a sound investment and promote access to life-long learning for all Tennesseans. Tennessee’s present performance and readiness to address this reality is limited. According to the most recently available Census data, only 47 percent of adults in the state have some college experience, which is seven percent below the national average. Tennessee also trails national averages with respect to educational attainment levels for adults aged 25 and older, as the state average of 21.7 percent is a full five percent below the national average. These data serve to illustrate the importance of the need to improve access opportunities for all Tennesseans, thereby providing a foundation for reaching the vision for higher education articulated in the public agenda. Unless greater attention and resources are brought to bear to provide a foundation for expanding access to postsecondary education, the economic future of Tennessee is at risk. Both the number of students aged 25 and older enrolled in the public sector and their share of enrollment of the overall undergraduate student population has declined. This decrease has not effected overall enrollment in Tennessee public institutions. Traditional aged students continue to see increased enrollment with 71 percent of the undergraduate population aged 24 and under, up from 63 percent ten years ago. Overall, access to higher education is improving but more work needs to be done to achieve a diverse population of students. In order to achieve this end, the following goals aim to promote and expand educational access.
8

1.1 Ensure that access to postsecondary education is available across the diverse regions of
Tennessee.
Assessment: Number of Tennessee students aged 25 and older enrolled in public institutions (delineated by Workforce Investment Area)
Target: By 2010, the number of Tennessee students aged 25 and older will increase by
five percent across all workforce investment areas. Baseline: In Fall 2005, the number of students aged 25 and older in postsecondary public
institutions was 65,097.
Enrollment of Students Age 25 or Older
Fall 2005
Investment Area Enrollment Investment
Area Enrollment
1 5,067 8 6,510 2 3,403 9 10,210 3 5,310 10 1,929 4 3,913 11 2,828 5 7,144 12 2,089 6 1,888 13 12,509 7 2,297 Total 65,097
9

Progress: In fall 2007, the number of students aged 25 and older in postsecondary public institutions was 63,996, a decrease of 1.7 percent since the baseline of fall 2005.
Enrollment of Students Age 25 or Older Fall 2006
Investment Area Enrollment
One Year Percent Change
Investment Area Enrollment
One Year Percent Change
1 5,001 -1.3% 8 6,700 2.9% 2 3,344 -1.7% 9 10,154 -0.5% 3 5,184 -2.4% 10 1,849 -4.1% 4 4,011 2.5% 11 2,948 4.2% 5 6,974 -2.4% 12 2,189 4.8% 6 1,968 4.2% 13 12,649 1.1% 7 2,343 2.0% Total 65,314 0.3%
Enrollment of Students Age 25 or Older Fall 2007
Investment Area Enrollment
Two Year Percent Change
Investment Area Enrollment
Two Year Percent Change
1 5,144 1.5% 8 6,408 -1.6% 2 3,442 1.1% 9 9,738 -4.6% 3 5,110 -3.8% 10 1,878 -2.6% 4 4,028 2.9% 11 2,955 4.5% 5 6,907 -3.3% 12 2,188 4.7% 6 1,962 3.9% 13 11,892 -4.9% 7 2,344 2.0% Total 63,996 -1.7%
*1.2 Increase the percentage of African American and Hispanic students enrolled in higher education. (* Indicates Performance Funding Measure)
Assessment 1: College enrollment and demographic proportions of African Americans (18-24 year old cohort)
Target: By 2010, the proportion of African American students enrolled in Tennessee
higher education will equal that of the overall state population. According to the 2000 Census, the proportion of African Americans comprised 20.13 percent of the overall state population aged 18-24.
10
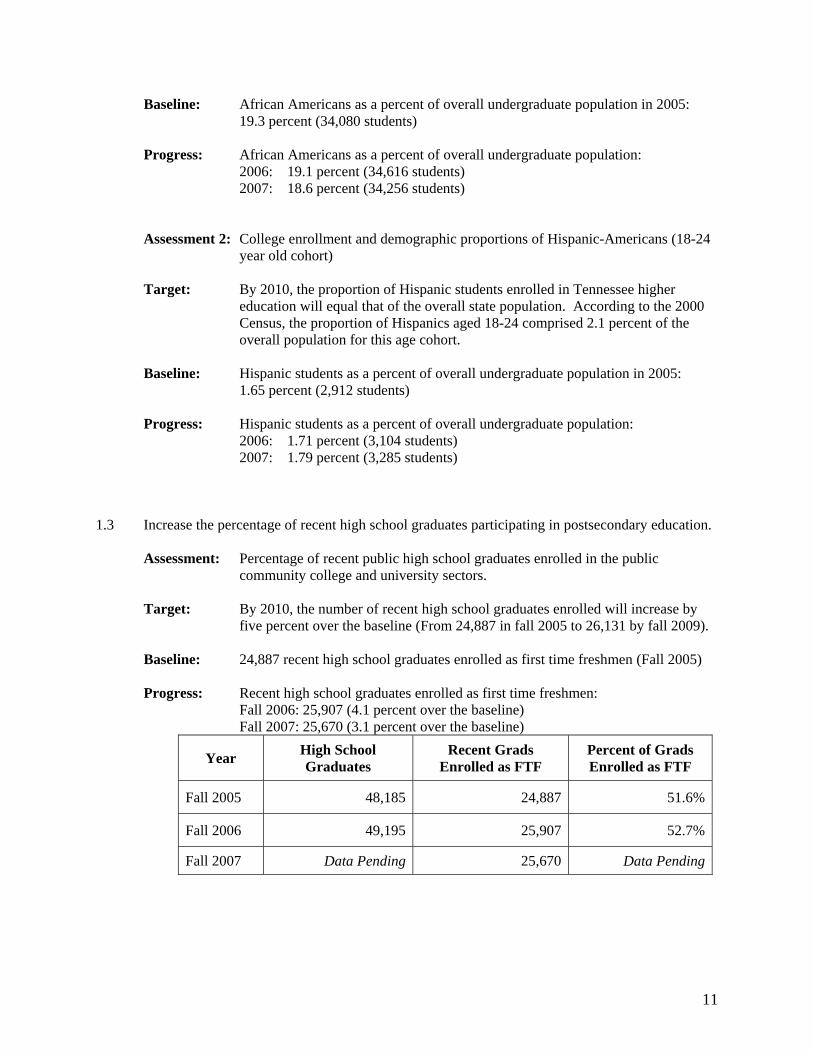
Baseline: African Americans as a percent of overall undergraduate population in 2005: 19.3 percent (34,080 students)
Progress: African Americans as a percent of overall undergraduate population: 2006: 19.1 percent (34,616 students)
2007: 18.6 percent (34,256 students) Assessment 2: College enrollment and demographic proportions of Hispanic-Americans (18-24 year old cohort)
Target: By 2010, the proportion of Hispanic students enrolled in Tennessee higher
education will equal that of the overall state population. According to the 2000 Census, the proportion of Hispanics aged 18-24 comprised 2.1 percent of the overall population for this age cohort.
Baseline: Hispanic students as a percent of overall undergraduate population in 2005:
1.65 percent (2,912 students) Progress: Hispanic students as a percent of overall undergraduate population: 2006: 1.71 percent (3,104 students)
2007: 1.79 percent (3,285 students)
1.3 Increase the percentage of recent high school graduates participating in postsecondary education. Assessment: Percentage of recent public high school graduates enrolled in the public
community college and university sectors. Target: By 2010, the number of recent high school graduates enrolled will increase by
five percent over the baseline (From 24,887 in fall 2005 to 26,131 by fall 2009). Baseline: 24,887 recent high school graduates enrolled as first time freshmen (Fall 2005) Progress: Recent high school graduates enrolled as first time freshmen: Fall 2006: 25,907 (4.1 percent over the baseline)
Fall 2007: 25,670 (3.1 percent over the baseline)
Year High School Graduates
Recent Grads Enrolled as FTF
Percent of Grads Enrolled as FTF
Fall 2005 48,185 24,887 51.6%
Fall 2006 49,195 25,907 52.7%
Fall 2007 Data Pending 25,670 Data Pending
11
1.4 Increase the number of non-traditional students participating in postsecondary education, especially in the community college sector.
Assessment: Adult student enrollment aged 25 and older as a percentage of total
undergraduate headcount. Target: Meet or exceed the participation rate of adult students as indexed against the top
quartile of the SREB states: Fall 2003: 38.5 percent Fall 2005: 37.9 percent
Baseline: Adults were 36.1 percent of total undergraduate enrollment for fall 2003. Progress: Adults were 36.2 percent of total enrollment for fall 2005.
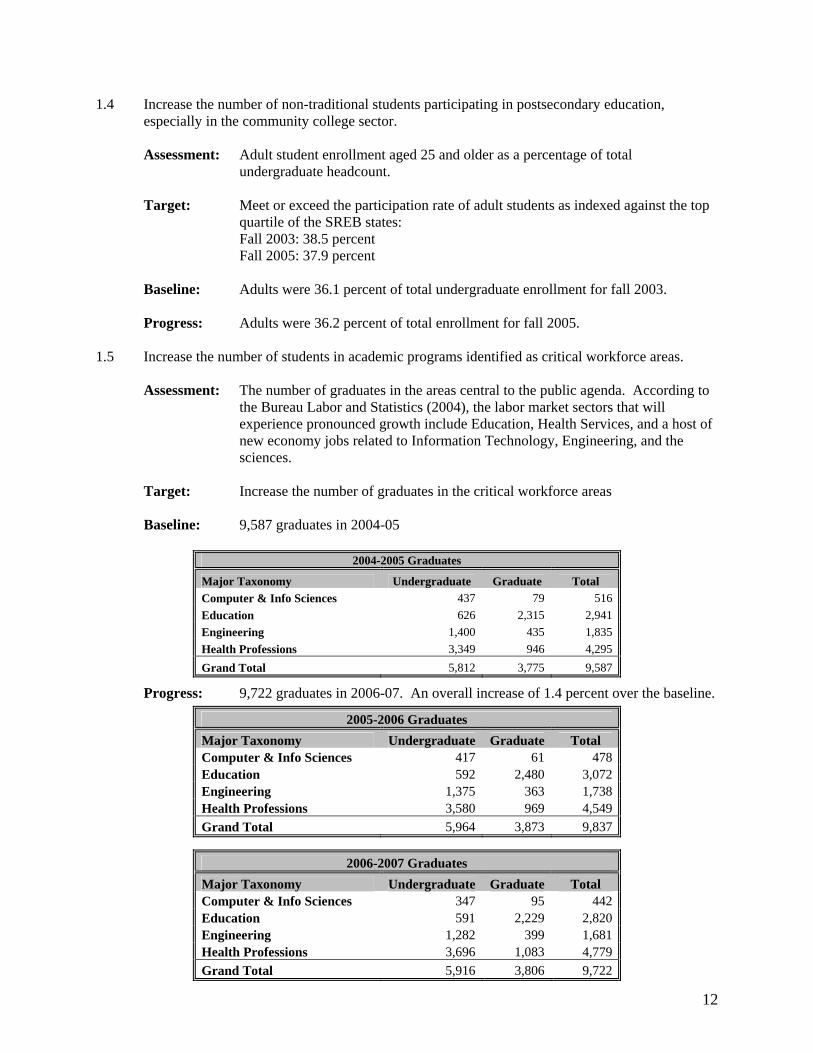
1.5 Increase the number of students in academic programs identified as critical workforce areas.
Assessment: The number of graduates in the areas central to the public agenda. According to
the Bureau Labor and Statistics (2004), the labor market sectors that will experience pronounced growth include Education, Health Services, and a host of new economy jobs related to Information Technology, Engineering, and the sciences.
Target: Increase the number of graduates in the critical workforce areas Baseline: 9,587 graduates in 2004-05 2004-2005 Graduates
Major Taxonomy Undergraduate Graduate Total Computer & Info Sciences 437 79 516 Education 626 2,315 2,941 Engineering 1,400 435 1,835 Health Professions 3,349 946 4,295 Grand Total 5,812 3,775 9,587
Progress: 9,722 graduates in 2006-07. An overall increase of 1.4 percent over the baseline.
2005-2006 Graduates Major Taxonomy Undergraduate Graduate Total Computer & Info Sciences 417 61 478 Education 592 2,480 3,072 Engineering 1,375 363 1,738 Health Professions 3,580 969 4,549 Grand Total 5,964 3,873 9,837
2006-2007 Graduates Major Taxonomy Undergraduate Graduate Total Computer & Info Sciences 347 95 442 Education 591 2,229 2,820 Engineering 1,282 399 1,681 Health Professions 3,696 1,083 4,779 Grand Total 5,916 3,806 9,722
12

PARTNERSHIPS FOR STUDENT PREPARATION If the state is to realize its human capital potential, significant investments must be made to create and nurture an integrated system of education stretching from early childhood through postsecondary education. This P-16 framework challenges policymakers to consider the implications of public policy for the entire education pipeline. Furthermore, it clarifies issues and offers a setting for consensus on contentious initiatives such as standardized testing, remedial and developmental instruction, improved teacher training and quality, and the sharing of student information across educational sectors. The P-16 framework provides an opportunity for Tennessee to acquire both a common voice and consistent plan to reach the broad vision for education outlined in the Master Plan. When one examines the P-16 educational pipeline from a holistic perspective, gaps are evident across all educational sectors, however Tennessee is making progress. The following findings indicate that there have been tremendous strides within student preparation – particularly in regards to the number of ninth graders who finish college within six years of entry. Currently, 17 of 100 ninth graders complete college within 150 percent of normal time compared to 14 of 100 in 2000. This increase has moved Tennessee from 38th to 32nd in national rankings. There are several important indicators within this statistic that are noteworthy: 1) high school graduation rates have increased from 55 to 63 percent; 2) the percentage of the ninth grade cohort entering college has increased from 34 to 39 percent; and 3) the number still enrolled their sophomore year has increased from 23 to 27 percent. While progress has been incremental, much work is being done to better align the curriculum for success in postsecondary education and improve retention and graduation rates in higher education. The following indicators reflect the progress on these initiatives. 2.1 Establish an integrated and seamless system of education from ninth grade through fourth year of
college that emphasizes the continuity of student learning and focuses on alignment across educational sectors. Assessment: Educational pipeline data from the National Center for Higher Education
Management Systems Target: The educational pipeline data for Tennessee will meet or exceed the national
average. Baseline: For every 100 ninth graders, 14 graduate from college within six* years.
StateFor every 100 Ninth Graders
Graduate from High School
Enter College
Still Enrolled Sophomore Year
Graduate within 6 years
Virginia 100 74 39 30 20Delaware 100 61 36 28 19Maryland 100 74 40 30 18North Carolina 100 59 38 28 18Nation 100 67 38 26 18West Virginia 100 75 39 27 15Tennessee (38th) 100 55 34 23 14Florida 100 55 32 23 14South Carolina 100 51 34 23 14Kentucky 100 66 39 25 13Mississippi 100 56 36 23 13Alabama 100 59 34 23 13
2000
13
Arkansas 100 74 39 26 12Georgia 100 52 32 21 12Louisiana 100 56 33 22 12Oklahoma 100 73 36 23 12Texas 100 62 32 19 11

Progress: For every 100 ninth graders, 17 graduate from college within six* years.
StateFor every 100 Ninth Graders
Graduate from High School
Enter College
Still Enrolled Sophomore Year
Graduate within 6 years
Virginia 100 73 42 31 22Delaware 100 65 36 26 20Maryland 100 74 43 30 19North Carolina 100 64 41 28 19Nation 100 70 39 27 18Tennessee (32nd) 100 63 39 27 17West Virginia 100 73 39 26 16Arkansas 100 75 42 27 15Florida 100 55 30 21 15Oklahoma 100 74 39 23 15South Carolina 100 52 35 23 15Georgia 100 54 35 23 14Louisiana 100 67 37 26 14Alabama 100 60 37 23 14Texas 100 68 35 22 13Kentucky 100 65 37 24 12Mississippi 100 60 36 23 11
2004 * Three years for community college graduates. 2.2 Link K-12 curricula with postsecondary offerings to ensure that all students are prepared for
postsecondary education.
Assessment: Status of curricula alignment process and university admission policy
Target: By 2009-10, four units of mathematics will be required for high school graduation and for university admission.
Baseline: In 2005-06, three units of mathematics are required for high school graduation
and university admission. Progress: Governor Bredesen has entered Tennessee into the American Diploma Project
network of 30 states. In the last year the Tennessee Diploma Project (an alliance of K-12 and higher education) has rewritten K-12 math and language curricula according to ADP standards. The State Board of Education is expected to approve the new standards and the requirement of math every year in high school at its January 2008 meeting. The University of Tennessee and the Tennessee Board of Regents are formulating more rigorous university admission requirements to answer the new math, science, and language arts requirements of the Tennessee high school diploma.
*2.3 Reduce the number of recent high school graduates who need remedial or developmental
education. (* Indicates Performance Funding measure.)
Assessment: Percentage of first-time freshmen 18 years of age or younger (recent high school
graduates) taking remedial and/or developmental studies courses at the university level.
14

Target: By 2009-10, the percentage of recent high school graduates in university remedial and/or developmental studies courses will be reduced by 20 percent (from 2,681 students in fall 2005 to 2,145 students by fall 2009).
Baseline: For the fall 2005 term, 2,681 recent high school graduates were enrolled in
remedial and/or developmental studies courses at the university level. Progress: The number of recent high school graduates enrolled in remedial and/or
developmental studies courses at the university level: Fall 2006: 2,290 Fall 2007: 2,147
*2.4 Increase retention and graduation rates for all students across public postsecondary education to equal or exceed the regional top quartile. (* Indicates Performance Funding measure.) Assessment 1: Retention rates (first to second year) – public universities Target: By 2009-10, Tennessee will be in the top quartile of SREB states in retention
rates: 2001 Cohort: 88 percent
2004 Cohort: 87 percent Baseline: Fall to fall retention rate for Tennessee public universities for the 2001 cohort: 80 percent. Progress: Fall to fall retention rate for Tennessee public universities: 2003 Cohort: 82 percent 2004 Cohort: 82 percent Assessment 2: Graduation rates - public universities Target: By 2009-10, Tennessee will equal or exceed the graduation rate for the best top
quartile of SREB states. 1997 Cohort: 58 percent 1999 Cohort: 59 percent
Baseline: Six year graduation rate for Tennessee public universities for the 1997 cohort: 43 percent. Progress: Six year graduation rate for Tennessee public universities:
1998 Cohort: 46 percent 1999 Cohort: 46 percent
Assessment 3: Retention rates (first to second year) – public community colleges Target: By 2009-10, Tennessee will reach the SREB top quartile rate.
2001 Cohort: 68 percent 2004 Cohort: 68 percent
15

Baseline: Fall to fall retention rate for Tennessee public community colleges for the 2001
cohort: 60 percent. Progress: Fall to fall retention rate for Tennessee public community colleges:
2003 Cohort: 62 percent 2004 Cohort: 58 percent
Assessment 4: Progression* rates – public community colleges Target: By 2009-10, Tennessee will reach the SREB top quartile progression rate.
2000 Cohort: 54 percent 2002 Cohort: 54 percent
Baseline: The progression rate for Tennessee public community colleges for the 2000
cohort: 43 percent. Progress: The progression rate for Tennessee public community colleges:
2001 Cohort: 41 percent 2002 Cohort: 44 percent
* The SREB progression rate for two-year colleges and technical institutes or colleges is the percentage of
the entering class who, within 150 percent of normal time (three years for most programs), either completed degrees or certificates at or remained enrolled at their original institutions or transferred to other postsecondary institutions.
16
PARTNERSHIPS FOR AFFORDABILITY
The composition of higher education funding has changed markedly over the last decade. State appropriations for higher education have declined as a percentage of public college operating revenue, while tuition and fee revenue has nearly doubled after adjusting for inflation. In 2003-2004, for the first time in the history of higher education in Tennessee, public universities collected more revenue from students than from the state. Traditionally, higher education finance policy in Tennessee has ensured the equitable distribution of state appropriations among institutions, often with an associated across-the-board fee increase for all institutional sectors. While this methodology appears equitable, it ignores institutional mission differentiation and falsely assumes that state appropriations have an equal impact wherever they are appropriated. The funding paradigm required to support the goals of the public agenda must not only create incentives that protect the academic core, but must also ensure that policy mechanisms are enacted that protect affordability. Such mechanisms could eventually lead to a shift in state support so that affordability is protected at those institutions that offer access opportunities for students at the lowest cost, the community college and technology centers, while allowing the universities to expand student generated revenues and other funding sources as their primary funding mechanisms. This new funding paradigm challenges all institutions to maximize efficiencies in order to minimize costs and protect affordability. Early assessment indicates that Tennessee has not improved in regards to most of its affordability measures. While financial aid award per FTE has increased almost 400 percent, the majority of this increase is associated with the merit-based portion of the Tennessee Education Lottery Scholarship. Legislative attention to student financial aid has increased funding for the Tennessee Student Assistance Award (TSAA). However, even with the funding increases to the TSAA and the need-based aid component of the Tennessee Education Lottery Scholarship program, Tennessee continues to trail the national average for need-based grant funding per FTE. Even with the creation of the lottery scholarship program, the coupling of limited increases in operating appropriations and increasing tuition has had an adverse effect on college affordability as many families are in effect being "priced out" of public higher education. The proportion of the median household income required to pay for community college tuition has also increased from 6.3 to 11.2 percent over the past ten years - ranking Tennessee the fourth highest in income to tuition ratio of the 16 SREB states. Tennessee has also incurred a lower proportion of the higher education formula being funded through revenue sources. The portion funded decreased from 98.9 to 96.2 percent between 2004-05 and 2007-08. 3.1 Promote affordability via an increased focus on need-based financial aid, both at the state and
institutional levels. Assessment 1: Financial aid award per FTE (undergraduate) Target: By 2009-10, the average award per FTE will equal or exceed the NASSGAP
national average. 2004-05: $562 per FTE 2005-06: $575 per FTE
17
Baseline: Average financial aid award per FTE in 2003-04: $211 Progress: Average financial aid award per FTE:
2004-05: $620 2005-06: $815
Assessment 2: Need-based financial aid award per FTE (undergraduate) Target: By 2009-10, the average need-based award per FTE will equal or exceed the
NASSGAP national average. 2005-06: $415 per FTE
Baseline: Average need-based financial aid award per FTE in 2003-04: $208 Progress: Average need-based financial aid award per FTE in 2005-06: $240
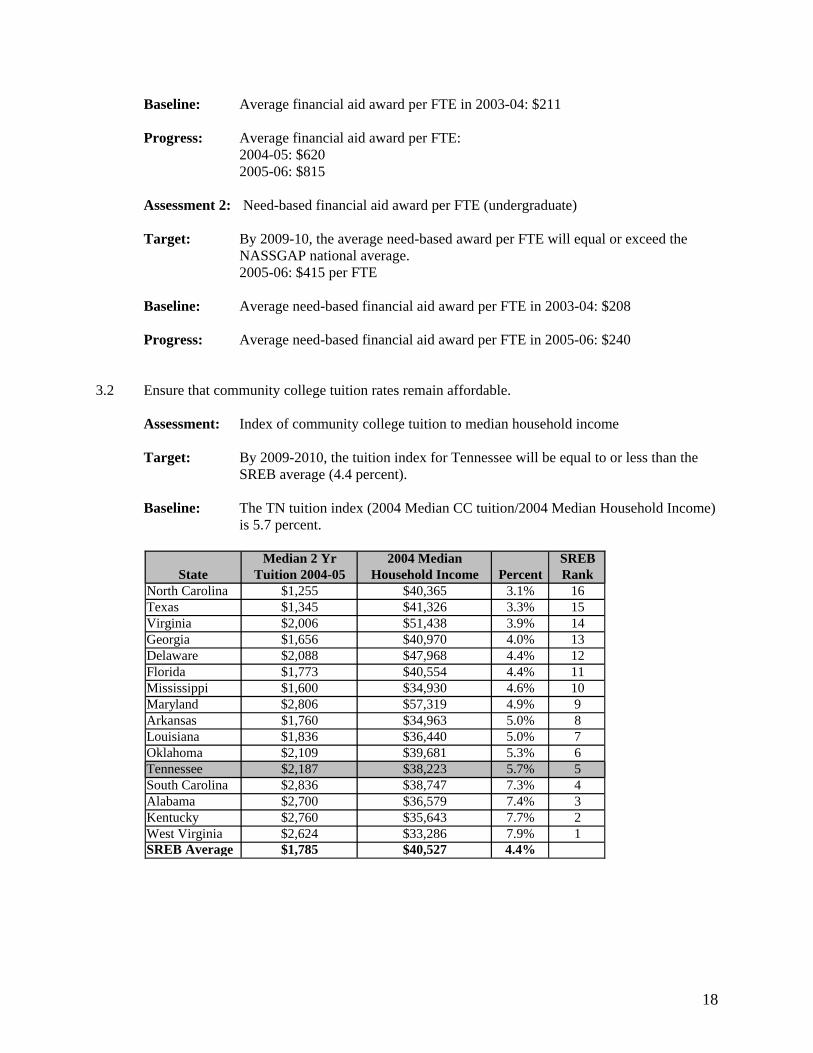
3.2 Ensure that community college tuition rates remain affordable.
Assessment: Index of community college tuition to median household income Target: By 2009-2010, the tuition index for Tennessee will be equal to or less than the
SREB average (4.4 percent). Baseline: The TN tuition index (2004 Median CC tuition/2004 Median Household Income)
is 5.7 percent.
Median 2 Yr 2004 Median SREBState Tuition 2004-05 Household Income Percent Rank
North Carolina $1,255 $40,365 3.1% 16Texas $1,345 $41,326 3.3% 15Virginia $2,006 $51,438 3.9% 14Georgia $1,656 $40,970 4.0% 13Delaware $2,088 $47,968 4.4% 12Florida $1,773 $40,554 4.4% 11Mississippi $1,600 $34,930 4.6% 10Maryland $2,806 $57,319 4.9% 9Arkansas $1,760 $34,963 5.0% 8Louisiana $1,836 $36,440 5.0% 7Oklahoma $2,109 $39,681 5.3% 6Tennessee $2,187 $38,223 5.7% 5South Carolina $2,836 $38,747 7.3% 4Alabama $2,700 $36,579 7.4% 3Kentucky $2,760 $35,643 7.7% 2West Virginia $2,624 $33,286 7.9% 1SREB Average $1,785 $40,527 4.4%
18
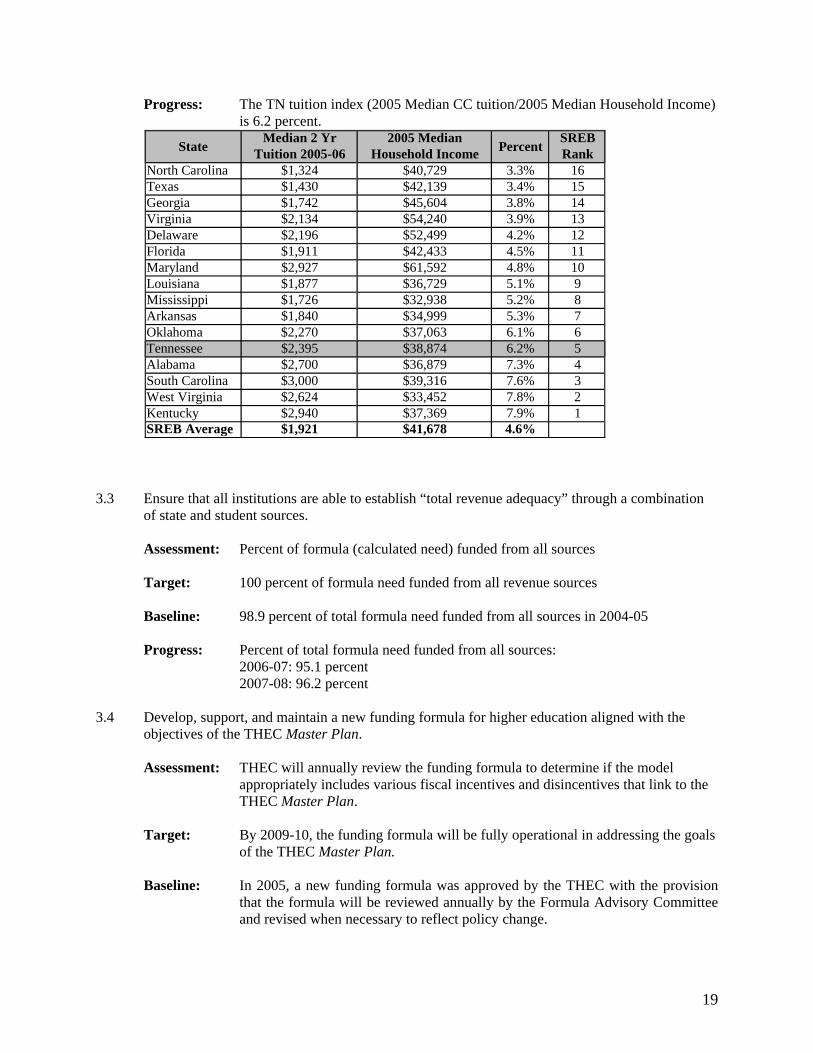
Progress: The TN tuition index (2005 Median CC tuition/2005 Median Household Income) is 6.2 percent.
Median 2 Yr 2005 Median SREBTuition 2005-06 Household Income Rank
North Carolina $1,324 $40,729 3.3% 16Texas $1,430 $42,139 3.4% 15Georgia $1,742 $45,604 3.8% 14Virginia $2,134 $54,240 3.9% 13Delaware $2,196 $52,499 4.2% 12Florida $1,911 $42,433 4.5% 11Maryland $2,927 $61,592 4.8% 10Louisiana $1,877 $36,729 5.1% 9Mississippi $1,726 $32,938 5.2% 8Arkansas $1,840 $34,999 5.3% 7Oklahoma $2,270 $37,063 6.1% 6Tennessee $2,395 $38,874 6.2% 5Alabama $2,700 $36,879 7.3% 4South Carolina $3,000 $39,316 7.6% 3West Virginia $2,624 $33,452 7.8% 2Kentucky $2,940 $37,369 7.9% 1SREB Average $1,921 $41,678 4.6%
PercentState
3.3 Ensure that all institutions are able to establish “total revenue adequacy” through a combination of state and student sources.
Assessment: Percent of formula (calculated need) funded from all sources Target: 100 percent of formula need funded from all revenue sources Baseline: 98.9 percent of total formula need funded from all sources in 2004-05 Progress: Percent of total formula need funded from all sources:
2006-07: 95.1 percent 2007-08: 96.2 percent
3.4 Develop, support, and maintain a new funding formula for higher education aligned with the
objectives of the THEC Master Plan.
Assessment: THEC will annually review the funding formula to determine if the model appropriately includes various fiscal incentives and disincentives that link to the THEC Master Plan.
Target: By 2009-10, the funding formula will be fully operational in addressing the goals
of the THEC Master Plan. Baseline: In 2005, a new funding formula was approved by the THEC with the provision
that the formula will be reviewed annually by the Formula Advisory Committee and revised when necessary to reflect policy change.
19
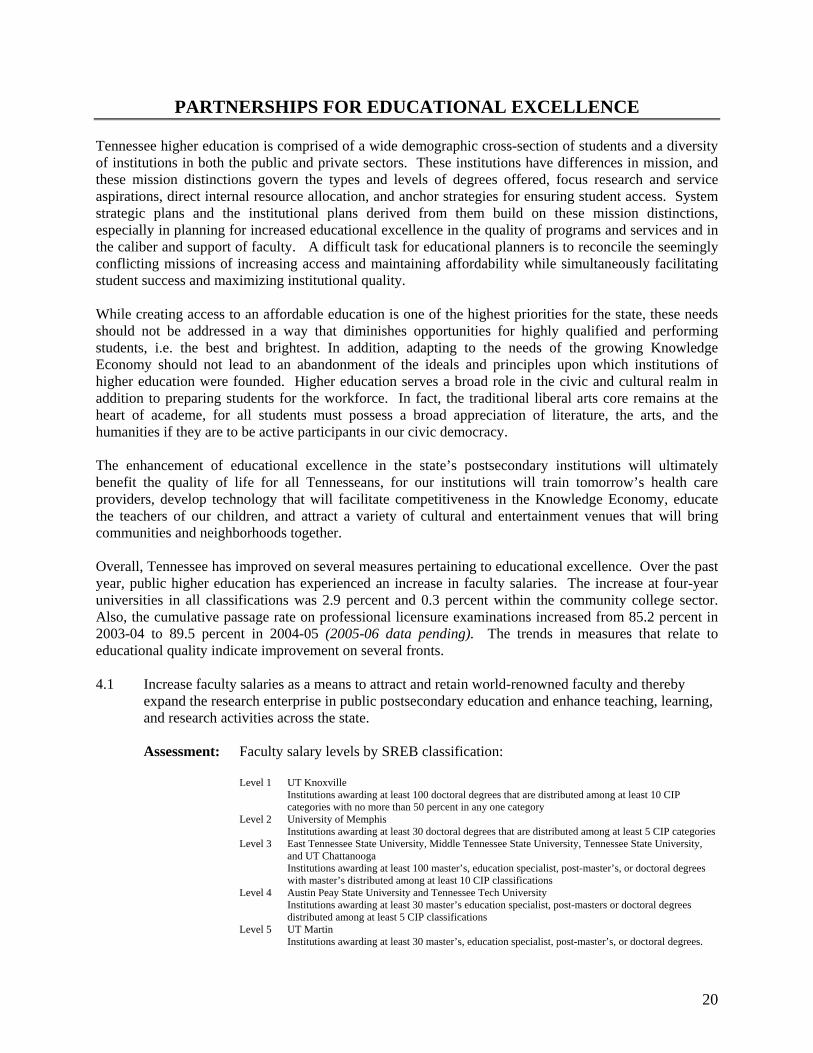
PARTNERSHIPS FOR EDUCATIONAL EXCELLENCE Tennessee higher education is comprised of a wide demographic cross-section of students and a diversity of institutions in both the public and private sectors. These institutions have differences in mission, and these mission distinctions govern the types and levels of degrees offered, focus research and service aspirations, direct internal resource allocation, and anchor strategies for ensuring student access. System strategic plans and the institutional plans derived from them build on these mission distinctions, especially in planning for increased educational excellence in the quality of programs and services and in the caliber and support of faculty. A difficult task for educational planners is to reconcile the seemingly conflicting missions of increasing access and maintaining affordability while simultaneously facilitating student success and maximizing institutional quality. While creating access to an affordable education is one of the highest priorities for the state, these needs should not be addressed in a way that diminishes opportunities for highly qualified and performing students, i.e. the best and brightest. In addition, adapting to the needs of the growing Knowledge Economy should not lead to an abandonment of the ideals and principles upon which institutions of higher education were founded. Higher education serves a broad role in the civic and cultural realm in addition to preparing students for the workforce. In fact, the traditional liberal arts core remains at the heart of academe, for all students must possess a broad appreciation of literature, the arts, and the humanities if they are to be active participants in our civic democracy. The enhancement of educational excellence in the state’s postsecondary institutions will ultimately benefit the quality of life for all Tennesseans, for our institutions will train tomorrow’s health care providers, develop technology that will facilitate competitiveness in the Knowledge Economy, educate the teachers of our children, and attract a variety of cultural and entertainment venues that will bring communities and neighborhoods together. Overall, Tennessee has improved on several measures pertaining to educational excellence. Over the past year, public higher education has experienced an increase in faculty salaries. The increase at four-year universities in all classifications was 2.9 percent and 0.3 percent within the community college sector. Also, the cumulative passage rate on professional licensure examinations increased from 85.2 percent in 2003-04 to 89.5 percent in 2004-05 (2005-06 data pending). The trends in measures that relate to educational quality indicate improvement on several fronts. 4.1 Increase faculty salaries as a means to attract and retain world-renowned faculty and thereby
expand the research enterprise in public postsecondary education and enhance teaching, learning, and research activities across the state. Assessment: Faculty salary levels by SREB classification:
Level 1 UT Knoxville Institutions awarding at least 100 doctoral degrees that are distributed among at least 10 CIP categories with no more than 50 percent in any one category
Level 2 University of Memphis Institutions awarding at least 30 doctoral degrees that are distributed among at least 5 CIP categories
Level 3 East Tennessee State University, Middle Tennessee State University, Tennessee State University, and UT Chattanooga
Institutions awarding at least 100 master’s, education specialist, post-master’s, or doctoral degrees with master’s distributed among at least 10 CIP classifications
Level 4 Austin Peay State University and Tennessee Tech University Institutions awarding at least 30 master’s education specialist, post-masters or doctoral degrees distributed among at least 5 CIP classifications
Level 5 UT Martin Institutions awarding at least 30 master’s, education specialist, post-master’s, or doctoral degrees.
20

Target: By 2009-10, average faculty salaries for Tennessee institutions will meet or
exceed the SREB average for institutional classification.
Baseline:
2004-05 SREB Tennessee Percentage Level 1 $73,161 $69,788 95.4% Level 2 $67,015 $59,775 89.2% Level 3 $56,461 $55,447 98.2% Level 4 $54,118 $55,836 103.2% Level 5 $50,275 $51,593 102.6%
All Univs. $63,768 $60,110 94.3% All 2-Yr. $45,248 $43,822 96.8%
All Tech Centers $41,205 $35,354 85.8% Progress:
2005-06 SREB Tennessee Percentage One-Year Percent Change
Level 1 $75,688 $71,340 94.3% -1.1% Level 2 $69,216 $63,850 92.2% 3.0% Level 3 $58,184 $55,987 96.2% -2.0% Level 4 $55,155 $56,449 102.3% -0.9% Level 5 $52,233 $53,741 102.9% 0.3%
All Univs. $65,966 $61,617 93.4% -0.9% All 2-Yr. $46,732 $45,959 98.3% 1.5%
All Tech Centers $41,020 $34,920 85.1% -0.7%
2006-07 SREB Tennessee Percentage Two-Year
Percent Change
Level 1 $78,762 $72,531 92.1% -3.3% Level 2 $73,047 $68,039 93.1% 3.9% Level 3 $59,905 $57,668 96.3% -1.9% Level 4 $57,626 $57,057 99.0% -4.2% Level 5 $54,406 $55,270 101.6% -1.0%
All Univs. $68,583 $63,379 92.4% -1.9% All 2-Yr. $48,440 $46,075 95.1% -1.7%
All Tech Centers $42,540 $35,996 84.6% -1.2%
21
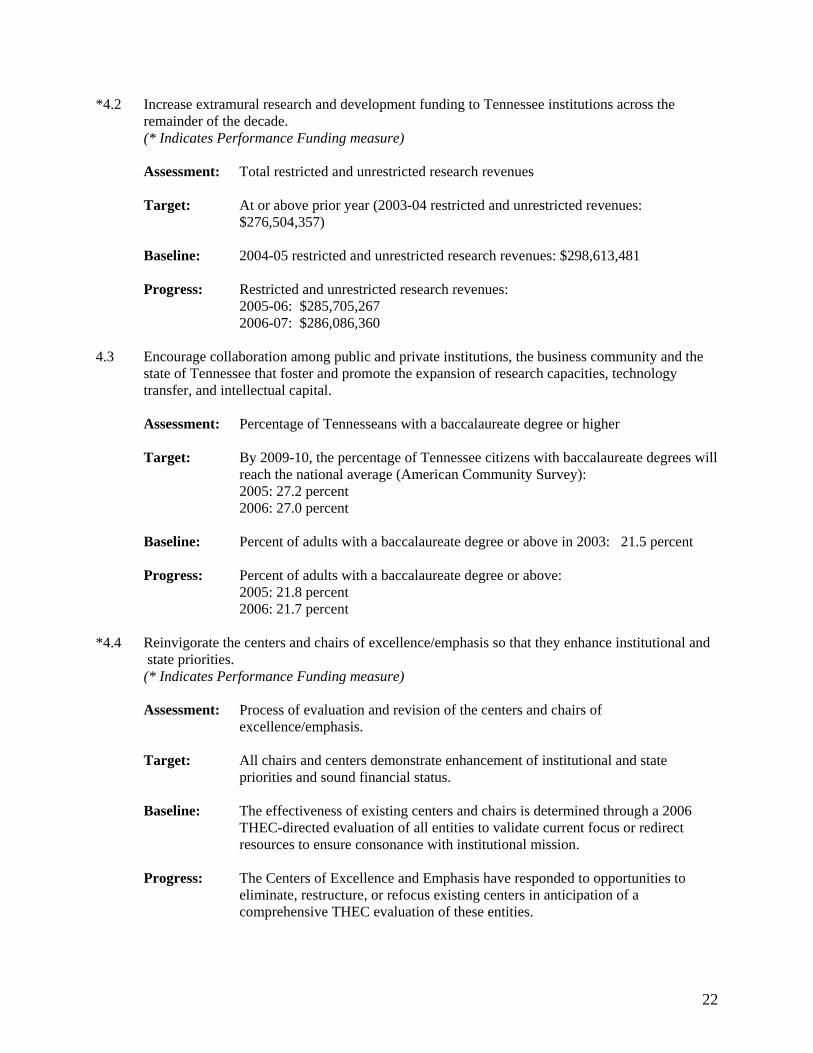
*4.2 Increase extramural research and development funding to Tennessee institutions across the remainder of the decade.
(* Indicates Performance Funding measure) Assessment: Total restricted and unrestricted research revenues
Target: At or above prior year (2003-04 restricted and unrestricted revenues:
$276,504,357) Baseline: 2004-05 restricted and unrestricted research revenues: $298,613,481 Progress: Restricted and unrestricted research revenues:
2005-06: $285,705,267 2006-07: $286,086,360
4.3 Encourage collaboration among public and private institutions, the business community and the
state of Tennessee that foster and promote the expansion of research capacities, technology transfer, and intellectual capital. Assessment: Percentage of Tennesseans with a baccalaureate degree or higher Target: By 2009-10, the percentage of Tennessee citizens with baccalaureate degrees will
reach the national average (American Community Survey): 2005: 27.2 percent 2006: 27.0 percent Baseline: Percent of adults with a baccalaureate degree or above in 2003: 21.5 percent Progress: Percent of adults with a baccalaureate degree or above:
2005: 21.8 percent 2006: 21.7 percent
*4.4 Reinvigorate the centers and chairs of excellence/emphasis so that they enhance institutional and
state priorities. (* Indicates Performance Funding measure) Assessment: Process of evaluation and revision of the centers and chairs of
excellence/emphasis.
Target: All chairs and centers demonstrate enhancement of institutional and state priorities and sound financial status.
Baseline: The effectiveness of existing centers and chairs is determined through a 2006
THEC-directed evaluation of all entities to validate current focus or redirect resources to ensure consonance with institutional mission.
Progress: The Centers of Excellence and Emphasis have responded to opportunities to
eliminate, restructure, or refocus existing centers in anticipation of a comprehensive THEC evaluation of these entities.
22

*4.5 Improve educational quality, as evidenced through students’ achievement, as a means to encourage life-long learning and to prepare students for the workforce. (* Indicates Performance Funding Measure)
Assessment 1: Passage rates on professional licensure examinations in medicine, dentistry,
engineering, nursing, law, pharmacy, and physical therapy. Target: By 2009-10, the average cumulative pass rate on licensure examinations will
remain above 85 percent. Baseline: In 2003-04, the average cumulative pass rate on licensure examinations was
85.2 percent. Progress: The average cumulative pass rate on licensure examinations:
2004-05: 89.5 percent 2005-06: Data Pending
Assessment 2: Community college job placement rate
Target: By 2009-10, the average community college placement rate will remain above 90 percent.
Baseline: In 2004-05, 92 percent of community college graduates were placed in jobs
related to their degree. Progress: Percent of community college graduates places in jobs related to their degree: 2005-06: 92 percent 2006-07: 93 percent
23
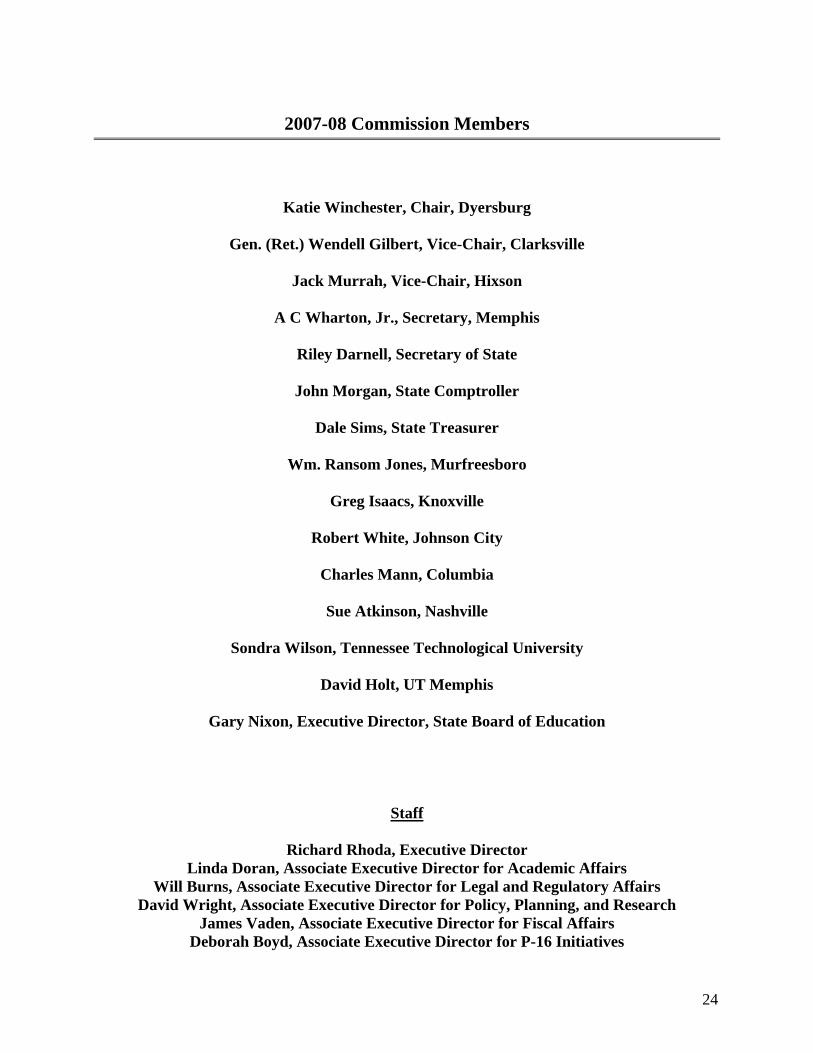
2007-08 Commission Members
Katie Winchester, Chair, Dyersburg
Gen. (Ret.) Wendell Gilbert, Vice-Chair, Clarksville
Jack Murrah, Vice-Chair, Hixson
A C Wharton, Jr., Secretary, Memphis
Riley Darnell, Secretary of State
John Morgan, State Comptroller
Dale Sims, State Treasurer
Wm. Ransom Jones, Murfreesboro
Greg Isaacs, Knoxville
Robert White, Johnson City
Charles Mann, Columbia
Sue Atkinson, Nashville
Sondra Wilson, Tennessee Technological University
David Holt, UT Memphis
Gary Nixon, Executive Director, State Board of Education
Staff
Richard Rhoda, Executive Director
Linda Doran, Associate Executive Director for Academic Affairs Will Burns, Associate Executive Director for Legal and Regulatory Affairs
David Wright, Associate Executive Director for Policy, Planning, and Research James Vaden, Associate Executive Director for Fiscal Affairs
Deborah Boyd, Associate Executive Director for P-16 Initiatives
24

Data Sources
American Community Survey Goals: Educational Excellence 4.3 National Association of State Student Grant and Aid Programs Goals: Affordability 3.1 National Center for Higher Education Management Systems Goals: Student Preparation 2.1 Southern Regional Education Board Goals: Access 1.3, 1.4 Student Preparation 2.4 Educational Excellence 4.1 Tennessee Higher Education Commission Goals: Access 1.1, 1.2, 1.5 Student Preparation 2.2, 2.3 Affordability 3.2, 3.3, 3.4 Educational Excellence 4.2, 4.4, 4.5
25

26