submarine electricity cables cost benefit analysis...
TRANSCRIPT

Stakeholder Consultation December 2015
Submarine Electricity CablesCost Benefit Analysis Methodology Statement

Submarine Electricity Cables ConsultationWhat you need to know
Contents
02 Introduction
05 Methodology Overview: Stage 1: Identifying if impacts have any significant implications for any living
organism, natural resource or habitat Stage 2: Quantifying the link between submarine electricity cable installations
and the impact on any living organism, natural resource or habitat Stage 3: Assigning a monetary value to the impact that submarine
electricity cable installations have on any living organism, natural resource or habitat
Stage 4: Data used to quantify the impact that submarine electricity cable installations have on any living organism, natural resource or habitat
22 Next Steps
23 Additional information and references Appendix 1: Further literature review bibliography
Submarine Electricity CablesCost Benefit Analysis Methodology Statement

What you need to know
Fifty-nine Scottish islands are currently connected to the electricity network that serves mainland Great Britain by the Scottish Hydro Electric Power Distribution network. They are connected by submarine cables which supply electricity to homes and businesses on the islands.
The cost of supplying electricity to the Scottish islands is supported by electricity consumers across the north of Scotland as part of their energy bills.
Scotland’s National Marine Plan, adopted in March 2015, requires us to consider how submarine electricity cables are laid and protected on the seabed.
During September and October 2015, we asked stakeholders to help us shape the cost benefit analysis model. The model will be used to help us determine which method of submarine electricity cable installation delivers best value by satisfying all current legislation and providing a sustainable balance of economic, safety and wider social and economic impacts.
Your responses to the first phase of our consultation have been valuable in helping inform:
• the submarine cable installation methods we consider in the cost benefit analysis;
• the benefits and drawbacks of protecting submarine electricity cables;
• the key impacts associated with installing submarine electricity cables;
• the methodology we will use to identify and evaluate potential impacts.
We have summarised your responses and made them available on our website at http://news.ssepd.co.uk/submarinecables
This statement provides more detail about how our methodology has been informed by the consultation, how your input has informed, what the cost benefit analysis tool will look like, and how it will work.
The next stage will be to illustrate a worked example of the cost benefit analysis tool in action at a series of three workshops. This will give you an opportunity to provide face-to-face feedback on our identified impacts and method(s) for quantifying them.
Submarine Electricity CablesCost Benefit Analysis Methodology Statement
Page 01

The cost of maintaining the electricity distribution network involves investment by us. When customers in our network area receive an electricity bill from their supplier, our costs are included.
Within our current business plan we propose spending £44 million over the next eight years to replace 112 kilometres of submarine electricity cables. This cost was based on our existing engineering practice of laying these cables on the seabed.
The policies within Scotland’s National Marine Plan may require us to change this practice. If we are required to protect the whole 112 kilometres, our initial high-level analysis suggests the cost of doing so could be in the region of £300 million.
We want to find the best value method of cable installation which satisfies all current legislation and provides a sustainable balance of health and safety, socio-economic, environmental and wider engineering and economic impacts.
To help us do this, we propose to use a cost benefit analysis model which will demonstrate (to ourselves, our customers, our regulators – Ofgem and Marine Scotland – and all users of the marine environment) that the method(s) we propose to deploy in the future for laying and protecting cables around the coast of Scotland justify the additional expenditure and provide best value.
This paper sets out the methodology which we will use to develop this model.
Introduction
Submarine Electricity CablesCost Benefit Analysis Methodology Statement
Page 02
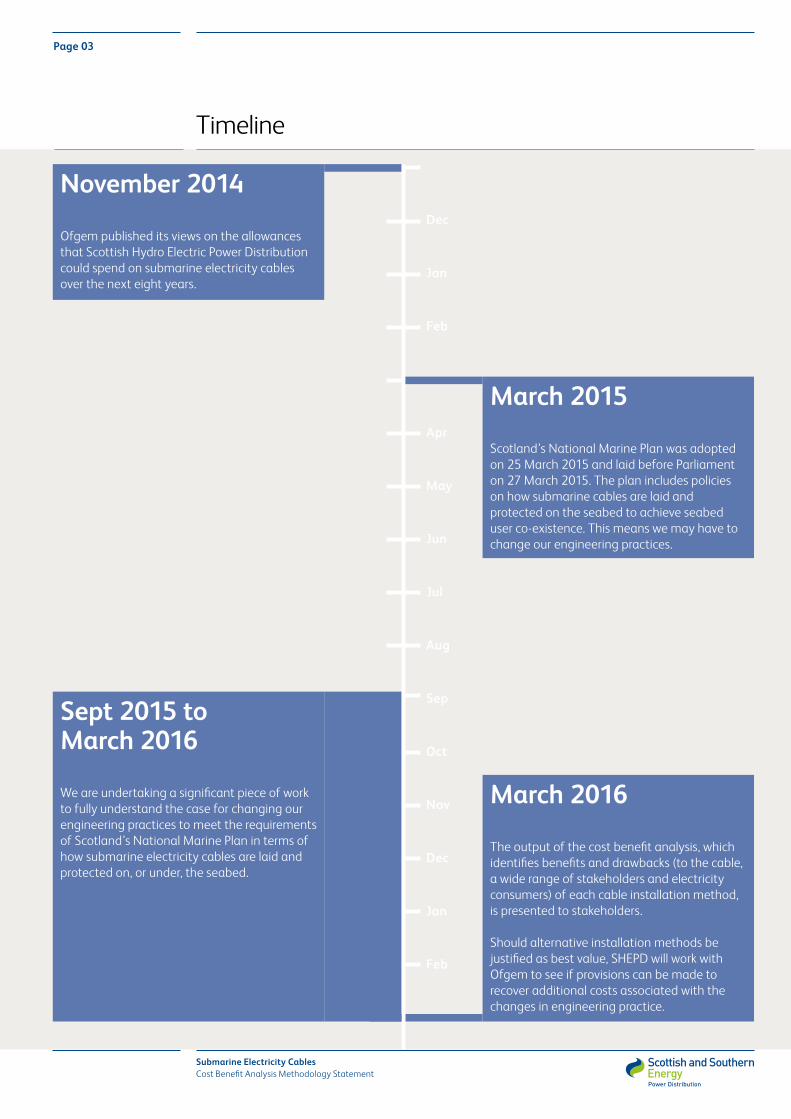
November 2014 Ofgem published its views on the allowances that Scottish Hydro Electric Power Distribution could spend on submarine electricity cables over the next eight years.
March 2015 Scotland’s National Marine Plan was adopted on 25 March 2015 and laid before Parliament on 27 March 2015. The plan includes policies on how submarine cables are laid and protected on the seabed to achieve seabed user co-existence. This means we may have to change our engineering practices.
Sept 2015 to March 2016 We are undertaking a significant piece of work to fully understand the case for changing our engineering practices to meet the requirements of Scotland’s National Marine Plan in terms of how submarine electricity cables are laid and protected on, or under, the seabed.
March 2016
The output of the cost benefit analysis, which identifies benefits and drawbacks (to the cable, a wide range of stakeholders and electricity consumers) of each cable installation method, is presented to stakeholders. Should alternative installation methods be justified as best value, SHEPD will work with Ofgem to see if provisions can be made to recover additional costs associated with the changes in engineering practice.
Timeline
Dec
Jan
Feb
Apr
May
Jun
Jul
Aug
Sep
Oct
Nov
Dec
Jan
Feb
Submarine Electricity CablesCost Benefit Analysis Methodology Statement
Page 03

Installation Methods
The cable installation methods that the cost benefit analysis will consider are: • Surface laying: submarine cable is laid directly on the seabed with no additional protection.• Ploughing: a narrow trench is cut in the seabed in which to lay the cable.• Jetting: high pressure water jets ‘fluidise’ the seabed allowing the cable to ‘sink’ into the seabed.• Mass flow excavation: a method of burial that clears sediment from underneath the cable.• Mattressing: a concrete ‘mattress’, usually 3m x 6m, is used to protect the cable at key points.• Rock dumping: covering the cable with rock.• Horizontal directional drilling: land-based solution of drilling under short passages of water.
We asked:
Did we include all appropriate installation methods for submarine electricity cables?
We heard:There are a number of ways in which submarine electricity cables can be installed. They are not mutually exclusive, but will depend on the specific submarine topography. Within the phase 1 consultation we asked for your views on whether all appropriate methods for installation had been considered for inclusion within the cost benefit analysis model.
You highlighted three new methods:• Horizontal directional drill: this is a land-based
solution that enables a hole to be drilled into the ground for up to 3 kilometres without breaking the surface of the ground. Once a hole is drilled it is lined with conduit (plastic or steel) then a cable can be pulled through from one end to the other.
• Vibrating ploughs: a vibrating plough utilises similar engineering principles to a standard submarine cable plough but with the introduction of a gentle oscillatory vibration it can in certain conditions allow for a deeper cultivation (bury) with less power. This can result in shorter times for cable installation.
• Vertical injector: this system utilises high pressure water and a blade to cut into the seabed surface and is best suited to soft sediment and clays. It works in a similar way to jetting by fluidising the seabed and installing the cable within the made track, the injector is able to increase and decrease the depth of burial. This system is managed offshore by a vessel.
You noted four alternative protection methods:• Iron shells/split pipe: a series of interlocking half
shell cast modules to form a vertebrae restrictor around the submarine electricity cable.
• High Density Polyethylene/Uraduct: a series of interlocking plastic modules which are attached around the submarine electricity cables to form a further protective coating.
Our response: After further engineering review we decided to include horizontal directional drilling as an additional installation method, but not vibrating ploughs and vertical injectors because vibrating ploughs and vertical injectors would create broadly similar impacts to methods already included (ploughing and jetting) so it would be difficult to identify meaningful differences to quantify at this stage.
In terms of alternative protection methods, these are typically used as protection aids for the shore end of electricity submarine cables on areas of rock. We have in the past installed them offshore, however, due to limitations of being manually applied they are limited to water depths of less than 20 metres and as such are not deemed to be a suitable operational solution for offshore installations greater than 100 metres.
Therefore, we have not included any further protection methods.
Submarine Electricity CablesCost Benefit Analysis Methodology Statement
Page 04

Methodology Overview
The majority of respondents expressing an opinion on the proposed methodology, shown in Figure 1, agreed it enables adequate assessment of whether or not to include an impact within the cost benefit analysis model.
Page 05
Submarine Electricity CablesCost Benefit Analysis Methodology Statement

For example, is there a risk of:• loss of human life or injury (safety impact)• loss of earnings (social impact)
• financial impact on marine users (economic impact)
• habitat damage (environmental impact)
Does the identified impact have any significant implications for any living organism, natural resource or habitat?
1
• y units of health and safety impact• y units of socio-economic impact
• y units of environmental impact• £y of wider economic and engineering impact
Is there a quantifiable link between submarine cable installations and whatever they impact upon? For instance, x units of surface lay or protection will result in:
2Can this link be valued in a way that fits with the cost benefit analysis model?3Is there pre-existing data to allow impacts to be quantified without significant primary data collection?4
Figure 1: Cost benefit analysis methodology overview
We asked:
Did you agree with our cost benefit analysis methodology overview?
We heard:Eleven of the 31 respondents did not feel that they had sufficient information to decide if they agreed with our methodology of assessing if there is enough evidence to include an impact in our model.
Concern was noted that some environmental impacts are hard to monetise and this may result in key impacts being excluded from the overall cost benefit analysis of protection methods.
Our response: This method statement expands on our methodology and the second phase of workshops planned for December 2015 will allow stakeholders to highlight if further work is still required before the final report is published in March 2016.
We believe that the cost benefit analysis methodology statement in Stage 3 addresses monetisation of impact areas.
Submarine Electricity CablesCost Benefit Analysis Methodology Statement
Page 06

1
We asked:
Do you agree with the four broad categories (health and safety, socio-economic, environmental and wider economic and engineering)?
We heard:There was a general feeling that the four broad categories are capable of capturing the impacts but stakeholders would like more detail about the impacts that will be measured. Respondents also commented that the cost benefit analysis must also be capable of capturing the consequential impacts that categories may have on one another.
For example, an increased level of fuel poverty affects the health, safety and well-being of individuals, households and communities in the areas affected. Cultural heritage may also be impacted, in particular as a result of increased living costs, and young people with a Gaelic speaking background leaving the islands meaning that these traditions are lost.
Other respondents also noted that the link between wider economic impacts and engineering impacts was not well enough defined and thus should be separated to ensure that all impacts were considered equally.
Of the 37 responses received to this question, socio-economic impacts were highlighted as the impact with most importance (14 respondents); followed by health and safety (13 respondents); and environmental (seven respondents). Three respondents felt that all impacts were equally important.
Our response: The second phase of workshops planned for December 2015 will allow stakeholders to highlight if further work is still required before the final report is published in March 2016.
Identifying if impacts have any significant implications for any living organism, natural resource or habitat
We carried out an initial literature review of impacts relevant to submarine electricity cable installation methods. This identified 34 impacts which we grouped into four broad impact categories. Respondents broadly agreed with these but requested further clarification of what we meant. Therefore we have redefined the broad impact categories as:
• Health and safety: refers to the health and safety of humans within the vicinity of our submarine electricity cables, during installation, operation, and removal.
• Socio-economic: describes how submarine electricity cables impacts on human activities, including fuel poverty, commercial fishing, and future renewable generation.
• Environmental: relates to the impact of our submarine electricity cables on the natural environment during their installation, operation and removal.
• Wider economic and engineering impacts: the cost impacts associated with installation, operation, and removal of submarine electricity cables, which may be directly or indirectly incurred by SHEPD’s customers.
Stage 1
Submarine Electricity CablesCost Benefit Analysis Methodology Statement
Page 07

We asked stakeholders about the key impacts associated with submarine electricity cables installation methods and for evidence to support their view.
We cross-referenced the evidence related to our existing list of impacts with the evidence provided for those suggested by stakeholders. Through this process we reduced the focus of the cost benefit analysis from 34 to 13 impact areas. These 13 impacts areas that will be included and quantified in the cost benefit analysis model are shown in Table 1 below.
Table 1: Key impacts to be quantified in the cost benefit analysis.
Category No Detail of impact
Health and safety impacts 1 Risks to health and safety of those working in the fishing industry
2 Risks to health and safety of those working on submarine electricity cable laying vessels
Socio-economic impacts 3 Damage to fishing equipment and vessels
4 Temporary impact on island community economies due to energy insecurity in the event of cable failure
5 Possible reduction in renewable generation on the islands
6 Fuel poverty impacts as a result of an increase in the distribution element of customers’ bills
7 Loss (temporary/permanent) of access to fishing grounds/impacts on benthic habitats and organisms due to seabed disturbance
Environmental impacts 8 Possible increase in greenhouse gas emissions from a reduction in renewable generation
9 Greenhouse gas emissions from use of diesel generators during cable faults
Wider economic and engineering
10 Increased installation costs (including specialist equipment, raw materials, and the use of extra vessels)
11 Impacts due to increased repair costs (should the cable fault)
12 Impacts on reduced fault rate and increased cable mean time between failure
13 Changes to operating, maintenance and decommissioning costs
Submarine Electricity CablesCost Benefit Analysis Methodology Statement
Page 08
We asked:
Have we captured the key health and safety impacts and have you any evidence to quantify them?
We heard:The majority of respondents agreed that we had captured the key health and safety impacts. However some felt special consideration should be given to the health and safety impact of those pushed into fuel poverty (at a household/individual level) due to rising bills caused by changes to submarine electricity cable installation practices.
Despite there being a large number of other marine vessels registered in UK waters, the number of reported incidents relating to submarine electricity cables is comparatively low. Therefore quantifiable data is limited and this has been excluded.
Our response: We have reviewed the evidence and decided to include the health and safety impacts of fuel poverty under the socio-economic impact category because of the impact of low indoor temperatures on health, established by the World Health Organisation, which has a direct impact on society.
As there was no strong evidence of the health and safety impacts of other marine vessels this will not be quantified in the cost benefit analysis.
We asked:
Have we captured the key socio-economic impacts and have you any evidence to quantify them?
We heard:Over half of the respondents felt that quantification of the permanent disadvantage that socio-economic impacts have on people and business, when compared to the rest of the UK, had to be reflected.
Some respondents believed that the list of socio-economic impacts had a very heavy fishing focus. Others suggested that some of the social-economic impacts currently listed were not material or could be mitigated in other ways and not included in the cost benefit analysis.
Our response: The key impacts within this broad category have changed as follows:
We have combined a number of the fishing impacts into ‘Loss (temporary/permanent) of access to fishing grounds/impacts on benthic habitats and organisms due to seabed disturbance’.
In terms of restrictions to water sports, recreational, port and marine-based commercial activities, stakeholders did not express a view or provide evidence as to the impact that our submarine electricity cables have upon them. Also, due to the relatively short period required to install submarine electricity cables it is unlikely there will be prolonged restriction or displacement of these activities. Therefore, we have removed these from the model.
Current requirements to survey the seabed prior to conducting installation activities means the likelihood of disturbing archaeological resources was considered low. When coupled with challenges with monetising disturbances to archaeological resources, we considered that this impact could not be robustly included within the analysis and have removed it from the model.
We have expanded the impact of fuel poverty to include health-related and socio-economic implications of increasing levels of fuel poverty within the SHEPD network area in line with the Marmot Review.
Submarine Electricity CablesCost Benefit Analysis Methodology Statement
Page 09
We asked:
Have we captured the key environmental impacts and have you any evidence to quantify them?
We heard:The majority of stakeholders agreed that we had captured the key environmental impacts. However, when we reviewed these against the evidence base, a number were removed as we could not establish a direct relationship between them and submarine electricity cable installation methods. This was true for electromagnetic fields, noise and vibration, thermal radiation, disturbance of containments in the seabed, temporary turbidity, the release of containments and creation of artificial substrate habitat.
We did hear that these remain growing areas of scientific interest and that research is ongoing in these areas. We will therefore seek to work with stakeholders to include relevant information in future marine licensing applications.
Our response: The likelihood of the following impacts: direct collision between marine mammals and cable laying vessels; and temporary emissions and wastes from vessels being realised is minimal due to regulation of activities which has resulted in mitigation measures being put in place. Therefore these have not been included in the cost benefit analysis.
The impact on benthic habitat and organisms has now been included within the socio-economic category impact of restriction to the temporary/permanent restriction of fishing grounds.
Due to the relatively short period needed to lay electricity submarine cables the impact of our activities on seabirds and visual amenity is considered to be minimal and has therefore not been included in the cost benefit analysis.
Respondents highlighted that environmental impacts are often cumulative and that the more invasive to the seabed the installation method is, the higher the environmental impact during the maintenance and decommissioning phases. However, we are currently unable to value and quantify this directly and will seek further guidance at the workshops on this process.
We asked:
Have we captured the key wider economic and engineering impacts and how do we quantify them?
We heard:The majority of respondents agreed that we had captured the wider economic and engineering impacts.
Some respondents highlighted that many impacts can be negated through early dialogue but historically this has not always been achieved.
Our response: By being open and transparent through this cost benefit analysis we hope to build relationships and a better understanding of our impacts on others. A natural outcome of this will be early dialogue and consultation with stakeholders before future marine licensing applications – avoiding potential conflicts.
Submarine Electricity CablesCost Benefit Analysis Methodology Statement
Page 10
2
We asked:
Do you agree our model will consider appropriate research literature?
We heard:A majority of respondents were supportive of the evidence-based selection criteria.
Our response: Stakeholders identified a further 20 sources of evidence (Appendix 1: Stakeholder recommended evidence) but offered no material arguments for amending the selection criteria we use to identify and evaluate impacts to be amended.
Quantifying the link between submarine electricity cable installations and the impact on any living organism, natural resource or habitat
We have decided to use the following evidence-based selection criteria to identify those studies that best help to identify and evaluate potential impacts. The selection criteria we used in this process are:
• Date: given the large volume of available studies, the evidence will be limited to more recent studies from 2000 onwards. It is worth noting that with advances in non-market valuation techniques over the past decade, there is a greater likelihood of obtaining results which are more robust for the purposes of value transfer by focusing on more recent studies.
• Language: only evidence provided in English will be considered.
• Geography: the search will prioritise studies based in similar contexts to the Greater North Sea region, focusing on studies in the UK, and only including studies from other regions where there is a particularly clear case to do so.
• Technique: priority will be given to the results of peer-reviewed empirical studies rather than studies based on theoretical models, value transfer, or literature review.
Stage 2
Submarine Electricity CablesCost Benefit Analysis Methodology Statement
Page 11

3
Impact pathway – Health and Safety
Activity: Installation of submarine electricity cable Input Variable: Method of cable installation
a. The baseline length of cable installed using each technique (e.g. 15 km surface laid).b. The proposed length of cable installed using each technique (e.g. 10 km surface laid and 5 km ploughed).
c. Whether the cable (or section of the cable) lies within an area used by fishing vessels (e.g. yes or no).
Impact 1
Risks to health and safety of those working in the fishing industry
Output
Total cost of health and safety risks over operational lifetime of electricity submarine cable
Impact 2
Risks to health and safety of those working on submarine electricity cable laying vessels
Output
Total cost of health and safety risks for each installation technique
Receptor
Operators (fishing and installation crews) and their families
Scottish Hydro Electric Power Distribution Business
UK Government
Wider economy
Effect
Pain and suffering, medical costs, lost consumption
Lower efficiency, administration costs
NHS costs, administration costs, HSE investigations
Loss of output, resources spent on insurance
Figure 2: Impact pathway to output – Health and Safety
Assigning a monetary value to the impact that submarine electricity cable installations have on any living organism, natural resource or habitat
For each of the broad impact categories (health and safety; socio-economic; environmental; and wider economic and engineering) we have developed pathways to illustrate how we will quantify each impact. This will allow us to define
the activity that gives rise to the impact on a receptor and what we believe will be the effect of that impact and the data we have used to produce the cost benefit analysis output.
Stage 3
Submarine Electricity CablesCost Benefit Analysis Methodology Statement
Page 12
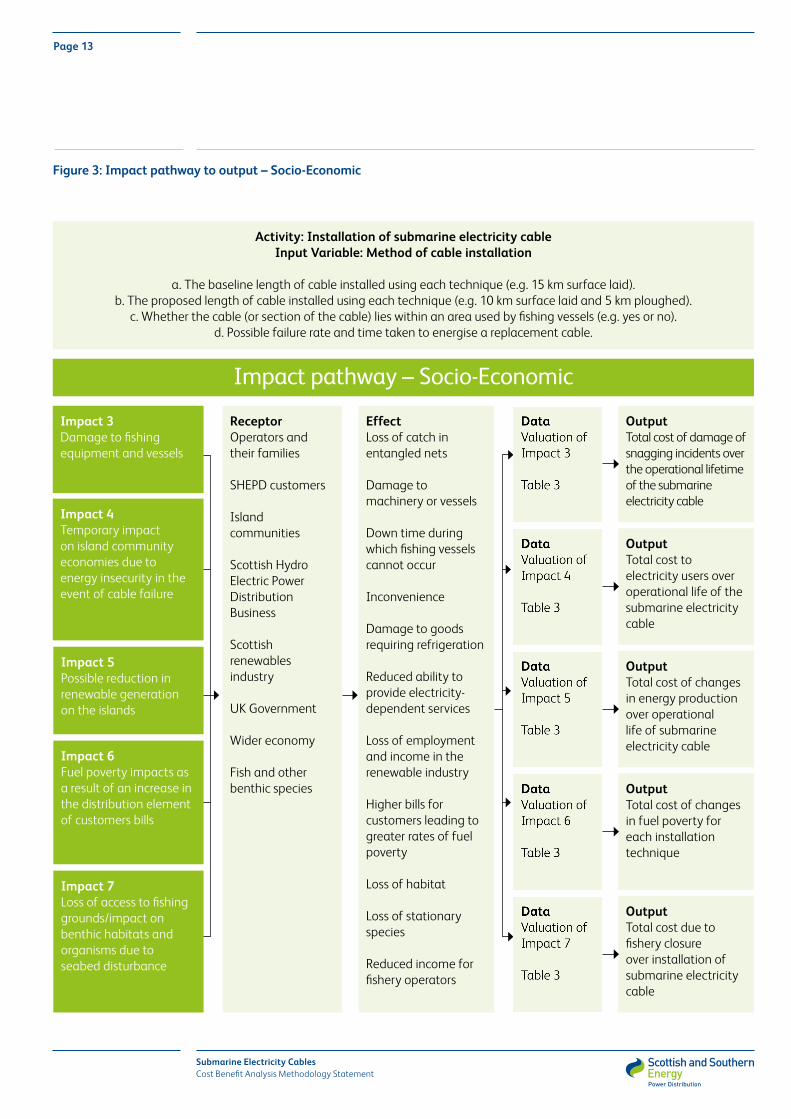
Impact pathway – Socio-Economic
Activity: Installation of submarine electricity cable Input Variable: Method of cable installation
a. The baseline length of cable installed using each technique (e.g. 15 km surface laid).b. The proposed length of cable installed using each technique (e.g. 10 km surface laid and 5 km ploughed).
c. Whether the cable (or section of the cable) lies within an area used by fishing vessels (e.g. yes or no).d. Possible failure rate and time taken to energise a replacement cable.
Impact 3Damage to fishing equipment and vessels
OutputTotal cost of damage of snagging incidents over the operational lifetime of the submarine electricity cable
Impact 4Temporary impact on island community economies due to energy insecurity in the event of cable failure
Impact 5Possible reduction in renewable generation on the islands
Impact 6Fuel poverty impacts as a result of an increase in the distribution element of customers bills
Impact 7Loss of access to fishing grounds/impact on benthic habitats and organisms due to seabed disturbance
OutputTotal cost to electricity users over operational life of the submarine electricity cable
OutputTotal cost of changes in energy production over operational life of submarine electricity cable
OutputTotal cost of changes in fuel poverty for each installation technique
OutputTotal cost due to fishery closure over installation of submarine electricity cable
Receptor Operators and their families
SHEPD customers
Island communities
Scottish Hydro Electric Power Distribution Business
Scottish renewables industry
UK Government
Wider economy
Fish and other benthic species
Effect Loss of catch in entangled nets
Damage to machinery or vessels
Down time during which fishing vessels cannot occur
Inconvenience
Damage to goods requiring refrigeration
Reduced ability to provide electricity-dependent services
Loss of employment and income in the renewable industry
Higher bills for customers leading to greater rates of fuel poverty
Loss of habitat
Loss of stationary species
Reduced income for fishery operators
Figure 3: Impact pathway to output – Socio-Economic
Submarine Electricity CablesCost Benefit Analysis Methodology Statement
Page 13
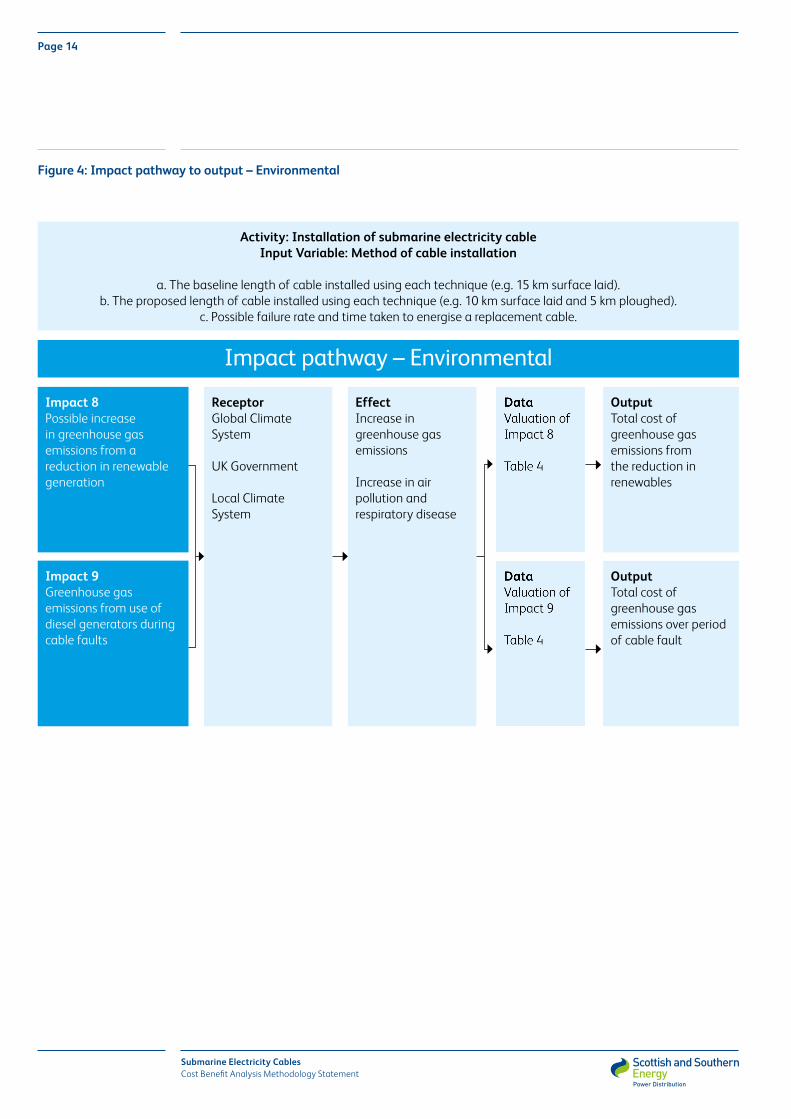
Figure 4: Impact pathway to output – Environmental
Impact pathway – Environmental
Activity: Installation of submarine electricity cable Input Variable: Method of cable installation
a. The baseline length of cable installed using each technique (e.g. 15 km surface laid).b. The proposed length of cable installed using each technique (e.g. 10 km surface laid and 5 km ploughed).
c. Possible failure rate and time taken to energise a replacement cable.
Impact 8Possible increase in greenhouse gas emissions from a reduction in renewable generation
OutputTotal cost of greenhouse gas emissions from the reduction in renewables
Impact 9Greenhouse gas emissions from use of diesel generators during cable faults
OutputTotal cost of greenhouse gas emissions over period of cable fault
Receptor Global Climate System
UK Government
Local Climate System
Effect Increase in greenhouse gas emissions
Increase in air pollution and respiratory disease
Submarine Electricity CablesCost Benefit Analysis Methodology Statement
Page 14

Figure 5: Impact pathway to output – Wider Economic and Engineering
Impact pathway – Wider Economic and Engineering
Activity: Installation of submarine electricity cable Input Variable: Method of cable installation
a. The baseline length of cable installed using each technique (e.g. 15 km surface laid).b. The proposed length of cable installed using each technique (e.g. 10 km surface laid and 5 km ploughed).
c. Possible failure rate and time taken to energise a replacement cable.
Impact 10Increase installation costs (including specialist equipment, raw materials, and use of extra vessels)
OutputTotal engineering cost incurred during installation of submarine electricity cable
OutputTotal cost in regard to the decreased need to repair electricity submarine cable faults
Impact 11Impacts due to increased repair costs (should the cable fault)
Impact 12Impacts on reduced fault rate and increased cable mean time between failure
Impact 13Change to operating, maintenance and decommissioning costs
OutputTotal engineering costs incurred during repair of submarine electricity cable
OutputTotal engineering cost of changes in operation, maintenance and decommission of alternative submarine cable installation methods
ReceptorScottish Hydro Electric Power Distribution Business
SHEPD customers
Local economy
Scottish economy
Effect Permanent increase in costs
Removal of protection before fault can be repaired
Hire of specialist equipment and vessels
Further vessels for restatement of protection
Reduced risk of third party faults
Increased mean time between failures
Increased maintenances and related survey costs
Submarine Electricity CablesCost Benefit Analysis Methodology Statement
Page 15

4 Data used to quantify the impact that submarine electricity cable installations have on any living organism, natural resource or habitat
We have included tables for each of the broad categories to show how we will build the cost benefit analysis model. For each impact area we have defined the following:
Inputs – these are the submarine electricity cable factors which will vary the magnitude of the output depending on the specific type or types of installation methodology.
Data – these are the defined values based on evidence which will be used to quantify the impact.
Output – the positive or negative value of the quantified impact.
We will use the total of all impact outputs to determine which installation method offers the best value.
The December 2015 and January 2016 workshops will enable stakeholders to see how we build the cost benefit analysis model using the evidence base, and how we apply it to one of our submarine electricity cable routes. The purpose of these workshops is to gather stakeholder views – and the evidence they have access to – to inform the development of the cost benefit analysis tool which we will use to demonstrate to Ofgem, Marine Scotland, and users of the marine environment whether or not the additional cost of protecting or burying submarine electricity cables represents value to SHEPD customers and wider stakeholders.
Stage 4
Submarine Electricity CablesCost Benefit Analysis Methodology Statement
Page 16
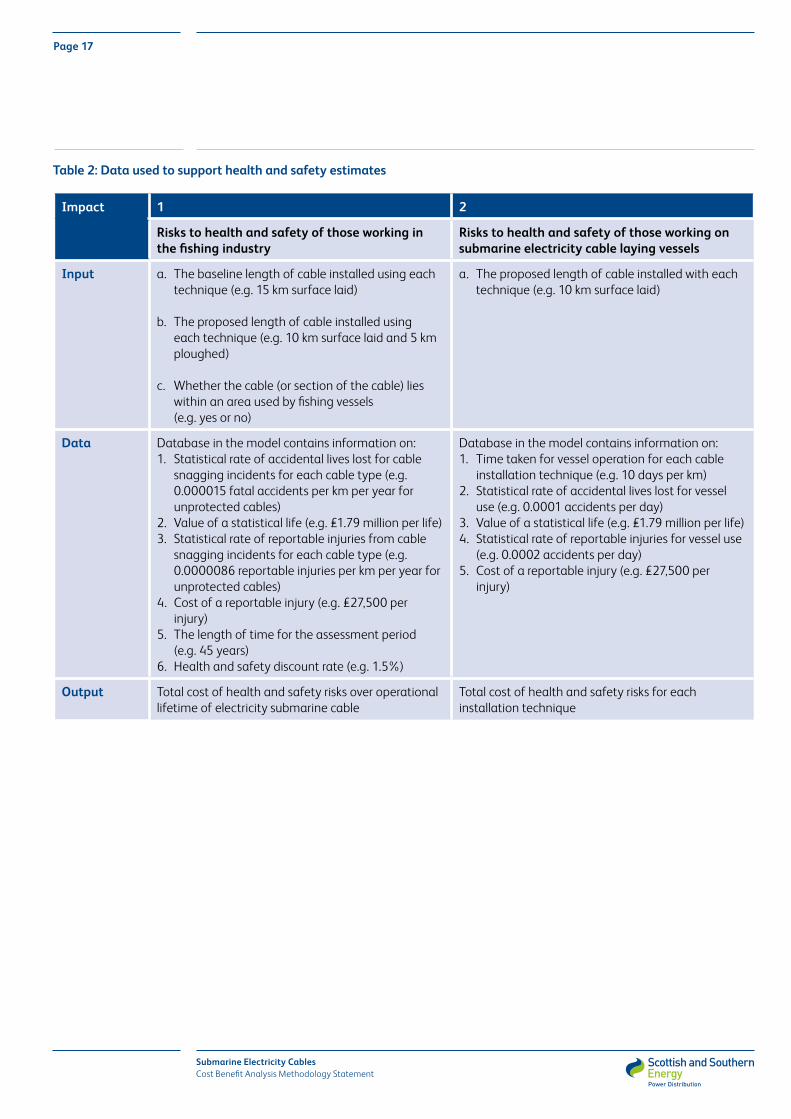
Impact 1 2
Risks to health and safety of those working in the fishing industry
Risks to health and safety of those working on submarine electricity cable laying vessels
Input a. The baseline length of cable installed using each technique (e.g. 15 km surface laid)
b. The proposed length of cable installed using each technique (e.g. 10 km surface laid and 5 km ploughed)
c. Whether the cable (or section of the cable) lies within an area used by fishing vessels (e.g. yes or no)
a. The proposed length of cable installed with each technique (e.g. 10 km surface laid)
Data Database in the model contains information on:1. Statistical rate of accidental lives lost for cable
snagging incidents for each cable type (e.g. 0.000015 fatal accidents per km per year for unprotected cables)
2. Value of a statistical life (e.g. £1.79 million per life)3. Statistical rate of reportable injuries from cable
snagging incidents for each cable type (e.g. 0.0000086 reportable injuries per km per year for unprotected cables)
4. Cost of a reportable injury (e.g. £27,500 per injury)
5. The length of time for the assessment period (e.g. 45 years)
6. Health and safety discount rate (e.g. 1.5%)
Database in the model contains information on:1. Time taken for vessel operation for each cable
installation technique (e.g. 10 days per km)2. Statistical rate of accidental lives lost for vessel
use (e.g. 0.0001 accidents per day)3. Value of a statistical life (e.g. £1.79 million per life)4. Statistical rate of reportable injuries for vessel use
(e.g. 0.0002 accidents per day)5. Cost of a reportable injury (e.g. £27,500 per
injury)
Output Total cost of health and safety risks over operational lifetime of electricity submarine cable
Total cost of health and safety risks for each installation technique
Table 2: Data used to support health and safety estimates
Submarine Electricity CablesCost Benefit Analysis Methodology Statement
Page 17

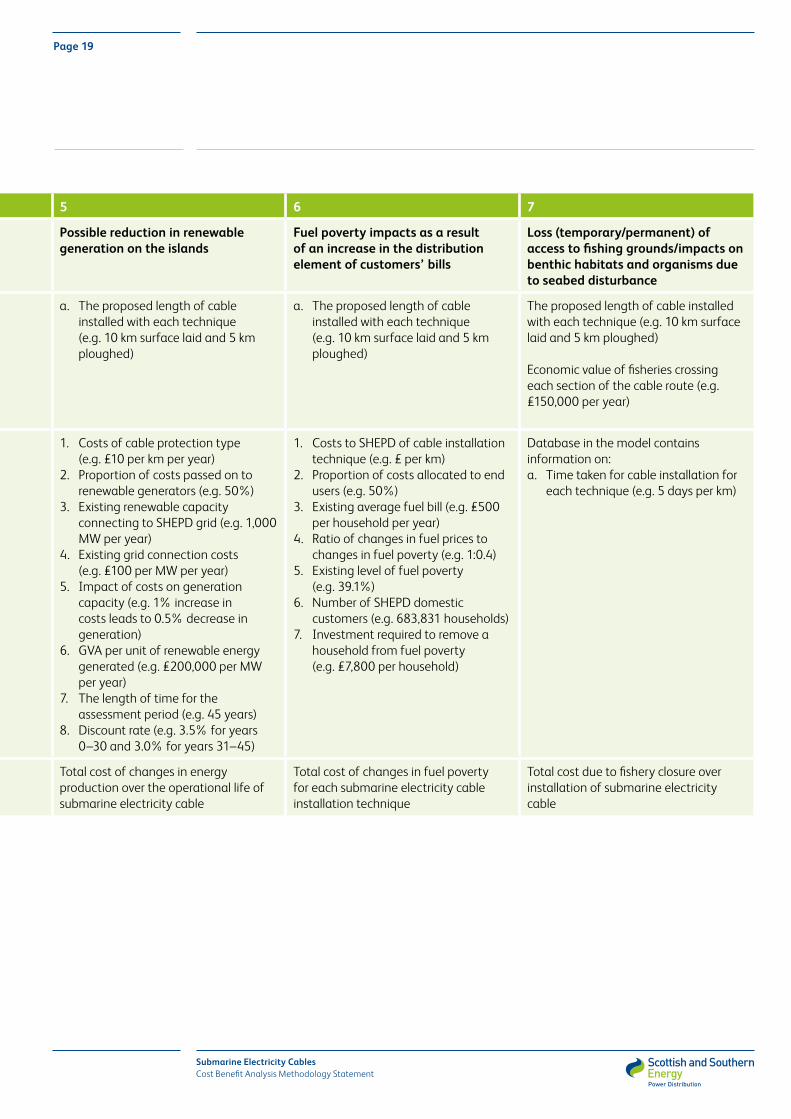
Impact 3 4 5 6 7
Damage to fishing equipment and vessels Temporary impact on island community economies due to energy insecurity in the event of cable failure
Possible reduction in renewable generation on the islands
Fuel poverty impacts as a result of an increase in the distribution element of customers’ bills
Loss (temporary/permanent) of access to fishing grounds/impacts on benthic habitats and organisms due to seabed disturbance
Input a. The baseline length of cable installed with each technique (e.g. 15 km surface laid)
b. The proposed length of cable installed with each technique (e.g. 10 km surface laid and 5 km ploughed)
c. Whether the cable (or section of the cable) lies within an area used by fishing vessels (e.g. yes or no)
a. The baseline length of cable installed with each technique (e.g. 15 km surface laid)
b. The proposed length of cable installed with each technique (e.g. 10 km surface laid and 5 km ploughed)
c. The island to which the cable connects (e.g. Shetland)
a. The proposed length of cable installed with each technique (e.g. 10 km surface laid and 5 km ploughed)
a. The proposed length of cable installed with each technique (e.g. 10 km surface laid and 5 km ploughed)
The proposed length of cable installed with each technique (e.g. 10 km surface laid and 5 km ploughed)
Economic value of fisheries crossing each section of the cable route (e.g. £150,000 per year)
Data 1. Frequency of damage to machinery (e.g. 0.01339 incidents per km per year)
2. Cost of machinery damage (e.g. £7,500 per incident)
3. Frequency of damage to vessels (e.g. 0.00893 incidents per km per year)
4. Cost of vessel damage (e.g. £1,500 per incident)
5. Frequency of incidents where fishing days are lost (e.g. 0.00893 incidents per km per year)
6. Cost of lost time (e.g. £5,214 per incident)7. Frequency of incidents where catch is lost
(e.g. 0.01786 per km per year)8. Cost of lost catch (e.g. £1,750 per incident) 9. The length of time for the assessment
period (e.g. 45 years)10. Discount rate (e.g. 3.5% for years 0–30 and
3.0% for years 31–45)
1. Fault rate for different cable installation techniques (e.g. 0.05 faults per km per year)
2. Average length of outage during faults (e.g. 0.5 MWh per fault)
3. Number of domestic, SME, and C&I users on each island (e.g. on Isle of Barra 845 domestic)
4. Value of Lost Load for domestic, SME, and C&I users (e.g. £9,888 per MW/h for domestic users)
5. The length of time for the assessment period (e.g. 45 years)
6. Discount rate (e.g. 3.5% for years 0–30 and 3.0% for years 31–45)
1. Costs of cable protection type (e.g. £10 per km per year)
2. Proportion of costs passed on to renewable generators (e.g. 50%)
3. Existing renewable capacity connecting to SHEPD grid (e.g. 1,000 MW per year)
4. Existing grid connection costs (e.g. £100 per MW per year)
5. Impact of costs on generation capacity (e.g. 1% increase in costs leads to 0.5% decrease in generation)
6. GVA per unit of renewable energy generated (e.g. £200,000 per MW per year)
7. The length of time for the assessment period (e.g. 45 years)
8. Discount rate (e.g. 3.5% for years 0–30 and 3.0% for years 31–45)
1. Costs to SHEPD of cable installation technique (e.g. £ per km)
2. Proportion of costs allocated to end users (e.g. 50%)
3. Existing average fuel bill (e.g. £500 per household per year)
4. Ratio of changes in fuel prices to changes in fuel poverty (e.g. 1:0.4)
5. Existing level of fuel poverty (e.g. 39.1%)
6. Number of SHEPD domestic customers (e.g. 683,831 households)
7. Investment required to remove a household from fuel poverty (e.g. £7,800 per household)
Database in the model contains information on:a. Time taken for cable installation for
each technique (e.g. 5 days per km)
Output Total cost of damage of snagging incidents over the operational lifetime of the submarine electricity cable
Total cost to electricity users over the operational life of the submarine electricity cable
Total cost of changes in energy production over the operational life of submarine electricity cable
Total cost of changes in fuel poverty for each submarine electricity cable installation technique
Total cost due to fishery closure over installation of submarine electricity cable
Table 3: Data used to support socio-economic estimates
Submarine Electricity CablesCost Benefit Analysis Methodology Statement
Page 18
Impact 3 4 5 6 7
Damage to fishing equipment and vessels Temporary impact on island community economies due to energy insecurity in the event of cable failure
Possible reduction in renewable generation on the islands
Fuel poverty impacts as a result of an increase in the distribution element of customers’ bills
Loss (temporary/permanent) of access to fishing grounds/impacts on benthic habitats and organisms due to seabed disturbance
Input a. The baseline length of cable installed with each technique (e.g. 15 km surface laid)
b. The proposed length of cable installed with each technique (e.g. 10 km surface laid and 5 km ploughed)
c. Whether the cable (or section of the cable) lies within an area used by fishing vessels (e.g. yes or no)
a. The baseline length of cable installed with each technique (e.g. 15 km surface laid)
b. The proposed length of cable installed with each technique (e.g. 10 km surface laid and 5 km ploughed)
c. The island to which the cable connects (e.g. Shetland)
a. The proposed length of cable installed with each technique (e.g. 10 km surface laid and 5 km ploughed)
a. The proposed length of cable installed with each technique (e.g. 10 km surface laid and 5 km ploughed)
The proposed length of cable installed with each technique (e.g. 10 km surface laid and 5 km ploughed)
Economic value of fisheries crossing each section of the cable route (e.g. £150,000 per year)
Data 1. Frequency of damage to machinery (e.g. 0.01339 incidents per km per year)
2. Cost of machinery damage (e.g. £7,500 per incident)
3. Frequency of damage to vessels (e.g. 0.00893 incidents per km per year)
4. Cost of vessel damage (e.g. £1,500 per incident)
5. Frequency of incidents where fishing days are lost (e.g. 0.00893 incidents per km per year)
6. Cost of lost time (e.g. £5,214 per incident)7. Frequency of incidents where catch is lost
(e.g. 0.01786 per km per year)8. Cost of lost catch (e.g. £1,750 per incident) 9. The length of time for the assessment
period (e.g. 45 years)10. Discount rate (e.g. 3.5% for years 0–30 and
3.0% for years 31–45)
1. Fault rate for different cable installation techniques (e.g. 0.05 faults per km per year)
2. Average length of outage during faults (e.g. 0.5 MWh per fault)
3. Number of domestic, SME, and C&I users on each island (e.g. on Isle of Barra 845 domestic)
4. Value of Lost Load for domestic, SME, and C&I users (e.g. £9,888 per MW/h for domestic users)
5. The length of time for the assessment period (e.g. 45 years)
6. Discount rate (e.g. 3.5% for years 0–30 and 3.0% for years 31–45)
1. Costs of cable protection type (e.g. £10 per km per year)
2. Proportion of costs passed on to renewable generators (e.g. 50%)
3. Existing renewable capacity connecting to SHEPD grid (e.g. 1,000 MW per year)
4. Existing grid connection costs (e.g. £100 per MW per year)
5. Impact of costs on generation capacity (e.g. 1% increase in costs leads to 0.5% decrease in generation)
6. GVA per unit of renewable energy generated (e.g. £200,000 per MW per year)
7. The length of time for the assessment period (e.g. 45 years)
8. Discount rate (e.g. 3.5% for years 0–30 and 3.0% for years 31–45)
1. Costs to SHEPD of cable installation technique (e.g. £ per km)
2. Proportion of costs allocated to end users (e.g. 50%)
3. Existing average fuel bill (e.g. £500 per household per year)
4. Ratio of changes in fuel prices to changes in fuel poverty (e.g. 1:0.4)
5. Existing level of fuel poverty (e.g. 39.1%)
6. Number of SHEPD domestic customers (e.g. 683,831 households)
7. Investment required to remove a household from fuel poverty (e.g. £7,800 per household)
Database in the model contains information on:a. Time taken for cable installation for
each technique (e.g. 5 days per km)
Output Total cost of damage of snagging incidents over the operational lifetime of the submarine electricity cable
Total cost to electricity users over the operational life of the submarine electricity cable
Total cost of changes in energy production over the operational life of submarine electricity cable
Total cost of changes in fuel poverty for each submarine electricity cable installation technique
Total cost due to fishery closure over installation of submarine electricity cable
Submarine Electricity CablesCost Benefit Analysis Methodology Statement
Page 19
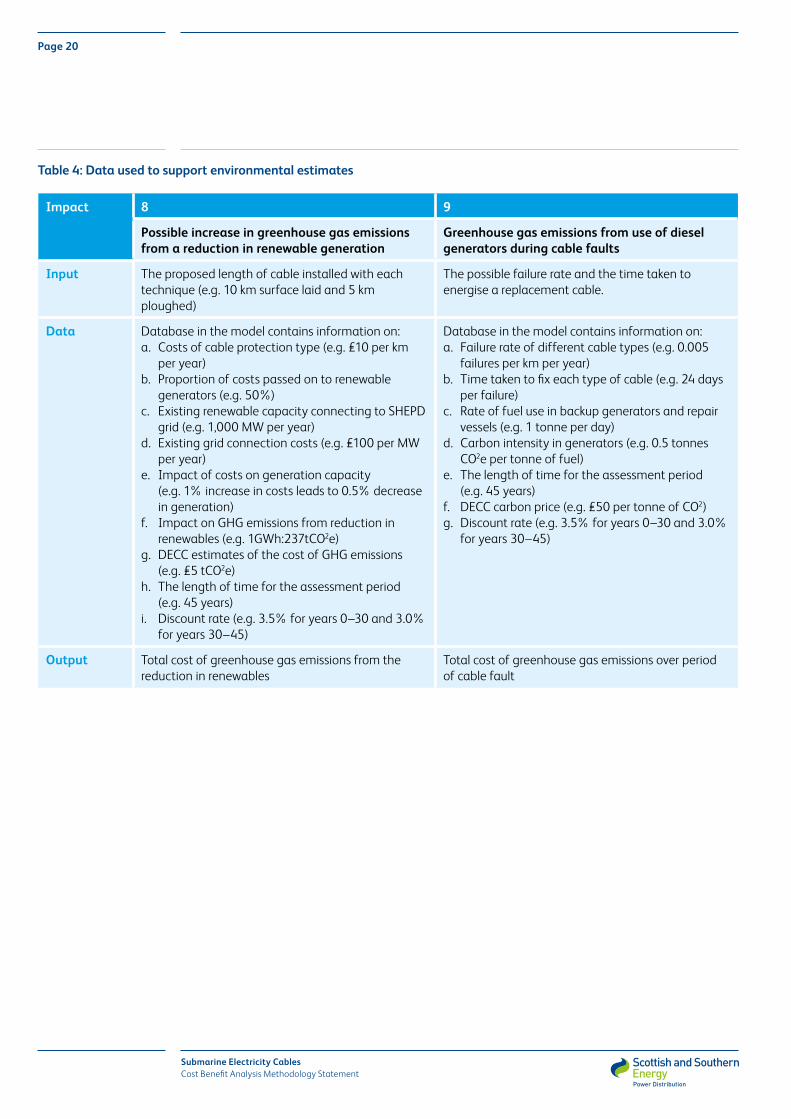
Impact 8 9
Possible increase in greenhouse gas emissions from a reduction in renewable generation
Greenhouse gas emissions from use of diesel generators during cable faults
Input The proposed length of cable installed with each technique (e.g. 10 km surface laid and 5 km ploughed)
The possible failure rate and the time taken to energise a replacement cable.
Data Database in the model contains information on:a. Costs of cable protection type (e.g. £10 per km
per year)b. Proportion of costs passed on to renewable
generators (e.g. 50%)c. Existing renewable capacity connecting to SHEPD
grid (e.g. 1,000 MW per year)d. Existing grid connection costs (e.g. £100 per MW
per year)e. Impact of costs on generation capacity
(e.g. 1% increase in costs leads to 0.5% decrease in generation)
f. Impact on GHG emissions from reduction in renewables (e.g. 1GWh:237tCO2e)
g. DECC estimates of the cost of GHG emissions (e.g. £5 tCO2e)
h. The length of time for the assessment period (e.g. 45 years)
i. Discount rate (e.g. 3.5% for years 0–30 and 3.0% for years 30–45)
Database in the model contains information on:a. Failure rate of different cable types (e.g. 0.005
failures per km per year)b. Time taken to fix each type of cable (e.g. 24 days
per failure)c. Rate of fuel use in backup generators and repair
vessels (e.g. 1 tonne per day)d. Carbon intensity in generators (e.g. 0.5 tonnes
CO2e per tonne of fuel) e. The length of time for the assessment period
(e.g. 45 years)f. DECC carbon price (e.g. £50 per tonne of CO2)g. Discount rate (e.g. 3.5% for years 0–30 and 3.0%
for years 30–45)
Output Total cost of greenhouse gas emissions from the reduction in renewables
Total cost of greenhouse gas emissions over period of cable fault
Table 4: Data used to support environmental estimates
Submarine Electricity CablesCost Benefit Analysis Methodology Statement
Page 20
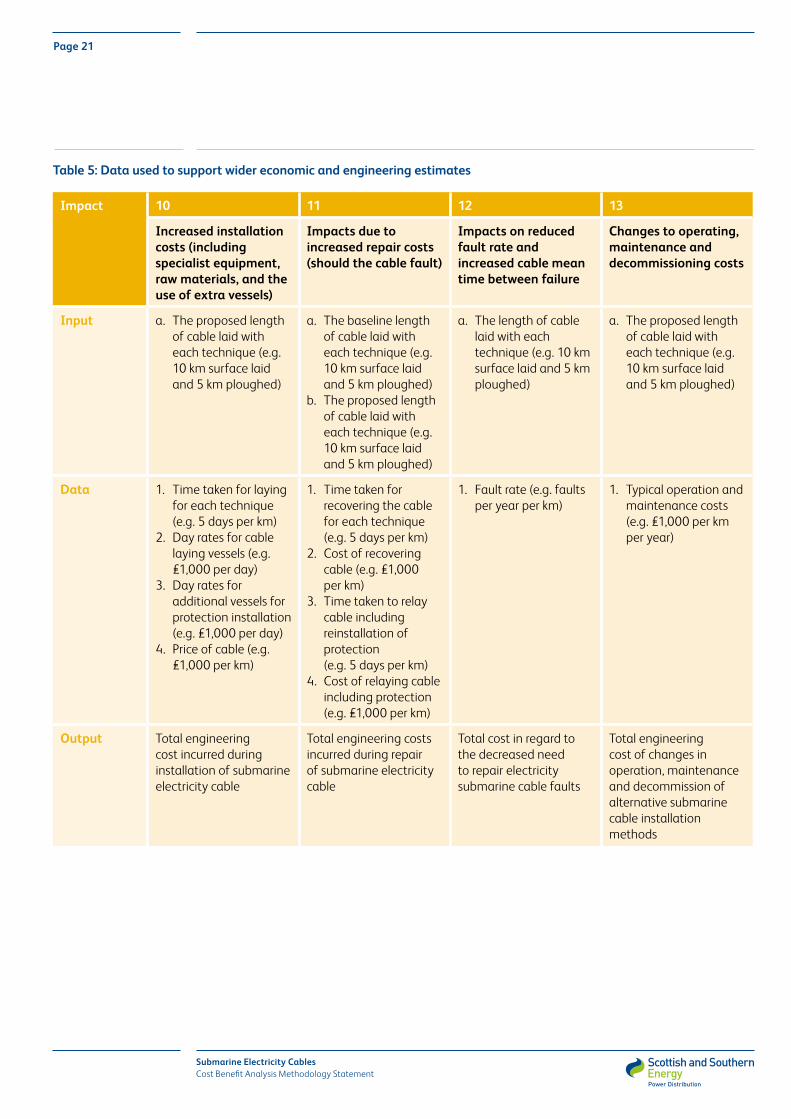
Impact 10 11 12 13
Increased installation costs (including specialist equipment, raw materials, and the use of extra vessels)
Impacts due to increased repair costs (should the cable fault)
Impacts on reduced fault rate and increased cable mean time between failure
Changes to operating, maintenance and decommissioning costs
Input a. The proposed length of cable laid with each technique (e.g. 10 km surface laid and 5 km ploughed)
a. The baseline length of cable laid with each technique (e.g. 10 km surface laid and 5 km ploughed)
b. The proposed length of cable laid with each technique (e.g. 10 km surface laid and 5 km ploughed)
a. The length of cable laid with each technique (e.g. 10 km surface laid and 5 km ploughed)
a. The proposed length of cable laid with each technique (e.g. 10 km surface laid and 5 km ploughed)
Data 1. Time taken for laying for each technique (e.g. 5 days per km)
2. Day rates for cable laying vessels (e.g. £1,000 per day)
3. Day rates for additional vessels for protection installation (e.g. £1,000 per day)
4. Price of cable (e.g. £1,000 per km)
1. Time taken for recovering the cable for each technique (e.g. 5 days per km)
2. Cost of recovering cable (e.g. £1,000 per km)
3. Time taken to relay cable including reinstallation of protection (e.g. 5 days per km)
4. Cost of relaying cable including protection (e.g. £1,000 per km)
1. Fault rate (e.g. faults per year per km)
1. Typical operation and maintenance costs (e.g. £1,000 per km per year)
Output Total engineering cost incurred during installation of submarine electricity cable
Total engineering costs incurred during repair of submarine electricity cable
Total cost in regard to the decreased need to repair electricity submarine cable faults
Total engineering cost of changes in operation, maintenance and decommission of alternative submarine cable installation methods
Table 5: Data used to support wider economic and engineering estimates
Submarine Electricity CablesCost Benefit Analysis Methodology Statement
Page 21

We are holding the following workshops which will provide participants with an opportunity to see how the methodology will be applied to a submarine electricity cable route and inform any changes to the approach.
To register to attend one of our events, please email [email protected]
Date Time Location16 December 2015
10:00 – 14:00 Station Hotel, 78 Guild St, Aberdeen, AB11 6GN
17 December 2015
10:00 – 14:00 SSE Office, 1 Waterloo Street, Glasgow, G1 6AY
21 January 2016 10:00 – 14:00 Shetland Museum & Archives, Hay’s Dock, Lerwick, ZE1 0WP
Next Steps
Page 22
Submarine Electricity CablesCost Benefit Analysis Methodology Statement

The following pre-existing data has been added to the literature review to help quantify impacts.
Ref Name Date Link
N001 McCauley, D 2006 http://www.nature.com/nature/journal/v443/n7107/full/443027a.html
Nature publication outlining the difficulty of linking the value of protecting nature and economic measures.
N002 Comhairle Nan Eilean Siar 2014 http://www.cne-siar.gov.uk/committees/documents/e-agendas/2014/06-june/environmental/agendas/K%20Item%2011B%20-%20Appendix%201%20Outer%20Hebrides%20Fuel%20Poverty%20Survey.pdf
Fuel poverty report to gain an up-to-date view on the level of fuel poverty currently in the islands and to raise awareness of fuel poverty.
N003 Marine Scotland 2015 http://www.gov.scot/Topics/marine/seamanagement/regional/activity/pentlandorkney/Consultation
Consultation website for the Pilot Pentland Firth and Orkney Waters Marine Spatial Plan. Key documents include: Consultation Draft, Sustainability Appraisal and Socio-Economic Baseline Review Consultation Draft.
N004 Friends of the Earth 2011 http://www.instituteofhealthequity.org/projects/the-health-impacts-of-cold-homes-and-fuel-poverty
Assesses the direct and indirect health impacts suffered by those living in fuel poverty and cold housing.
N005 ACE: Association for the Conservation of Energy
2015 http://www.ukace.org/2015/03/chilled-to-death-the-human-cost-of-cold-homes/
Research into the number of Excess Winter Deaths in the last five years in the UK.
N006 Marine Scotland 2010 http://www.marine.scotland.gov.uk/FEAST/
A model based tool which can be used to determine potential management requirements for Nature Conservation Marine Protected Areas.
N007 Xero Energy 2014 http://www.gov.scot/Resource/0044/00449004.pdf
A study for DECC by Xero Energy looking at the main grid access barriers connecting the Western Isles, Orkney and Shetland.
N008 ISP Review 2012 http://www.ispreview.co.uk/index.php/2012/09/bt-reveals-gbp8m-fibre-optic-broadband-link-to-orkney-and-shetland.html
Overview of the BT proposal to replace existing telecommunication infrastructure with fibre optic.
Appendix 1: Stakeholder Recommended Evidence
Submarine Electricity CablesCost Benefit Analysis Methodology Statement
Page 23

Ref Name Date Link
N009 NAFC Marine Centre 2015 http://www.nafc.uhi.ac.uk/research/msp/simsp/simsp
Fourth edition of the Shetland Island Marine Spatial Plan (SIMSP). The policy and maps in the SIMPS will be material consideration in decision-making on individual marine planning and works licences.
N010 Scottish Government 2012 www.gov.scot/resource/0039/00398798.pdf
Examines issues around the nature and measurement of fuel poverty in Scotland.
N011 Poseidon Aquatic Resource Management
2012 http://www.seafish.org/media/634910/ukfen%20ia%20best%20practice%20guidance.pdf
Guidelines based on outputs from a technical workshop organised by the UK Fisheries Economic Network.
N012 Fishing Liaison with Offshore Wind and Wet Renewables Group (FLOWW)
2015 http://www.thecrownestate.co.uk/media/501902/floww-best-practice-guidance-disruption-settlements-and-community-funds.pdf
Best practice guidance for Offshore Renewables Developments: Recommendations for Fisheries Disruption Settlements and Community Funds.
N013 Fishing Liaison with Offshore Wind and Wet Renewables Group (FLOWW)
2014 http://www.thecrownestate.co.uk/media/5693/ei-km-in-pc-fishing-012014-floww-best-practice-guidance-for-offshore-renewables-developments-recommendations-for-fisheries-liaison.pdf
Best practice guidance for Offshore Renewables Developments: Recommendations for Fisheries Liaison.
N014 Fishing Liaison with Offshore Wind and Wet Renewables Group (FLOWW)
2002 http://www.thecrownestate.co.uk/energy-and-infrastructure/offshore-wind-energy/working-with-us/floww/
Working group set up to establish good relationships between the fishing and offshore renewables energy sector and encourage co-existing of the industries.
N015 Hutchison, Z 2015 Available in hard copy only
Behavioural and physiological responses of Modiolus modiolus and Mytilus edulis to sedimentation from marine renewable energy developments
N016 Highlands and Islands Enterprise
2013 http://www.hie.co.uk/regional-information/economic-reports-and-research/archive/a-minimum-income-standard-for-remote-rural-scotland.html
Research carried out into a minimum income standard for remote rural Scotland – summary and key findings.
Submarine Electricity CablesCost Benefit Analysis Methodology Statement
Page 24

Ref Name Date Link
N017 Changeworks 2014 http://www.changeworks.org.uk/news-and-events/blog/fuel-poverty-maps-a-way-to-target-energy-efficiency-funding
Fuel poverty maps produced to assist local authorities, neighbourhood partnerships and community groups to identify areas most in need of energy efficiency improvements.
N018 Scottish Government 2015 http://www.gov.scot/Topics/Statistics/16002/News
The Scottish Household Survey 2014 presents multiple indicators of deprivation and housing conditions for each local authority.
N019 Kingfisher Information Service – Offshore Renewable and Cable Awareness Project (KIS-ORCA)
2015 http://www.kis-orca.eu/
A project which provides free cable awareness charts, electronic cable positioning lists and digital information for chart plotters on fishing vessels.
N020 Citizens Advice Bureau 2013 http://www.shetland-communities.org.uk/Downloads/CAB/Shetland%20CAB%20Fuel%20Survey%20Report%202013.pdf
Research to raise awareness of fuel usage, fuel poverty and the large number of homes which are energy inefficient in the Shetland islands.
Submarine Electricity CablesCost Benefit Analysis Methodology Statement
Page 25

For further information please contact:
Submarine Cable Cost Benefit Analysis Project Team Scottish Hydro Electric Power Distribution Inveralmond House 200 Dunkeld Road PerthPH1 3AQ
http://news.ssepd.co.uk/submarinecablesor by email at [email protected]
This document is the follow up to What you need to know – our September consultation publication, which can be downloaded at http://news.ssepd.co.uk/submarinecables/information/
Submarine Electricity CablesCost Benefit Analysis Methodology Statement