submicrometer elasticity of double-stranded dna revealed by … · direct manipulation and...
TRANSCRIPT

SC I ENCE ADVANCES | R E S EARCH ART I C L E
B IOPHYS IC S
1School of Biological Sciences and Institute for Molecular Biology and Genetics,Seoul National University, Seoul 08826, South Korea. 2Department of Physics, KoreaAdvanced Institute of Science and Technology, Daejeon 34141, South Korea.*Corresponding author. Email: [email protected] (T.-Y.Y.); [email protected] (M.J.S.)†These authors contributed equally to this work.
Shon et al., Sci. Adv. 2019;5 : eaav1697 12 June 2019
Copyright © 2019
The Authors, some
rights reserved;
exclusive licensee
American Association
for the Advancement
of Science. No claim to
originalU.S. Government
Works. Distributed
under a Creative
Commons Attribution
NonCommercial
License 4.0 (CC BY-NC).
Dow
n
Submicrometer elasticity of double-stranded DNArevealed by precision force-extension measurementswith magnetic tweezersMin Ju Shon1*†, Sang-Hyun Rah2†, Tae-Young Yoon1,2*
Submicrometer elasticity of double-stranded DNA (dsDNA) governs nanoscale bending of DNA segments andtheir interactions with proteins. Single-molecule force spectroscopy, including magnetic tweezers (MTs), is animportant tool for studying DNA mechanics. However, its application to short DNAs under 1 mm is limited. We de-veloped an MT-based method for precise force-extension measurements in the 100-nm regime that enables in situcorrection of the error in DNA extension measurement, and normalizes the force variability across beads byexploiting DNA hairpins. The method reduces the lower limit of tractable dsDNA length down to 198 base pairs(bp) (67 nm), an order-of-magnitude improvement compared to conventional tweezing experiments. Applyingthis method and the finite worm-like chain model we observed an essentially constant persistence length across thechain lengths studied (198 bp to 10 kbp), which steeply depended on GC content and methylation. This findingsuggests a potential sequence-dependent mechanism for short-DNA elasticity.
load
on April 22, 2020http://advances.sciencem
ag.org/ed from
INTRODUCTIONBending of short double-stranded DNA (dsDNA) represents a criticalstep in many processes within cells including regulation of transcrip-tion, chromatin remodeling, and packaging of genome (1). Suchbending depends on the intrinsic elasticity of DNA as well as addi-tional modulation by DNA binding proteins. The lengths of thedsDNA segments under elastic deformations can be as short as theirwell-accepted persistence length, ~50 nm or ~150 base pairs (bp)(2, 3), thereby incurring a substantial energy cost in bending. Thus,it has been questioned how such an energetically demanding pro-cess occurs and howmuch the native, protein-independent flexibil-ity of DNA contributes to the steep curves of dsDNA observed incells. Consequently, the nanomechanical properties of short dsDNAhave been the subject of extensive theoretical and experimental investi-gations (1).
Traditionally, elasticity of DNA has been studied by diverse ap-proaches including cyclization assays, optical methods, and single-molecule techniques [reviewed in (1, 2)]. Clever designs that canenforce high curvatures in DNA have also been devised (4–6). Virtu-ally, all of the results to date support the classical worm-like chain(WLC) model for long dsDNA molecules, which treats a chain ofDNA as an elastic rod with a harmonic bending potential. In contrast,many of the previous studies have observed that the elastic responseof a short DNAmolecule deviates from the WLC prediction when itscontour length is below 1 mm (7–12). The complications with shortdsDNAs are both theoretical and experimental: (i) The WLC modelpresuming a sufficiently long chain breaks down because of the finitechain length (9). (ii) The mechanical measurements on DNA be-come increasingly challenging as the molecular extension reachesthe nanoscale length regime.
Direct manipulation and observation of DNA became possibleby single-molecule force spectroscopy (SMFS) techniques such as
magnetic tweezers (MTs), optical tweezers, and atomic force mi-croscopy (3, 13, 14). Application of force in SMFS setups stretchesDNA and provides a wealth of information inaccessible from spon-taneous bending. For example, profiling force-extension curves(FECs) with SMFS is one of the most direct methods to probethe elasticity of nucleic acids. In this method, a stretching forceis applied to the ends of a molecule via a microsphere, or “bead,”tethered to the molecule. The resulting force-induced extension ofthe molecule is recorded from the changes in bead position. TheFECs thus generated allow straightforward tests of various poly-mer models (14).
Despite the tremendous contributions of SMFS to the under-standing of nucleic acid elasticity, different SMFS methods havetheir own limitations in their applications to submicrometer DNAs.First, atomic force microscopes use large and stiff cantilevers, notwell suited to the nanometer- and piconewton-regime force-extension measurements on short DNAs. Optical tweezers providea high sensitivity and spatiotemporal resolution, but their standardhorizontal-pulling geometry suffers from the steric hindrance be-tween a pulling bead and the glass surface, especially when usingshort tethers. In addition, the orientation of the tether changes con-siderably during the horizontal pulling, requiring substantial geo-metric corrections in calculating tether extension. While dual-trap(15, 16) or axial optical tweezers (10) are largely free from theseproblems associated with pulling configuration, the measure-ment becomes particularly challenging as the length of the pulledDNA approaches the optical diffraction limit due to the difficultiesin maintaining constant force and avoiding optical interference be-tween trapping lasers.
MTs offer several advantages in monitoring the force-extensionrelation of short DNA molecules, such as a wide range of force levelsgenerated bymagnetic beads (sub-piconewtons to several tens of pico-newtons), subnanometer precision in extension tracking, naturaloperation in constant-force mode, and simple instrumentation. Still,there are two major hurdles that have long hindered its application toshort DNA molecules. First, standard magnetic beads used in MTscontain magnetic nanoparticles that are anisotropic and nonuniformlydistributed. Under an external magnetic field, a magnetic bead favors
1 of 12

SC I ENCE ADVANCES | R E S EARCH ART I C L E
on April 22, 2020
http://advances.sciencemag.org/
Dow
nloaded from
the alignment of its overall anisotropy axis with the applied field andthus experiences a rotational torque in addition to the pulling force tomake an “off-axis”movement (17). This off-axis movement leads to anappreciable error in themeasurement ofmolecular extensions, especial-ly for short DNA tethers (18, 19). In addition, the estimation of appliedmagnetic force based on thermal fluctuations of a tethered bead be-comes susceptible to many errors due to the short tether length andproximity of the bead to a surface (20, 21). Collectively, these inaccura-cies affect the determinations of both force and extension in FECs, cor-rupting the intrinsic response of a short DNA tether. Furthermore,these two types of inaccuracies substantially vary across individualbeads, rendering statistical analysis of pooled results problematic. Al-though there have been a few cases that interrogated short moleculeswith specialized schemes (10, 16, 20), a simple and generalizablemethod that allows nanomechanical measurements on short DNAwith MTs is still lacking.
Here, we introduce a simple MT-based scheme that enables accu-rate profiling of FECs for short DNA, addressing two experimentalchallenges described above. First, we correct the force-dependentunderestimation of extension resulting from the off-axis movementsofmagnetic beads (18, 19). The actualmolecular extension is efficient-ly restored by considering the orientation and lateral displacement of amagnetic bead as functions of magnetic force. Next, a DNA hairpin isused as a force gauge to normalize the applied forces in multiplemagnetic beads. We place the hairpin in a tether DNA and measurethe force to unzip the identical hairpins in different bead-DNAconstructs. This procedure yields force scaling factors for singlemagnetic beads. Rescaling the force axes of individual FECs withthe scalers further homogenizes the FECs collected from multipleconstructs, completing a two-step correction scheme.
Applying the developed method, we determined FECs of shortdsDNA molecules down to 198 bp. In particular, application of thefinite WLC (FWLC) model (9) to our FEC data yielded an essentiallyconstant persistence length of ~50 nm in the entire contour lengthregion from 10 kbp to 198 bp, confirming the invariability of thepersistence length as an intrinsic material parameter of dsDNA. Ourresult also indicated extension of the experimental and theoreticallimit in examining the dsDNA elasticity down to 198 bp. Last, westudied how the sequence contents of short DNA segments affectedtheir elastic behavior. We observed a remarkable degree of sequence-dependent elasticity such that the persistence length of 500-bp dsDNAincreased by 1.5-fold when the GC content doubled from 30 to 64%.In addition, this stiffening with increased GC base pairings completelydisappeared upon CpG methylation. These results might imply thepresence of “mechanical code” governing the nanomechanics of ge-nomic DNA.
RESULTSDistortion of short-DNA FECs in MTs by off-axis movementsof magnetic beadsWe first wanted to determine how correctly a standard FECmeasure-ment in MTs probes the submicrometer elasticity of a short DNAtether. To this end, we synthesized a dsDNA construct that is roughly1 kbp long with a contour length of ~350 nm (Fig. 1A, inset, andfig. S1A). This design contained a short hairpin structure in the middleused for the force calibration in each construct (see fig. S2 and note S1for detailed effects of the hairpin on the mechanical parameters ofdsDNA). We attached one end of the DNA to a glass surface and the
Shon et al., Sci. Adv. 2019;5 : eaav1697 12 June 2019
other to a 1.4-mm-radiusmagnetic bead for themanipulationwithMTs.In our MT setup (22), a pair of magnets above the sample generatedupward magnetic forces in the range of 0 to 20 pN. To obtain FECs,we subjected bead-DNA constructs to a series of gentle force ramps(1 to 3 pN/s) while continuously tracking the bead positions at 100 Hzin all three dimensions.
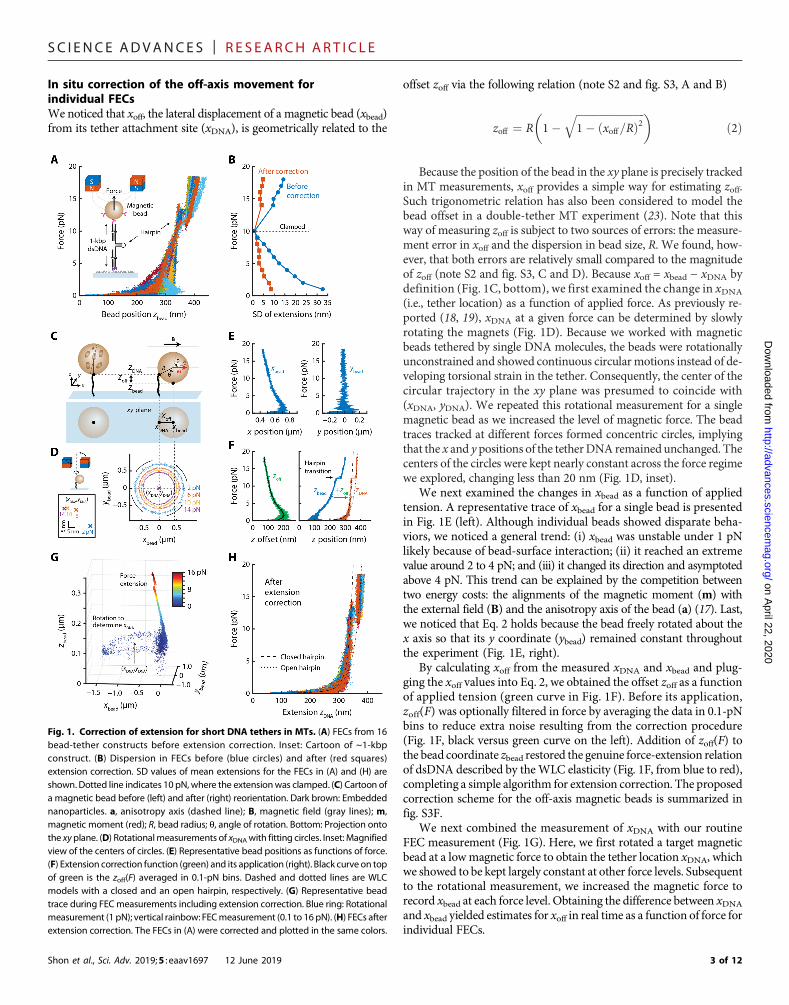
To elucidate the force-extension behavior of the 1-kbp DNA con-struct, we collected FECs from multiple tethered beads. The presenceof hairpin in our design yielded a unique ~30-nm transition signaturearound 13 pN (Fig. 1A), which we used to verify the sample identity.For simplicity, we aligned all the FECs so that their extensions at 10 pNcoincided with one another. In this collection, we noticed a substantialheterogeneity in the resulting distribution of force-extension datathroughout the force range we studied (Fig. 1A). For example, themean extension values from two FECs often differed by more than100 nmunder 5 pN (Fig. 1A, for example, cyan versus blue). To quan-titatively address this heterogeneity, we calculated the SDs of themeanextensions at discrete force levels (Fig. 1B, blue circles). The deviationswere greater than 10 nm across the force regime that we explored andwere more pronounced in the low-force regime, exceeding 30 nm at1 pN. These deviation values underestimated the actual extent of dis-persion because we artificially clamped the extensions at 10 pN forcomparison. Overall, these results showed that the heterogeneities ofFECs notably confounded the interpretation of genuine elastic re-sponses of 1-kbp dsDNAs.
Because the high heterogeneity in FECs was unlikely due to theDNA mechanics itself, we hypothesized that this behavior would, atleast in part, arise from the off-axis movements of magnetic beadsrelative to their tethers (Fig. 1C) (18, 19). Therefore, we sought to ex-tract the true extension of a tether through a geometric considerationof the off-axis movement. During sample preparation for MTs, oneend of a DNA molecule is attached to the surface of a magnetic beadat a random location, which we define as (xDNA, yDNA, zDNA) (Fig. 1C,left). Independently of this attachment point, the magnetic bead bearsan intrinsic anisotropy axis (referred to as a, brown dashed line inFig. 1C) that is determined by the magnetic anisotropies of the em-bedded nanoparticles (17). When subjected to an external magneticfield B (along the x axis), the bead develops a magnetization,m, thedirection of which energetically balances its alignment with both aand B (17, 18). Subsequently, the magnetic bead is rotated by an angleq until m is fully aligned with B (Fig. 1C, from left to right). The zposition of the bead (zbead) then deviates from the end of DNA (zDNA)by an offset zoff
zoff ¼ zDNA � zbead ¼ R� Rcosq ð1Þ
where R is the bead radius. That is, this off-axis rotation leads to anunderestimation of the DNA extension by zoff. a is generally slightlytilted from B, implying that the rotation angle q and the resulting zoffare not constant but continuously change in response to varying forcelevels (18). In addition, zoff can show complicated behavior that variesacross individual beads (19). Given the micrometer size of the beads,the offset zoff can be comparable to the length of short DNA tethers,suggesting that this underestimation must be corrected whendetermining the precise elastic properties of short DNAs. Becausethe measurements in MTs rely on tracking bead images, not theDNA itself, and the values for zoff and zDNA are not readily available,a method to determine zDNA and estimate zoff, preferably in real timeduring bead tracking, is needed.
2 of 12
SC I ENCE ADVANCES | R E S EARCH ART I C L E
In situ correction of the off-axis movement forindividual FECsWe noticed that xoff, the lateral displacement of a magnetic bead (xbead)from its tether attachment site (xDNA), is geometrically related to the
Shon et al., Sci. Adv. 2019;5 : eaav1697 12 June 2019
on April 22, 2020
http://advances.sciencemag.org/
Dow
nloaded from
offset zoff via the following relation (note S2 and fig. S3, A and B)
zoff ¼ R 1�ffiffiffiffiffiffiffiffiffiffiffiffiffiffiffiffiffiffiffiffiffiffiffiffiffiffi1� ðxoff=RÞ2
q� �ð2Þ
Because the position of the bead in the xy plane is precisely trackedin MT measurements, xoff provides a simple way for estimating zoff.Such trigonometric relation has also been considered to model thebead offset in a double-tether MT experiment (23). Note that thisway of measuring zoff is subject to two sources of errors: the measure-ment error in xoff and the dispersion in bead size, R. We found, how-ever, that both errors are relatively small compared to the magnitudeof zoff (note S2 and fig. S3, C and D). Because xoff = xbead − xDNA bydefinition (Fig. 1C, bottom), we first examined the change in xDNA
(i.e., tether location) as a function of applied force. As previously re-ported (18, 19), xDNA at a given force can be determined by slowlyrotating the magnets (Fig. 1D). Because we worked with magneticbeads tethered by single DNA molecules, the beads were rotationallyunconstrained and showed continuous circular motions instead of de-veloping torsional strain in the tether. Consequently, the center of thecircular trajectory in the xy plane was presumed to coincide with(xDNA, yDNA). We repeated this rotational measurement for a singlemagnetic bead as we increased the level of magnetic force. The beadtraces tracked at different forces formed concentric circles, implyingthat the x and y positions of the tetherDNA remained unchanged. Thecenters of the circles were kept nearly constant across the force regimewe explored, changing less than 20 nm (Fig. 1D, inset).
We next examined the changes in xbead as a function of appliedtension. A representative trace of xbead for a single bead is presentedin Fig. 1E (left). Although individual beads showed disparate beha-viors, we noticed a general trend: (i) xbead was unstable under 1 pNlikely because of bead-surface interaction; (ii) it reached an extremevalue around 2 to 4 pN; and (iii) it changed its direction and asymptotedabove 4 pN. This trend can be explained by the competition betweentwo energy costs: the alignments of the magnetic moment (m) withthe external field (B) and the anisotropy axis of the bead (a) (17). Last,we noticed that Eq. 2 holds because the bead freely rotated about thex axis so that its y coordinate (ybead) remained constant throughoutthe experiment (Fig. 1E, right).
By calculating xoff from the measured xDNA and xbead and plug-ging the xoff values into Eq. 2, we obtained the offset zoff as a functionof applied tension (green curve in Fig. 1F). Before its application,zoff(F) was optionally filtered in force by averaging the data in 0.1-pNbins to reduce extra noise resulting from the correction procedure(Fig. 1F, black versus green curve on the left). Addition of zoff(F) tothe bead coordinate zbead restored the genuine force-extension relationof dsDNA described by theWLC elasticity (Fig. 1F, from blue to red),completing a simple algorithm for extension correction. The proposedcorrection scheme for the off-axis magnetic beads is summarized infig. S3F.
We next combined the measurement of xDNA with our routineFEC measurement (Fig. 1G). Here, we first rotated a target magneticbead at a lowmagnetic force to obtain the tether location xDNA, whichwe showed to be kept largely constant at other force levels. Subsequentto the rotational measurement, we increased the magnetic force torecord xbead at each force level. Obtaining the difference between xDNAand xbead yielded estimates for xoff in real time as a function of force forindividual FECs.
Fig. 1. Correction of extension for short DNA tethers in MTs. (A) FECs from 16bead-tether constructs before extension correction. Inset: Cartoon of ~1-kbpconstruct. (B) Dispersion in FECs before (blue circles) and after (red squares)extension correction. SD values of mean extensions for the FECs in (A) and (H) areshown. Dotted line indicates 10 pN, where the extensionwas clamped. (C) Cartoon ofa magnetic bead before (left) and after (right) reorientation. Dark brown: Embeddednanoparticles. a, anisotropy axis (dashed line); B, magnetic field (gray lines); m,magnetic moment (red); R, bead radius; q, angle of rotation. Bottom: Projection ontothe xyplane. (D) Rotationalmeasurements of xDNAwith fitting circles. Inset:Magnifiedview of the centers of circles. (E) Representative bead positions as functions of force.(F) Extension correction function (green) and its application (right). Black curve on topof green is the zoff(F) averaged in 0.1-pN bins. Dashed and dotted lines are WLCmodels with a closed and an open hairpin, respectively. (G) Representative beadtrace during FECmeasurements including extension correction. Blue ring: Rotationalmeasurement (1 pN); vertical rainbow: FECmeasurement (0.1 to 16 pN). (H) FECs afterextension correction. The FECs in (A) were corrected and plotted in the same colors.
3 of 12
SC I ENCE ADVANCES | R E S EARCH ART I C L E
on April 22, 2020
http://advances.sciencemag.org/
Dow
nloaded from
Last, we sought to see how much of the observed heterogeneity inFECs (Fig. 1, A and B) was resolved by reflecting the measured zoff.When we corrected individual FECs with the corresponding zofftraces, the heterogeneity of FECs was dramatically reduced (Fig. 1H).The effect of the correction appeared in two force regimes. Under 5 pN,where the entropic stretching of DNAdominates the shape of FECs, theirregularities in extension due to the bead rotation, often leading to dis-continuous changes or even a decrease in extension (cyan in Fig. 1A),were rectified. In the enthalpic stretching regime above 10 pN, the cor-rection scheme adjusted the force-dependent increase in extension andbrought the apparent slopes of multiple FECs in agreement with eachother. This trend was confirmed by comparing the SDs in extensionbefore and after the extension correction (Fig. 1B, from blue to redsymbols).Overall, the correctionprocedure homogenized all FECs fromdifferent bead-tether constructs so that all results conform to a singleWLC model (dashed and dotted lines in Fig. 1H).
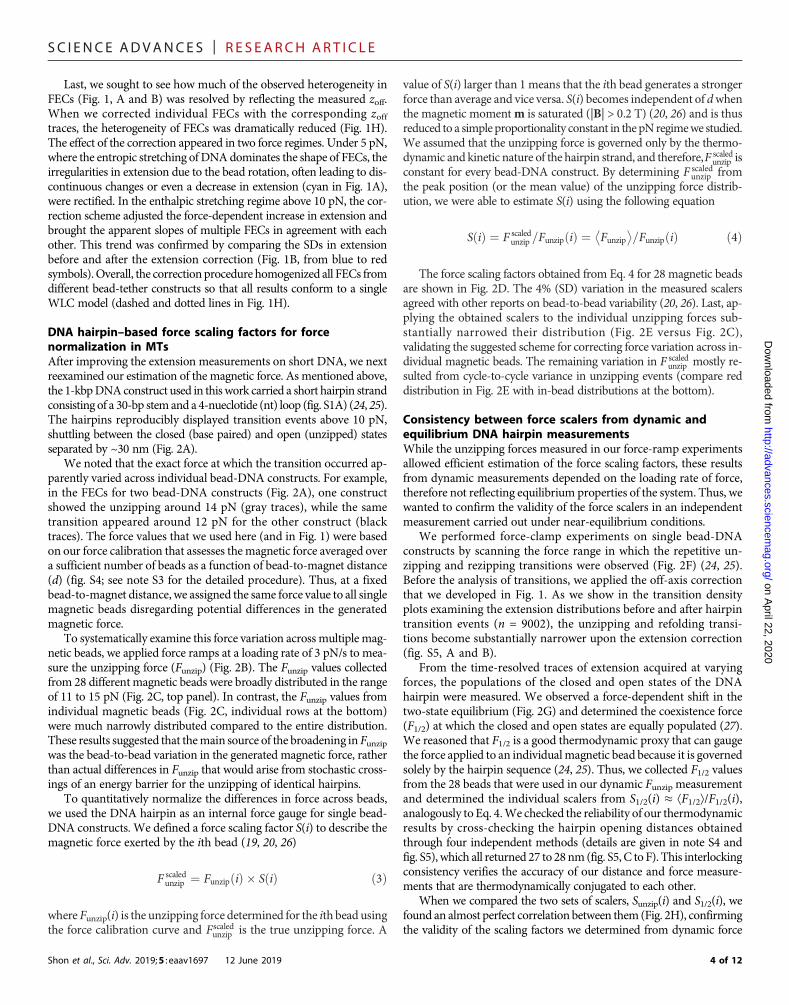
DNA hairpin–based force scaling factors for forcenormalization in MTsAfter improving the extension measurements on short DNA, we nextreexamined our estimation of the magnetic force. As mentioned above,the 1-kbpDNAconstruct used in thiswork carried a short hairpin strandconsisting of a 30-bp stemand a 4-nueclotide (nt) loop (fig. S1A) (24, 25).The hairpins reproducibly displayed transition events above 10 pN,shuttling between the closed (base paired) and open (unzipped) statesseparated by ~30 nm (Fig. 2A).
We noted that the exact force at which the transition occurred ap-parently varied across individual bead-DNA constructs. For example,in the FECs for two bead-DNA constructs (Fig. 2A), one constructshowed the unzipping around 14 pN (gray traces), while the sametransition appeared around 12 pN for the other construct (blacktraces). The force values that we used here (and in Fig. 1) were basedon our force calibration that assesses the magnetic force averaged overa sufficient number of beads as a function of bead-to-magnet distance(d) (fig. S4; see note S3 for the detailed procedure). Thus, at a fixedbead-to-magnet distance, we assigned the same force value to all singlemagnetic beads disregarding potential differences in the generatedmagnetic force.
To systematically examine this force variation across multiple mag-netic beads, we applied force ramps at a loading rate of 3 pN/s to mea-sure the unzipping force (Funzip) (Fig. 2B). The Funzip values collectedfrom 28 differentmagnetic beads were broadly distributed in the rangeof 11 to 15 pN (Fig. 2C, top panel). In contrast, the Funzip values fromindividual magnetic beads (Fig. 2C, individual rows at the bottom)were much narrowly distributed compared to the entire distribution.These results suggested that themain source of the broadening inFunzipwas the bead-to-bead variation in the generated magnetic force, ratherthan actual differences in Funzip that would arise from stochastic cross-ings of an energy barrier for the unzipping of identical hairpins.
To quantitatively normalize the differences in force across beads,we used the DNA hairpin as an internal force gauge for single bead-DNA constructs. We defined a force scaling factor S(i) to describe themagnetic force exerted by the ith bead (19, 20, 26)
F scaledunzip ¼ FunzipðiÞ � SðiÞ ð3Þ
where Funzip(i) is the unzipping force determined for the ith bead usingthe force calibration curve and Fscaled
unzip is the true unzipping force. A
Shon et al., Sci. Adv. 2019;5 : eaav1697 12 June 2019
value of S(i) larger than 1 means that the ith bead generates a strongerforce than average and vice versa. S(i) becomes independent of dwhenthe magnetic momentm is saturated (|B| > 0.2 T) (20, 26) and is thusreduced to a simpleproportionality constant in the pNregimewe studied.We assumed that the unzipping force is governed only by the thermo-dynamic and kinetic nature of the hairpin strand, and therefore,F scaled
unzip isconstant for every bead-DNA construct. By determining F scaled
unzip fromthe peak position (or the mean value) of the unzipping force distrib-ution, we were able to estimate S(i) using the following equation
SðiÞ ¼ F scaledunzip =FunzipðiÞ ¼ Funzip
� �=FunzipðiÞ ð4Þ
The force scaling factors obtained from Eq. 4 for 28 magnetic beadsare shown in Fig. 2D. The 4% (SD) variation in the measured scalersagreed with other reports on bead-to-bead variability (20, 26). Last, ap-plying the obtained scalers to the individual unzipping forces sub-stantially narrowed their distribution (Fig. 2E versus Fig. 2C),validating the suggested scheme for correcting force variation across in-dividual magnetic beads. The remaining variation in F scaled
unzip mostly re-sulted from cycle-to-cycle variance in unzipping events (compare reddistribution in Fig. 2E with in-bead distributions at the bottom).
Consistency between force scalers from dynamic andequilibrium DNA hairpin measurementsWhile the unzipping forces measured in our force-ramp experimentsallowed efficient estimation of the force scaling factors, these resultsfrom dynamic measurements depended on the loading rate of force,therefore not reflecting equilibrium properties of the system. Thus, wewanted to confirm the validity of the force scalers in an independentmeasurement carried out under near-equilibrium conditions.
We performed force-clamp experiments on single bead-DNAconstructs by scanning the force range in which the repetitive un-zipping and rezipping transitions were observed (Fig. 2F) (24, 25).Before the analysis of transitions, we applied the off-axis correctionthat we developed in Fig. 1. As we show in the transition densityplots examining the extension distributions before and after hairpintransition events (n = 9002), the unzipping and refolding transi-tions become substantially narrower upon the extension correction(fig. S5, A and B).
From the time-resolved traces of extension acquired at varyingforces, the populations of the closed and open states of the DNAhairpin were measured. We observed a force-dependent shift in thetwo-state equilibrium (Fig. 2G) and determined the coexistence force(F1/2) at which the closed and open states are equally populated (27).We reasoned that F1/2 is a good thermodynamic proxy that can gaugethe force applied to an individualmagnetic bead because it is governedsolely by the hairpin sequence (24, 25). Thus, we collected F1/2 valuesfrom the 28 beads that were used in our dynamic Funzip measurementand determined the individual scalers from S1/2(i) ≈ ⟨F1/2⟩/F1/2(i),analogously to Eq. 4.We checked the reliability of our thermodynamicresults by cross-checking the hairpin opening distances obtainedthrough four independent methods (details are given in note S4 andfig. S5), which all returned 27 to 28 nm (fig. S5, C to F). This interlockingconsistency verifies the accuracy of our distance and force measure-ments that are thermodynamically conjugated to each other.
When we compared the two sets of scalers, Sunzip(i) and S1/2(i), wefound an almost perfect correlation between them (Fig. 2H), confirmingthe validity of the scaling factors we determined from dynamic force
4 of 12

SC I ENCE ADVANCES | R E S EARCH ART I C L E
on April 22, 2020
http://advances.sciencemag.org/
Dow
nloaded from
measurements. Because reliable determination of F1/2 took longerthan 10 min for each bead, we mainly used the dynamic measure-ment of Funzip (<1 min per bead) and resultant Sunzip(i) unless other-wise noted.
We finally asked how the force scalers acquired from our methodcompare with those obtained from direct forcemeasurements. To thisend, we attempted to measure forces in the bead-tether constructs di-rectly through the analysis of the power spectral density (PSD) (fig. S6),despite the difficulties with short tethers in force estimation (see note S3for the detailed methods and discussion). A representative PSD for theBrownian motion of a bead perpendicular to the magnetic field (long-pendulum geometry or y axis) is shown in fig. S6A with its fit to acoupled-fluctuation model (21). In the fitting procedure, relevant cor-rections for near-surface drag (fig. S7) and image blurring and aliasingwere applied (28, 29), and the force (FPSD) was treated as the onlyadjustable parameter (see eqs. S8 to S14 in note S3) (21). The forcescaler SPSD(i) was then obtained by comparing F at d with the mea-sured force FPSD
SPSDðiÞ ¼ FPSDðd; iÞ=Fðd; iÞ ð5Þ
Shon et al., Sci. Adv. 2019;5 : eaav1697 12 June 2019
in an analogous manner to Eq. 4. A scatter plot for the two series ofscalers [S1/2(i) and SPSD(i)] shows a decent positive correlation (fig. S6B),reassuring the validity of our hairpin-based force scaling.We suspect thatthe small discrepancy between the two estimatesmostly resulted from theinaccuracy in FPSD due to the extensive corrections.
Two-step correction homogenizes short-DNA FECsEquipped with the two-step correction schemes for our extension andforce measurements developed above, we attempted to analyze FECsfor 1-kbp dsDNA. We found that the hairpin positioned in the middleof 1-kbp dsDNA led to FECs with slightly shorter extension valuesthan anticipated (fig. S2), which can be explained by the hairpin ef-fectively dividing a DNA tether into two smaller halves (note S1 andfig. S2). Such a location-dependent effect of a defect in DNA has beendescribed before (30).We thusmoved the hairpin to the fixed boundary[i.e., the polyethylene glycol (PEG)–coated surface] to minimize thisrandomizing effect (Fig. 3A), which gave FECs with larger extensionvalues for the 1-kbp dsDNA (fig. S2).
We collected FECswith this new pulling construct.With the schemedescribed in Fig. 1, we then corrected the underestimated extension ofDNA due to the off-axis movement. This off-axis correction markedly
Fig. 2. Variability in magnetic force and its normalization using DNA hairpin. (A) Representative FECs from two bead-tether constructs featuring hairpin unzippingevents. Gray and black curves represent the beads generating smaller- and larger-than-average forces, respectively. Arrows: Magnet distances at which hairpin unzip-ping occurred. Dotted line indicates unzipping forces averaged over multiple beads. (B) Determination of hairpin unzipping force (Funzip) in dynamic force measure-ments. Transitions (blue dotted lines) detected in three cycles of increasing force ramps are shown. (C to E) Distributions of hairpin unzipping forces before (C) and after(E) force scaling measured from 24 bead-tether constructs with the corresponding force scaling factors (D). Errors in (D) represent SD over 24 constructs. (F) Hairpinunzipping/refolding transitions observed in force-clamp experiments. Dotted lines mark the locations of closed and open states. The corresponding distributions ofextension are shown on the right. (G) Force-dependent change in open-state population of the hairpin. Red dashed line is a fit to the Boltzmann relation (24, 27). Dottedlines indicate the determination of coexistence force (F1/2). (H) Correlation between Funzip-based (left axis) and F1/2-based (bottom axis) force scalers and between theircorresponding forces (right and top axes). The diagonal indicates a perfect correlation.
5 of 12

SC I ENCE ADVANCES | R E S EARCH ART I C L E
http://advaD
ownloaded from
homogenized all the FECs collected from the 24 constructs (Fig. 3, Band C). Next, we applied the force scaling factor to normalize the forcevariation across individual magnetic beads. As described in Fig. 2, werescaled the force level (F) by the obtained scalers (Sunzip) for eachmagnetic bead. This adjustment pinched the force window in whichthe hairpin transitions occurred, thereby further homogenizing theFECs (Fig. 3, C and D).
We finally applied the standard WLC model to the correctedFECs to obtain the effective persistence length LWLC
p for the 1-kbpconstruct (see note S5 for the procedure). We first fitted the FECsfrom each construct individually to respective inextensibleWLCmodels(3, 31, 32), using the data under 8 pN. The distribution of the result-ing LWLC
p values became considerably narrower after the correction(Fig. 3E, green versus blue), centered around ~40 nm. Then, we at-tempted to fit all the FECs collected from multiple constructs to asingle WLC model, and all data were successfully described by aglobal fit sharing a common LWLC
p (Fig. 3F). The fit was improvedthroughout the entire force range. For example, the root mean squareerror (RMSE) at 1 pN in Fig. 3G decreased from 39 to 16 nm uponcorrection (fig. S8).
TheLWLCp after full correctionwas 38.6 ± 1.4 nm [with 135mMNaCl
in 5mMphosphate buffer, pH 7.4; error is 95% confidence interval (CI)of the fit], close to consensus values that range from 44 to 55 nmaccepted for the persistence length value of dsDNA (2, 3). Furthermore,we obtained a stretch modulus of 500 ± 100 pN (error, 95% CI) by in-cluding the data up to 16 pN and fitting them to an extensible WLCequation (Fig. 3F, inset on the right).
Shon et al., Sci. Adv. 2019;5 : eaav1697 12 June 2019
Constant persistence length of dsDNA measured downto 198 bpAfter validating the developed scheme for FEC correction, we nextapplied this method to the investigation of the submicrometer elas-ticity of dsDNA. To this end, we first prepared dsDNA fragments ofvarying lengths (198 bp to 10 kbp) via polymerase chain reaction (PCR)using l DNA as a template. To minimize sequence dependence, wechose target sequences such that their GC contents were close to 50%with no known intrinsically curved motifs present (table S1). As de-scribed above, the hairpin strand for force correction was placed atthe bottom of the pulling construct. This design also simplified the syn-thesis of hairpin-containing tether because the construct could beprepared in a single PCR step using a primer with a preformed hairpinmotif, instead of ligatingmultiple pieces of DNA. For all constructs withvarying contour lengths, the hairpin structures were identical (fig. S1B).
We measured FECs for the prepared constructs in force-ramp ex-periments (Fig. 4A). We applied the two-step corrections to individualFECs. With short DNA tethers, it is typically difficult to distinguishproper bead-tether constructs from spurious ones or nonspecificallybound beads. The hairpin in the DNA construct left a clear fingerprintin FECs, which allowed us to distinguish genuine DNA-tethered beads,even for the dsDNA as short as 198 bp.
To analyze the length-dependent elasticity, we first normalized allFECs to the respective contour lengths of the tethers (Fig. 4B). In thenormalized FECs, we found that the molecules longer than 1 kbp werenearly identical to each other in their elastic behavior (green, blue, pur-ple, and black curves in Fig. 4B). However, the shortest 198-bp chain
on April 22, 2020
nces.sciencemag.org/
Fig. 3. Application of force-extension correction method on 1-kbp construct. (A) Schematic of a 1-kbp construct with a force-calibrating hairpin at the end of thetether. (B to D) FECs from multiple constructs before correction (B), after extension correction (C), and after full correction including force scaling (D). Insets: Close-upviews of the same curves. FECs from the same constructs are shown in matching colors across (B) to (D). (E) Box plots for individual WLC persistence lengths obtainedbefore (B) and after (D) two-step correction (box, interquartile range; central mark, median; whiskers, the most extreme values are not considered outliers). (F) Heat maprepresentations of the FECs in (B) to (D). Magenta dashed and dotted lines are inextensible WLC models with a closed and an open hairpin, respectively. Inset: Close-upview of the data after scaling (white box in the right panel). Black lines in the inset: Extensible WLC models. All results in this figure were obtained from 24 bead-tetherconstructs with 1-kbp tethers.
6 of 12

SC I ENCE ADVANCES | R E S EARCH ART I C L E
http://advances.sD
ownloaded from
exhibited a marked deviation from the longer DNA tethers, whereits extension below 10 pN was appreciably shifted to the reducedvalues (red curve in Fig. 4B). For a closer inspection, the distribu-tions of extensions at 1 pN for the prepared constructs are shownin Fig. 4C. The centers of the distributions gradually shifted to lowerextension values as the tether length decreased, with the intermediate510-bp tether (orange) forming a distribution between the twolimiting cases (red versus green/blue/purple). Note that the differentsizes of hairpin transition in the normalized FECs (black arrowin Fig. 4B) resulted from the same unzipping distances of hairpin(~25 nm) normalized to the different tether lengths, so they werenot associated with the tether elasticity. Likewise, the apparently largernoise with the 198-bp construct (red curve in Fig. 4B) also resultedfrom the division of similar magnitude of fluctuation (fig. S9A) bythe short tether length.
Next, we fitted standard WLC models to the force-extension data,as shown for the representative 1-kbp construct in Fig. 4D (red curve;see fig. S10 for all results).We found that the persistence length obtainedwith the standardWLCmodel,LWLC
p , decreased substantially as the con-tour length Lc shortened, reaching 13.9 ± 1.1 nm (error, 95% CI) withthe 198-bp construct despite the fair quality in all fittings (blue circles inFig. 4E and table S1). Thus, our precise measurement of FECs of shortDNAs reproduced the previous observations that the standard WLCmodel estimates increasingly shorter persistence lengths as the contourlength of the dsDNA becomes smaller than 1 kbp (9).
We next wondered whether it is valid to apply the standard WLCmodel to short DNA constructs examined here (e.g., 67 and 173 nm),which are comparable to or only three times longer than the persist-ence length assumed for infinitely long dsDNA (i.e., 40 to 50 nm). We
Shon et al., Sci. Adv. 2019;5 : eaav1697 12 June 2019
thus used the FWLC model that considers (i) a finite length of thechain, (ii) boundary conditions at the ends of the finite chain, and(iii) rotational thermal fluctuations of the tethered bead (fig. S11A)(9). With the FWLC model used, the goodness of fit improved onlyslightly compared to the standard WLC (compare RMSE values inFig. 4E). However, we found that the parameters estimated by FWLCwere markedly different from those obtained from the standard WLCmodel. For example, with the 1-kbp construct, both the WLC andFWLC models fitted the data well (Fig. 4E, red and green curves), butthe persistence length values estimated by FWLC (LFWLC
p ) were signif-icantly larger than those estimated by standard WLC (48.5 ± 1.1 nmversus 37 ± 2 nm).
We then applied the FWLC model to different tether lengths. Wefound thatLFWLC
p essentially remains at a constant value of 46 ± 6 nm,which is also the limiting persistence length (L∞p ) that both standardWLC and FWLC models estimate for an infinitely long chain (Fig.4E). Thus, our results indicated a constant Lp across a wide range ofcontour length Lc, confirming the notion that as an intrinsic materialparameter of dsDNA, the persistence length is not expected to dependon Lc. At the same time, the results push the limit of the chain length inwhich the FWLC framework is valid, from 1870 bp (9) to 198 bp, re-presenting an extension by one order of magnitude.
In a detailed examination of the FWLC model, we found that theconsideration of rotational fluctuations in a tethered bead was crucialin the estimation of the constant persistence length (fig. S11B). Thus,the gradual overshoot of LFWLC
p toward Lc = 198 bp presumably repre-sents a need for a modification to the bead fluctuation calculations fortheir application to MTs, in particular, in the short Lc regime below500 bp (Fig. 4E).
on April 22, 2020
ciencemag.org/
Fig. 4. Measurements of short-DNA elasticity and modeling by WLC and FWLC models. (A) FECs for dsDNA with varying contour length. FECs were collected frommultiple bead-tether constructs in each design (n = 14, 18, 13, 16, 18, and 6 for 198 bp, 510 bp, 1 kbp, 2 kbp, 4 kbp, and 10 kbp). Black dashed and dotted lines are WLCmodels for each tether length with a closed and open hairpin, respectively. (B) Normalized FECs for the graphs in (A). Black dotted line indicates 1 pN for the dis-tributions in (C). (C) Distributions of extension data in (B) at 1 pN. Solid lines are fits to normal distributions. (D) Force-extension data (yellow) fitted with standard WLC(red) and FWLC (green) models. (E) Persistence length of dsDNA as a function of contour length obtained from standard WLC (blue circle) and FWLC (red triangle)models. Blue dashed line is a fit of blue circles to an empirical formula [LWLC
p ¼ L∞p ð1þ aL∞p =LcÞ, with L∞p = 46 nm and a = 2.75] (9).
7 of 12

SC I ENCE ADVANCES | R E S EARCH ART I C L E
http://advances.scienceD
ownloaded from
High GC contents stiffen short dsDNARegulatory elements of genes are often characterized by AT- or GC-rich sequences such as TATA boxes or CpG islands, respectively.When we examined the GC content in the l-phage genome calculatedwith a 500-bp window, we found that the GC content level widelyvaries, ranging from 30 to 60%, even for these short segments of500-bp dsDNA (Fig. 5A). Such different sequence compositions havebeen suspected to modulate the bending of DNA segments or theiraccessibility to DNA binding proteins (33, 34), but a paucity of propermethods makes the corresponding nanomechanical changes difficultto probe experimentally.
Thus, we asked whether GC-poor and GC-rich DNA segmentsshow different behaviors in our precision force-extension measure-ments. We prepared 510-bp dsDNA constructs with the same designas above but with differing GC contents (30, 47, and 64%), all sampledfrom l DNA (circles in Fig. 5A). The prepared constructs wereexamined with the same pulling method, and the resulting FECs werecompared to each other after applying the same correction schemesas above.
The normalized FECs for the 510-bp dsDNA constructs with vary-ing GC contents were largely similar to one another (Fig. 5B). How-ever, the force-extension data formed distinct distributions whenoverlaid on each other, especially in the low-force region below 5 pN(Fig. 5C). For a clear comparison, we examined the distributions ofextension at a representative force level of 1 pN (Fig. 5D). Notably,theGC-richDNA (cyan) showed a noticeably increased extension com-pared to the other constructs.
We fitted the resulting FECs collected from multiple constructs(Fig. 5C) and obtained the values for LFWLC
p : 49 ± 7, 52 ± 5, and77 ± 14 nm (errors, 95% CI) with GC contents of 30, 47, and 64%(Fig. 5E). Therefore, it was clear from our results that a higher GC
Shon et al., Sci. Adv. 2019;5 : eaav1697 12 June 2019
content resulted in a greater Lp for short DNA fragments, a 1.6-foldincrease in the range we probed.
To compare our results on short DNAwith those for longer chains,we adopted a statistical model proposed to explain the experimentaldependence of Lp on GC content observed with genomic DNA pre-parations (35). We first evaluated the bending energies for dinucleotidepairs based on our 30% GC data and then used these values in evaluat-ing the predicted Lp at other GC content levels (35). This prediction(Fig. 5E, blue dashed line) is in quantitative agreement with our obser-vations, validating the use of the above model for shorter duplex DNA.
CpG methylation softens GC-rich dsDNAMethylation of the CpG islands is a prominent example of epigeneticregulation of these GC-rich regions. We finally questioned how CpGmethylation would alter the elastic properties of short DNA segments.In particular, given the large increase in LFWLC
p we observed with theGC-rich dsDNA, we wondered whether our precision force-extensionexperiments would provide enough sensitivity to detect potentialchanges upon methylation. The 64% GC sequence we used met theusual criteria for the CpG islands (length > 200 bp, GC > 50%, andobserved-to-expected CpG ratio > 60%), so its methylation wouldlikely mimic the potential consequences of biological hypermethyla-tion observed in cellular milieu.
To this end, we carried out enzymatic CpG methylation on theabove 500-bp constructs with varying GC contents, which were orig-inally prepared by PCR devoid of 5-methylcytosine (5-mC). Wemeasured the efficiency of methylation on selected CpG sites usinga methylation-sensitive restriction enzyme, which was found to beclose to 100% (fig. S1C). Upon complete methylation, the expectednumbers of 5-mCs for the three constructs are 7, 31, and 39, respec-tively (Fig. 5A, bottom). Then, the average spacing between 5-mCs in
on April 22, 2020
mag.org/
Fig. 5. Sequence dependence of short-DNA elasticity. (A) GC content in l-phage genomic DNA. Locations of 500-bp sequences with varying GC content are in-dicated with circles. Locations of CpG sites in each 500-bp construct are shown at the bottom. (B) Heat map representations of force-extension data measured for 510-bpdsDNA with 30% (magenta), 47% (orange), and 64% (cyan) GC content (n = 17, 18, and 22). (C) Color merge of the images in (B). White dotted line indicates 1 pN for thedistributions in (D). (D) Distributions of extension data in (C) at 1 pN. Solid lines are fits to normal distributions, with their means indicated by the dashed lines. (E) FWLCpersistence length of dsDNA as a function of GC content. Dashed line indicates a model dependence (35) adjusted for the current data on short DNA. (F) Heat map repre-sentations of force-extension data measured for CpG-methylated 510-bp dsDNA with 30% (magenta), 47% (orange), and 64% (cyan) GC content (n = 8, 9, and 10). Whitedotted line indicates 1 pN for the distributions in (G). (G) Distributions of extension data in (F) at 1 pN. Solid lines are fits to normal distributions, with their means indicated bythe dashed lines. (H) Comparison of FWLC persistence length for the varying GC content before and after CpG methylation.
8 of 12

SC I ENCE ADVANCES | R E S EARCH ART I C L E
64%GCDNA is ~13 bp, and about 12 5-mCs are expected to be presentwithin one unit ofLp (~150 bp), likely sufficient to induce changes in theintrinsic mechanics.
Strikingly, the CpG methylation had a marked effect on the elas-ticity of GC-rich DNA. When the FECs were compared before andafter the CpG methylation (Fig. 5F versus Fig. 5C), it was clear thatthe increase in extension observed for 64% GC DNA largely disap-peared after the methylation. All FECs essentially collapsed onto oneanother, exhibiting no appreciable differences in the elasticity afterCpG methylation. This overlapping of FECs was also prominent inthe low-force regime around 1 pN (Fig. 5G versus Fig. 5D), suggestingthat this phenomenon likely arises from the modulation of entropicstretchability. Consistent with this observation, the LFWLC
p values ob-tained after the CpGmethylation are essentially indistinguishable, con-verging to the global persistence length of dsDNA, namely, ~50 nm(Fig. 5H). The LFWLC
p for the 30% GC did not change upon methyl-ation as expected from the scanty distribution of CpG sites.
on April 22, 2020
http://advances.sciencemag.org/
Dow
nloaded from
DISCUSSIONBy examining the distortions of FECs occurring in conventional MTmeasurements, we found that most of the heterogeneity in FECs re-sulted from the off-axis displacements and the differential force scalesexhibited by individualmagnetic beads.We thus developed a two-stepcorrection scheme, which restored the intrinsic force-extension rela-tion of the tether dsDNAs, even for a 198-bp tether. Our correctionscheme can be directly integrated into conventional FEC measure-ments with two simple requirements: the rotational measurement ata low-force level to determine the location of tether DNA and the in-clusion of a short DNA hairpin in the tether. This method will be gen-eralizable to wide ranges of tether length and bead size, and it will bemost useful for short tethers and large beads. In particular, integra-tion of the method into recently developed multiplexed SMFS setups(36–39) will streamline a high-throughput acquisition and analysisof single-molecule data by carefully accounting for small movementsor variations for individual bead-tether constructs.
A successful incorporation of short tethers in SMFS systems pro-mises an improvement of the measurement resolution (16, 20, 21). InSMFS, the spatial resolution is limited by thermal motions of a beadthat depend on its tether length and stiffness (14). Consequently, abead tethered by a shorter DNA is expected to reflect molecular eventsthat occur within the bead–tether system in a more accurate manner.We verified this trend by measuring the noise levels in extension withvarying tether lengths (fig. S9). Novel DNA-based tethers that aremore rigid than bare duplex DNA have also been devised, potentiallyuseful for this purpose (40–43). Obviously, an accurate characteriza-tion of the nanoscale mechanics of these short DNA structures will bea prerequisite for their wide application.
The force scaling method using hairpins will hopefully facilitate theuse of short tethers in SMFS setups.While themagnetic force in anMTapparatus can be estimated directly from the thermal fluctuations ofmagnetic beads, the force needs to be determined at all the relevantpositions of magnets. Thus, determining actual forces in this way notonly is slow and laborious but also faces amultitude of challengeswhenusing a short tether (note S3) (20, 21). Instead, the use of a hairpin inour method as a force standard quickly estimates the force scalingfactor, allowing a simple, first-order correction of the calibrated forces.
Note that the force-sensing hairpin, when placed in themiddle of aDNA tether, was found to slightly affect the intrinsic mechanics of
Shon et al., Sci. Adv. 2019;5 : eaav1697 12 June 2019
DNA (fig. S2). We theoretically ascribed this artifact to the changesin boundary conditions and experimentally circumvented it by placingthe hairpin at the end of a tether. In the case of boundary-hairpin de-sign, its FEC was not noticeably different from a bare DNA without ahairpin or single-stranded region. Consistently with this result, the in-trinsic length-independent persistence length we obtained (46 nm) inthe presence of a boundary hairpin implies that the potential artifactfrom this accessory region is largely negligible down to 198 bp. Formore accurate mechanical measurements on short tethers, however,it would be advisable to verify the effect of hairpin and to minimizethe length of single-stranded linkers. A comparative analysis of me-chanical properties (as shown here for the sequence-dependent elasticity)would still yield meaningful results despite a small inaccuracy.
We expect that the hairpin-based force scaling scheme can be usedin other applications. At the simplest level, the unzipping/rezippingforce of the hairpin may be fine-tuned by varying the length andcomposition of the hairpin strand so that the transition occurs nearthe force regime of interest (24). In this vein, inclusion of G-quadruplexstructures that unfold at higher forces than hairpins (>20 pN) (44) orutilization of overstretching transition of dsDNA (65 pN) (45) will beuseful to span a wider force range. Furthermore, hairpin strands maybe embedded inmore complex systems likeDNAorigami (40, 42, 43) orprotein-DNA hybrid (22). It will be particularly useful for novel designsof tethers because one cannot estimate force from bead fluctuations ifthe mechanical properties of these systems are unknown. Last, themethod might also aid the use of homemade magnetic particles inMTs that are typically more polydisperse in size (and thus in generatedforce) than those commercially available.
Although we focused on the utility of DNA hairpin as a forcestandard, unzipping distance of hairpins may serve additionally aslength calibration standards in SMFS experiments. We implicitly ex-ploited this aspect when comparing the unzipping distances extractedfrom several aspects of the transition (note S4). In this regard, a seriesof hairpins that differ in the stem length by only a few base pairs willprovide a means for the precise calibration of nanopositioning devices(e.g., a piezo stage) used in SMFS methods.
Equipped with the two-step correction scheme for precise FECmeasurements, we systematically studied the submicrometer elasticityof short dsDNA molecules as a function of contour length and GCcomposition. In particular, with the standard WLC equations used,we observed the decrease in the persistence length in the short dsDNAregime below 5 kbp. Notably, the observed relationship between thecontour length and the WLC persistence length (LWLC
p ) followed anempirical formula previously derived from simulations and experimentson intermediate-length dsDNAs (9, 10, 15). This indicates that ourobservation is in line with previous observations using different ex-perimental schemes and that the apparent decrease in LWLC
p in ourmeasurements stems from the finite nature of short DNAs for themost part.
Because the short dsDNAs we interrogated were suspended be-tween a magnetic bead and a glass surface, we needed to considerthese immobile and impenetrable boundary conditions for correctmodeling. With the FWLC model that considers the resulting confine-ment and altered fluctuations from the boundaries, we observed anessentially constant persistence length (LFWLC
p ) across the entire con-tour length region (0.2 to 10 kbp). Arguably, such molecules with con-straints might resemble chromosomal DNA segments anchored bynucleosomes, adopting a “bead-on-a-string” conformation. In this re-gard, it will be interesting to extend this study to short stretches of
9 of 12

SC I ENCE ADVANCES | R E S EARCH ART I C L E
on April 22, 2020
http://advances.sciencemag.org/
Dow
nloaded from
DNA including nucleosome positioning sequence (46). Our force-extension methods will be well suited to this aim because such motifsare only ~150 bp in length (e.g., 147 bp for the Widom 601 sequence).
At the same time, we also observed a remarkable influence of theGC content on the elasticity of short dsDNAs. An increase in the GCcontent of 510-bp dsDNA from 30 to 64% was accompanied by a1.6-fold increase in the effective persistence length. Recently, a high-throughput analysis of nanochannel-confined genomic sequences sug-gests that the persistence length of DNA increases as a function of GCcontent (35). In addition, a single-molecule interaction assay on shortDNA duplexes indicated a stronger association between AT-rich se-quences than GC-rich ones (47, 48). We suppose that the increasedintramolecular contacts that occur transiently between the domainsof AT-rich DNAs would effectively decrease the end-to-end extension,particularly in the low-force regime. This tendency will, in turn, leadto an increase in persistence length for GC-rich sequences where suchAT-based interactions become less prominent, consistent with ourresults. However, a simpler explanation is also plausible in whichthe overall energetic stability of the GC-rich DNA confers the ad-ditional rigidity that manifests as an increase in persistence length.Another possibility is the difference in the intrinsic curvature of DNAthat is known to be large for particular motifs (49), althoughdiscerning such static bends from dynamic flexibility in experimentswould be challenging. Further tests on an expanded set of short DNAconstructs will provide a more comprehensive view of the sequence-dependent elasticity of dsDNA.
It is remarkable that the steep increase of Lp with the GC content islargely abrogated by CpGmethylation, pointing to a greater flexibilityof GC-rich DNA upon methylation. This result is consistent with aprevious measurement by optical tweezers on longer methylatedDNA (50). Such an increase in flexibility may be again amanifestationof enhanced intramolecular associations, as suggested by single-molecule interaction assays and simulations (47, 48). Althoughsuch intersegmental contacts would be largely disrupted at highforce levels applied in our MT experiments, such dynamics mightstill influence the force-extension profile that we probed around1 pN. Because the FWLC-based persistence length estimations forshort chains are highly sensitive to the force-extension data at low forcelevels, the stark change inLFWLC
p uponmethylation largely resulted fromdifferential behaviors in this force regime around 1 pN.
How might these results relate to the DNA segments in cell nucleiwith differing sequence composition? AT-rich regulatory regions aretypically found devoid of nucleosomes, showing increased accessibil-ity to DNA binding proteins (51). The intrinsic flexibility in thesesequences may aid its binding to transcription factors, which oftenaccompanies bending of target DNA (52). Note that the AT-richsequence we excerpted from the l-phage genome for our experimentsincluded the upstream region of an open reading frame.
Conversely, mammalian promoters are frequently enriched in GCbase pairs, a famous example of which is the CpG islands. It is tempt-ing to postulate that the stiffness of GC-rich regions that can be addi-tionally modulated by methylation would be a good candidate fordynamic regulation of DNA-protein binding. While hypermethyla-tion of CpG islands is typically associated with repression of gene ex-pression (53), the correlation between nucleosome occupancy, GCcontent, and its methylation level has not been fully understood yet(52, 54, 55). The complexity might be due to an intricate sequence-dependent interplay among CpG sites, poly(dA:dT) tracts, and nu-cleosome positioning sequences. All these players may conspire to
Shon et al., Sci. Adv. 2019;5 : eaav1697 12 June 2019
orchestrate the binding of proteins such as histones and methyl-CpG–binding proteins but could also be influenced by their bindingin turn. TheLFWLC
p value wemeasured shifted from 77 to 55 nm uponmethylation, which corresponds to 230 and 160 bp, respectively. Wenote that this length regime of one to two persistence lengths corre-sponds to the length ofDNA segments that are known towrap aroundthe histone octamers (146 bp). Thus, the change upon CpG methyla-tion might be directly relevant for the facile regulation of DNA flexi-bility for the formation and remodeling of nucleosomes.
MATERIALS AND METHODSSynthesis of hairpin-containing dsDNA tethersFor validation of the correction method (Figs. 1 and 2), we designed a~1-kbp construct in which two 522-bp dsDNA tethers were bridgedby a hairpin structure (fig. S1A). The tethers were prepared by PCRusing biotin- and digoxigenin-modified primers for surface and beadattachment, respectively. The hairpin consisting of a 30-bp stem and a4-nt loop (24) was separately synthesized by annealing and ligation ofoligos. The hairpin strand and tethers were assembled by enzymaticdigestion and ligation through their cohesive ends and verified inagarose gels. For the constructs used in the measurements of persist-ence length (Fig. 4), dsDNA fragments of varying length (198 bp to4 kbp) and GC content (30 to 64%) were prepared by PCR and ligatedwith oligos that collectively formed a hairpin structure at one end ofthe dsDNA backbone (fig. S1B). Further details are in SupplementaryMaterials and Methods. For CpG methylation, 510-bp constructs witha hairpin at the biotin side were methylated at their CpG sites via CpGmethyltransferase M.SssI (New England BioLabs). For each construct,~800 ng of DNA was mixed with 240 mM S-adenosyl methionine and8 U of M.SssI in the standard reaction buffer (NEBuffer 2) and incu-bated for 10 hours at 37°C. For the verification of methylation, theproducts were digested with methylation-sensitive restriction enzymeBst UI (New England BioLabs), and the cleaved segments, if any, werevisualized on a 2% agarose gel. The degree of protection by methyla-tion was measured to be >90% in all cases.
Sample chamber for MTsA flow cell was assembled from two glass coverslips passivatedwith PEG (Laysan Bio, M-SVA-5K) and spaced by a double-sidedtape. A fraction (1 to 5%) of the PEG molecules were modified withbiotin (Laysan Bio, BIO-SVA-5K) for the surface attachment of DNAmolecules. Sequential injection of NeutrAvidin (Thermo Fisher Scien-tific, 31000), DNA constructs, and magnetic beads (Thermo FisherScientific, Dynabeads M-270) coated with anti-digoxigenin (Sigma-Aldrich, 11333089001) into the flow cell yielded bead-tether con-structs that were subjected to the measurements by MTs. Furtherdetails are in Supplementary Materials and Methods.
MT instrumentThe MT apparatus in this study was built on an inverted microscope(Olympus, IX73) similar to previously reported high-resolution MTsetups (56–58). A pair of magnets (vertically aligned in opposite di-rections with a 1-mm gap) was placed above the stage holding a flowcell, and its vertical position and rotationwere controlled by a translationstage (Physik Instrumente, M126) and a steppermotor (Autonics, A3K-S545W), respectively. The magnet axis was confirmed to be aligned tothe imaging axis (within 1°) by following the motion of a free magneticbead. Beads in a flow cell were illuminated by a red superluminescent
10 of 12
SC I ENCE ADVANCES | R E S EARCH ART I C L E
on April 22, 2020
http://advances.sciencemag.org/
Dow
nloaded from
diode (QPhotonics, QSDM-680-2) and imaged by a 100× oil-immersionobjective (Olympus, UPlanSApo NA 1.40) and a high-speed comple-mentary metal-oxide semiconductor (CMOS) camera (Mikrotron,EoSensMC-3082) grabbing 512 × 512 images at 4 kHz. The objectiveposition was controlled by a piezo-controlled nanopositioner (MadCity Labs, Nano-F100S) to calibrate distances and to correct for drift.The images were recorded by a custom software written in LabVIEW(National Instruments), and the coordinates of beads were tracked inreal time at up to 1.2 kHz. Unless necessary, measurements were per-formed at 100 Hz to reduce file size.
Force measurements and calibrationMagnetic forces were measured and calibrated as described in theliterature (20, 28, 29). Forces were estimated from the PSDs for theBrownian motion in y (perpendicular to the magnetic field), apply-ing corrections for near-surface viscosity (fig. S7) and blurring andaliasing in acquisition (note S3) (21). For calibration, we used 2.8-mm-diameter beads (Thermo Fisher Scientific, Dynabeads M-270) tetheredby a 5.4-kbp dsDNA. The force versus magnet position data were fittedwith a double-exponential function (fig. S4 and note S4) (20).
FEC measurementsTypical FEC measurements were performed by applying a forward(increasing) and a reverse (decreasing) force ramp in the range of 0.1to 20 pN at a loading rate of 3 pN/s. The cycle was repeated for threetimes for each bead-tether construct. While the ramps were applied inboth directions for completeness, only the data from reverse rampswere used when fitting FECs to a model. This choice ensures fast equi-librium of the bead position (59) and avoids secondary structures ornonspecific interactions at low forces.
Correction of tether extensionThe off-centered attachment at a reference force (1 pN) was measuredby rotating the magnet slowly (60°/s) (18, 19). The obtained x co-ordinates of bead (xbead) and DNA (xDNA) were used to calculate xoffand generate a correction function, zoff(F), as described in the maintext through Eqs. 1 and 2. The resulting function was then added tothe raw z coordinates of the bead (zbead).
Correction for variability in forceForce-clamp measurements were performed by varying the force by0.1 pN in the force regime where DNA hairpin transition occurred(24), each measurement lasting 10 s. Three such measurements foreach bead were averaged to determine the coexistence force (F1/2)and the corresponding force scalers as described in the main text.For determination of scalers from direct force analysis, PSDs were re-corded at ~12 pN to avoid hairpins corrupting the intrinsic powerspectra of the fluctuation.
Data analysisData from MT experiments were analyzed with custom softwarewritten in MATLAB (MathWorks). Methods for the fitting and theanalyses of hairpin transitions are described in Supplementary Ma-terials and Methods.
SUPPLEMENTARY MATERIALSSupplementary material for this article is available at http://advances.sciencemag.org/cgi/content/full/5/6/eaav1697/DC1Supplementary Materials and Methods
Shon et al., Sci. Adv. 2019;5 : eaav1697 12 June 2019
Note S1. Mechanical effects of hairpin motifs in dsDNA constructs.Note S2. Geometry of off-centered attachment.Note S3. Force in MTs.Note S4. Measurements of hairpin unzipping distance.Note S5. Fitting FECs to WLC models.Fig. S1. Preparation of DNA constructs.Fig. S2. Comparison of FECs for 1-kbp constructs with different hairpins.Fig. S3. Geometry of off-centered attachment.Fig. S4. Force calibration in MTs.Fig. S5. Measurements of hairpin unzipping distance.Fig. S6. Force scaling factors from direct measurements of force.Fig. S7. Correction factors for the drag coefficients near surface.Fig. S8. Errors in WLC fitting.Fig. S9. Noise in extension measurements with short tethers.Fig. S10. WLC fitting of FECs for short DNA constructs.Fig. S11. FWLC fitting of FECs for short DNA constructs.Table S1. Persistence length of short dsDNA molecules.Software S1. FEC analyzer.References (60–62)
REFERENCES AND NOTES1. J. P. Peters, L. J. Maher III, DNA curvature and flexibility in vitro and in vivo.
Q. Rev. Biophys. 43, 23–63 (2010).2. P. J. Hagerman, Flexibility of DNA. Annu. Rev. Biophys. Biophys. Chem. 17, 265–286 (1988).3. M. D. Wang, H. Yin, R. Landick, J. Gelles, S. M. Block, Stretching DNA with optical tweezers.
Biophys. J. 72, 1335–1346 (1997).4. A. P. Fields, E. A. Meyer, A. E. Cohen, Euler buckling and nonlinear kinking of double-
stranded DNA. Nucleic Acids Res. 41, 9881–9890 (2013).5. C. Kim, O.-C. Lee, J.-Y. Kim, W. Sung, N. K. Lee, Dynamic release of bending stress in
short dsDNA by formation of a kink and forks. Angew. Chem. Int. Ed. Engl. 54,8943–8947 (2015).
6. M. J. Shon, A. E. Cohen, Nano-mechanical measurements of protein-DNA interactionswith a silicon nitride pulley. Nucleic Acids Res. 44, e7 (2016).
7. T. E. Cloutier, J. Widom, Spontaneous sharp bending of double-stranded DNA. Mol. Cell14, 355–362 (2004).
8. P. A. Wiggins, T. van der Heijden, F. Moreno-Herrero, A. Spakowitz, R. Phillips, J. Widom,C. Dekker, P. C. Nelson, High flexibility of DNA on short length scales probed by atomicforce microscopy. Nat. Nanotechnol. 1, 137–141 (2006).
9. Y. Seol, J. Li, P. C. Nelson, T. T. Perkins, M. D. Betterton, Elasticity of short DNA molecules:Theory and experiment for contour lengths of 0.6-7 microm. Biophys. J. 93, 4360–4373(2007).
10. Y.-F. Chen, D. P. Wilson, K. Raghunathan, J.-C. Meiners, Entropic boundary effects onthe elasticity of short DNA molecules. Phys. Rev. E Stat. Nonlin. Soft Matter Phys. 80,020903 (2009).
11. R. Vafabakhsh, T. Ha, Extreme bendability of DNA less than 100 base pairs long revealedby single-molecule cyclization. Science 337, 1097–1101 (2012).
12. T. T. Le, H. D. Kim, Probing the elastic limit of DNA bending. Nucleic Acids Res. 42,10786–10794 (2014).
13. S. B. Smith, L. Finzi, C. Bustamante, Direct mechanical measurements of the elasticity ofsingle DNA molecules by using magnetic beads. Science 258, 1122–1126 (1992).
14. K. C. Neuman, A. Nagy, Single-molecule force spectroscopy: Optical tweezers, magnetictweezers and atomic force microscopy. Nat. Methods 5, 491–505 (2008).
15. M. Ribezzi-Crivellari, F. Ritort, Force spectroscopy with dual-trap optical tweezers:Molecular stiffness measurements and coupled fluctuations analysis. Biophys. J. 103,1919–1928 (2012).
16. N. Forns, S. de Lorenzo, M. Manosas, K. Hayashi, J. M. Huguet, F. Ritort, Improvingsignal/noise resolution in single-molecule experiments using molecular constructs withshort handles. Biophys. J. 100, 1765–1774 (2011).
17. M. M. van Oene, L. E. Dickinson, F. Pedaci, M. Köber, D. Dulin, J. Lipfert, N. H. Dekker,Biological magnetometry: Torque on superparamagnetic beads in magnetic fields.Phys. Rev. Lett. 114, 218301 (2015).
18. D. Klaue, R. Seidel, Torsional stiffness of single superparamagnetic microspheres in anexternal magnetic field. Phys. Rev. Lett. 102, 028302 (2009).
19. I. D. Vlaminck, T. Henighan, M. T. J. van Loenhout, D. R. Burnham, C. Dekker, Magneticforces and DNA mechanics in multiplexed magnetic tweezers. PLOS ONE 7, e41432(2012).
20. H. Chen, H. Fu, X. Zhu, P. Cong, F. Nakamura, J. Yan, Improved high-force magnetictweezers for stretching and refolding of proteins and short DNA. Biophys. J. 100, 517–523(2011).
21. P. Daldrop, H. Brutzer, A. Huhle, D. J. Kauert, R. Seidel, Extending the range for forcecalibration in magnetic tweezers. Biophys. J. 108, 2550–2561 (2015).
11 of 12
SC I ENCE ADVANCES | R E S EARCH ART I C L E
on April 22, 2020
http://advances.sciencemag.org/
Dow
nloaded from
22. M. J. Shon, H. Kim, T.-Y. Yoon, Focused clamping of a single neuronal SNARE complex bycomplexin under high mechanical tension. Nat. Commun. 9, 3639 (2018).
23. K. C. Neuman, G. Charvin, D. Bensimon, V. Croquette, Mechanisms of chiral discriminationby topoisomerase IV. Proc. Natl. Acad. Sci. U.S.A. 106, 6986–6991 (2009).
24. M. T. Woodside, W. M. Behnke-Parks, K. Larizadeh, K. Travers, D. Herschlag, S. M. Block,Nanomechanical measurements of the sequence-dependent folding landscapes of singlenucleic acid hairpins. Proc. Natl. Acad. Sci. U.S.A. 103, 6190–6195 (2006).
25. M. T. Woodside, P. C. Anthony, W. M. Behnke-Parks, K. Larizadeh, D. Herschlag, S. M. Block,Direct measurement of the full, sequence-dependent folding landscape of a nucleic acid.Science 314, 1001–1004 (2006).
26. J. Lipfert, X. Hao, N. H. Dekker, Quantitative modeling and optimization of magnetictweezers. Biophys. J. 96, 5040–5049 (2009).
27. J. Liphardt, B. Onoa, S. B. Smith, I. Tinoco Jr., C. Bustamante, Reversible unfolding of singleRNA molecules by mechanical force. Science 292, 733–737 (2001).
28. A. J. W. te Velthuis, J. W. J. Kerssemakers, J. Lipfert, N. H. Dekker, Quantitative guidelinesfor force calibration through spectral analysis of magnetic tweezers data. Biophys. J. 99,1292–1302 (2010).
29. B. M. Lansdorp, O. A. Saleh, Power spectrum and Allan variance methods for calibratingsingle-molecule video-tracking instruments. Rev. Sci. Instrum. 83, 025115 (2012).
30. H. Chen, J. Yan, Effects of kink and flexible hinge defects on mechanical responses ofshort double-stranded DNA molecules. Phys. Rev. E 77, 041907 (2008).
31. C. Bustamante, J. F. Marko, E. D. Siggia, S. Smith, Entropic elasticity of lambda-phage DNA.Science 265, 1599–1600 (1994).
32. C. Bouchiat, M. D. Wang, J. F. Allemand, T. Strick, S. M. Block, V. Croquette, Estimating thepersistence length of a worm-like chain molecule from force-extension measurements.Biophys. J. 76, 409–413 (1999).
33. M. E. Hogan, R. H. Austin, Importance of DNA stiffness in protein-DNA binding specificity.Nature 329, 263–266 (1987).
34. A. Pérez, C. L. Castellazzi, F. Battistini, K. Collinet, O. Flores, O. Deniz, M. L. Ruiz, D. Torrents,R. Eritja, M. Soler-López, M. Orozco, Impact of methylation on the physical propertiesof DNA. Biophys. J. 102, 2140–2148 (2012).
35. H.-M. Chuang, J. G. Reifenberger, H. Cao, K. D. Dorfman, Sequence-dependent persistencelength of long DNA. Phys. Rev. Lett. 119, 227802 (2017).
36. N. Ribeck, O. A. Saleh, Multiplexed single-molecule measurements with magnetictweezers. Rev. Sci. Instrum. 79, 094301 (2008).
37. I. De Vlaminck, T. Henighan, M. T. van Loenhout, I. Pfeiffer, J. Huijts, J. W. Kerssemakers,A. J. Katan, A. van Langen-Suurling, E. van der Drift, C. Wyman, C. Dekker, Highly parallelmagnetic tweezers by targeted DNA tethering. Nano Lett. 11, 5489–5493 (2011).
38. B. A. Berghuis, M. Köber, T. van Laar, N. H. Dekker, High-throughput, high-force probing ofDNA-protein interactions with magnetic tweezers. Methods 105, 90–98 (2016).
39. D. Yang, A. Ward, K. Halvorsen, W. P. Wong, Multiplexed single-molecule forcespectroscopy using a centrifuge. Nat. Commun. 7, 11026 (2016).
40. D. J. Kauert, T. Kurth, T. Liedl, R. Seidel, Direct mechanical measurements reveal thematerial properties of three-dimensional DNA origami. Nano Lett. 11, 5558–5563 (2011).
41. E. Pfitzner, C. Wachauf, F. Kilchherr, B. Pelz, W. M. Shih, M. Rief, H. Dietz, Rigid DNAbeams for high-resolution single-molecule mechanics. Angew. Chem. Int. Ed. Engl. 52,7766–7771 (2013).
42. W. Bae, K. Kim, D. Min, J.-K. Ryu, C. Hyeon, T.-Y. Yoon, Programmed folding of DNAorigami structures through single-molecule force control. Nat. Commun. 5, 5654 (2014).
43. P. C. Nickels, B. Wünsch, P. Holzmeister, W. Bae, L. M. Kneer, D. Grohmann, P. Tinnefeld,T. Liedl, Molecular force spectroscopy with a DNA origami-based nanoscopic forceclamp. Science 354, 305–307 (2016).
44. M. de Messieres, J.-C. Chang, B. Brawn-Cinani, A. La Porta, Single-molecule study ofG-quadruplex disruption using dynamic force spectroscopy. Phys. Rev. Lett. 109,058101 (2012).
45. I. Popa, J. A. Rivas-Pardo, E. C. Eckels, D. J. Echelman, C. L. Badilla, J. Valle-Orero,J. M. Fernández, A HaloTag anchored ruler for week-long studies of protein dynamics.J. Am. Chem. Soc. 138, 10546–10553 (2016).
46. J. Widom, Role of DNA sequence in nucleosome stability and dynamics. Q. Rev. Biophys.34, 269–324 (2001).
Shon et al., Sci. Adv. 2019;5 : eaav1697 12 June 2019
47. J. Yoo, H. Kim, A. Aksimentiev, T. Ha, Direct evidence for sequence-dependent attractionbetween double-stranded DNA controlled by methylation. Nat. Commun. 7, 11045 (2016).
48. H. Kang, J. Yoo, B. K. Sohn, S. W. Lee, H. S. Lee, W. Ma, J. M. Kee, A. Aksimentiev, H. Kim,Sequence-dependent DNA condensation as a driving force of DNA phase separation.Nucleic Acids Res. 46, 9401–9413 (2018).
49. P. J. Hagerman, Sequence dependence of the curvature of DNA: A test of the phasinghypothesis. Biochemistry 24, 7033–7037 (2002).
50. C. I. Pongor, P. Bianco, G. Ferenczy, R. Kellermayer, M. Kellermayer, Optical trappingnanometry of hypermethylated CPG-island DNA. Biophys. J. 112, 512–522 (2017).
51. G.-C. Yuan, Y. J. Liu, M. F. Dion, M. D. Slack, L. F. Wu, S. J. Altschuler, O. J. Rando,Genome-scale identification of nucleosome positions in S. cerevisiae. Science 309,626–630 (2005).
52. S. Johnson, Y.-J. Chen, R. Phillips, Poly(dA:dT)-rich DNAs are highly flexible in the contextof DNA looping. PLOS ONE 8, e75799 (2013).
53. P. A. Jones, S. B. Baylin, The fundamental role of epigenetic events in cancer.Nat. Rev. Genet. 3, 415–428 (2002).
54. R. Fenouil, P. Cauchy, F. Koch, N. Descostes, J. Z. Cabeza, C. Innocenti, P. Ferrier,S. Spicuglia, M. Gut, I. Gut, J. C. Andrau, CpG islands and GC content dictatenucleosome depletion in a transcription-independent manner at mammalian promoters.Genome Res. 22, 2399–2408 (2012).
55. C. K. Collings, P. J. Waddell, J. N. Anderson, Effects of DNA methylation on nucleosomestability. Nucleic Acids Res. 41, 2918–2931 (2013).
56. K. Kim, O. A. Saleh, A high-resolution magnetic tweezer for single-moleculemeasurements. Nucleic Acids Res. 37, e136 (2009).
57. B. M. Lansdorp, S. J. Tabrizi, A. Dittmore, O. A. Saleh, A high-speed magnetic tweezerbeyond 10,000 frames per second. Rev. Sci. Instrum. 84, 044301 (2013).
58. D. Dulin, T. J. Cui, J. Cnossen, M. W. Docter, J. Lipfert, N. H. Dekker, High spatiotemporal-resolution magnetic tweezers: Calibration and applications for DNA dynamics. Biophys. J.109, 2113–2125 (2015).
59. M. Kruithof, F. Chien, M. de Jager, J. van Noort, Subpiconewton dynamic forcespectroscopy using magnetic tweezers. Biophys. J. 94, 2343–2348 (2008).
60. I. Tinoco Jr., C. Bustamante, The effect of force on thermodynamics and kinetics of singlemolecule reactions. Biophys. Chem. 101–102, 513–533 (2002).
61. S. B. Smith, Y. Cui, C. Bustamante, Overstretching B-DNA: The elastic response ofindividual double-stranded and single-stranded DNA molecules. Science 271, 795–799(1996).
62. A. Dittmore, D. B. McIntosh, S. Halliday, O. A. Saleh, Single-molecule elasticitymeasurements of the onset of excluded volume in poly(ethylene glycol). Phys. Rev. Lett.107, 148301 (2011).
Acknowledgments: We thank D. Min for the technical assistance with MT instruments.We thank M. W. Kim and S. H. Kim for helpful discussions. Funding: This work was supportedby the National Creative Research Initiative Program (Center for Single-Molecule SystemsBiology to T.-Y.Y.; grant number: NRF-2011-0018352) funded by the National ResearchFoundation of Korea. M.J.S. was supported by the BK21 Plus Program from the Korean Ministryof Education. Author contributions: M.J.S. and T.-Y.Y. conceived the project. All authorsdesigned the experiments. M.J.S. and S.-H.R. performed MT experiments and analyzed data.M.J.S. and T.-Y.Y. wrote the manuscript. Competing interests: The authors declare that theyhave no competing interests. Data and materials availability: All data needed to evaluatethe conclusions in the paper are present in the paper and/or the Supplementary Materials.Additional data related to this paper are available upon a reasonable request.
Submitted 22 August 2018Accepted 3 May 2019Published 12 June 201910.1126/sciadv.aav1697
Citation: M. J. Shon, S.-H. Rah, T.-Y. Yoon, Submicrometer elasticity of double-stranded DNArevealed by precision force-extension measurements with magnetic tweezers. Sci. Adv. 5,eaav1697 (2019).
12 of 12

measurements with magnetic tweezersSubmicrometer elasticity of double-stranded DNA revealed by precision force-extension
Min Ju Shon, Sang-Hyun Rah and Tae-Young Yoon
DOI: 10.1126/sciadv.aav1697 (6), eaav1697.5Sci Adv
ARTICLE TOOLS http://advances.sciencemag.org/content/5/6/eaav1697
MATERIALSSUPPLEMENTARY http://advances.sciencemag.org/content/suppl/2019/06/10/5.6.eaav1697.DC1
REFERENCES
http://advances.sciencemag.org/content/5/6/eaav1697#BIBLThis article cites 62 articles, 11 of which you can access for free
PERMISSIONS http://www.sciencemag.org/help/reprints-and-permissions
Terms of ServiceUse of this article is subject to the
is a registered trademark of AAAS.Science AdvancesYork Avenue NW, Washington, DC 20005. The title (ISSN 2375-2548) is published by the American Association for the Advancement of Science, 1200 NewScience Advances
License 4.0 (CC BY-NC).Science. No claim to original U.S. Government Works. Distributed under a Creative Commons Attribution NonCommercial Copyright © 2019 The Authors, some rights reserved; exclusive licensee American Association for the Advancement of
on April 22, 2020
http://advances.sciencemag.org/
Dow
nloaded from