submission dr58 - attachment - wilson sy - default ... · web viewkey words: economies of scale,...
TRANSCRIPT
Scale and Competition inAustralian Superannuation
Wilson Sy1
School of Economics and FinanceUniversity of Western SydneyLocked Bag 1797Penrith NSW 2751
Phone: 0612 95559669Email: [email protected]
26 July 2012
Key words: Economies of scale, diseconomies of scale, market competition, pension, superannuation, fund size, fees, cost and regulation.
Word count: 7,252.
1 The idea for this work originated when the author was a senior advisor to the Super System Review. The author thanks Carole Sladen, Peter Swann, Anthony Asher, James Davis and Jean Francois Paquin for helpful comments on earlier drafts of this paper. The views and analysis expressed in this paper are personal, not paid by, or associated with, any institution.
Abstract
Using official data and new econometric models based on how the industry actually works, we show the benefits of scale for members are limited, and confined to the non-profit sector which is structured to incur relatively low fixed costs compared with much higher variable costs. In Australian institutional superannuation, most efficiency gains, such as those from economies of scale, are captured as profits for financial intermediaries, with little benefit for members. Recent regulatory reforms on fee disclosure and scale requirements have the unintended consequences of further reducing competition and benefiting the large financial conglomerates.
2
I Introduction
This paper brings together two important topics in economics. The first is the fundamental concept of economies of scale in microeconomics to explain firm sizes and market competition (Mankiw, 2008, p.281). The second is the economics of private pension systems which are increasingly seen as the solution for funding the retirement of the world’s aging populations (IMF, 2011).
Australian superannuation is more reliant than most other countries on market competition to deliver economic efficiency in a largely private-sector defined-contribution system (OECD, 2011). In its design of the financial system, however, the Wallis report (1997), in the chapter on “promoting increased efficiency”, noted that “one of the major potential reasons for higher costs in Australia is the fragmentation of the managed funds industry”, which “means therefore that domestic funds fail to capture large scale economies which reduce costs”.
More than a decade after the Wallis enquiry, the total superannuation system assets quadrupled from $321 billion in 1997 to $1,335 billion in 2011, with much of the growth due to the $654 billion accumulated from net contributions (APRA, 2012a).The sheer volume of mandatory money flowing into the system has masked the low real earnings of the system, which have been restrained by high costs (Sy, 2011).
The Super System Review (2010) proposed MySuper as a specifically regulated product for default options, in order to enhance competition in that market segment to drive down fees charged to members, who mostly use default options. In its implementation of the proposal, the Australian Government passed a bill (Super Amendment, 2012) expressing the need for licensed operators of MySuper to consider whether their products may have insufficient scale2 so as to disadvantage “the financial interests of the beneficiaries”.
The regulation begs the question: what is “sufficient scale”? By singling scale out among other factors, the law implicitly assumes that scale is the most important factor in improving net return for superannuation members. Recently, the Productivity Commission (2012)3 does not support scale as a specific criterion for industry award superannuation. If a government can decide when a fund is too small to succeed, should it also decide when a fund is too big to fail?
In this paper, we review the evidence on the benefits of economies of scale. We find the existing evidence to be tentative and statistically weak. With the insights from a critical analysis of the flaws in previous studies, we develop new econometric models which are both statistically and economically significant. The models are used to provide some scenario estimates of the potential benefits of MySuper to Australian superannuation. We mention briefly what needs to be done to really help members.
2 See Division 6, section 29VN (b), where scale refers to the number of beneficiaries and the pool of assets.3 See Draft Recommendation 4.4
3
II Review of Evidence
Empirical evidence on economies of scale can be divided in micro evidence and macro evidence. Micro evidence refers to empirical studies published in academic journals and also smaller surveys published by professional bodies, such as consultants and industry associations. Macro evidence refers to stylized facts or published research on the whole or broad sectors of the industry.
(i) Micro Evidence
The recommendation of the Super System Review (2010) on scale is based on “A report prepared for the Review by independent consultant, Deloitte Actuaries & Consultants Limited”, which “describes the power of economies of scale in reducing per member investment, advice and operating costs, and so the scope to reduce total member fees”.
The cost estimates of MySuper appear reasonable in indicating economies of scale in the Deloitte report (Walker and Monaghan, 2010). The report makes substantial disclaimers about the quality and the type of data used, discloses little on the methodology used and provides no indication of possible errors in the estimates.
The report uses proprietary data which were collected from some industry funds on consulting assignments. We explain below that conclusions based on industry fund data cannot be extrapolated to the whole public offer sector. We conclude that the Deloitte report merely hypothesized about how economies of scale might affect the cost of MySuper. Moreover, the report does not reference or comment on other published research. Evidently, published research does suffer from defects in data, econometric models and statistical analysis. Often the data used are proprietary, for commercial or regulatory use (Bikker and de Dreu, 2009; Bauer et al., 2010; Dyck and Pomorski, 2011). Or, if the data are publicly available, they are of poor or unknown quality (Chen et al., 2004; French, 2008)4. Data are taken as unquestionable “givens”, as authors rarely show adequate knowledge of the data details by discussing their potential errors.
Many studies infer the impact of economies of scale from investment performance (Chen et al., 2004; Coleman et al., 2006; Cummings, 2012) where risk-adjustments are based on the Capital Asset Pricing Model (CAPM), which has never been considered empirically valid. For example, Fama and French (2004) conclude that “the problems are serious enough to invalidate most applications of the CAPM”.
The selection of explanatory variables and the econometric models used in the studies are not based on economic theory (Leamer, 1983), but are arbitrarily chosen hypothetical relationships, possibly to optimize statistical results (Bateman and Mitchell, 2004; Malhotra et al., 2005; Bikker and de Dreu, 2009; Higgs and Worthington, 2010; Mama et al., 2011). The arbitrary trans-log cost function often
4 In an oft cited paper using the CRSP database for US equity mutual funds, French noted “The major challenge is identifying US equity funds”.
4
used cannot possibly provide a satisfactory micro-foundation (Sheikh, 2005) because the functional forms of the cost functions are non-additive.
Finally, many studies mentioned above claim to have found statistically significant evidence for economies of scale based on some t-statistics having values greater than two or three. But the criterion of significance based on t-statistics is usually invalid because the two strong assumptions: (1) errors are normally distributed with zero-mean and (2) the errors are independent of the variables, are rarely satisfied. Instead, for non-normal errors, much higher t-values are required based on the signal-to-noise criterion (Swann, 2012).
The signal-to-noise ratio is defined by the ratio of the t-value t to the square root of the degrees of freedom (sample size N minus the number of variables k):
(1)
In this paper, we use high signal-to-noise ratio, as well as, high R-square for goodness-of-fit as the criteria of statistical significance.
In summary, based on published studies, we conclude that the micro evidence for economies of scale in Australian superannuation is at best tentative and weak. It often contributes to misinformation to create an uncompetitive market.
(ii) Macro Evidence
Through uncritical repetition, the virtue of economies of scale has become such a motherhood truth that fund mergers have been occurring for several years with ever increasing rates, particularly since the Super System Review (2010). Much overlooked or ignored is the contrary macro evidence which has been accumulating.
Over this period, the number of institutional superannuation funds declined from over 4,000 to 1,785 in 2004, to 505 in 2008 and to 386 in 2011. Despite this dramatic consolidation of superannuation funds, members’ fees fell from over 1.37 per cent before 2002, to 1.30 per cent in 2004 and to 1.21 per cent in 2008 (Rice Warner, 2005, 2007, 2008). A contraction from 1,785 to 505 funds between 2004 and 2008, while total system assets increased from $635 billion to $1,172 billion led to only 9 basis points reduction in members’ fees.
As a sovereign wealth fund, the Future Fund is the largest single fund in Australia, managing just over $75 billion in June 2011, increasing from $67 billion one year earlier. Its total expense for the year was $485 million, of which $435 million was fees paid to 87 external investment managers. The total expense ratio of the Future Fund is 72 basis points for 2011 (Future Fund, 2011). The fund does not incur any expenses associated with the administration of large numbers of member accounts.
Funds in the Self-Managed Superannuation Fund (SMSF) sector, with less than five members, also do not have costs associated with large memberships. The average expense ratio of over 400,000 funds in the SMSF sector is 54 basis points, with 38 per
5
cent of the of the larger size funds having expense ratios of less than 25 basis points (ATO, 2012).Hence we have many SMSF funds with less than $2 million in total assets operating at expense ratios of 25 basis points, substantially less than the 72 basis points incurred by the Future Fund. Allowing for differences in calculation methodology, this and investment returns comparisons suggest that not only is there no evidence of economies of scale, but there appears to be diseconomies of scale (Sy, 2010; Sy 2011).
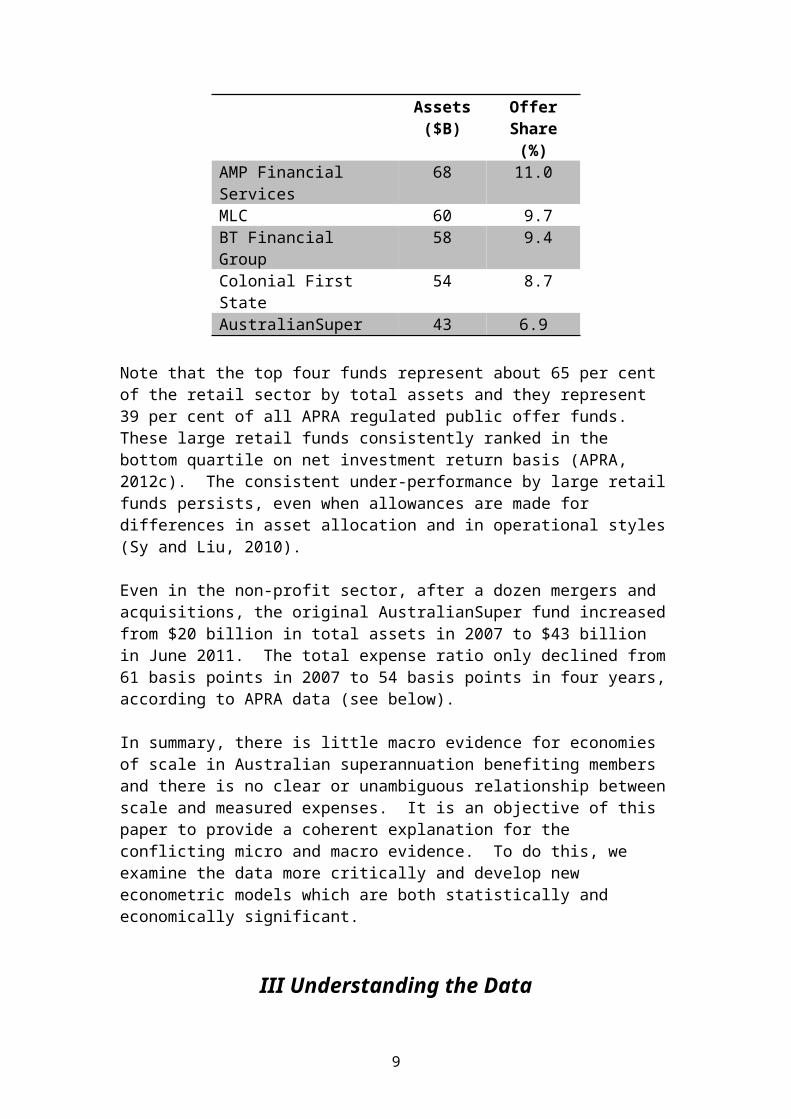
Scale also already exists in other parts of the financial services industry servicing superannuation. For example, more than 75 per cent of custody is provided by two custodians and 80 per cent of auditing is provided by three auditors (Liu and Arnold, 2010). Moreover, there are already several large superannuation funds (groups) in Australia. The top five largest funds by total assets are shown in Table 1 below.
Table 1: Top Five Superannuation Funds By Total Assets (2011)
Fund Total Assets ($B)
Public Offer Share (%)
AMP Financial Services 68 11.0MLC 60 9.7BT Financial Group 58 9.4Colonial First State 54 8.7AustralianSuper 43 6.9
Note that the top four funds represent about 65 per cent of the retail sector by total assets and they represent 39 per cent of all APRA regulated public offer funds. These large retail funds consistently ranked in the bottom quartile on net investment return basis (APRA, 2012c). The consistent under-performance by large retail funds persists, even when allowances are made for differences in asset allocation and in operational styles (Sy and Liu, 2010).
Even in the non-profit sector, after a dozen mergers and acquisitions, the original AustralianSuper fund increased from $20 billion in total assets in 2007 to $43 billion in June 2011. The total expense ratio only declined from 61 basis points in 2007 to 54 basis points in four years, according to APRA data (see below).
In summary, there is little macro evidence for economies of scale in Australian superannuation benefiting members and there is no clear or unambiguous relationship between scale and measured expenses. It is an objective of this paper to provide a coherent explanation for the conflicting micro and macro evidence. To do this, we examine the data more critically and develop new econometric models which are both statistically and economically significant.
III Understanding the Data
As the regulator of superannuation funds, the Australian Prudential Regulation Authority (APRA) has the legislative power to collect accurate, audited accounting
6
data for the full population of regulated, institutional funds (APRA, 2012b). The data are high quality and free from sampling bias. But expenses reported and captured in the dataset only include expenses incurred and paid by the superannuation funds. Therefore the data is incomplete because they represent only the last layer of fees and costs in a multi-layered superannuation structure, as we explain below.
(i) Direct and Indirect Expenses
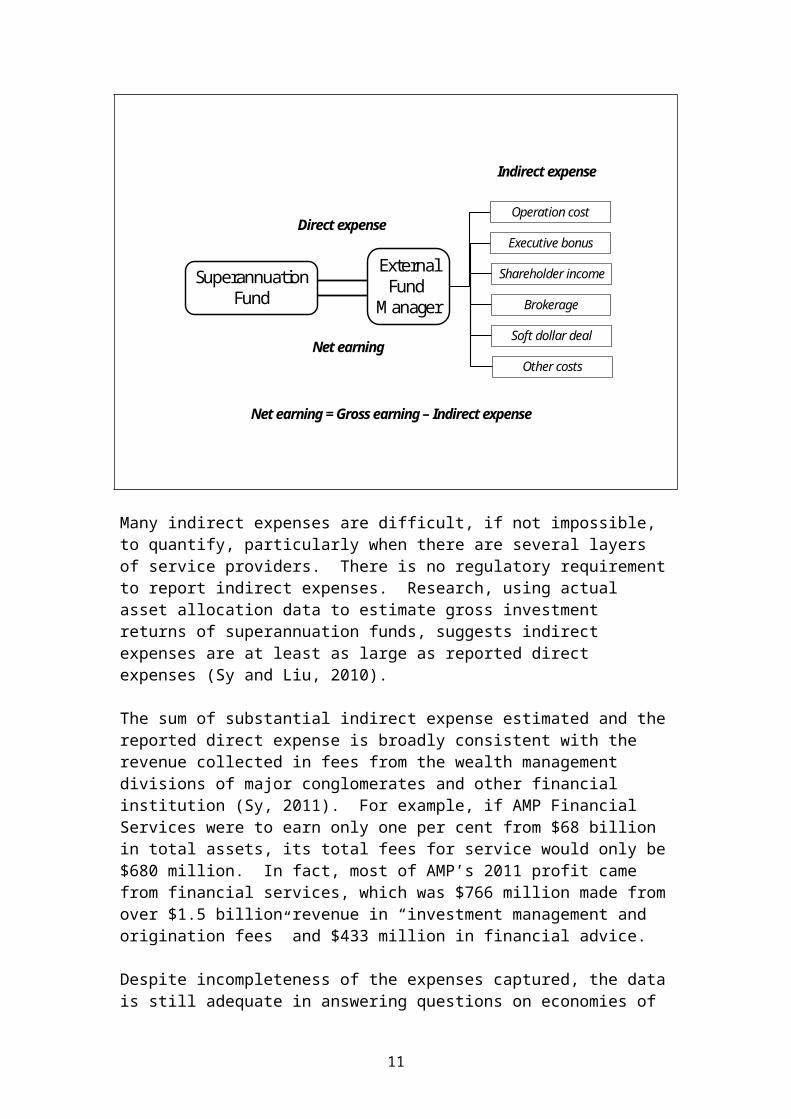
Figure 1 illustrates a schematic relationship in the most basic cost structure between a superannuation fund and one of its service providers, in this case, an external fund manager. Payments to the external fund manager are the direct expenses reported in the APRA data. In the course of investing funds by the external manager, expenses incurred on behalf of the superannuation fund are not reported in the data. Instead, the manager passes the expenses indirectly to the superannuation fund by subtracting expenses from the gross investment earnings and thus delivering a net investment earning to the fund.
Figure 1: Expenses in a basic superannuation fund-of-funds Structure
Operation cost
Executive bonus
Brokerage
Soft dollar deal
Shareholder income
Other costs
ExternalFund
Manager
SuperannuationFund
Direct expense
Indirect expense
Net earning = Gross earning – Indirect expense
Net earning
Many indirect expenses are difficult, if not impossible, to quantify, particularly when there are several layers of service providers. There is no regulatory requirement to report indirect expenses. Research, using actual asset allocation data to estimate gross investment returns of superannuation funds, suggests indirect expenses are at least as large as reported direct expenses (Sy and Liu, 2010).
The sum of substantial indirect expense estimated and the reported direct expense is broadly consistent with the revenue collected in fees from the wealth management divisions of major conglomerates and other financial institution (Sy, 2011). For
7
example, if AMP Financial Services were to earn only one per cent from $68 billion in total assets, its total fees for service would only be $680 million. In fact, most of AMP’s 2011 profit came from financial services, which was $766 million made from over $1.5 billion revenue in “investment management and origination fees” and $433 million in financial advice.
Despite incompleteness of the expenses captured, the data is still adequate in answering questions on economies of scale, because the data accurately capture fixed costs at the superannuation fund level. The indirect expenses are variable costs from the point of view of the superannuation fund.
Reported direct expense is expected to be accurate except where the superannuation fund and the external fund manager are related through a common parent. In such situations, related parties can adjust net earnings to reflect the actual fee paid to the fund manager, leading to inaccurate reported expenses which account for the data pathology found in the statistics.
In this paper, we will model the fixed and variable components of reported total expenses, which are defined as the sum of total operating and investment expenses, contained in Table 1 to Table 8, for each year 2004 to 2011 (APRA, 2012b). We focus only on total expenses (excluding tax) because superannuation funds may have difficulties in accurately breaking up total expenses into operating and investment expenses, in common with overseas experiences (Bikker and de Dreu, 2010).
(ii) General Statistics
The APRA fund-level data cover 2004-2011 annual financial records of all regulated funds, some of which would have been in the process of being wound up (APRA, 2012b). To reduce the probability of data noise, we select funds with (1) positive total expense, (2) greater than 100 members and (3) greater than $10 million in total assets. With these selection criteria, the maximum dataset reduces to 2757 annual financial performance records. The 2011 dataset reduces to 215 data records.
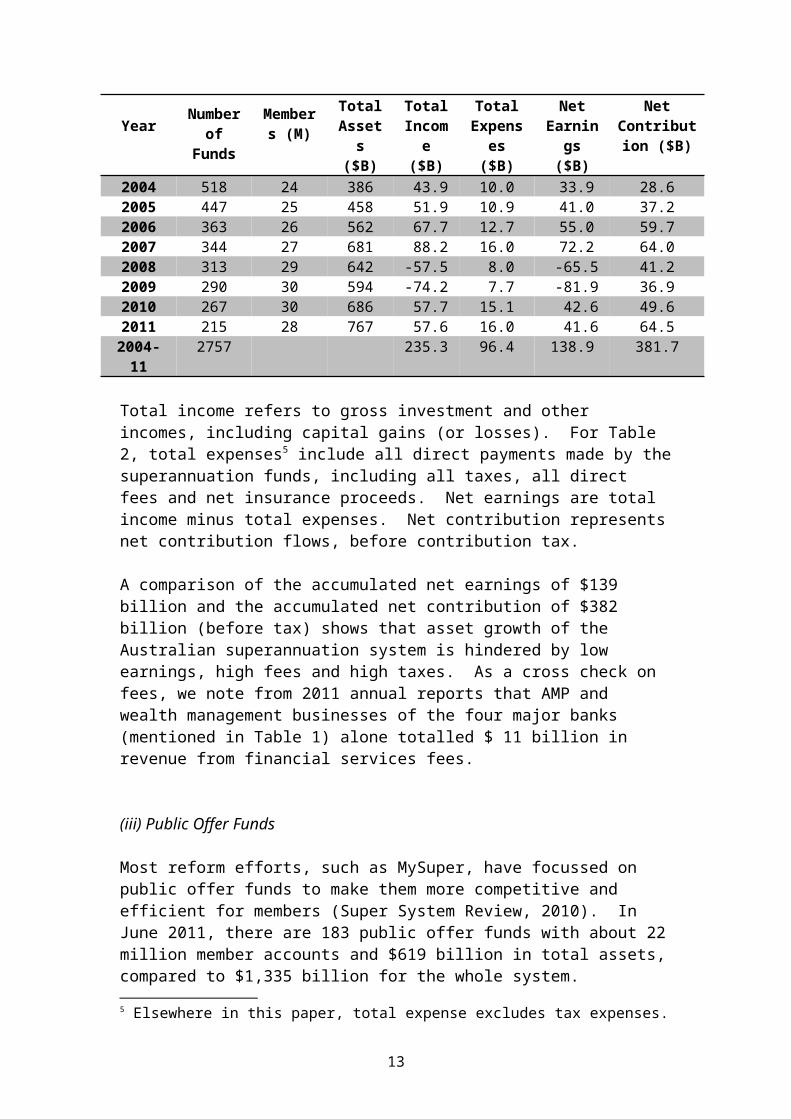
Table 2 provides a summary of the general statistics of the selected dataset. We note that for 2011, the $767 billion in total assets represent over 86 per cent of total institutional assets.
Table 2: Summary statistics for the selected dataset of Superannuation funds 2004-2011
YearNumber of Funds
Members (M)
Total Assets
($B)
Total Income
($B)
Total Expenses
($B)
Net Earnings
($B)
Net Contribution
($B)2004 518 24 386 43.9 10.0 33.9 28.62005 447 25 458 51.9 10.9 41.0 37.22006 363 26 562 67.7 12.7 55.0 59.72007 344 27 681 88.2 16.0 72.2 64.02008 313 29 642 -57.5 8.0 -65.5 41.22009 290 30 594 -74.2 7.7 -81.9 36.92010 267 30 686 57.7 15.1 42.6 49.6
8
2011 215 28 767 57.6 16.0 41.6 64.52004-11 2757 235.3 96.4 138.9 381.7
Total income refers to gross investment and other incomes, including capital gains (or losses). For Table 2, total expenses5 include all direct payments made by the superannuation funds, including all taxes, all direct fees and net insurance proceeds. Net earnings are total income minus total expenses. Net contribution represents net contribution flows, before contribution tax.
A comparison of the accumulated net earnings of $139 billion and the accumulated net contribution of $382 billion (before tax) shows that asset growth of the Australian superannuation system is hindered by low earnings, high fees and high taxes. As a cross check on fees, we note from 2011 annual reports that AMP and wealth management businesses of the four major banks (mentioned in Table 1) alone totalled $ 11 billion in revenue from financial services fees.
(iii) Public Offer Funds
Most reform efforts, such as MySuper, have focussed on public offer funds to make them more competitive and efficient for members (Super System Review, 2010). In June 2011, there are 183 public offer funds with about 22 million member accounts and $619 billion in total assets, compared to $1,335 billion for the whole system.
Public offer funds are divided into two main categories: non-profit and retail.Non-profit funds are defined as non-retail public offer funds and they come mainly from the industry sector, but may also include some funds from both the corporate and the public sectors.
Retail superannuation funds are run by for-profit commercial enterprises, which are currently dominated by financial conglomerates such as major Australian banks and insurance companies. It is a basic tenet of market capitalism that cost savings such as those from economies of scale are captured as increased profits and should have no immediate impact on prices or fees, which are to be determined in the market place through competition in supply and demand.
Indeed, the APRA survey on superannuation trustee governance policy and practice has revealed significant differences between retail and other public offer funds (Sy et al., 2008). More than half of retail trustee directors are employed by related parties or by the fund itself in a group. They are paid considerably more for their trustee services than trustee directors in the other sectors. The ability of retail funds to transfer costs between related parties may lead to inaccurate reporting of expenses, which appear in the collected data.
In general, we expect the data for non-profit funds to be more accurate due to reduced levels of potential conflicts of interest, though the situation may be changing when industry funds have been creating their own external fund management services, in a manner similar to those in the retail sector (Brown and Davis, 2009). The extent to
5 Elsewhere in this paper, total expense excludes tax expenses.
9
which the data may be compromised appears limited judging by the absence of statistical pathology in our analysis.
IV Econometric Model of Cost
Unlike the cited econometric models, which have hypothetical functional forms, not based on economic theory or practice, we develop here models which are based on how costs are actually incurred in running superannuation funds. Linear models are developed to estimate costs, while nonlinear models are developed for sensitivity analysis.
(i) The Linear Cost Model
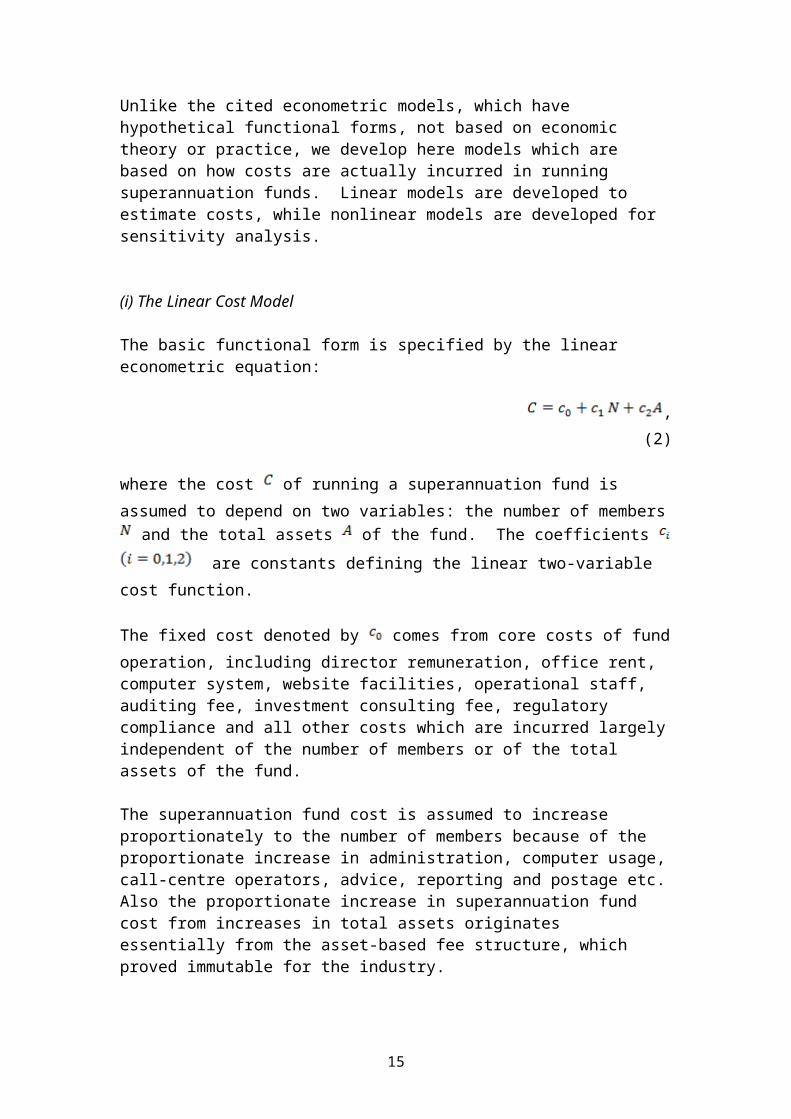
The basic functional form is specified by the linear econometric equation:
, (2)
where the cost of running a superannuation fund is assumed to depend on two
variables: the number of members and the total assets of the fund. The
coefficients are constants defining the linear two-variable cost function.
The fixed cost denoted by comes from core costs of fund operation, including director remuneration, office rent, computer system, website facilities, operational staff, auditing fee, investment consulting fee, regulatory compliance and all other costs which are incurred largely independent of the number of members or of the total assets of the fund.
The superannuation fund cost is assumed to increase proportionately to the number of members because of the proportionate increase in administration, computer usage, call-centre operators, advice, reporting and postage etc. Also the proportionate increase in superannuation fund cost from increases in total assets originates essentially from the asset-based fee structure, which proved immutable for the industry.
Adding more explanatory variables which might be relevant for superannuation cost does not necessarily improve the model, because inherent correlation of many variables and poor quality data will increase noise. The simple models we have adopted have high statistical and economic significance, because we use high quality data with clear economic interpretations. Moreover, their additive property allows the derivation of aggregate cost functions for the whole sector.
(ii) Cost Data Selection
10
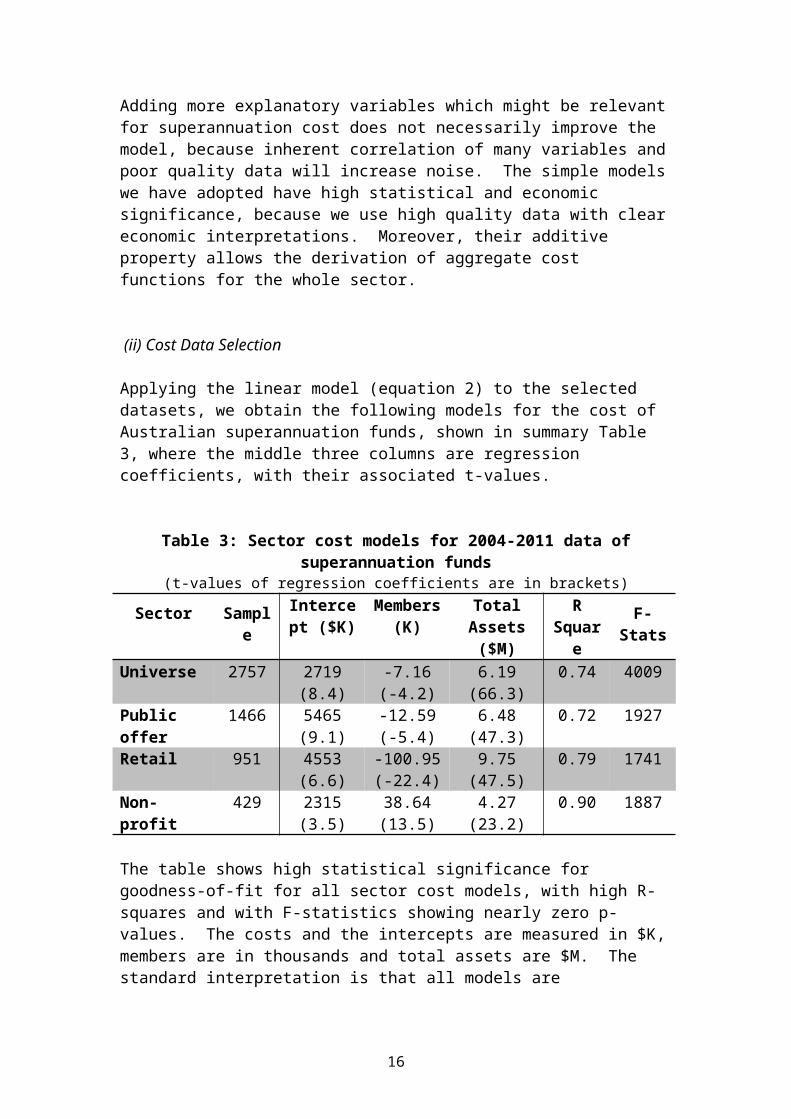
Applying the linear model (equation 2) to the selected datasets, we obtain the following models for the cost of Australian superannuation funds, shown in summary Table 3, where the middle three columns are regression coefficients, with their associated t-values.
Table 3: Sector cost models for 2004-2011 data of superannuation funds(t-values of regression coefficients are in brackets)
Sector Sample Intercept ($K)
Members (K)
Total Assets ($M)
R Square
F-Stats
Universe 2757 2719(8.4)
-7.16(-4.2)
6.19(66.3)
0.74 4009
Public offer 1466 5465(9.1)
-12.59(-5.4)
6.48(47.3)
0.72 1927
Retail 951 4553(6.6)
-100.95(-22.4)
9.75(47.5)
0.79 1741
Non-profit 429 2315(3.5)
38.64(13.5)
4.27(23.2)
0.90 1887
The table shows high statistical significance for goodness-of-fit for all sector cost models, with high R-squares and with F-statistics showing nearly zero p-values. The costs and the intercepts are measured in $K, members are in thousands and total assets are $M. The standard interpretation is that all models are statistically significant. This standard conclusion is false because required assumptions are not satisfied.
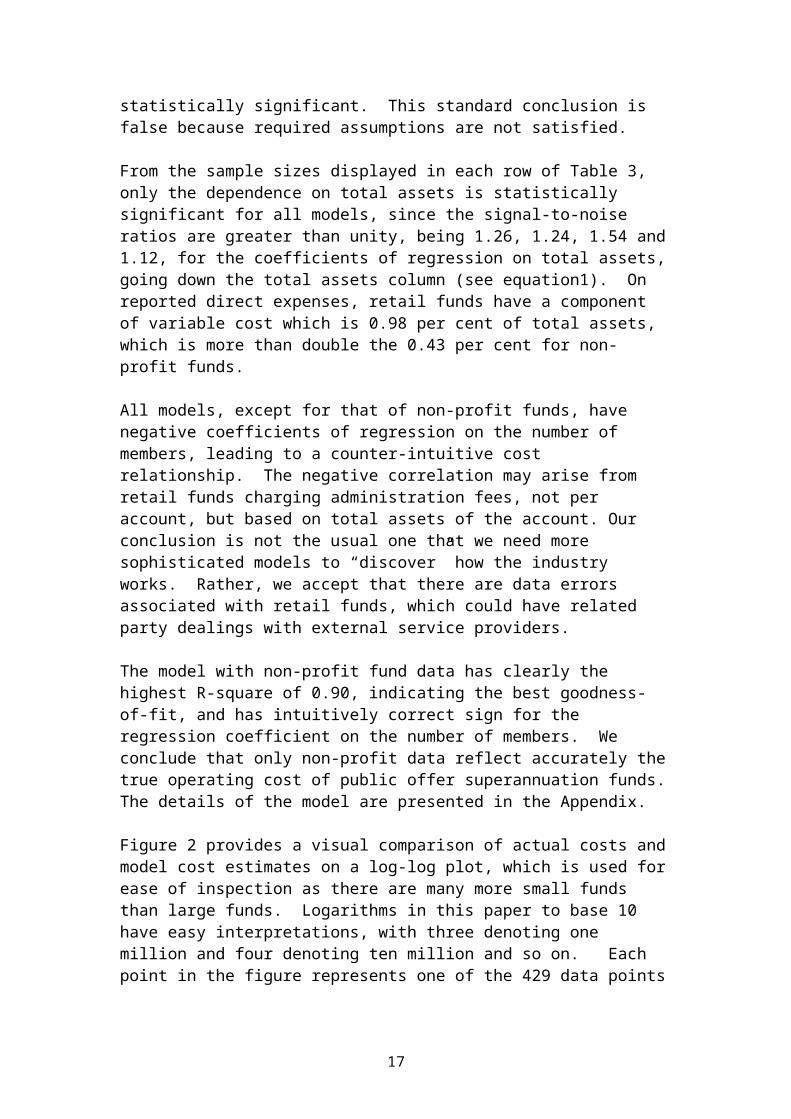
From the sample sizes displayed in each row of Table 3, only the dependence on total assets is statistically significant for all models, since the signal-to-noise ratios are greater than unity, being 1.26, 1.24, 1.54 and 1.12, for the coefficients of regression on total assets, going down the total assets column (see equation1). On reported direct expenses, retail funds have a component of variable cost which is 0.98 per cent of total assets, which is more than double the 0.43 per cent for non-profit funds.
All models, except for that of non-profit funds, have negative coefficients of regression on the number of members, leading to a counter-intuitive cost relationship. The negative correlation may arise from retail funds charging administration fees, not per account, but based on total assets of the account. Our conclusion is not the usual one that we need more sophisticated models to “discover” how the industry works. Rather, we accept that there are data errors associated with retail funds, which could have related party dealings with external service providers.
The model with non-profit fund data has clearly the highest R-square of 0.90, indicating the best goodness-of-fit, and has intuitively correct sign for the regression coefficient on the number of members. We conclude that only non-profit data reflect accurately the true operating cost of public offer superannuation funds. The details of the model are presented in the Appendix.
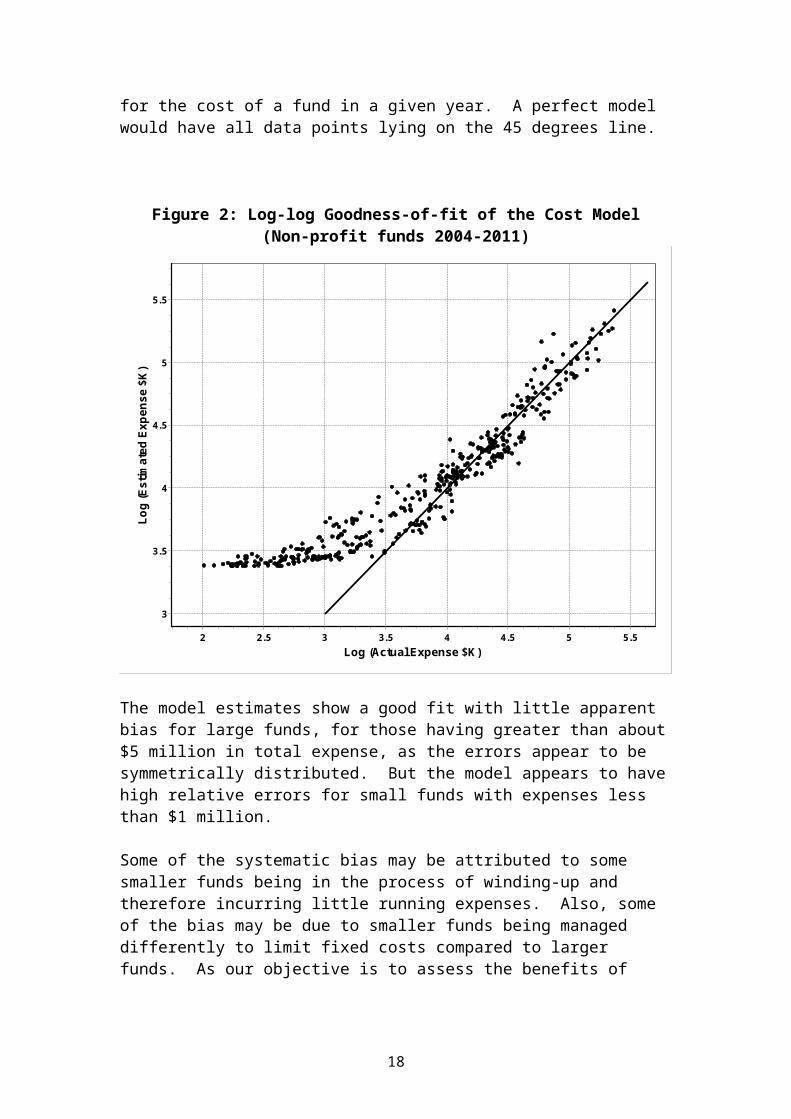
Figure 2 provides a visual comparison of actual costs and model cost estimates on a log-log plot, which is used for ease of inspection as there are many more small funds than large funds. Logarithms in this paper to base 10 have easy interpretations, with
11
three denoting one million and four denoting ten million and so on. Each point in the figure represents one of the 429 data points for the cost of a fund in a given year. A perfect model would have all data points lying on the 45 degrees line.
Figure 2: Log-log Goodness-of-fit of the Cost Model (Non-profit funds 2004-2011)
Log (Actual Expense $K)5.554.543.532.52
Log
(Est
imat
ed E
xpen
se $
K)
5.5
5
4.5
4
3.5
3
The model estimates show a good fit with little apparent bias for large funds, for those having greater than about $5 million in total expense, as the errors appear to be symmetrically distributed. But the model appears to have high relative errors for small funds with expenses less than $1 million.
Some of the systematic bias may be attributed to some smaller funds being in the process of winding-up and therefore incurring little running expenses. Also, some of the bias may be due to smaller funds being managed differently to limit fixed costs compared to larger funds. As our objective is to assess the benefits of merging to form very large funds, we are less concerned with model inaccuracies for small funds.
Does the apparent nonlinearity lead to diseconomies of scale as fund size increase?
V Sensitivity Analysis
12
Our linear model assumes that the coefficients of regression are constant, implying nonlinearities are unimportant. This and other implicit assumptions need to be checked to ensure that our conclusions drawn from using the model are not sensitive to those assumptions. We will check the impact of the regression coefficients on variable dependence and on time dependence.
(i) A Nonlinear Model
A nonlinear model is used to assess the impact of the coefficients not strictly constant, but dependent on the variables. We consider a functional form which is nonlinear in the explanatory variables:
(3)
This equation is an enhanced version of equation (2) with added nonlinear terms with coefficients , which can be interpreted as allowing the linear coefficients of equation (2) to have some dependence on the explanatory variables.
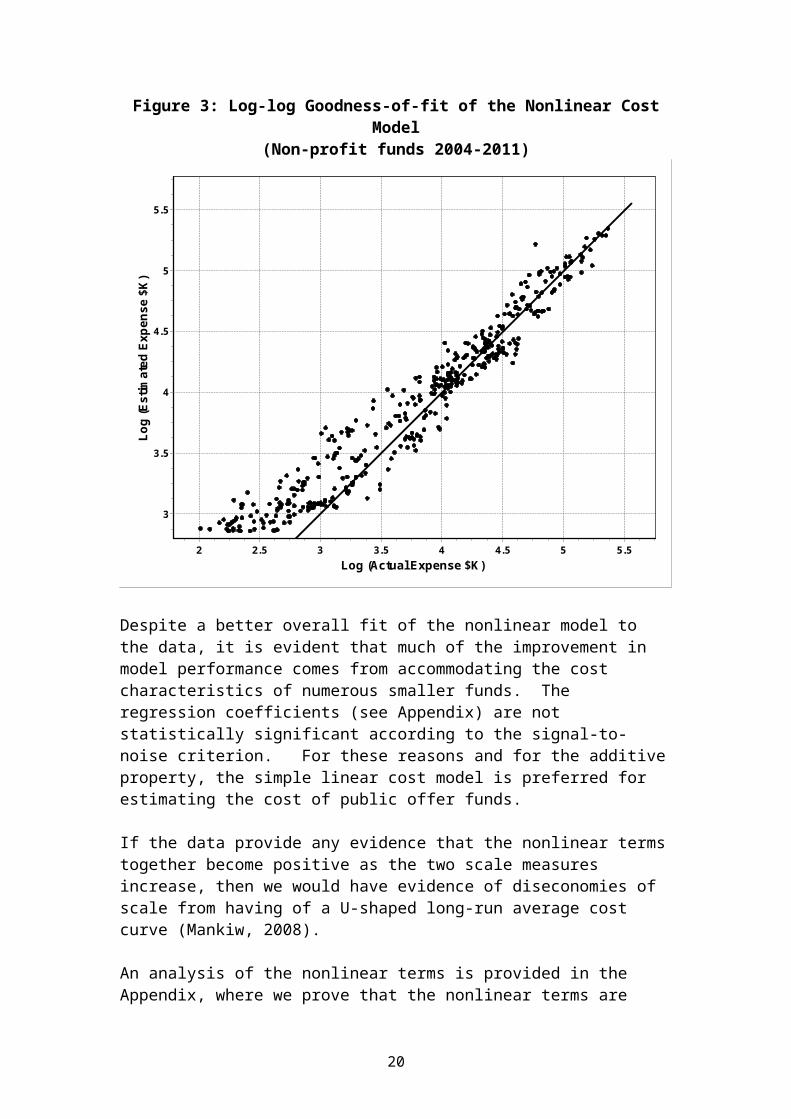
Details of the nonlinear cost model are presented in the Appendix. Figure 3 shows that the goodness-of-fit improves substantially for small funds and the R-square of this model also improves to 0.92, with an F-statistics of 978.
Figure 3: Log-log Goodness-of-fit of the Nonlinear Cost Model(Non-profit funds 2004-2011)
Log (Actual Expense $K)5.554.543.532.52
Log
(Est
imat
ed E
xpen
se $
K)
5.5
5
4.5
4
3.5
3
13
Despite a better overall fit of the nonlinear model to the data, it is evident that much of the improvement in model performance comes from accommodating the cost characteristics of numerous smaller funds. The regression coefficients (see Appendix) are not statistically significant according to the signal-to-noise criterion. For these reasons and for the additive property, the simple linear cost model is preferred for estimating the cost of public offer funds.
If the data provide any evidence that the nonlinear terms together become positive as the two scale measures increase, then we would have evidence of diseconomies of scale from having of a U-shaped long-run average cost curve (Mankiw, 2008).
An analysis of the nonlinear terms is provided in the Appendix, where we prove that the nonlinear terms are always negative, regardless of the sizes of scale, making the nonlinear terms always negative. Hence the available empirical data provide no evidence of diseconomies of scale. This raises the possibility that superannuation is a natural monopoly, much like other social infrastructure such as telecommunications and energy.
(i) Time Variations
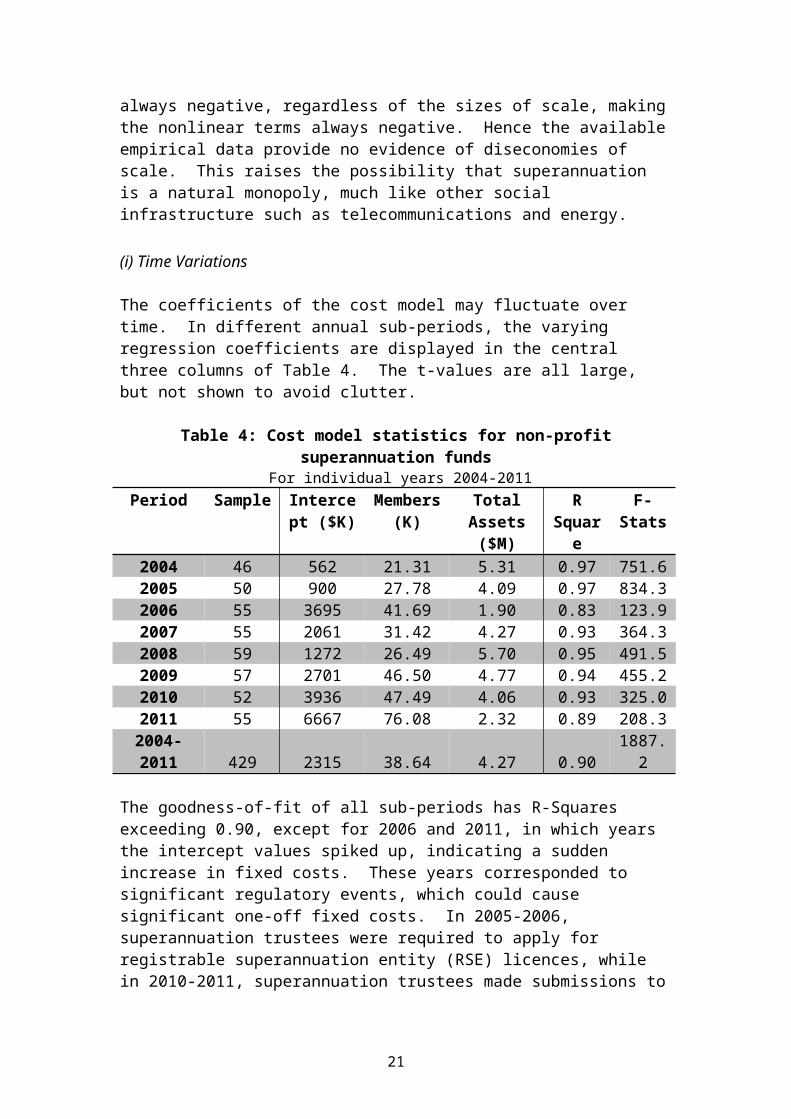
The coefficients of the cost model may fluctuate over time. In different annual sub-periods, the varying regression coefficients are displayed in the central three columns of Table 4. The t-values are all large, but not shown to avoid clutter.
Table 4: Cost model statistics for non-profit superannuation funds For individual years 2004-2011
Period Sample Intercept ($K)
Members (K)
Total Assets ($M)
R Square
F-Stats
2004 46 562 21.31 5.31 0.97 751.62005 50 900 27.78 4.09 0.97 834.32006 55 3695 41.69 1.90 0.83 123.92007 55 2061 31.42 4.27 0.93 364.32008 59 1272 26.49 5.70 0.95 491.52009 57 2701 46.50 4.77 0.94 455.22010 52 3936 47.49 4.06 0.93 325.02011 55 6667 76.08 2.32 0.89 208.3
2004-2011 429 2315 38.64 4.27 0.90 1887.2
The goodness-of-fit of all sub-periods has R-Squares exceeding 0.90, except for 2006 and 2011, in which years the intercept values spiked up, indicating a sudden increase in fixed costs. These years corresponded to significant regulatory events, which could cause significant one-off fixed costs. In 2005-2006, superannuation trustees were required to apply for registrable superannuation entity (RSE) licences, while in 2010-2011, superannuation trustees made submissions to the government, in response to implementing the reforms recommended by the Super System Review (2010).
14
Despite year to year fluctuations in superannuation cost, there appears no systematic trend. The average cost over the whole period probably represents the best, unbiased estimate of the typical cost of a public offer fund. We will discuss the economic implications of the cost model, assuming that the underlying operations in future remain similar to the past several years.
VI Economic Significance of Scale
To assess the economic significance of scale, the cost model can be used to estimate the impact of increased scale on members and on the industry under the stimulus of regulatory reform to encourage fund mergers.
(i) Member Expense Ratios
The total cost charged to superannuation members is usually expressed as the expense ratio, which is subtracted from the gross investment return to obtain the net investment return, which is what really matters for members. The expense ratio is considered as a function of two variables: the member’s account balance and the investment option chosen by the member.
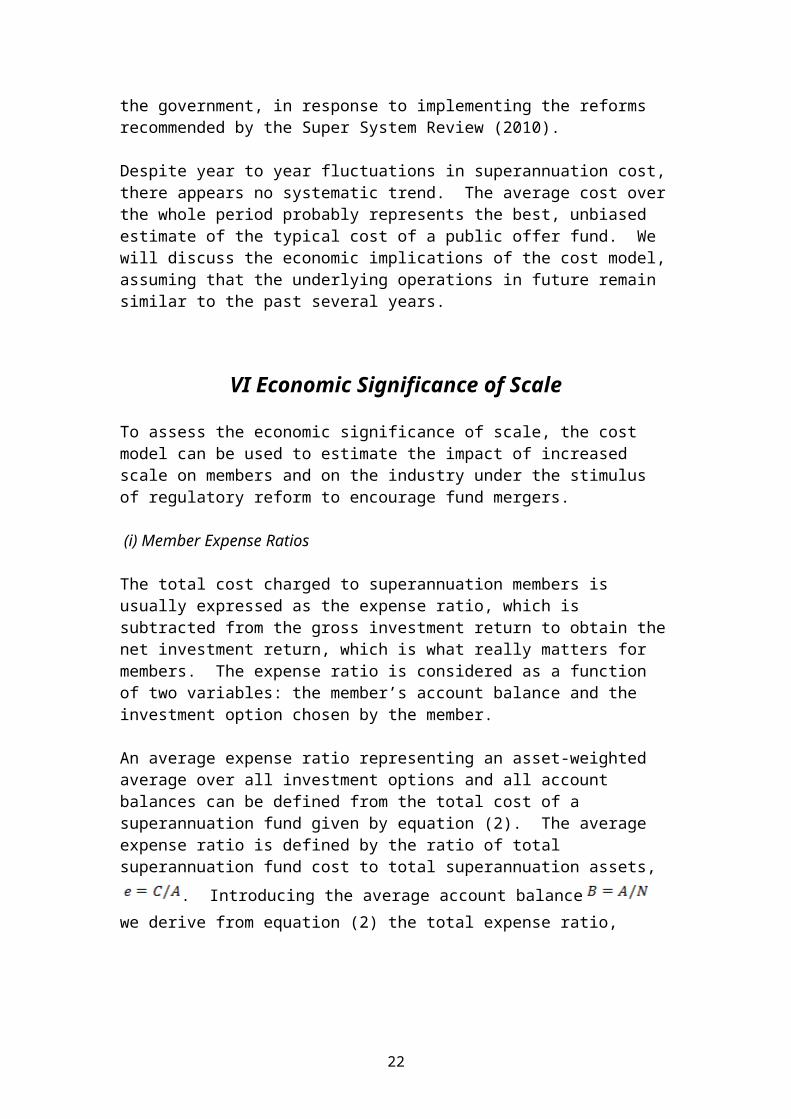
An average expense ratio representing an asset-weighted average over all investment options and all account balances can be defined from the total cost of a superannuation fund given by equation (2). The average expense ratio is defined by the ratio of total superannuation fund cost to total superannuation assets, .
Introducing the average account balance we derive from equation (2) the total expense ratio,
. (4)
It is clear that the benefits of economies of scale for superannuation members originate from defraying the fixed cost and member administration cost over total assets under management, represented by the first two terms in equation (4). In previous statistical studies of scale (cited above), investment returns on assets have been assumed mostly to dependent functionally on , whereas economic logic
suggests it should depend on . That is, the functional dependence of investment return on assets is hyperbolic and not logarithmic.
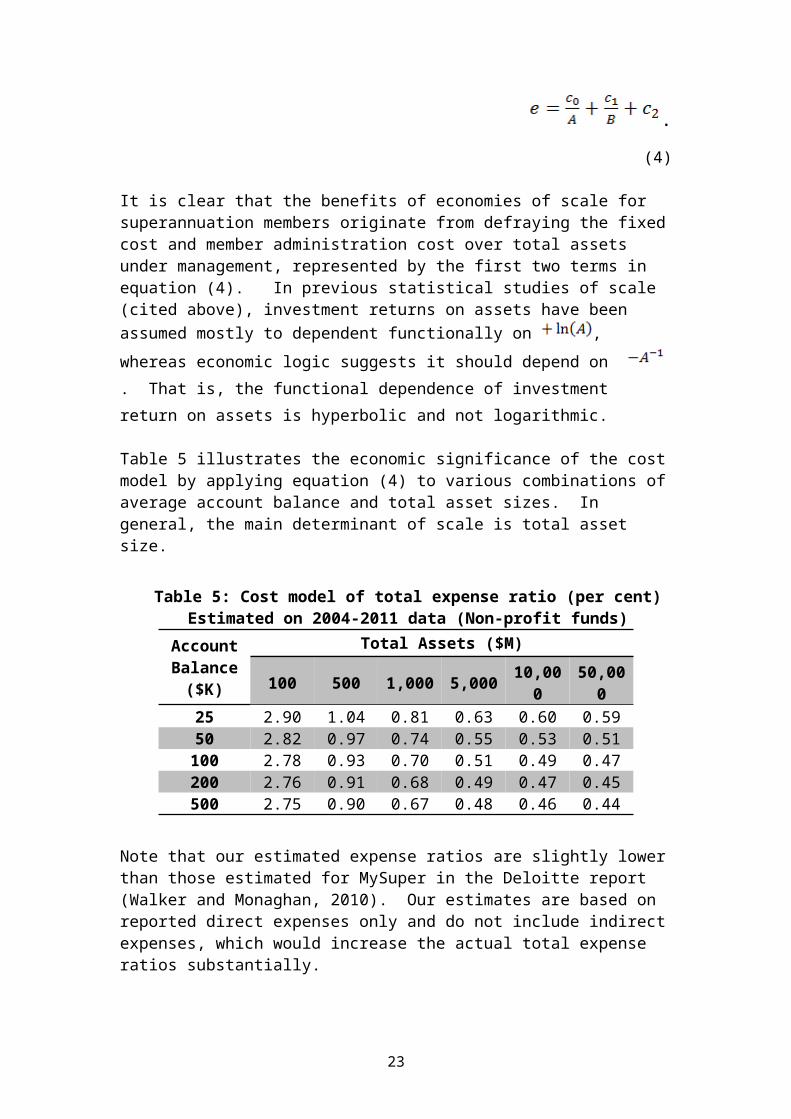
Table 5 illustrates the economic significance of the cost model by applying equation (4) to various combinations of average account balance and total asset sizes. In general, the main determinant of scale is total asset size.
Table 5: Cost model of total expense ratio (per cent) Estimated on 2004-2011 data (Non-profit funds)
Account Total Assets ($M)
15
Balance ($K) 100 500 1,000 5,000 10,000 50,000
25 2.90 1.04 0.81 0.63 0.60 0.5950 2.82 0.97 0.74 0.55 0.53 0.51
100 2.78 0.93 0.70 0.51 0.49 0.47200 2.76 0.91 0.68 0.49 0.47 0.45500 2.75 0.90 0.67 0.48 0.46 0.44
Note that our estimated expense ratios are slightly lower than those estimated for MySuper in the Deloitte report (Walker and Monaghan, 2010). Our estimates are based on reported direct expenses only and do not include indirect expenses, which would increase the actual total expense ratios substantially.
The results show rapidly diminishing return to scale, beyond fund total assets of $10 billion. In general, we expect the merger of ten $1 billion funds to provide greater benefit for their members than the merger of two $5 billion funds for their members.
(ii) Benefits of Fund Mergers
Fund mergers have potential benefits for public offer funds only in the non-profit sector. Table 7 puts the potential impact of fund mergers into perspective by showing the size and composition of the public offer sector.
Table 7: Public Offer Funds Statistics Sector Number of
FundsMembers
(M)Total
Assets ($B)Public Offer 183 21.6 619Retail 143 10.3 364Non-profit 40 11.3 255
To assess the impact of fund mergers for members, we consider hypothetical scenarios of development in the non-profit sector, taking advantage of the additive property of our model cost function. We compare four scenarios varying with industry consolidation and natural asset growth in Table 8.
Table 8: Estimates of total expense ratio (per cent) for Various Scenarios for institutional funds
No of Funds
No of Accounts
(M)
Institution Assets
($B)
Av No of Accounts
(K)
Av Account Balance
($K)
Av Fund Cost ($B)
Av Expense Ratio (%)
40 11 255 275 23 1.6 0.6310 6 255 600 43 1.3 0.5340 11 510 275 46 2.7 0.5310 6 510 600 85 2.4 0.48
16
The first line is a good description of Australian non-profit public-offer superannuation as at June 2011 (APRA, 2012a), with about 40 regulated funds, $255 billion in total assets and 11 million member accounts. The average reported expense ratio for the industry is 63 basis points. If there were an instantaneous, costless consolidation to reduce the non-profit public-offer sector to 10 funds and nearly halving the number of accounts, the average reported expense ratio would be reduced to 53 basis points.
If there is no consolidation, then with contribution flows and earnings growth, the total assets of the funds may be expected to double by the end of the decade to $510 billion. In this scenario (third line), the average reported expense ratio would fall, by natural asset growth, to 53 basis points. The corresponding scenario for a consolidated industry would have an average reported expense ratio of 48 basis points.
Considering that a contraction of 40 funds to 10 funds is quite dramatic for the industry, one might want to know why the benefit to superannuation fund members is not more dramatic. To understand this apparently modest benefit, we analyse the superannuation cost into dollar components in Table 9.
Table 9: Analysis of Superannuation Cost ($ billion) Various Scenarios for institutional funds
Industry Cost ($B)No of Funds
No of Accounts (M)
Total Assets ($B)
Industry Total
Fixed Variable Admin
Variable Investment
40 11 255 1.6 0.09 0.43 1.110 6 255 1.3 0.02 0.23 1.140 11 510 2.7 0.09 0.43 2.210 6 510 2.4 0.02 0.23 2.2
Comparing the first two scenarios, we note that instant consolidation would produce annual savings of $70 million in fixed costs and $200 million in variable administrative costs, bringing the total savings per year to $270 million, assuming MySuper regulation benefits the whole non-profit sector. This benefit for members is small and fixed compared to increasing fees paid to financial intermediaries, valued at $2.4 billion, with a gain of $1.1 billion, by the end of the decade, when total assets are expected to double.
This potential savings from fund mergers are much smaller even than the $1 billion expected annual savings from SuperStream, which is the other major government reform initiative to improve superannuation back-offices (Super System Review, 2010). The reason for the low impact of scale is that fixed costs currently account for less than 6 per cent of reported costs of non-profit public offer funds. Percentage fixed cost falls even further as total assets increase. It is clear that industry consolidation would have only limited benefit for superannuation members, unless the superannuation industry restructures radically.
17
VII Conclusions
We have shown that there is generally no valid relationship between scale and expense efficiency for beneficiaries in Australian superannuation. The largest government fund with $75 billion in total assets has an expense ratio of 72 basis points, while over 150,000 self-managed funds each with less $2 million in total assets have expense ratios of less than 25 basis points.
There are already many large retail superannuation funds in Australia, each with total assets greater than $50 billion. In retail superannuation, prices or fees are set by the market under competition and any cost savings, such as from economies of scale, are captured as profits. Therefore regulatory reform on scale would benefit only shareholders and not members of retail superannuation funds. Competition from MySuper is unlikely to benefit retail members because fee disclosure cannot be accurate and product heterogeneity makes simple comparisons difficult, leading to ineffective competition.
Economies of scale are expected to benefit superannuation members of the non-profit sector only. But because of substantial outsourcing with multi-layered intermediaries, non-profit funds have little control over expenses and therefore suffer from high variable costs. The relatively low fixed costs limit the benefits of economies of scale to members, with large funds facing rapidly diminishing returns to scale.
A contraction of 40 funds to 10 funds would save the non-profit sector (and the superannuation system) less than a few hundred million dollars, unless there is more substantial restructuring of fund operations to increase internal management and decrease allocation to active equity (Sy and Liu, 2010; Sy, 2011; MacIntosh and Scheibelhut, 2012). By bringing more assets in-house and managing them passively, a superannuation fund will get more of the benefits of economies of scale, with lower costs and improve long-run net returns for members.
In summary, apart from self-managed funds, Australian superannuation is structured to pay high fees to financial intermediaries, which capture most efficiency such as economies of scale as corporate profits. Recent regulatory reform on scale will benefit superannuation members less than protect major financial conglomerates, showing that Australian institutional superannuation is still run largely to benefit financial intermediaries.
The promise of better fee disclosure as a significant regulatory reform may have the unintended consequence of misleading uninformed members into accepting erroneously that fees can be accurately disclosed6. Legislation (Super Amendment, 2012) requiring “sufficient scale” to offer the MySuper product is not well supported by the evidence presented here and is contrary to basic antitrust principles of market
6 As explained above, fee disclosure cannot be accurate even without deliberate (but legal) manipulation of reported fees of the sort mentioned by David Hartley and Brett Elvish at the 2012 CMSF conference of the Australian Institute of Superannuation Trustees.
18
competition. If a government can decide when a fund is too small to succeed, should it also decide when a fund is too big to fail?
Appendix: Cost Model Statistics
The cost model for non-profit funds is likely to reflect the true running cost of a typical public offer superannuation fund. Table A1 to Table A5 provide details of the regression model.
Table A1: Model Summary Statistics Sample Size: 429Independent variables: 2Degrees of freedom: 426Residual standard error: 11795R-Squared: 0.8986F statistics: 1887p-Value: 0
Table A2: Distribution of Model Errors
Quartile Min 1Q Median 3Q MaxResiduals: -92708 -2571 -1896 1160 72936
Table A3: Data Distributions of the Variables
Variable Median Mean St Dev Minimum Maximum
Range Max SD
Members (K) 37 181 349 0.11 1966 1965 6Total Assets ($M) 972 3011 5416 10 43384 43374 8Total Expense ($K) 8311 22147 36951 1 235794 235793 6
Table A4: Regression CoefficientsVariable Value Std Err t-Value p-Value
Intercept 2315 655 3.5 0.0004Members (K) 38.6 2.85 13.5 0Total Assets ($M) 4.26 0.18 23.2 0
Table A5: Variable CorrelationsMembers (K) Total Assets ($M) Total Expense ($K)
Members (K) 1 0.82 0.88
19
Total Assets ($M) 0.82 1 0.92Total Expense ($K) 0.88 0.92 1
Table A6 provides details of the coefficients of the nonlinear regression model. The R-Square of this model is 0.92 and the F-statistics is 978. Since the square root of the degrees of freedom is 20.6, which is larger than all t-values, the estimated coefficients are not statistically significant, according to the signal-to-noise ratio criterion.
Table A6: Nonlinear Regression CoefficientsVariable Value Std Err t-Value p-Value
Intercept 646 654 0.99 0.32Members (K) 39.6 6.01 6.50 0Total Assets ($M) 5.75 0.34 17.0 0Members Squared (K) -43.0 5.4 -8.0 0Assets Squared ($$B) -0.23 0.02 -9.9 0Assets Members ($B) 5.9 0.66 8.9 0
The regression coefficients are shown in the first column of numbers. To evaluate the impact of the nonlinear terms on the cost estimates, we note the following algebraic identity:
(A1)
From the values of the regression coefficients, we conclude that regardless of the values of the independent variables, the nonlinear terms always reduce the total cost, because and also
(A2)
References
APRA. (2012a), “Annual Superannuation Bulletin: June 2011”, APRA Statistics, published 29 February 10 2012.
APRA (2012b), “Superannuation Fund-level Profiles and Financial Performance: June 2011”, APRA Statistics, published 29 February 2012.
20
APRA (2012c), “Superannuation Fund-level Rates of Return: June 2011”, APRA Statistics, published 29 February 2012.
ATO (2012), “Self-Managed Superannuation Funds: A Statistical Overview 2009-10”, Australian Taxation Office Publication, April 2012.
Bateman, H. and Mitchell, O. S. (2004), “New Evidence on Pension Plan Design and Administrative Expenses: the Australian Experience”, Pension Economics and Finance, Vol. 3, Issue 1, pp. 63-76.
Bauer, R., Cremers M. and Frehen R. (2010), “Pension Fund Performance and Costs: Small is Beautiful”, Rotman ICPM Research Papers.
Bikker, J.A. and de Dreu, J. (2009), “Operating Costs of Pension Funds: the Impact of Scale, Governance, and Plan Design”, Pension Economics and Finance, Vol. 8, Issue 1, pp. 63-89.
Brown, C. and Davis, K. (2009), “Is Pension Funds Collaboration Possible and Sustainable? Insights from Australian Experience”, Melbourne University Research Paper.
Chen, J., Hong, H., Huang, M. and Kubik, J.D. (2004), “Does Fund Size Erode Mutual Fund Performance? The Role of Liquidity and Organization”, American Economic Review, Vol. 94, Issue 5, pp. 1276-1302.
Coleman, A., Esho, N. and Wong, M. (2006), “The Impact of Agency Costs on the Investment Performance of Australian Pension Funds”, Journal of Pension Economics and Finance, Vol. 5, Issue 3, pp. 299-324.
Cummings, J.R. (2012), “Effect of Fund Size on the Performance of Australian Superannuation Funds”, APRA Working Paper, March 2012.
Dyck, A. and Pomorski, L. (2011), “Is Bigger Better? Size and Performance in Pension Plan Management”, Research Papers of the Rotman School of Pension Management, University of Toronto.
Fama, E.F. and French, K. R. (2004), “The Capital Asset Pricing Model: Theory and Evidence”, Journal of Economic Perspectives, Vol. 13, Issue 3, pp. 25-46.
French, K.R. (2008), Presidential address: the cost of active investing, The Journal ofFinance, Vol. LXIII No. 4, pp. 1537-1573.
Future Fund (2011), Annual Report 2010-2011, Publication of the Future Fund Board of Guardians.
Higgs, H. and Worthington, A. (2010), “Economies of Scale and Scope in Australian Superannuation”, Griffith University Discussion Papers Finance, No. 2010-15.
IMF (2011), “The Challenge of Public Pension Reform in Advanced and Emerging Economies”, Fiscal Affairs Department Paper, International Monetary Fund.
21
Leamer, E.E. (1983), “Let’s Take the Con out of Econometrics”, The American Economic Review, Vol. 73, Issue 1, pp. 31-43.
Liu, K. and Arnold, B.R. (2010), “Australian superannuation outsourcing – fees, related parties and concentrated markets”, APRA Working Paper, July 2010.
MacIntosh, J. and Scheibelhut, T. (2012), “How Large Pension Funds Organize Themselves: Findings from a Unique 19-Fund Survey”, Rotman International Journal of Pension Management, Vol. 5, Issue 1, pp. 34-40.
Malhotra, D.K., Marisetty, V. and Ariff, M. (2005), "Cost Efficiencies in the Management of Australian Superannuation Funds." International Journal of Finance, Volume 17, Issue 3, pp. 3603-3621.
Mama, A., Pillay, N. and Fedderke J. (2011), “Economies of Scale and Pension Fund Plans: Evidence from South Africa”, Working Paper, No.201.
Mankiw, N.G. (2008), Principles of Economics, Fifth Edition, South-Western Cengage learning, USA.
OECD (2011), “Pension at a Glance 2011: Retirement-Income Systems in OECD and G20 Countries”, OECD Publishing.
Productivity Commission (2012),”Default superannuation funds in modern awards”, Draft Inquiry Report, Commonwealth of Australia.
Rice Warner (2005, 2007, 2008). “Superannuation Fee Report: Market Segment Analysis”, IFSA Reports, published March 2005, May 2007, December 2008.
Shaikh, A. (2005), “Nonlinear Dynamics and Pseudo-Production Functions”, Eastern Economic Journal, Vol. 31, Issue 3, pp.447-466.
Super Amendment (2012), Superannuation Legislation Amendment (Trustee Obligations and Prudential Standards) Bill 2012, The Parliament of the Commonwealth of Australia.
Super System Review (2010), Super System Review Final Report, Publication of the Commonwealth of Australia.
Swann, G.M.P. (2012), “Doubtful Significance”, Discussion Paper; available at: https://sites.google.com/site/gmpswann/doubtful-significance
Sy, W. (2010), “Cost, Performance and Portfolio Composition of Small Pension Funds in Australia”, Journal of Pension Economics and Finance, 2010, Vol.9, pp. 345-368.
Sy, W. (2011), “Redesigning Choice and Competition in Australian Superannuation”, Rotman International Journal of Pension Management, Vol. 4, Issue 1, pp. 52-61.
22
Sy, W., Inman, C. Esho, N. and Sane, R. (2008) “Superannuation Fund Governance: Trustee Policies and Practices”, APRA Insight, Vol. 1, pp. 2-17.
Sy, W. and Liu, K. (2010), “Improving the Cost Efficiency of Australia Pension Management”, Rotman International Journal of Pension Management, Vol. 3, Issue 1, pp. 38-47.
Walker, W. and Monaghan, M. (2010), “Default Fund Costs under the MySuper Proposals”, Deloitte Report to the Super System Review, 19 April 2010.
Wallis Report (1997), “Financial System Inquiry Final Report”, Publications of the Commonwealth of Australia, March 1997.
23