submitted by prime minister · budget in structural terms during the reference period, ... and for...
TRANSCRIPT


Submitted by Prime Minister
Mario Monti
and Minister of the Economy and Finance
Vittorio Grilli
Adopted by the Cabinet on 10 April 2013


MINISTERO DELL’ECONOMIA E OF THE FINANZE I
The Economic and Financial Document (EFD) is a key step of the economic-financial and budget planning cycle. It represents an opportunity to look to the past, but more importantly, to imagine the future of the country’s economic and budget policies from a European perspective.
This year, however, the preparation of the EFD comes at a particular time
with reference to the political and institutional structure of our country. Following the general elections of 24 and 25 February, procedures are now under way for the formation of a new government. As provided by the Constitution and also recalled by the President of the Republic, Giorgio Napolitano, until a new government is appointed, the outgoing Government remains in office for current affairs and for the adoption of urgent economic measures.
The presentation of the Economic and Financial Document represents a
requirement of Law 196 of 2009 (as amended by Law 39 of 2011), which the Government is required to fulfil for the country and for ensuring the compliance with the European Semester deadlines. In line with the ‘prorogatio’ phase, the outgoing Government cannot come up with future scenarios that imply legislative/policy decisions or the introduction of new, broad-based policies that have not already been agreed by Parliament. From an economic-financial perspective, the 2013 EFD assumes the objective of maintaining the balanced budget in structural terms during the reference period, as provided by the rules of the EU Stability and Growth Pact, as amended in November 2011, and confirmed by the Fiscal Compact, and as sanctioned by our Constitution. From the standpoint of structural reforms, the EFD summarises what has been done in the preceding months, and where appropriate, lists the initiatives still necessary for implementing the reforms already approved by Parliament.
The new government, once formed, will be able to integrate this framework
by presenting an agenda of reforms, if considered appropriate, along with the related financial compatibility, so as to continue progressing toward the achievement of the Europe 2020 Strategy objectives.
Even in respecting these limits, the presentation of the EFD is a fundamental
step, which allows for objectively reviewing the path of the reforms completed and for coming up with some indications about what is ahead.
First of all, the Stability Programme and the National Reform Programme
provide a snapshot of the structural reforms and transformation that have had an intensity and a reach not always fully grasped in the day-to-day news.

ECONOMIC AND FINANCIAL DOCUMENT
II MINISTERO DELL’ECONOMIA E DELLE FINANZE
At the end of 2011, Italy became vulnerable to international market tensions
due to its public finances and the conditions of the real economy. For over a decade, the economic and productive system had been experiencing a slow, but steady, decline, with flat growth rates and a progressive loss of competitiveness, due to the stagnation of productivity, an unfavourable business environment, and other structural weaknesses that hindered the adjustment to a more dynamic and competitive economic framework overall.
The experience of the so called 'national solidarity Government', supported
in Parliament by a broad majority of the leading political parties, made it possible to move beyond an impasse that had lasted for years, and to undertake, in a relatively short time period, a programme of initiatives that led Italy out of the financial emergency and impacted all the key sectors of economic and social life of the country.
As proof thereof, the Government approved 45 laws and decree-laws converted by Parliament and 24 delegated decrees coming from delegated laws adopted by this Government or by preceding governments, as well as hundreds of implementation measures that have been adopted or are in the process of being finalised, as described in the various chapters of the National Reform Programme.
This action has above all led to the rebalancing of the public finances. In
2012, Italy brought its public deficit substantially back in line with the EU's recommended level of 3 per cent or less of GDP. In addition, in 2013, Italy will achieve a balanced budget in structural terms, fulfilling a commitment undertaken in mid-2011 by the Italian government at the time. On this basis, the EU ECOFIN Council is poised to authorise, in the month of May, Italy's exit from the excessive deficit procedure that was opened at the end of 2009. Italy achieved this result without having to ask for a delay in the deadline, as other countries have done. Nor did Italy have to ask for external financial assistance, conceivably from a group of three international authorities, with the consequence of losing a part of its sovereignty and its autonomy in deciding on the measures needed for emerging from the crisis.
The solidity of the adjustment achieved by Italy is reflected in the attitude
of the international markets. The spread between interest rates on Italian government securities and German government securities is now around 300 basis points, after a peak of 574 reached in November 2011. In 2014, the primary surplus will be equal to approximately 4 per cent of GDP, thus ranking amongst the highest in the Euro Area. The fiscal consolidation has also been reinforced by rigorous action to contain and to rebalance public expenditure. The two phases of spending review will lead to savings of approximately €11.6 billion once the planned actions are implemented. After years of delays, the EU structural funds were utilised in line with the plans agreed with the Commission, thanks to targeted reshuffling within the Cohesion Action Plan and to careful management to speed up and achieve greater effectiveness of spending. Macroeconomic

ECONOMIC AND FINANCIAL DOCUMENT
MINISTERO DELL’ECONOMIA E DELLE FINANZE III
imbalances are being absorbed, while measures for ensuring a steady reduction of public debt have been put into place.
An adjustment of this magnitude, realised in a short time, and within a
context of economic weakness and recurring tensions on international markets, cannot occur without significant sacrifices and short-term economic and social consequences. Recent data show a contraction in the economy, a rise in unemployment, and social hardships. The recession that started in the second half of 2011 looks poised to continue in the first half of the current year. Without firm and credible reforms, it would have been impossible to stave off the spectre of financial collapse that was apparent in November 2011. And had action not been taken to tackle the structural weaknesses dragging the country down, the country would have been condemned to flat or negative growth again for many years to come.
The 2013 EFD shows that reforms can really change the course of the
country’s economic development. EFD estimates indicate that the competitiveness and labour market reform already implemented will lead to additional cumulative GDP growth on the order of 1.6 and 3.9 percentage points in 2015 and 2020 respectively, and up to 6.9 percentage points with respect to the long-term baseline scenario. This will translate into potential growth for the country that is approximately one percentage point of GDP greater than what would have been possible without reforms. Such a change is the thrust that the country needs in order to accelerate its exit from a crisis that has lasted too long.
POTENTIAL GROWTH RATE AND IMPACT OF STRUCTURAL REFORMS (%)
Source: MEF analyses with the ITEM and IGEM models and the production function.
Data on future growth presented in the EFD were based on prudent
assumptions. But the OECD's and IMF's quantitative studies on the macroeconomic effects of the reforms implemented in Italy indicate that such effects could be even greater than those estimated by the Government.

ECONOMIC AND FINANCIAL DOCUMENT
IV MINISTERO DELL’ECONOMIA E DELLE FINANZE
Several conditions are nevertheless necessary in order to reap the benefits of
the reforms and the sacrifices. First of all, there is a need to exploit the opportunities offered by a European framework that is currently more favourable to investments for growth and employment. In addressing the pressure exerted at European level, with the Government and Parliament on a united front, in March 2013, the European Council acknowledged the need for using all of the existing margins within the Stability and Growth Pact for making it possible to stimulate productive public investments in Member States with sound public finances. European Commission's willingness to consider Italy's one-off transaction to repay past-due commercial debts of the public administration is a step in this direction.
Compared with the most acute phase of the financial crisis in late 2011 and
early 2012, when decisions had to be made without delay, it is now possible to lay out a more detailed strategy that combines sustainable reduction of excessive debt with reforms for removing structural barriers, stimulating productivity, and reinstating productive public investments. In this regard, in recent days, the Government has been able to authorise the payment of public administrations' past-due commercial debts due to businesses. This measure will contribute not only to easing pre-existing critical situations, but also to injecting more than €40 billion into the economy, thus reducing the pressure on firms in difficulty due to the credit crunch.
While capitalising on these opportunities, it will be nonetheless crucial to
keep the guard up on the public-finance front. On the one hand, being part of the group of 'virtuous' countries is the necessary premise for making use of the leeway that is becoming available at a European level. On the other hand, the reduction of the debt, which is at an excessively high level, is the only road toward reducing interest costs and avoiding pressure from financial markets.
Only by staying in the preventive arm of the Stability and Growth Pact will it
be possible to obtain the margins for completing the payment of PA's past-due commercial debts beyond the resources already mobilised, and to introduce other initiatives, such as reducing taxation on earned income, providing incentives for stable and high-quality employment, or investing in education, research and innovation.
Finally, it is essential to confirm the reforms already in place. Italy is still
far away from the objectives set within the framework of the Europe 2020 Strategy, especially with regard to employment, the support of research and development, and the reduction of poverty. Productivity trends are unacceptable. It is thus not the time to loosen the grip. If anything, it is necessary to speed up actions to avoid losing ground. There are no other recipes but reforms in order to get Italy back to growing competitiveness and productivity.
The National Reform Programme does not contain, and could not contain this
year, an agenda of priorities for the future. Instead, it provides an analysis of

ECONOMIC AND FINANCIAL DOCUMENT
MINISTERO DELL’ECONOMIA E DELLE FINANZE V
what has been done and of the preliminary results, indicating the areas of greatest need for future intervention. There is a need to continue with spending reviews, fight against tax evasion, and sell off public sector real estate, the last of which can ensure margins for high-priority policy measures while steadily reducing debt. The fiscal system needs to be reformed in order to make it less complicated and more growth-oriented, initiating as soon as possible a gradual reduction in fiscal pressure. Much remains to be done in the labour market in order to strengthen active labour policies, increase the participation rate of women and young people in the labour market, promote wage bargaining decentralisation, and reduce the burden of taxation. Training, research and innovation are the areas of weakness on which the efforts should be concentrated. The fight against poverty requires a specific effort and priority attention, albeit in view of limited resources. It is necessary to improve the regulatory environment for businesses, and thus, Italy's attractiveness for investments from abroad, and the access to credit. In many areas, continuing and completing reforms already introduced is of essence so as to allow them to fully wield their economic effects. This is the case of the civil justice system, deregulation, the digital agenda, and the new system for start-ups. In other sectors, such as export subsidies, energy policy, and airport and tourism structures, the general strategies already approved will need to be translated into concrete actions.
Closing of the gap versus the Europe 2020 Strategy objectives is even more
important at a time of political debate about the programme for the new legislature. The Stability and Growth Pact rules, the Europe 2020 Strategy objectives, and the Annual Growth Survey priorities are a reference framework that puts aside ideological options in favour of concrete actions that will make the difference for Italy’s economic growth, employment and stability. It is with this spirit that we present the Economic and Financial Document for 2013 to Parliament, the independent local entities, and social partners.
Mario Monti President of the Council of Ministers


MINISTERO DELL’ECONOMIA E DELLE FINANZE VII
TABLE OF CONTENTS
I. OVERALL FRAMEWORK AND ECONOMIC-POLICY OBJECTIVES
II. MACROECONOMIC SCENARIO
II.1 International scenario II.2 Italy's economy
III. NET BORROWING AND PUBLIC DEBT
III.1 The path to a turnaround – Excessive deficit procedure III.2 Financial impact of key reforms III.3 The cyclically adjusted budget balance III.4 Public debt III.5 Trend of debt-to-GDP ratio III.6 The debt rule and other relevant factors
IV. SENSITIVITY ANALYSIS
IV.1 Sensitivity to economic growth IV.2 Sensitivity to interest rates
V. SUSTAINABILITY OF PUBLIC FINANCES
V.1 The impact of population ageing on fiscal sustainability V.2 Debt sustainability V.3 Analysis of sensitivity of public-debt dynamics over the long term V.4 The impact of pension reforms on sustainability
VI. QUALITY OF PUBLIC FINANCES
VI.1 Actions taken and indications for future years
VII INSTITUTIONAL ASPECTS OF PUBLIC FINANCE
VII.1 Balanced budget implementation rule VII.2 Fiscal rules

ECONOMIC AND FINANCIAL DOCUMENT - SECTION I STABILITY PROGRAMME
VIII MINISTERO DELL’ECONOMIA E DELLE FINANZE
TABLES
Table I.1 Public finance indicators (% of GDP) Table II.1 Base assumptions Table II.2a Macroeconomic prospects Table II.2b Prices Table II.2c Labour market Table II.2d Sector accounts (% of GDP) Table III.1 Differences with respect to previous Stability Programme Table III.2 General government budgetary prospects Table III.3 The path to a turnaround (% of GDP) Table III.4 Expenditure to be excluded by expenditure rule Table III.5 Scenario at unchanged policies Table III.6 State sector – Public sector – Cash balances (in € mn and % of GDP) Table III.7 Financial impact of the new 2013 NRP measures Table III.8 Cyclically-adjusted balance (% of GDP) Table III.9 Factors determining public debt (% of GDP) Table III.10 General government debt by sub-sectors (in € mn and % of GDP) Table IV.1 Sensitivity to growth Table V.1 Public expenditure for pensions, healthcare, long-term care, education,
and unemployment compensation (2010-2060) Table V.2 Long-term sustainability indicators Table VI.1 Cumulative impact of 2012 legislation on General Government net
borrowing (before netting out induced effects; in € mn) Table VI.2 Cumulative impact of 2012 budget packages on General Government
net borrowing (before netting out induced effects; in € mn) Table VI.3 Cumulative impact of 2012 budget packages on General Government
net borrowing by sub-sector (before netting out induced effects; in € mn) Table VI.4 Impact of Decree-Law No. 95/2012 on General Government net
borrowing (before netting out induced effects; in € mn) Table VI.5 Impact of 2013 Stability Law on General Government net borrowing
(before netting out induced effects; in € mn) Table VI.6a Impact of Decree-Law No.35/2013 (before netting out induced effects; in
€ mn) Table VI.6b Impact of Decree-Law No. 35/2013 on General Government net
borrowing (before netting out induced effects; in € mn) Table VI.6c Impact of Decree-Law No. 35/2013 on General Government net
borrowing by sub-sector (before netting out induced effects; in € mn) Table VI.6d Impact of key measures of Decree-Law No. 35/2013 on General
Government net borrowing (before netting out induced effects; in € mn)

TABLE OF CONTENTS
MINISTERO DELL’ECONOMIA E DELLE FINANZE IX
FIGURES
Figure II.1 Real GDP, potential GDP and closure of output gap Figure II.2 Exports and imports volumes by geographic area -2012 Figure II.3 Export and import volumes by sector -2012 Figure III.1 Italian government securities yield curve Figure III.2 10-year BTP-BUND yield differential Figure III.3 Yield differential between 10- and 2-year Italian government securities Figure III.4 Debt-to-GDP ratio (inclusive and net of support to Euro Area countries) Figure III.5 Combinations of primary surplus, growth rate and nominal interest rates
that allow for meeting the debt benchmark in 2015 and 2017 Figure IV.1 Sensitivity of net borrowing to growth Figure IV.2 Sensitivity of public debt to growth Figure IV.3 Mix of domestic government securities outstanding Figure IV.4 Average life and financial duration of government securities Figure IV.5 Ratio of interest expenditure to GDP and weighted average cost at
issuance Figure V.1 Public debt projection compared with previous Stability Programme (% of
GDP) Figure V.2 Sensitivity of public debt to reduction of the net flow of immigrants and a
1-year increase in life expectancy (% of GDP) Figure V.3 Sensitivity of public debt to macroeconomic assumptions. Higher and
lower growth of productivity (% of GDP) Figure V.4 Sensitivity of public debt to macroeconomic assumptions. Rates of
employment and rates of activity of the elderly and women (% of GDP) Figure V.5 Sensitivity of public debt to assumptions on healthcare and LTC
expenditures in the risk scenario (% of GDP) Figure V.6 Sensitivity of public debt to the primary surplus (% of GDP) Figure V.7 The impact of the reforms on the debt-to-GDP ratio (% of GDP)

ECONOMIC AND FINANCIAL DOCUMENT - SECTION I STABILITY PROGRAMME
X MINISTERO DELL’ECONOMIA E DELLE FINANZE
FOCUS TOPICS
Chap. II The effects of accelerating the payment of PA’s commercial debts 2012 structural measures: the overall impact on growth The performance of the Italian manufacturing companies during the
crisis Recent performance of spreads between yields on Italian debt securities
and yields on German bunds Chap. III The expenditure rule Chap. V The pension reform State guarantees Chap. VI Macroeconomic impact of fiscal consolidation measures adopted in
2012 The fight against tax evasion Italian public development aid Chap. VII The governance of the healthcare expenditure system

MINISTERO DELL’ECONOMIA E DELLE FINANZE 1
I.OVERALL FRAMEWORK AND ECONOMIC POLICY
OBJECTIVES
The gradual improvement in the Euro Area’s financial market situation during
2012 has not yet been fully transmitted to the real economy, delaying economic
recovery. The recession began in Italy in the second half of 2011 and continued
throughout 2012. Average annual GDP has decreased by 2.4 per cent in real terms,
confirming estimates published in the September’s Updated to the 2012 EFD (Nota
di Aggiornamento del DEF).
TABLE I.1 : PUBLIC FINANCE INDICATORS (% of GDP)
2011 2012 2013 2014 2015 2016 2017
UPDATED TREND SCENARIO (1)
Net borrowing -3.8 -3.0 -2.9 -1.8 -1.7 -1.3 -1.0
Cumulated change in net borrowing 2015-2017
0.2 0.4 0.6
UPDATED POLICY SCENARIO
Net borrowing -3.8 -3.0 -2.9 -1.8 -1.5 -0.9 -0.4
Primary balance 1.2 2.5 2.4 3.8 4.3 5.1 5.7
Interest 5.0 5.5 5.3 5.6 5.8 6.0 6.1
Structural net borrowing (2) -3.5 -1.2 0.0 0.4 0.0 0.0 0.0
Change in structural balance -0.2 -2.3 -1.1 -0.4 0.4 0.0 0.0
Public Debt (including aid) (3) 120.8 127.0 130.4 129.0 125.5 121.4 117.3
Public Debt (net of aid) (3) 120.0 124.3 126.9 125.2 121.8 117.8 113.8
MEMO: Report to the Parliament (March 2013)
Trend net borrowing (4) -3.8 -3.0 -2.9 -1.8
MEMO: Updated note on 2012 EDF 2012 (September 2012)
Net borrowing -3.9 -2.6 -1.8 -1.5 -1.3
Primary balance 1.0 2.9 3.8 4.4 4.8
Interest 4.9 5.5 5.6 5.9 6.1
Structural net borrowing (2) -3.6 -0.9 0.0 -0.2 -0.4
Change in structural balance 0.0 -2.8 -0.9 0.3 0.2
Public Debt (including aid) (5) 120.7 126.4 126.1 123.1 119.9
Public Debt (net of aid) (5) 119.9 123.3 122.3 119.3 116.1
Nominal GDP (absolute values x 1.000) (6) 1,578.5 1,565.9 1,573.2 1,624.0 1,677.7 1,731.3 1,785.9
1) On the assumption that the tax regime on real estate property (IMU) is renewed in line with Decree Law n. 201/2011 from 2015 onwards. In case of non-renewal, the General Government Net Borrowing would increase to -2.5, -2.1 and -1.8 per cent of GDP respectively in 2015, 2016 and 2017. 2) Structural means net of one-off measures and the cyclical component. 3) Inclusive or net of Italy’s share in EFSF loans to Greece and in the ESM programme. For 2011 and 2012 the total of such loans to EMU State Members (bilateral or through EFSF) amounts to 13,118 and 36,932 million respectively. Estimates for 2013-2017 include revenues from privatisation of state owned assets for about 1 percentage point of GDP per year. 4) Inclusive of effects on net borrowing stemming from the speeding up of payments of arrears owed by the public administration, valued to be in the order of 0.5 per cent of GDP. 5) Inclusive or net of Italy’s share in EFSF loans to Greece (projected aid for recapitalisation of Spanish banking sector not included) and in the ESM programme from 2010 to 2015. 6) Estimates of GDP in the short run take the impact of structural reforms only partly into account.

ECONOMIC AND FINANCIAL DOCUMENT - SECTION I STABILITY PROGRAMME
2 MINISTERO DELL’ECONOMIA E DELLE FINANZE
Government policy actions aimed at maintaining financial stability while
enhancing potential growth through major structural reforms. Despite unfavorable
economic developments, fiscal consolidation was pursued with determination to
achieve a balanced budget in structural terms in 2013. In 2012, the deficit was at
3.0 per cent of GDP in nominal terms, already broadly in line with EU
recommendations.
Fiscal consolidation was accompanied by changes to the national fiscal
framework, first by introducing the principle of balanced budget through the cycle
in the Italian Constitution and then by making it operational. This followed a
series of reforms in European governance and commitments by the Italian
government as early as March 2011 in the context of the Euro Plus Pact and the
more stringent requirements of the Six Pack. These changes have laid the
foundation of a durable fiscal adjustment.
The current economic climate, still unfavorable, calls for fiscal consolidation
and financial stability to be accompanied by measures to support and enhance
growth and employment.
Following EU Council conclusions of June and December 2012, the European
Council of 14 March 2013 recognised the need for a differentiated approach to
fiscal consolidation, using the space available within the EU’s existing fiscal
framework for actions in support of growth and employment.
In line with this approach, the Italian Government has recently adopted a
Decree Law to inject liquidity in the economic system by unblocking payment in
arrears accumulated by the public administration toward its suppliers. This
measure is expected to boost demand already in the second half of this year.
Spread over a two year period (2013-2014), it is a one-off measure that will not
affect the fiscal consolidation process to which Italy remains firmly committed.
Taking into consideration that the budget deficit must remain below 3.0 per cent
of GDP in all years following the repeal of the excessive deficit procedure and
with a sufficient margin, the Government estimates that the fiscal leeway to
speed up payment of arrears by the public administration is approximately 0.5 per
cent of GDP.
The structural deficit is estimated to decline from 1.2 per cent in 2012 to
zero in 2013, and then turn into a slight surplus in 2014. In the following years,
projections show net borrowing to be sufficiently close to balance on the
assumption that the tax regime on real estate property (IMU) is renewed in line
with Decree Law n. 201/2011 from 2015 onwards. The full achievement of a
balanced budget in 2015-2017 would require some additional measures to close
the residual gap. Based on current projections, the primary surplus in nominal
terms should gradually increase, reaching 5.7 per cent of GDP in 2017, while the
debt/GDP ratio should start declining rapidly as early as 2014.

MINISTERO DELL'ECONOMIA E DELLE FINANZE 3
II. MACROECONOMIC SCENARIO
II.1 INTERNATIONAL SCENARIO
In 2012, the global economy experienced a slowdown with respect to 2011. The estimates indicate a GDP increase of 3.1 per cent and trade growth of 2.4 per cent.
In the Euro Area, the financial markets' gradual improvement has not yet been fully transmitted to the real economy, especially in the 'peripheral' countries; growth decelerated as the year progressed, so much so that GDP contracted by 0.6 per cent, while the unemployment rate rose to 11.4 per cent. These results were partially influenced by the weakness of domestic demand within the countries that have undertaken fiscal consolidation policies; the slowdown also affected Germany in the final quarter of the year. In the United States, the economy performed positively, with GDP growing by 2.2 per cent and the unemployment rate falling to 8.1 per cent. The Federal Reserve's maintenance of accommodating monetary policy along with its Operation Twist allowed for improvement in the real-estate and stock markets. In Japan, GDP rose by 2.0 per cent, but the economic recovery has lost its momentum over time, prompting the government to adopt an ambitious plan in order to get the country out of the deflationary phase that has dragged on for more than a decade. Emerging and more recently industrialised countries witnessed a confirmation of their economic trends of recent years, with their economies continuing to react better to the current cycle, and growth rates well above those reported by the world's most developed nations. In 2012, China grew by 7.8 per cent, while India reported growth of 4.9 per cent, with favourable prospects for 2013.
Global economic growth forecasts for 2013 have been revised downward, partly due to the deterioration (albeit temporary) witnessed in the final months of 2012. The estimates confirm a GDP increase of 3.2 per cent and global trade growth of 3.5 per cent. More specifically, the Euro Area's GDP is projected to decline by 0.3 per cent, while its unemployment rate should grow to 12.2 per cent. In the United States, GDP is forecast to grow by 1.9 per cent; unemployment is pegged at 7.6 per cent. Finally, the estimates for Japan contemplate GDP growth of 1.0 per cent, while China's economy should be back to expanding at a rate of around 8.0 per cent.
The forecasts for 2014 indicate that the GDP growth of the global economy should stabilise at 3.9 per cent.
Various indications coming from the international scenario are the basis for moderate optimism. More specifically, the growth prospects for the economies of emerging nations may represent an important thrust for accelerating the recovery of developed countries. Added to this is the expected decline in the prices of energy, food and industrial commodities, with positive repercussions on inflation.

ECONOMIC AND FINANCIAL DOCUMENT - SECTION I STABILITY PROGRAMME
4 MINISTERO DELL'ECONOMIA E DELLE FINANZE
Nonetheless, elements of uncertainty remain for the future. In the Euro Area, the position taken by the European Central Bank (‘whatever it takes’) eased the financial market tensions that had been evident through the summer months of 2012. Even so, tensions remain, as shown by the recent banking crisis in Cyprus. In the United States, the Federal Reserve continues to maintain an accommodating policy, but the recovery could risk losing its momentum as a result of fiscal issues, namely, the combination of spending cuts and revenue increases (Fiscal Cliff), the permanent spending cuts of USD 85 billion (Sequester), and the question of the debt ceiling. Instead, in Japan, the need to get back to solid rates of growth can also be seen through the changes to monetary policy made by the new governor of the central bank.
II.2 ITALY'S ECONOMY
The recession that began in the second half of 2011 dragged on for the entire year of 2012, producing a 2.4 per cent contraction of GDP, in line with the estimates published in September in the Update of the DEF. The trend of the economy was very weak in the final quarter of the year.
The significant reduction in the autumn of 2012 in the spread between yields on Italian government securities and the yields on German securities has not yet fully wielded its beneficial effects on the credit system. In Italy and in other peripheral countries, significant differences continue to exist in the cost of financing on new business loans with respect to the Euro Area's core countries. The spread between the average cost of the new business loans in Italy and that in Germany was equal to 1.5 percentage points in January. In addition, the difficult cyclical conditions and the consequent increase in non-performing loans have prompted a very conservative stance by banks in granting loans to the economy (which have been declining in recent months).
The tightening of conditions for accessing credit, accompanied by the inevitable fiscal adjustment, had an impact on domestic demand whose contribution to GDP growth was equal to -4.8 percentage points. The staying power of exports, accompanied by a reduction of imports, translated into a strong positive contribution of net demand from abroad (3 percentage points). In the meantime, the stocks of inventories continued to decline.
In 2012, the drop in investment in machinery grew more pronounced due to uncertainties about demand and the low level of plant capacity utilisation. Industrial production conspicuously decreased, in particular in consumer durable goods and intermediate goods. Investments in construction experienced a fifth consecutive year of decline.
During the first three quarters, household disposable income fell by 4.1 per cent compared with the same period of the preceding year. The ongoing reduction of real disposable income since 2008 has affected spending decisions by households. The contraction of consumption was very pronounced (-4.3 per cent) and mainly referred to durable and semi-durable goods. The savings rate stood at 8.9 per cent in the third quarter.

II. MACROECONOMIC SCENARIO
MINISTERO DELL'ECONOMIA E DELLE FINANZE 5
As a result of the fiscal consolidation measures, the Public Administration's real expenditure (including both employee compensation and intermediate consumption) was reduced by 2.9 per cent.
While the trend of exports proved reassuring (+2.3 per cent), the weakness of domestic demand was reflected in a pronounced decrease in imports. The resulting trade surplus (+1.3 per cent of GDP) led to important improvement in the current balance of the balance of payments, which is now near to balance (-0.6 per cent of GDP).
The recession has also had significant repercussions on the labour market. Employment as measured in full-time equivalents (FTE) decreased by 1.1 per cent. The number of employed reported by the Labour Force Survey experienced a smaller decrease due to greater reliance on wage-supplementation schemes (CIG) and an increase in part-time workers1. Indeed, the hours worked actually fell by 1.4 per cent. The hours authorised for CIG were more than 1.0 billion, getting close to the historical high recorded in 2010. The so-called ‘tiraggio’ (number of hours of temporary lay-off benefits actually received) was equal to approximately 50 per cent. The drop in employment was nonetheless smaller than the contraction in GDP, and thus reflected a productivity decline.
Unlike what has occurred in other periods of recession, the labour force participation rate increased in 2012. The increase is linked to a higher labour force: more women and young people, but also more individuals between the ages of 55 and 64 because of the most recently adopted pension reforms. The average unemployment rate for the year rose to 10.7 per cent, reflecting strong growth in the final months of the year.
Wage moderation continued. Wages per employee rose by 1.0 per cent, with the stronger trend for contractual wages (1.5 per cent) and a negative wage-drift. Despite the containment of wage increases, the unit labour cost increased due to deterioration of productivity.
The harmonised index of consumer prices (HICP) rose by 3.3 per cent, also reflecting the higher value-added-tax rates and excise tax rates introduced in the second half of 2011. The easing of external inflationary pressure and the waning of the effects of higher rates for VAT and some excise taxes produced a conspicuous slowdown in inflation in the second part of 2012.
Prospects for the Italian economy
The prospects for the Italian economy will be influenced by the external macroeconomic framework and by the developments in the crisis in Europe. After the slowdown seen in the second half of 2012, international demand is expected to recover gradually, thereby favouring growth of exports.
The latest indicators available are evidencing a less encouraging trend of domestic demand, which should still be weak in early 2013. On the basis of available information, a new decrease in GDP is expected in the first half of 2013 (albeit of a lesser magnitude than in the final quarter of 2012); this will likely be
1 Within the Labour Force Survey, workers on the wage-supplementation schemes (CIG) are classified as
employed.

ECONOMIC AND FINANCIAL DOCUMENT - SECTION I STABILITY PROGRAMME
6 MINISTERO DELL'ECONOMIA E DELLE FINANZE
followed by a gradual recovery in the second half of the year. When also considering the negative carry-over effect on 2013 (equal to -1.0 per cent), the GDP growth estimates for the current year have been revised downwards to-1.3 per cent from -0.2 per cent indicated in the EFD Update of September 2012 and is in line with the figures set out in the Report to Parliament dated 21 March 2013.
The forecast incorporates the effects of the measures providing for payment of the commercial debts owed by the Public Administration (PA). The injection of liquidity into the economy achieved via the acceleration of such payment should favour more rapid economic recovery as early as the second half of 2013. The recovery should be more pronounced in 2014, with a growth rate equal to 1.3 per cent. The effects of the aforementioned transaction should be even more visible in 2014, including the positive impact of the carry-over effect. If the transaction were not to be effected, it is estimated that growth could be just over 0.5 per cent. The positive effects of paying the PA's commercial debts will also influence growth in 2015, which is estimated to increase by 1.5 per cent.
FOC
US The effects of accelerating the payment of PA's commercial debts
In the past two years, the rebalancing of the public accounts has moved forward withdetermination, with a view toward the achievement of a balanced budget. In 2012, Italyrealised substantial structural improvement in public finance accounts, and further fiscal consolidation is planned for 2013. Furthermore, in 2012, the ratio of net borrowing to GDP(not cyclically adjusted) was substantially in line with EU recommendations.
With the cyclical phase still unfavourable, the achievement of the budget balance and the respect of financial stability will need to be rounded out by measures to support andrelaunch growth and employment.
In evaluating the effects of a similar initiative on the real economy, it was noted that a portion of the payments to the PA suppliers will go to the credit sector, since a portion of the suppliers' receivables (i.e. the PA's commercial debts) has been transferred to banks (with or without recourse). If on the one hand, this flow of funds will reduce the direct impact on the economic system, on the other hand, it will contribute to reducing the tensions within the credit system; it can thus be expected that the result will be a decrease in customer borrowing rates and some easing of the credit crunch.
The portion of the liquidity injection that remains within businesses is likely to be usedmostly for revising investment plans or for improving working capital management (including, for example, possible payments of amounts due in arrears to employees). The plan to accelerate the settlement of the PA's commercial debts should also help to reduce the number of businesses being closed (a phenomenon that has grown more pronounced inrecent months). As a result, considerable improvement in the trend of domestic demand and employment can be expected vis-à-vis what would have occurred without the initiative.
The stimulus to the economy should also lead to a partial change in the mix of demand.Even though the components of domestic demand should improve, the balance of goods inthe balance of payments is expected to remain in a surplus position, while the current balance could approach to balance. The unemployment rate is projected to peak in 2013, before gradually beginning to decline in subsequent years.

II. MACROECONOMIC SCENARIO
MINISTERO DELL'ECONOMIA E DELLE FINANZE 7
MACROECONOMIC SCENARIO – SUMMARIES AND COMPARISONS
2012 2013 2014 Final data Before
payments of PA trade
debt
Delta Stability Programme
(1)
Before payments
of PA trade debt
Delta Stability Programme
(1)
GDP -2.4 -1.5 0.2 -1.3 0.6 0.7 1.3 Imports -7.7 -1.3 1.0 -0.3 2.9 1.8 4.7 Final national consumption -3.9 -2.0 0.3 -1.7 0.3 0.6 0.9 Household consumption -4.3 -2.1 0.4 -1.7 0.5 0.9 1.4 Investments -8.0 -3.3 0.7 -2.6 1.3 2.8 4.1 - Machinery, equipment & other -9.9 -3.9 0.9 -3.0 1.8 3.3 5.1 - Construction -6.2 -2.8 0.5 -2.2 0.8 2.3 3.1 Exports 2.3 2.1 0.1 2.2 3.1 0.2 3.3 GDP deflator 1.6 1.7 0.1 1.8 1.6 0.3 1.9 Consumption deflator 2.8 1.9 0.2 2.0 1.7 0.3 2.0 Memo item: planned inflation 1.5 1.5 0.0 1.5 1.5 0.0 1.5 Employment (FTE) -1.1 -0.8 0.5 -0.3 -0.2 0.8 0.6 Unemployment rate 10.7 11.7 -0.1 11.6 12.1 -0.3 11.8 1) The data correspond with those in the report presented to Parliament on 21 March 2013.
The principal components of domestic demand are likely to contract markedly
with respect to 2012. Thereafter, the forecast calls for growth of consumption that is almost in line with GDP and a more pronounced acceleration of investment (following a cumulative contraction of an estimated 15 per cent between 2011 and 2013).
The recovery of employment is also not expected to occur before 2014, and its scale should be more limited with respect to the growth of GDP. The unit labour cost is projected to decline, while the reduction of the unemployment rate will start to be more evident only near the end of the forecast period when it should fall below 11 per cent. This last scenario incorporates a progressive increase of the participation rate.
The specific circumstances in which the liquidity injection is occurring will ensure that the initiative can have long-term effects on the economic system, with a reduction of the risk of permanent loss of productive capacity. Nevertheless, in the years immediately following 2013, the recovery of the growth process can be explained by the gradual closing of the output gap as favoured by improvement in demand. In the medium term, the contribution related to structural factors (potential GDP growth) becomes prevalent; Chart II.1 shows the breakdown estimated with the use of methodology
FIGURE II.1: REAL GDP, POTENTIAL GDP AND CLOSURE OF OUTPUT GAP
Note: MEF analyses
-1,5
-1,0
-0,5
0,0
0,5
1,0
1,5
2,0
2013
2014
2015
2016
2017
2018
2019
2020
2021
2022
2023
2024
2025
Potential GDP growth rates
Closure of Output gap
Real GDP growth rates

ECONOMIC AND FINANCIAL DOCUMENT - SECTION I STABILITY PROGRAMME
8 MINISTERO DELL'ECONOMIA E DELLE FINANZE
agreed at European level. Potential GDP growth (which corresponds with actual GDP growth in the long-term projections) is significantly influenced by the reforms put into effect in recent years.
It is mostly for the effect of such reforms that GDP growth will remain above 1.0 per cent. It is estimated that the total impact of the reforms on potential GDP will get to 6.8 percentage points of GDP in the long term, thus ensuring incremental GDP growth of approximately one-half percentage point per year. The official growth forecasts are dependent on the methodologies developed at European level, particularly for the long term, and they do not fully incorporate the effects of the reforms.
FOC
US
2012 structural measures: the overall impact on growth The table below shows the overall impact of the growth-stimulus reforms that wereintroduced in 2012. The NRP contains detail of the new measures introduced as of mid-2012, along with a precise evaluation thereof. Some of the simplification and deregulationmeasures were evaluated previously in the 2012 EFD. According to the estimates done, thetotal effect of the measures on GDP can be quantified as an additional 1.6 percentagepoints of growth in 2015. By 2020, the increment rises to 3.9 percentage points, and thenrises to 6.9 in the long term. The data supplied indicate the change in GDP versus the levelof GDP without the reforms.
MACROECONOMIC EFFECTS OF THE 2012 REFORMS (GDP - percentage shifts compared to the baseline simulation)
2015 2020 Long term
Deregulation and simplification measures 0.9 2.4 4.8
Growth Decrees 1 and 2 0.3 0.5 0.7
Labour reform 0.4 1.0 1.4
Total 1.6 3.9 6.9
Source: MEF analyses using the ITEM, QUEST III - Italy (European Commission) and IGEM models.
The impact of the structural reforms on the potential growth rate over the medium term(until 2025) is evidenced through a counterfactual analysis.
First, the production function methodology agreed at a European level was applied to themacroeconomic framework assumed as the reference. A potential GDP growth rate wasderived from this scenario for the 2012-2017 period. For the years from 2018 to 2025, thepotential growth rate was extrapolated on the basis of convergence assumptions (agreed ata European level) for certain variables that are part of the determination of potential GDP(such as the unemployment rate structural (NAWRU), capital stock, and the rate ofparticipation). It is noted that the methodology agreed at a European level could onlyincorporate part of the impact of the reforms on potential growth since such methodologyprojects the underlying components through statistical techniques that are based primarilyon values of the variables of reference observed in recent years2.
2 The level of convergence for the NAWRU was derived through a panel estimation over a sample of the
leading EU countries on the basis of data that include the main structural determinants of the labour market, such as: the substitution rate of unemployment subsidies, an indicator for active labour policies, a tax-wedge indicator and an indicator of the rate of unionisation. For the baseline scenario, it is assumed that the structural NAWRU converges at a level even higher than 9 per cent. For the capital stock, it is assumed that convergence at the stationary state level occurs in 2030. Finally, the baseline scenario incorporates the favourable effects on the rate of participation in the labour market that are derived from pension reform as simulated through the Cohort

II. MACRO
MINISTER
In opoteabothe met
In osceof tcumvalu
Thethos
POT
Sou
TABLE II.1
Short-termLong-term USD/EUR Change of World GDPEU GDP grGrowth in World impoOil price (B1) Short-teyear; long-year.
Simulationinclusion ocoefficientof pension
-0
-0
0
0
0
0
0
OECONOMIC S
RO DELL'ECON
order to keepential output)
ove. It can be scenarios, thodology, wi
order to evidnarios were dhe reforms, w
mulative termues set out in
e analysis prese set out in t
TENTIAL GDP G
urce: MEF anal
1 BASE ASSUM
m interest rate (1 interest rate exchange rate the nominal eff
P, excluding EU rowth Italy's key foreigort volumes, ex
Brent, USD/barrerm interest rat-term interest ra
n Model (CSM). of such effects t estimated by reform.
01
01
00
01
01
02
02
2012 2013
SCENARIO
NOMIA E DELL
p the analysis) incorporatee assumed, inthat the proll underestim
dence the fudefined. The whereas the
ms, the shift n table above.
esented is usethe baseline
GROWTH AND
yses using the
MPTIONS
1)
ffective exchang
gn markets xcluding EU rel) e: the average ate: the average
The scenario p that occurs, st European Comm
3 2014 2015
LE FINANZE
s conservativs only part ofn order to mojections of
mate the effec
ll effect of tfirst, unlike tsecond exclu
between th.
eful in showinscenario.
IMPACT OF TH
ITEM and IGEM
ge rate
of the forecast e of the forecas
resents an uptiarting in 2017, mission on the b
2016 2017
ve, the macrof the impact
maintain cons potential Gct of the refor
the reforms the referenceudes any strue two altern
ng that the G
HE STRUCTURA
M models and p
2012 0.8 5.7
1.29 -5.4 4.0 -0.3 1.4 3.8
111.6 rates on 3-mon
st rates on 10-ye
ick in the growt by increasing tbasis of the CSM
2018 2019
o framework of the reformistency in the
GDP after 20ms by an equ
on potential e scenario, inuctural reformnatives scena
DP growth ra
AL REFORMS (i
production fun
2013 2011.2 2.74.8 5.3
1.35 1.352.6 0.04.1 4.60.1 1.63.2 5.64.4 6.1
113.5 106.4nth governmentear government
th rate in 2018the growth of tM, and that ref
2020 2021 2
Baseline scen
Scenario wit
Scenario incl
(and thus thems estimated e means of r017 done wual amount.
growth, twocludes the e
m introduced arios coincide
ates could be
in %)
ction.
14 2015 27 3.7 3 5.7 5 1.35 10 0.0 6 5.1 6 2.0 6 5.9 1 6.7 4 106.4 10t securities issut securities issu
. This is due tothe rate of partlects the emplo
022 2023 20
nario
hout reforms
uding reforms
9
e underlying in the tablerepresenting with the EU
o alternative ntire impact in 2012. Ines with the
higher than
2016 2017 4.4 4.9 6.0 6.2
1.35 1.35 0.0 0.0 5.2 5.3 2.0 2.2 5.9 5.9 6.9 6.9
06.4 106.4 ued during the ued during the
o the means of ticipation by a oyment impact
024 2025

ECONOMIC AND FINANCIAL DOCUMENT - SECTION I STABILITY PROGRAMME
10 MINISTERO DELL'ECONOMIA E DELLE FINANZE
TABLE II.2A. MACROECONOMIC PROSPECTS
2012 2013 2014 2015 2016 2017
Level (1) % Chg.
Real GDP 1,389,948 -2.4 -1.3 1.3 1.5 1.3 1.4
Nominal GDP 1,565,916 -0.8 0.5 3.2 3.3 3.2 3.2
COMPONENTS OF REAL GDP Private consumption 819,812 -4.3 -1.7 1.4 1.1 1.1 1.2
Public consumption (2) 290,171 -2.9 -1.7 -0.4 0.7 0.3 0.1
Gross fixed investment 244,483 -8.0 -2.6 4.1 3.2 2.6 2.4
Inventories (% of GDP) -0.6 -0.1 0.1 0.1 0.0 0.0
Exports of goods and services 414,120 2.3 2.2 3.3 4.1 4.0 3.9
Imports of goods and services 370,977 -7.7 -0.3 4.7 4.4 4.1 3.8
CONTRIBUTION TO REAL GDP GROWTH (3) Domestic demand - -4.8 -1.9 1.4 1.3 1.2 1.2
Change in inventories - -0.6 -0.1 0.1 0.1 0.0 0.0
Net exports - 3.0 0.7 -0.2 0.1 0.1 0.1
1) In € mn.
2) General government and NPISH.
3) Slight discrepancies, if any, are due to rounding.
TABLE II.2 B PRICES
2012 2013 2014 2015 2016 2017
Level % Chg.
GDP deflator 112.7 1.6 1.8 1.9 1.8 1.8 1.8
Private consumption deflator 115.9 2.8 2.0 2.0 1.9 1.8 1.8
HICP 117.5 3.3 2.0 2.0 1.9 1.8 1.8
Public consumption deflator 110.6 0.4 -0.5 0.3 0.9 1.0 0.9
Investment deflator 116.6 1.3 1.5 2.3 2.1 1.7 1.8
Export deflator 114.5 1.9 1.2 2.1 2.1 1.9 1.9
Import deflator 122.6 3.1 0.7 1.7 1.8 1.7 1.9
TABLE II.2 C LABOUR MARKET
2012 2013 2014 2015 2016 2017
Level1 % Chg.
Employment, persons (national accounts) 24,661 -0.3 -0.4 0.4 0.7 0.6 0.8
Employment, hours worked 43,212,145 -1.4 -0.3 0.6 0.8 0.6 0.9
Unemployment rate 10.7 11.6 11.8 11.6 11.4 10.9
Labour productivity, persons 58,534 -1.3 -1.0 0.7 0.7 0.6 0.5
Labour productivity, hours worked 32.2 -1.0 -1.0 0.7 0.7 0.7 0.4
Compensation of employees 668,859 -0.2 0.6 1.9 2.3 2.5 2.6
Compensation per employee 39,268 1.0 1.0 1.2 1.5 1.6 1.6 1) Units of measure: employment (persons and hours worked) in thousands of units; labour productivity in euro at constant values; total employee compensation in millions of euros; compensation per employee in euros.

II. MACROECONOMIC SCENARIO
MINISTERO DELL'ECONOMIA E DELLE FINANZE 11
TABLE II.2 D SECTOR ACCOUNTS (% OF GDP)
2012 2013 2014 2015 2016 2017 Net lending/borrowing with the rest of the world -0.4 0.2 -0.2 -0.1 -0.1 0.0 Balance of goods and services 1.2 2.1 1.9 1.9 2.0 2.1 Balance of primary income and transfers -1.8 -2.0 -2.1 -2.1 -2.1 -2.2 Capital account 0.1 0.1 0.1 0.1 0.1 0.1 Net lending/borrowing of private sector 2.7 3.0 1.6 1.4 0.8 0.4 Net lending/borrowing of the Public Administrations1 -2.9 n.a. n.a. n.a. n.a. n.a. Net lending/borrowing of the Public Administrations2 -3.0 -2.9 -1.8 -1.5 -0.9 -0.4 Statistical discrepancies 1) ESA95 series. Most recent historical data available: 2012. 2) EDP series.
Foreign trade
In 2012, Italy's foreign trade reflected a slowdown with respect to the previous year, in line with the trend of global industrial production and trade. The overall trade balance was a surplus of approximately €11 billion (0.8 per cent of GDP), thus significantly improving over the deficit of €25.5 billion for the preceding year. The change is due to the growth of exports (3.7 per cent) and the reduction of imports (-5.6 per cent). From a geographic perspective, both the export and import flows were more robust with respect to non-EU markets.
In 2012, the total exports of goods in volume terms were slightly lower year on year (-0.5 per cent), although having expanded with respect to non-EU markets. Imports experienced a much larger decline (-9.4 per cent), which refers to all geographic areas. More specifically, exports rose mainly to the OPEC countries (18.0 per cent), Japan (11.3 per cent) and the United States (8.2 per cent). Among the European countries, exports increased only with respect to the UK (2.5 per cent). Imports in volume rose only from the OPEC countries (4.2 per cent).
In the European area, imports from the UK reflected the biggest decline (-15.2 per cent). At a sector level, the highest increases in exports were reported for pharmaceutical products (7.1 per cent), petroleum products (5.8 per cent), metal products (4.0 per cent) and the food sector (2.5 per cent). Imports decreased for all sectors, especially for transport vehicles (-23.1 per cent) and textiles and apparel (-14.3 per cent).
The 2012 trend of average unit values (AUV) shows a similar increase for total exports and imports, rising by 4.3 per cent and 4.1 per cent, respectively. At a geographic level, the highest AUV increases for both exports and imports were seen with respect to non-EU markets. For exports, the increase extended to all countries, but was lower (from 8.2 per cent for the United States to 3.8 per cent for Russia) than the most important increases reported for imports (14.6 per cent from OPEC, 10.5 per cent from Russia, 6.8 per cent from non-EU countries, 6.0 per cent from Japan and 3.3 per cent for China). From a sector perspective, the same sectors (petroleum products, textiles and apparel, pharmaceutical products and machinery) reported the largest increases in exports (from 15.1 per cent for petroleum products to approximately 6.0 per cent for pharmaceutical products and machinery) and in imports (from 9.9 per cent for petroleum products to 6.1 per cent for machinery).

ECONOMIC AND FINANCIAL DOCUMENT - SECTION I STABILITY PROGRAMME
12 MINISTERO DELL'ECONOMIA E DELLE FINANZE
FIGURE II.2: EXPORTS AND IMPORTS VOLUMES BY GEOGRAPHIC AREA – 2012 (% change y/y)
EXPORTS IMPORTS
*) DAE is the acronym for Dynamic Asian Economies. Such aggregate includes the following Asian countries: Singapore, South Korea, Taiwan, Hong Kong, Malaysia and Thailand. Source: Calculations on ISTAT data contained in the COEWEB Databank.
FIGURE II.3: EXPORT AND IMPORT VOLUMES BY SECTOR – 2012 (% change y/y)
EXPORTS IMPORTS
A= Agriculture, forestry and fishing; CA= Food, beverages and tobacco; CB= Textiles and apparel; CC= Wood and wood products; CD= Petroleum products; CE= Chemical products; CF= Pharmaceutical products; CG=Plastic materials and non-metal mineral products; CH= Metals and metal products (excluding machinery and systems); CI= Computers, electronic devices and optical devices; CJ= Electrical devices; CK=Machinery; CL= Transport vehicles; CM=Other manufactured products. Source: Calculations on ISTAT data contained in the COEWEB Databank.
-0,5
18,0
3,4
3,4
-3,7
-4,2
8,2
11,3
-14,2
-14,0
3,5
0,3
-10,0
2,5
-3,5
-3,5
-20 -10 00 10 20
World
OPEC
Extra-EU countries
DAE
EU-27
EMU
United States
Japan
China
India
Russia
Brazil
Spain
United Kingdom
Germany
France
-9,4
4,2
-10,1
-20,3
-8,5
-8,2
-7,2
-28,4
-19,3
-24,1
-2,1
-13,7
-8,4
-15,2
-12,3
-9,6
-30 -20 -10 00 10
Mondo
OPEC
Paesi extra-UE
EDA*
UE 27
UEM
Stati Uniti
Giappone
Cina
India
Russia
Brasile
Spagna
Regno Unito
Germania
Francia
-0,5
-0,6
-2,4
-2,6
-2,2
-5,0
4,0
-4,4
7,1
-2,3
5,8
1,5
-3,8
2,5
-3,4
-10,0 -5,0 0,0 5,0 10,0
Total
CM
CL
CK
CJ
CI
CH
CG
CF
CE
CD
CC
CB
CA
A
-9,4
-11,6
-23,1
-12,1
-8,4
-10,6
-9,8
-11,3
-4,0
-3,9
-4,8
-7,3
-14,3
-4,5
-9,4
-30,0 -20,0 -10,0 0,0

II. MACROECONOMIC SCENARIO
MINISTERO DELL'ECONOMIA E DELLE FINANZE 13
According to provisional data for 2012, the inward foreign direct investment (FDI) in Italy amounted to approximately €6.8 billion, a major decline when compared with the roughly €17.8 billion reported for 2011 (€24.7 billion)3. This trend was rather widespread also in the Euro Area, where France, Ireland and the UK were the only countries to record an increase in incoming flows4.
FOC
US
The performance of the Italian manufacturing companies during the crisis5 Considering Italy's exports represent an important driver of the recovery in the current economic cycle, an analysis of several aspects of Italy's entrepreneurial system can provide some insight about the prospects for exports. The analysis first examines the exports growth of manufacturing companies present in foreign markets for the entire 2010-2012 two-year period, and then looks at the expansion strategies implemented by such companies in 2012 and those planned for 2013, along with what are considered the main obstacles and the possible policy measures deemed most useful by businesses. The Italian exporters (about 45,000) had positive performance overall during the 2010-2012 period, despite the economic crisis. In 2012, these companies exported goods and services with a value of more than €260 billion, with sales abroad for the January-November 2012 period rising by 10.9 per cent over the same period of 2010. Such companies can be subdivided into two very different groups: the more competitive companies (35.7 per cent of the total, or approximately 16,000 companies) which increased exports to both European and non-European countries; and the companies (16 per cent of the total, or approximately 7,200 companies) that had fewer sales abroad in both macro market areas.
This performance was considerably influenced by the company size. Indeed, the large- and medium-sized companies appear more capable of capturing global market share, and are more oriented toward non-European countries, whereas the smaller companies find it easier to expand within the European market. One critical aspect is the large number of companies that increased sales abroad, thereby consolidating their position in the EU, though seeing their positions eroded in non-European markets. This points to a potential setback with respect to the main competitors from emerging markets. In November 2012, ISTAT conducted an ad hoc survey6 with regard to the strategies adopted by the companies in order to deal with the difficulties of the current economic crisis. In the past two years, the companies have focused on both (i) strategies to improve quality or to increase the range and technological content of the products, and (ii) measures to hold down selling prices. Some 75 per cent of the companies employed the first type of strategies (with the figure being no less than 70 per cent in any given sector). The sectors where the percentages were particularly high were electronics, mechanical and traditional Made-in-Italy goods (textiles, apparel, leather and accessories). The strategies to hold down prices have instead been used as a tool for defending competitive positioning for approximately 80 per cent of the companies, particularly in the electronics sector and in transport vehicles. It is noted that the companies intend to implement the same strategies in 2013. Indeed, more than 75 per cent of the manufacturing companies plan to improve product quality or to expand the product line, while more than 60 per cent of them are aimed at holding down selling prices.
3 Bank of Italy, ‘Balance of payments and International Investment Position’, Supplements to the Statistical
Bulletin, Monetary and Financial Indicators, n. 15, New series, Year XXIII, 25 March 2013. 4 UNCTAD, ‘Global Investment Trends Monitor’, n. 11, 23 January 2013. 5 The text is a summary extracted from ISTAT's ‘Report on the competitiveness of productive sectors’,
published in February 2013. 6 In this survey, some 50 per cent of the sample companies indicated they were exporters.

ECONOMIC AND FINANCIAL DOCUMENT - SECTION I STABILITY PROGRAMME
14 MINISTERO DELL'ECONOMIA E DELLE FINANZE
Finally, it is noted that the sectors in which the average size of the business is larger have amore detailed strategic plan. In the past two years and in the months to come, this group ofcompanies has combined initiatives to support a business presence abroad and to reinforce supply capacity abroad with price- and product-quality-related measures. In essence, during the 2010-2012 period, the manufacturing companies have used a combination of‘traditional’ tools based on competing in terms of price and product differentiation both vertically (improvement of quality and more technology) and horizontally (expansion of product range). The employment of more complex strategies (that might also includeorganisational initiatives and/or changes in the production/distribution chain) appears to be more limited. According to the companies participating in the survey, there are numerous obstacles to increasing exports (distinguished between internal or external constraints). The principalelement slowing expansion is the difficulty in squeezing production costs (according to 75 per cent of the total companies). This factor is significant not only because it affects the entire manufacturing sector, but also because, if associated with the use of price-containment strategies, it presents a risk of structural contraction of profit margins. Contrary to what is generally affirmed, the companies do not believe they haveorganisational/managerial difficulties, and size is not perceived as an impediment(according to approximately one in five companies). The absence of such internal obstacles stands out mostly in the sectors marked by a strong presence in foreign markets (both through exports and in terms of production), such as pharmaceuticals, transport vehicles, and electrical equipment. Another important, but external, factor regards the limitations on accessing credit (40 per cent of the companies). Such difficulty is mostly seen in thetraditional sectors and in sectors with large economies of scale (such as transport vehicles, chemicals, wood, machinery and rubber and plastic materials). Finally, with respect to the intervention of economic-policy authorities, about 50 per cent of the manufacturing companies believes that additional export credit or guarantee measures are needed. This is evident particularly in the sectors experiencing greater difficulty in accessing credit (such as coke, transport vehicles, chemicals, machinery, and textiles).
Roughly one in ten manufacturing companies is looking for measures to support network solutions, but the figure doubles for companies in the food, beverage and tobacco sector. The demand for support in offering services in Italy and abroad is much less important(indicated by an average of 20 per cent of the manufacturing sector); partial exceptions are the pharmaceutical sector with respect to services in Italy and the electrical equipmentsector with respect to service abroad.
FOC
US Recent performance of spreads between yields on Italian debt securities and yields on
German bunds In Italy, the tensions on the government securities market intensified in mid-2011, prompting an expansion of the spread between the yields on Italian government securitiesand the yields on German securities. In December 2011, the Governing Council of the European Central Bank (ECB) launched twolong-term refinancing operations (LTRO). Such operations were implemented to respond to the funding difficulties that banks in several European nations were experiencing due to the sovereign debt crisis. In the first LTRO carried out on 21 December, the ECB provided gross financing of approximately €489 billion. The second LTRO took place on 29 February 2012, and provided funding of €530 billion. The actions undertaken contributed to reinstatingmarket confidence, leading to a reduction in the spread between the yields on Italiangovernment securities and the yields on German securities. The decrease in yields was also made possible by Italy's financial rebalancing and its adoption of structural reforms. In thespring of 2012, however, the tensions flared again. At this point, the inevitable fiscal consolidation initiatives already put into place by national governments, and in particular, by Italy, were rounded out with an additional crucial lever of actions agreed at the level of themain European institutions.

II. MACROECONOMIC SCENARIO
MINISTERO DELL'ECONOMIA E DELLE FINANZE 15
On 28 and 29 June 2012, the summit of the heads of state and of government of the Euro Area and the European Council announced important measures aimed at easing thefinancial markets tensions and reinstating investor confidence. The European summit calledfor the institution of a single bank oversight system. The summit also came to a decision about greater flexibility and efficiency in the use of the financial support mechanisms(European Financial Stability Facility (EFSF) and European Stability Mechanism (ESM)) inorder to stabilise the conditions for the financing of the nations most exposed to the market tensions, subordinating such action to the respect of the commitments undertaken at aEuropean level.
In order to ensure that the transmission of monetary policy would be working properly withinthe Euro Area, on 6 September 2012, the Governing Council of the ECB established themeans for implementing Outright Monetary Transactions (OMT) which consist of purchasinggovernment securities on the secondary market. Such purchases are subordinated to therespect of rigorous conditions linked to the implementation of a financial aid programme onthe part of the EFSF or the ESM for the Member State making a formal request therefore. With this initiative, the markets' response was more decisive and longer lasting.
The spread between the yields on 10-year Italian government securities and the yields on German securities contracted markedly following: i) the announcement of the OMT; ii) thefiscal consolidation measures undertaken by the member states most exposed to the sovereign debt crisis; and iii) the progress made toward the realisation of the banking union.
The reduction of the tensions on government securities had an important impact on Italy'spublic accounts, favouring, albeit with the usual delay, a reduction in the average rate of interest paid on the public debt. When compared with the projections presented in the EFDUpdate in September, the interest expenditure for the public administration would be about€7.7 billion lower in 2015. This improvement could not have occurred, had it not been for the Government's firm action in terms of the rebalancing the public finances and thestructural reforms for growth.
SPREAD OF 10-YEAR GOVERNMENT SECURITIES VERSUS BUNDS
Source: Thomson Reuters Datastream.
0,0
1,0
2,0
3,0
4,0
5,0
6,0
Jan-08 Jul-08 Jan-09 Jul-09 Jan-10 Jul-10 Jan-11 Jul-11 Jan-12 Jul-12 Jan-13
%
28 Nov.Ireland rescue
17 MayPortugal rescue
21 Dec. LTRO/1 28 Feb.
28-29 June European Council
6 Sept. OMT
15 Sept. Lehman Brothers bankruptcy
24 Apr.Greece debt downgrade
25 Jan. European banking union


MINISTERO DELL’ECONOMIA E DELLE FINANZE 17
III. NET BORROWING AND PUBLIC DEBT
III.1 THE PATH TO A TURNROUND – EXCESSIVE DEFICIT PROCEDURE
The fiscal objectives presented in the Stability Programme for 2012 in April
last year were revised downwards in the course of 2012 due to a worsening of the
economic cycle, partly caused by a sharpening of tensions in the sovereign debt
market.
TABLE III.1: DIFFERENCES WITH RESPECT TO PREVIOUS STABILITY PROGRAMME
2012 2013 2014 2015
GDP GROWTH RATE
Stability Programme 2012 -1.2 0.5 1.0 1.2
Stability Programme 2013 -2.4 -1.3 1.3 1.5
Difference -1.2 -0.8 0.3 0.3
NET INDEBTEDNESS (% of GDP)
Stability Programme 2012 -1.7 -0.5 -0.1 0.0
Stability Programme 2013 -3.0 -2.9 -1.8 -1.5
Difference -1.3 -2.4 -1.7 -1.5
PUBLIC DEBT (% of GDP)
Stability Programme 2012 123.4 121.5 118.2 114.4
Stability Programme 2013 127.0 130.4 129.0 125.5
Difference 3.6 8.9 10.8 11.1
In July 2012, on the basis of the European Commission’s evaluations of the
macroeconomic and fiscal situation outlined in the previous Stability Programme,
the Ecofin Council recommended Italy to implement the budget consolidation plan
to secure a correction of the excessive deficit by 2012, appropriate progress
toward the medium-term objective (MTO) and debt reduction, while complying
with the expenditure benchmark.
In September, with the Update Note of the Economic and Financial
Document, budget forecasts were updated to take into account the weakening of
the macroeconomic scenario for the 2012-2015 period (about 1.8 cumulative
percentage points), the reports on the performance of macroeconomic aggregates
as well as the impact of the three-year corrective measures introduced in the
summer by two legislative packages. These two packages were meant to introduce
a comprehensive revision of public spending (spending review), by the means of
the achievement of structural savings and selective cuts1, as well as take care of
1 Decree Law No. 95/2012 converted by Law No. 135/2012.

ECONOMIC AND FINANCIAL DOCUMENT - SECTION I STABILITY PROGRAMME
18 MINISTERO DELL’ECONOMIA E DELLE FINANZE
enhancing the value of and selling government real estate throughout investment
funds as a means to reduce the stock of public debt2.
New estimates placed the general government net borrowing at 2.6 per cent
of GDP in 2012, exceeding the April figure by 0.9 percentage points, as a result of
revenues performance that was less favorable than expected and of a higher cost
of debt servicing, which was more than offset by a more moderate increase in
other current expenditure items. The deficit was expected to gradually decline
over the 2013-2015 period, in line with previous forecasts. In structural terms, the
fiscal consolidation effort was confirmed, as a balanced budget was achieved in
2013 and substantially maintained in the following years. The Stability Law,
adopted in October, identified the measures to achieve the policy objectives.
In December, a reinforced law implementing the structural balanced budget
rule, now enshrined in the Constitution, was adopted in line with the
commitments undertaken in the Euro Plus Pact, the Six Pack and the Fiscal
Compact.
Finally, in March 2013 and ahead of the deadline for submitting The Economic
and Financial Document, the Government informed the Parliament of the new
growth prospects for the economy and fiscal performance for the years 2013 and
2014. This was done because of the urgent need for measures to inject liquidity
into the economy to support growth and employment by speeding up the
settlement of general government payables to suppliers. The new estimates of
public finance, developed on the basis of data relating to the new macroeconomic
scenario and incorporating the impact of the measures introduced to speed up the
settlement of general government payables to suppliers3, showed a net borrowing
of 2.9 per cent of GDP in 2013 and 1.8 per cent in 2014, with a worsening equal to
0.6 and 0.3 percentage points over the estimates in the Update Note of the
Economic and Financial Document.
More specifically, the end of 2012 showed a 1.3 percentage point deviation
from the net borrowing objective set in the previous Economic and Financial
Document. The greatest deviation is on total revenues, whose percentage of GDP
has declined by about 1.0 GDP percentage points, entirely due to less tax
revenues (about 1.0 percentage points). Less important seems to be the deviation
on the expenditure side (about 0.3 percentage points) whose greater incidence as
a proportion to GDP, solely as a result of a smaller denominator, is to be
attributed to increasing welfare benefits (about 0.3 percentage points) and to
debt servicing (about 0.2 percentage points), while the other expenditure items
are either in line with forecasts (such as employees’ compensation and
intermediate consumption) or edging down (such as social transfers in kind and
other current expenditure equal to 0.1 percentage points).
Therefore, with regard to results achieved last year, general government net
borrowing declined by about 12.4 billion in 2012, to 47.6 billion. As a proportion
of GDP it was -3.0 per cent, improving by 0.8 percentage points over the value
2 Decree Law No. 87/2012 which was incorporated and converted by Law No. 35/2012. 3 Decree Law No. 35/2013.Under the existing accounting and public finance law a similar measure requires
the updating of the previously set fiscal policy objectives, by submitting a specific Report to Parliament.

III. NET BORROWING AND PUBLIC DEBT
MINISTERO DELL’ECONOMIA E DELLE FINANZE 19
TABLE III.2: GENERAL GOVERNMENT BUDGETARY PROSPECTS 1
2012 2012 2013 2014 2015 2016 2017
Level (2) % of GDP % of GDP
Net lending (EDPB.9) by sector
1. General government -47,633 -3.0 -2.9 -1.8 -1.5 -0.9 -0.4
Cumulated change in net borrowing 2015-2017 0.2 0.4 0.6
2. Central government -53,660 -3.4 -2.4 -1.7 -1.6 -1.2 -0.9
3. State government -52,612 -3.4 -2.2 -1.5 -1.6 -1.1 -0.8
4. Local government 2,724 0.2 -0.7 -0.2 -0.3 -0.3 -0.4
5. Social security funds 3,303 0.2 0.2 0.2 0.2 0.2 0.2
General government (S13)
6. Total revenue 746,879 47.7 48.2 48.0 47.7 47.5 47.3
7. Total expenditure 794,512 50.7 51.1 49.8 49.4 48.8 48.3
8. Net lending/borrowing -47,633 -3.0 -2.9 -1.8 -1.7 -1.3 -1.0
9. Interest expenditure 86,717 5.5 5.3 5.6 5.8 6.0 6.1
10. Primary balance 39,084 2.5 2.4 3.8 4.1 4.7 5.1
11. One-off and other temporary measures (3) 1,512 0.1 -0.2 -0.1 -0.1 0.0 0.0
Selected components of revenue
12. Total taxes 472,164 30.2 30.4 30.4 30.3 30.2 30.1
12a. Taxes on production and imports 233,554 14.9 15.3 15.4 15.5 15.4 15.3
12b. Current taxes on income, wealth, etc. 237,235 15.1 15.0 15.0 14.7 14.7 14.8
12c. Capital taxes 1,375 0.1 0.1 0.1 0.0 0.0 0.0
13. Social contributions 216,669 13.8 14.0 13.9 13.8 13.7 13.6
14. Property income 8,631 0.6 0.6 0.6 0.6 0.6 0.6
15. Other 49,415 3.2 3.3 3.1 3.1 3.0 3.0
15a. Other current revenue 44,448 2.8 2.8 2.8 2.8 2.7 2.7
15b. Other capital revenue 4,967 0.3 0.4 0.3 0.3 0.3 0.3
16=6. Total revenue 746,879 47.7 48.2 48.0 47.7 47.5 47.3
p.m. : tax burden 44.0 44.4 44.3 44.1 43.9 43.8
Selected components of expenditure
17. Compensation of employees+
intermediate consumption
254,434 16.2 15.8 15.2 14.9 14.6 14.3
17a. Compensation of employees 165,366 10.6 10.4 10.0 9.8 9.5 9.2
17b. Intermediate consumption 89,068 5.7 5.4 5.3 5.2 5.2 5.1
18. Social payments 354,624 22.6 23.1 23.0 22.9 22.7 22.6
of which: Unemployment benefits 12,967 0.8 0.9 1.0 0.9 0.9 0.8
18a. Social transfers in kind supplied via market producers 43,211 2.8 2.8 2.7 2.7 2.7 2.6
18b. Social transfers other than in kind 311,413 19.9 20.3 20.3 20.2 20.1 20.0
19=9.Interest expenditure 86,717 5.5 5.3 5.6 5.8 6.0 6.1
20. Subsidies 15,842 1.0 1.0 0.9 0.9 0.8 0.8
21. Gross fixed capital formation 29,224 1.9 1.8 1.7 1.7 1.7 1.6
22. Capital transfers 18,374 1.2 1.7 1.0 1.0 0.8 0.8
23. Other 35,297 2.3 2.4 2.2 2.2 2.2 2.1
22a. Other current expenditure 35,068 2.2 2.4 2.2 2.2 2.1 2.1
22b.Other capital expenditure 229 0.0 0.0 0.0 0.0 0.0 0.0
24=7. Total expenditure 794,512 50.7 51.1 49.8 49.4 48.8 48.3
p.m. : Goverment consumption (nominal) 314,200 20.1 19.6 19.0 18.7 18.3 17.9
1) Rounding of the first decimal figure may cause differences between the sum of the various expenditure and revenues
items and the total expenditure and total revenues, respectively.
2) Figures in millions.
3) The plus sign shows one-off measures to reduce the deficit.
Note: The first line of the table shows policy scenario targets, the remaining figures show performance at unchanged
legislation. As of 2015, the indicator figures shown in the table are calculated considering that real-estate taxation regime
introduced by Decree Law No. 201 of 2011 will remain unchanged. Data concerning total revenues and total expenditure
differ from those of the general government accounts published in Section II of the Economic and Financial Document
due to a different method of presenting the accounts: under EC Regulation No. 1500/2000 in Section I, while under the
traditional version in Section II. A connection between the two versions is published by Istat annually at intervals of a few
months. Data relating to 2011 and 2012 are ISTAT pre-end-of -year and end-of- year data that have not been published
yet. For the years 2013-2017 data are forecasts by the Ministry of the Economy and Finance.

ECONOMIC AND FINANCIAL DOCUMENT - SECTION I STABILITY PROGRAMME
20 MINISTERO DELL’ECONOMIA E DELLE FINANZE
recorded in 2011 (-3.8 per cent)4. The primary surplus doubled from 1.2 per cent
of GDP in 2011 to 2.5 per cent in 2012.
Total revenues have increased by 2.5 per cent over the previous year. Current
revenues increased by 2.6 per cent: in particular, indirect taxes went up by 5.2
per cent, mainly driven by revenues from the property tax (Imposta Municipale
Unica -IMU) and the increase in excise duties on mineral oils. A similar increase
(5.0 %) was recorded by direct taxation, essentially due to the increase of
personal income tax (IRPEF), the IRPEF regional surcharge and the withholding tax
interest and other capital incomes, which reflects changes in the taxation regime
of financial rents. Social security contributions remained substantially stable (-0.1
per cent). There was a clear contraction of capital revenues due to the lack of
one–off payments of the substitute tax on the realignment of accounting values to
the international IAS standards that had sustained revenues in 2011. Overall, total
revenues reached 47.7 per cent of GDP in 2012. The tax burden was 44.0 per cent,
on the increase compared to 42.6 per cent in 2011.
On the expenditure side total outlays recorded a moderate increase
compared to 2011 (0.7 per cent) showing an increase similar to that of current
outlays (0.8 per cent). In particular, employees’ compensation declined by 2.3 per
cent, following the cut in general government employees and the freeze on
contract renewals; after measures to cut public expenditure were introduced,
intermediate consumption went down by 2.4 per cent; welfare benefits in cash
increased by 2.4 per cent, in line with growth in pension and annuity expenditure.
Interest paid stood at about 86.7 billion in 2012, with a 10.7 per cent increase
over 2011. As regards capital expenditure, declining by 0.6 per cent, gross fixed
investment decreased by 6.0 per cent.
In 2012 the deficit reduction path was marked by a clear worsening of the
economic cyclical phase and a resumption of tensions in financial markets, leading
to an increase in interest rates. Measures to contain expenditure, on which
Government action was focused, was accompanied by a corresponding revenue
reduction in order to support economic growth.
Two years after the start of the excessive deficit procedure (EDP)5, the level
of net borrowing achieved in 2012 and forecasts of its further reduction for the
following years show fiscal consolidation in line with the Recommendations of the
European Union. The changes made to the national regulatory framework have
laid the foundations to achieve a balanced budget that will last in time.
4 According to SEC 95 version, which is not valid for EDP purposes that considers swaps, the ratio of net
borrowing to GDP was 2.9 per cent, thus showing a 0.8 per cent improvement over 2011 (revised downwards from 3.8 per cent to 3.7 per cent.
5 With the start of the excessive deficit procedure against almost all European countries at the end of 2009, Italy was asked to bring the deficit below 3.0 per cent of GDP by 2012 and to ensure an average yearly fiscal effort of at least 0.5 GDP percentage points over the 2010-2012 period.

III. NET BORROWING AND PUBLIC DEBT
MINISTERO DELL’ECONOMIA E DELLE FINANZE 21
TABLE III.3: THE PATH TO A TURNAROUND (as a percentage of GDP)1
2011 2012 2013 2014 2015
Economic and financial document (April 2012)
Net indebtedness -3.9 -1.7 -0.5 -0.1 0.0
Structural net indebtedness -3.6 -0.4 0.6 0.6 0.4
Primary surplus 1.0 3.6 4.9 5.5 5.7
Interest 4.9 5.3 5.4 5.6 5.8
Public debt (including loans to euro area) 120.1 123.4 121.5 118.2 114.4
Public debt (excluding loans to euro area) 119.2 120.3 117.9 114.5 110.8
1) Decree Law No. 95 (July 2012)
Impact on net indebtedness 0.04 0.00 0.00 0.04
Higher net revenues -0.21 -0.42 -0.61 -0.60
Lower net revenues -0.25 -0.42 -0.61 -0.63
2) Stability Law (October 2012)
Impact on net indebtedness -0.15 0.01 0.02
Higher net revenues -0.12 -0.05 -0.02
Lower net revenues 0.03 -0.06 -0.04
Impact of macroeconomic forecast revision -0.81 -1.02 -1.24 -1.08
Impact of debt servicing revision -0.12 -0.05 -0.19 -0.37
Update of EFD (September 2012)
Net borrowing -3.9 -2.6 -1.8 -1.5 -1.3
Structural net borrowing -3.3 -2.8 -0.6 0.6 0.5
Primary surplus 1.0 2.9 3.8 4.4 4.8
Interest 4.9 5.5 5.6 5.9 6.1
Public debt (including loans to EU area) 120.7 126.4 126.1 123.1 119.9
Public debt (excluding loans to euro area) 119.9 123.3 122.3 119.3 116.1
1) Rounding of the first decimal figure may cause differences between the values shown in the table.
For 2013 and 2014, net borrowing is expected to remain respectively at 2.9
and 1.8 per cent of GDP in line with forecasts made in the March Report to
Parliament.
In the following years, fiscal performance, discounting the IMU experimental
tax regime that will be maintained, shows a net borrowing profile close to the
level needed to achieve a structurally balanced budget. However, achieving a
balanced budget in the years 2015-2017 could require measures to bridge the
residual gap.
Based on policy scenario trends, the primary surplus in nominal terms is
expected to increase gradually, reaching 5.7 per cent in 2017.
Any additional measures will be fine-tuned to ensure that expenditure
increases remain in line with the provisions of the expenditure rule set at
European level.

ECONOMIC AND FINANCIAL DOCUMENT - SECTION I STABILITY PROGRAMME
22 MINISTERO DELL’ECONOMIA E DELLE FINANZE
TABLE III.4: EXPENDITURE TO BE EXCLUDED FROM THE EXPENDITURE RULE
2012 2013 2014 2015 2016 2017
Level (1) % of GDP % of GDP
Expenditure on EU programmes fully matched
by EU funds 4,499 0.3 0.3 0.3 0.3 0.3 0.3
Cyclic component of expenditure on
unemployment benefits (2) 3,777 0.2 0.3 0.3 0.2 0.2 0.2
Discretionary expenditure adopted in 2012 (3) 20,380 1.3 1.8 1.6 1.6 1.6 1.5
Revenue increases already laid down by law 0.0 0.0 0.0 0.0 0.0 0.0 0.0
1) In millions of euros.
2) As a first application, over the (2013-2017) forecasting period the cyclical component was identified as the gap
between the forecast figure and the average value of expenditure over the years 2008-2012, increased by 2 per
cent for each of the forecast years. For 2012 the gap was calculated on the average figure of the 2007-2011
period, increased by 2 per cent. The expenditure variable considered is the ‘expenditure for safety-net benefits in
cash’, which is a subset of category D62 of SEC95.
3) Discretionary revenues include the net impact of revenue reduction resulting from budget package measures
(Decree Law No. 95/2012 and Stability Law No. 2013-2015) and revenue increases ordered with previous de-
crees (Decree Laws No. 201/2011, No. 70/2011, No. 98/2011 and No. 138/2011, net of the safeguarding
clause on tax expenditures).
FO
CU
S
The expenditure rule
The expenditure rule introduced by the new Stability and Growth Pact in 2011 strengthens
the commitments relating to fiscal rules, further qualifying convergence towards the
medium term objective. This rule has been applied since 2012 and has already been
transposed into Italian legislation with Law No. 243/2012.
More specifically, every year the reference expenditure aggregate is the sum of total general
government expenditure, net of debt servicing, of expenditure in European programmes fully
matched by EU funds, and the non-discretionary component (i.e. linked to the economic
cycle) of expenditure on unemployment benefits. In addition, the aggregate expenditure
considered should be adjusted for the intrinsic volatility in the investment series,
substituting for the annual figures of investment series their average calculated between
the t year and the previous three years. According to the recent changes made to the
calculation method, the expenditure aggregate is also adjusted by the impact of
discretionary revenues which, based on the previous method, were considered as a
component for offsetting any overshooting of the expenditure aggregate with respect to the
benchmark rate.
For countries that have achieved their MTO, the expenditure aggregate expressed in real
terms, may change in line with the medium-term growth rate of potential GDP. For those far
from achieving their MTO, increase in the expenditure aggregate should be smaller than the
potential GDP rate of growth over the medium term by a shortfall that secures a cut in the
structural budget balance of at least 0.5 percentage points every year.
The maximum limit to growth in the expenditure aggregate set at European level and
applied to Italy for the 2012-2013 period is -0.8 per cent a year in case of failure to achieve
the MTO and 0.3 if the MTO is achieved. In the next three–year period (2014-2016) the
benchmark has been updated and is equal to -1.1 per cent a year if the MTO is not achieved
and 0.0 per cent if the MTO is achieved. When the benchmark was updated, the growth rate
of the GDP deflator for each country was also indicated in line with the European
Commission’s forecasts, so that it could be considered in assessing compliance with the
rule over the 2011-2013 period, in line with the European Commission’s forecasts. The
benchmark rates for Italy are 1.90 per cent in 2011, 1.87 per cent in 2012 and 1.88 per
cent in 2013.

III. NET BORROWING AND PUBLIC DEBT
MINISTERO DELL’ECONOMIA E DELLE FINANZE 23
Based on these criteria and considering that the figures in general government accounts
are based on the unchanged policy scenario and do not include the impact of any further
budget packages that may be introduced by the Government, the fiscal framework appears
to be in line with the rule for the whole period (2011-2017) that has been considered,
except for the years 2015 and 2017.
APPLICATION OF THE EXPENDITURE RULE 1
2011 2012 2013 2014 2015 2016 2017
millions of euros
1.Total expenditure 788.894 794.512 804.087 808.264 829.391 845.137 862.595
2.Higher expenditure at unchanged
policy 0.0 0.0 0.0 0.0 2.061 4.441 7.073
3.Expenditure funded by the EU 3.508 4.499 4.499 4.499 4.499 4499 4499
4. Cyclic component of
unemployment benefits 2.828 3.777 3.961 4.493 3.811 3.560 3.335
5.Interest 78.351 86.717 83.892 90.377 97.465 104.387 109.289
6.Gross fixed investment 31.097 29.224 28.257 28.156 28.289 28.669 28.761
7.Gross fixed investment–average
on the last four years 34.260 32.760 30.240 29.184 28.482 28.343 28.469
8.Step 1: Expenditure aggregate
benchmark (1+2-3-4-5-6+7) 707.370 703.054 713.717 709.923 725.869 736.806 752.252
9.Discretionary revenues (2) 5.036 20.380 27.624 26.784 27.668 27.722 27.188
10.Step 2: Expenditure aggregate
benchmark (8-9) 702.334 682.675 686.093 683.138 699.201 709.084 725.064
11.Step 3: Growth rate of the
expenditure aggregate in nominal
terms -1,3 -2,8 0,5 -0,4 2,2 1,6 2,3
12.Step 4: Growth rate of the
expenditure aggregate in real terms -3,2 -4,7 -1,4 -2,3 0,4 -0,2 0,5
13.Benchmark (maximum limit to
the growth of the expenditure
aggregate) -0,8 -0,8 -0,8 0,0 0,0 0,0 0,0
1) The benchmark used is consistent with meeting the medium-term objective by 2013 and maintaining it in the
following years. The aggregate expenditure benchmark is consistent with figures presented in the general
government accounts (Table III.2), by subtracting from total expenditure at unchanged policies the amount for
debt servicing, expenditure matched by EU funds, the cyclic component of unemployment benefits and
considering the average expenditure for investment (calculated on the years from t to t-3 . Discretionary measures
on expenditure have also been subtracted (Table III.5). The benchmark growth rate for expenditure was deflated
through the rates provided by the Commission during the years 2011-2013, while in the following years the
growth rate of the GDP deflator shown in Table II.2b was used.
2) In line with the definition agreed in the Output Gap Working Group, the discretionary measures on revenues
correspond to measures that have already been adopted and to other measures planned with a margin of
certainty (European Commission, Methodological requirements for the reporting of discretionary revenues
measures, Note for the OGWG, 3 October 2012.). See also (European Commission, Complementary information on
the functioning of the expenditure and debt benchmarks, Note for the Alternates of the Economic and Financial
Committee, 27 June 2012.). The figure for 2011 shows the expected increase in total tax revenues , compared to
2010 end-of-year data, from the main measures introduced during the 2010-2011 two-year period.

ECONOMIC AND FINANCIAL DOCUMENT - SECTION I STABILITY PROGRAMME
24 MINISTERO DELL’ECONOMIA E DELLE FINANZE
TABLE III.5: SCENARIO AT UNCHANGED POLICIES
2012 2013 2014 2015 2016 2017
Level (1) As % of GDP As % of GDP
Total revenues at unchanged policies 746,879 47.7 48.2 48.0 47.0 46.8 46.6
Total expenditure at unchanged policies 794,512 50.7 51.1 49.8 49.6 49.1 48.8
Detailed expenditure items (2)
Current expenditure 753,255 48.1
Employees’ compensation 165,366 10.6 10.4 10.0 9.8 9.6 9.3
Intermediate consumption 132,279 8. 5 8.2 8.0 7.9 7.9 7.9
Other current expenditure 57,480 3. 7 3.7 3.5 3.5 3.5 3.4
(net of interest and welfare benefits)
Current account expenditure 46,617 3.0
(net of property sale)
Gross fixed investment 29,199 1.9 1.8 1.8 1.7 1.7 1.6
(net of property sale)
Contributions to investment 17,487 1.1 1.2 1.0 1.0 0.7 0.7
1). In millions of euro.
2) Detailed expenditure data are consistent with the general government accounts published in Section II of the Economic
and Financial Document.
TABLE III.6: STATE SECTOR– PUBLIC SECTOR – CASH BALANCES (in millions of euro and as a percentage of GDP)
2012 2013 2014 2015 2016 2017
State Sector Balance -49,500 -53,674 -31,387 -37,044 -29,422 -28,580
As a % of GDP -3.2 -3.4 -1.9 -2.2 -1.7 -1.6
Central Government Balance -49,397 -53,404 -30,791 -36,344 -28,769 -27,924
As a percentage of GDP -3.2 -3.4 -1.9 -2.2 -1.7 -1.6
Local Government Balance -1,505 -1,229 -979 -729 -430 -292
As % of GDP -0.1 -0.1 -0.1 0.0 0.0 0.0
Social Security and Welfare Institutions Balance 0.0 0.0 0.0 0.0 0.0 0.0
As % of GDP 0.0 0.0 0.0 0.0 0.0 0.0
Public Sector Balance -50,903 -54,635 -31,770 -37,073 -29,200 -28,217
As % of GDP -3.3 -3.5 -2.0 -2.2 -1.7 -1.6
III.2 FINANCIAL IMPACT OF KEY REFORMS
In the National Reform Programme for 2013, ten policy areas have been
identified (public expenditure containment and efficiency , federalism,
administrative efficiency, product market and competition, employment and
pensions, innovation and human capital, business support, support to the financial
system, energy and the environment, infrastructure and development) shown in a
Table annexed to the document6.
These areas include the new action measures introduced by the new
regulations that have become effective since April 20127.
6 For a description of the table layout and its contents, see the guide on ‘How to read the tables annexed
to the National Reform Programme’ in the Appendix to the 2013 National Reform Programme in a table attached to the document.
7 Even if these measures also include provisions concerning the measures that had already been introduced in previous years, referred to as update of the regulatory and financial aspects of the National Reform Programmes for 2012 and 2011, this subsection does not analyse the impact resulting from updating the measures of the National Reform Programmes published in the last two years and contained in the Table attached to the National Reform Programme for 2012.
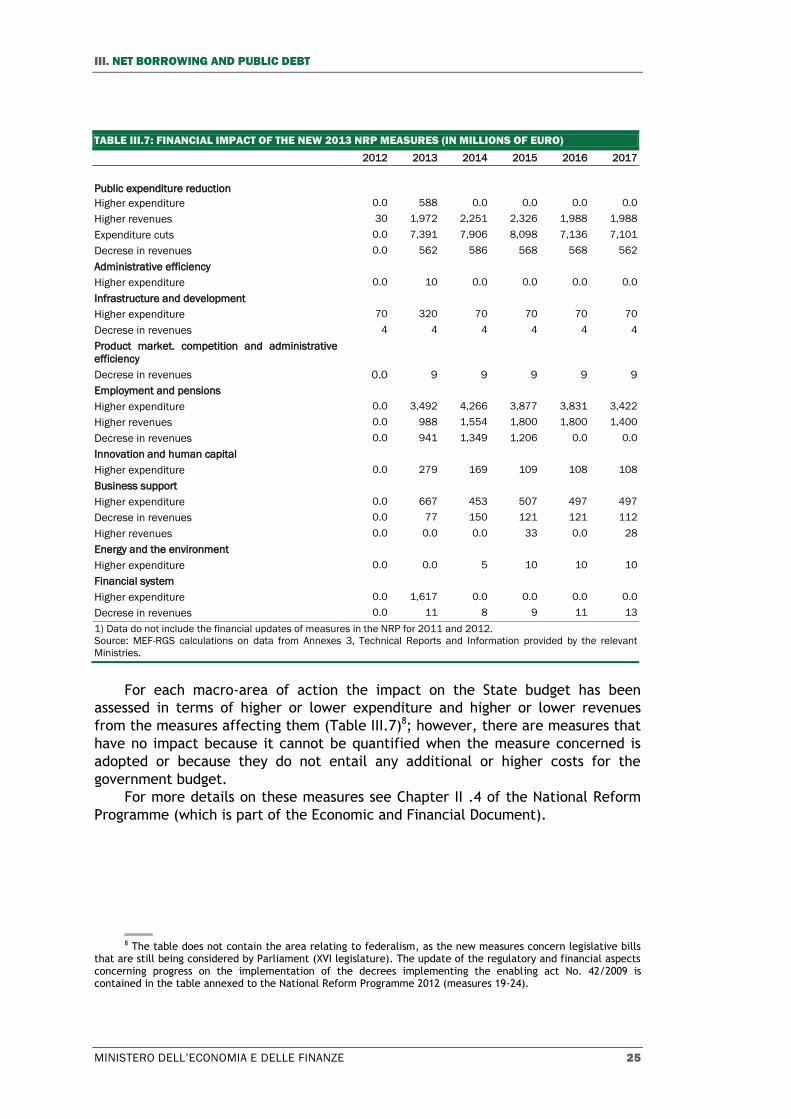
III. NET BORROWING AND PUBLIC DEBT
MINISTERO DELL’ECONOMIA E DELLE FINANZE 25
TABLE III.7: FINANCIAL IMPACT OF THE NEW 2013 NRP MEASURES (IN MILLIONS OF EURO)
2012 2013 2014 2015 2016 2017
Public expenditure reduction
Higher expenditure 0.0 588 0.0 0.0 0.0 0.0
Higher revenues 30 1,972 2,251 2,326 1,988 1,988
Expenditure cuts 0.0 7,391 7,906 8,098 7,136 7,101
Decrese in revenues 0.0 562 586 568 568 562
Administrative efficiency
Higher expenditure 0.0 10 0.0 0.0 0.0 0.0
Infrastructure and development
Higher expenditure 70 320 70 70 70 70
Decrese in revenues 4 4 4 4 4 4
Product market. competition and administrative
efficiency
Decrese in revenues 0.0 9 9 9 9 9
Employment and pensions
Higher expenditure 0.0 3,492 4,266 3,877 3,831 3,422
Higher revenues 0.0 988 1,554 1,800 1,800 1,400
Decrese in revenues 0.0 941 1,349 1,206 0.0 0.0
Innovation and human capital
Higher expenditure 0.0 279 169 109 108 108
Business support
Higher expenditure 0.0 667 453 507 497 497
Decrese in revenues 0.0 77 150 121 121 112
Higher revenues 0.0 0.0 0.0 33 0.0 28
Energy and the environment
Higher expenditure 0.0 0.0 5 10 10 10
Financial system
Higher expenditure 0.0 1,617 0.0 0.0 0.0 0.0
Decrese in revenues 0.0 11 8 9 11 13
1) Data do not include the financial updates of measures in the NRP for 2011 and 2012.
Source: MEF-RGS calculations on data from Annexes 3, Technical Reports and Information provided by the relevant
Ministries.
For each macro-area of action the impact on the State budget has been
assessed in terms of higher or lower expenditure and higher or lower revenues
from the measures affecting them (Table III.7)8; however, there are measures that
have no impact because it cannot be quantified when the measure concerned is
adopted or because they do not entail any additional or higher costs for the
government budget.
For more details on these measures see Chapter II .4 of the National Reform
Programme (which is part of the Economic and Financial Document).
8 The table does not contain the area relating to federalism, as the new measures concern legislative bills
that are still being considered by Parliament (XVI legislature). The update of the regulatory and financial aspects concerning progress on the implementation of the decrees implementing the enabling act No. 42/2009 is contained in the table annexed to the National Reform Programme 2012 (measures 19-24).

ECONOMIC AND FINANCIAL DOCUMENT - SECTION I STABILITY PROGRAMME
26 MINISTERO DELL’ECONOMIA E DELLE FINANZE
III.3 THE CYCLICALLY ADJUSTED BUDGET BALANCE
In the course of 2012 Parliament adopted a series of legislative measures9
that, in compliance with the European legislation, firstly introduced in the
Constitution and then implemented, the balanced budget principle. Under the
new national legislation, a balanced budget is achieved when the structural
balance stands at the level of the Medium-Term Objective (MTO)10.
In the case of Italy, the Medium-Term Objective coincides with a structural
balanced budget. This shifts the focus of fiscal surveillance on the assessment
made in structural terms that is net of the economic cycle and of other temporary
measures.
Estimates carried out on the baseline macroeconomic scenario (Chapter II)
show the performance of potential growth11 for 2013 which stands at around zero,
after the 0.5 percentage point contraction in 2012. This performance is mainly
due to the contribution, which was already negative in the past, of total factor
productivity, offset by the positive contribution of the labour factor12. Forecasts
for the 2014–2017 period point to a gradual recovery. As early as 2014 potential
GDP is expected to start growing again at a rate of 0.2 per cent, while in 2017
growth is expected to reach 0.5 per cent.
The labour and capital factors are forecast to make a positive contribution to
potential growth, while only by 2016 would total-factor productivity go back to
making a marginally positive contribution. It should be noted that the growth rate
estimate presented in this Section is based on a conservative and prudential
assessment of the impact of structural reforms (see Chapter II).
The output gap, that is to say the variable that measures, in relative terms,
the distance between the level of potential vis-à-vis that of actual output, is
forecast to widen further compared to previous years and to reach -4.8 per cent
of potential GDP in 2013. Future performance, i.e. between 2014 and 2017, should
enable a gradual closing of the gap; indeed, output gap is forecast to record
negative values, which will be ever less negative and finally reach -0.8 per cent by
2017.
9 These measures are the Constitutional Law No. 1 of 20 April 2012, on the “Introduction of the balanced
budget principle in the Constitution” and Law No. 243 of 24 December 2012 on “Provisions for the implementation of the balanced budget principle under Article 81, paragraph 6, of the Constitution”.
10 The Medium-Term Objective is defined in structural terms (net of the economic cycle and other temporary factors) on the basis of specific indicators for each country such as the long-term potential growth rate, the current debt-to-GDP ratio and the amount of implicit costs related to the ageing population.
11 Estimates of potential output and the output gap of the Italian economy are based on the use of the production function method shared by all EU countries and approved by ECOFIN. This method is regularly discussed and reviewed within the Economic Policy Committee of the Output Gap Working Group ( EPC-OGWG). For further information see: D’auria et al. 2010, The production function methodology for calculating potential growth rates and output gaps, European Economy, Economic Paper, No. 420.
12 As regards the labour factor, it should be noted that estimates of the participation rate used to derive the potential growth rate and output gaps are based on a definition of the active population that considers 15-74 cohorts instead of the 15-64 age group. This change, agreed at European level, became necessary to include the employment impact of the recent pension system reform, which contributed to notably raising the retirement age and the length of working lives in Italy and elsewhere.

III. NET BORROWING AND PUBLIC DEBT
MINISTERO DELL’ECONOMIA E DELLE FINANZE 27
TABLE III.8: CYCLICALLY-ADJUSTED BUDGET (as a percentage of GDP) 1
2011 2012 2013 2014 2015 2016 2017
GDP growth rate at constant prices 0.4 -2.4 -1.3 1.3 1.5 1.3 1.4
Net borrowing -3.8 -3.0 -2.9 -1.8 -1.5 -0.9 -0.4
Interest paid 5.0 5.5 5.3 5.6 5.8 6.0 6.1
Potential GDP growth rate 0.4 -0.5 0.0 0.2 0.3 0.3 0.5
Factor contribution to potential growth:
labour 0.3 -0.4 0.2 0.3 0.3 0.2 0.2
capital 0.2 0.0 0.0 0.1 0.1 0.2 0.2
Total factor productivity -0.1 -0.2 -0.2 -0.1 -0.1 0.0 0.1
Output gap -1.8 -3.6 -4.8 -3.8 -2.6 -1.7 -0.8
Cyclic component of the budget balance -1.0 -2.0 -2.7 -2.1 -1.5 -0.9 -0.5
Cyclically adjusted budget balance -2.8 -1.1 -0.2 0.3 -0.1 0.0 0.0
Cyclically adjusted primary surplus 2.2 4.5 5.1 5.9 5.7 6.1 6.1
One-off measures 0.7 0.1 -0.2 -0.1 -0.1 0.0 0.0
Budget balance net of one-off measures -4.5 -3.1 -2.7 -1.7 -1.5 -0.9 -0.5
Cyclically adjusted budget balance net of one-off measures -3.5 -1.2 0.0 0.4 0.0 0.0 0.0
Cyclically adjusted budget balance net of one-off measures 1.5 4.4 5.3 6.0 5.8 6.0 6.1
Budget balance change net of one-off measures -0.2 -1.3 -0.4 -1.0 -0.2 -0.5 -0.5
Cyclically adjusted budget balance net of one-off measures -0.2 -2.3 -1.1 -0.4 0.4 0.0 0.0
1) Rounding of the first decimal figure may cause inconsistencies between the values shown in the table.
The cyclical component, which provides an approximate measure of the
impact of cyclic fluctuations on the government budget, is defined as the product
between output gap and the elasticity of the budget balance to economic growth.
The EU Economic Policy Committee adopted the semi-elasticity concept, with
effect from this year13. Therefore, instead of measuring the impact of changes in
economic growth on the absolute level of the budget balance, the change in the
budget balance as a percentage of GDP with respect to changes in economic
growth is considered. Unlike the previous indicator, this determines elasticity to
be equal to about zero with respect to the ratio of tax revenues and GDP and
brings it close to 0.5 with respect to the ratio of expenditure and GDP. Overall,
the parameter of semi-elasticity is equal to about 0.55 in the case of Italy14. With
these innovations, the cyclical component is expected to reach -2.7 per cent in
2013 and then progressively decline, reaching -0.5 per cent by 2017.
In line with the government’s medium-term objective, the structural balance,
which considers the ratio of borrowing to GDP net of the cycle and one-off
measures, is forecast to be balanced by 2013 without any need for further
corrective measures. In 2014 the structural balance is expected to stand well
above the medium-term objective, reaching a surplus of 0.4 per cent of GDP.
Conversely, over the 2015-2017 period, the next Government should implement
13 Mourre, G., Isbasoiu, G.M., Paternoster, D., Salto, M., 2013, The cyclically adjusted budget balance in
the EU fiscal framework: an update; European Economy, European Commission, Directorate- General for Economic and Financial Affairs; Economic Paper No. 478.
14 Moreover, for each individual countries the specific weights representing the structure of revenues and expenditure and the relative shares of the individual items as a percentage of the total amount have been updated, i.e the structure of revenues and expenditure and the relative quotas of the individual categories they are composed of. Both the change to semi-elasticity and that concerning the relative weights have no major effect on the calculation of the cyclical component, while they have a significant impact on the separate calculation of structural revenues and expenditure.

ECONOMIC AND FINANCIAL DOCUMENT - SECTION I STABILITY PROGRAMME
28 MINISTERO DELL’ECONOMIA E DELLE FINANZE
additional budget measures, with overall effects of 0.6 per cent of GDP in order to
secure a structural balanced budget.
III.4 PUBLIC DEBT
In 2012, as in 2011, public debt was managed in a situation made more
difficult both by extreme volatility in financial markets (especially the segment of
government securities of the euro area) and the economic downturn. However,
market performance during the year was far from even. The lingering effects of
the extraordinary measures taken by the European Central Bank to inject liquidity
at three-year interval were still being felt during the first months of the year.
More specifically, in February the second Long Term Refinancing Operation was
made for an additional € 530 billion with the participation of 800 banks. The
market for Italian government securities benefitted significantly from these
operations, also thanks to the role played by Italian banks, which used part of the
liquidity thus received to buy government securities, thereby making more than a
mere marginal contribution to the reduction of rates and the return to satisfactory
liquidity conditions in the secondary market. From early January to early March
rates for one-year maturity securities declined by 260 basis points while interest
rates on ten-year-maturity securities went down by about 230 basis points.
FIGURE III.1: ITALIAN GOVERNMENT SECURITIES YIELD CURVE
At the same time, also the return differential with the German Bund declined
notably from 530 basis points in early January to 290 in early March for 10-year
maturity securities. This trend was strengthened on the one hand by further fiscal
consolidation measures adopted by the Government at the end of 2011, in
addition to those that had already been implemented in earlier months, and on
the other by the approval at EU level of the Fiscal Compact, aimed at ensuring
more effective fiscal surveillance of Member States and closer monitoring of the
sources of potential macroeconomic risk.
0,0
1,0
2,0
3,0
4,0
5,0
6,0
7,0
3M 6M 1Y 2Y 3Y 5Y 10Y 15Y 30Y
March 12
July 12
September 12
January 13
Duration
Inte
rest
rate
(%
)

III. NET BORROWING AND PUBLIC DEBT
MINISTERO DELL’ECONOMIA E DELLE FINANZE 29
In March, and at the end of July, market volatility raised its head again and
was more intense, at the same time as the impact of the two extraordinary
liquidity operations by the ECB abated. This new bout of market turbulence was
caused on the one hand by the problems linked to debt restructuring in Greece,
which were compounded by its complex situation of political instability, also
triggered by negotiations on aid tranches, and, on the other, by Spain’s worsening
fiscal scenario, as well as by the need to proceed with major recapitalization
programmes for the Spanish banking sector. Against this backdrop the prices of
government bonds worsened further, which, in turn translated into a more costly
debt servicing: over the whole period from early March to mid-July, interest rates
went up by about 130 basis points for one-year maturity securities, while for ten-
year maturity securities the increase was equal to 90 basis points, causing a
noticeable flattening of the return curve, a new alarm symptom on the credit risk
front.
FIGURE III.2: 10-YEAR BTP-BUND YIELD DIFFERENTIAL
In June, important agreements were reached at EU level for the Spanish
banking sector, with an aid plan of up to €100 billion from the European vehicles
EFSF/ESM, and with regard to the roles to be played by these funds to support
government securities of countries experiencing stress. However, the market
situation has not shown signs of a significant improvement, which is also partly
due to Italy’s downgrading by Moody’s in July.
What radically changed the context at the end of July was the firm
commitment by the ECB to start considering every option in order to secure the
single currency’s survival. This was followed, in early August, by the presentation
of the new plan for the purchase of securities (OMT Outright Monetary
Transactions), whose operational details were set out in early September. With
these market initiatives the government securities market of the whole Euro Area
stabilized, with strongly declining returns in all the so-called peripheral countries,
a sharp reduction in the volatility of security prices and a notable increase in
200
250
300
350
400
450
500
550
600
Ja
n-1
2
Feb
-12
Mar-
12
Apr-
12
May-1
2
Ju
n-1
2
Ju
l-12
Aug
-12
Sep
-12
Oct-
12
No
v-1
2
De
c-1
2
Ja
n-1
3
Feb
-13

ECONOMIC AND FINANCIAL DOCUMENT - SECTION I STABILITY PROGRAMME
30 MINISTERO DELL’ECONOMIA E DELLE FINANZE
traded volumes, with a non-negligible return of investors from both Northern
Europe and other areas such as the U.S.A and Asia. In the case of Italy, all of the
above resulted in a notable decline that lasted until mid-February last year, of the
spread with the German Bund, which from being above 530 basis points at the end
of July 2012 reached about 255 basis points in February 2013. Conversely, the
shape of the return curve normalised quite rapidly; as early as September the
curve became a slope again, in line with that of early March, declining further
until it reached rates similar to those of the first half of July 2011. What stopped
this trend, without actually reversing it, was only the looming general election of
late February, whose outcome appeared ever more uncertain.
FIGURE III.3: YIELD DIFFERENTIAL BETWEEN 10-AND 2-YEAR ITALIAN GOVERNMENT SECURITIES
Despite such a difficult situation, the Treasury succeeded in ensuring a rather
regular and predictable policy in terms of issuance and management of the
circulating debt, thereby ensuring an efficient allocation of debt both in terms of
costs and consolidation of the risk-minimization results at the end of 2011. Italy’s
government securities have been placed satisfactorily, both in terms of demand
for them and in terms of costs, considering that a large part of placements was
done at prices that were basically in line with those of the secondary market.
In the most favorable months, the Treasury succeeded in refinancing
securities reaching maturity, speeding up the pace of issuance of all securities
with maturity up to ten years and especially of BOTs. Improved conditions during
the last few months of 2011 enabled the issuance in March of BTP Italia, a type of
securities with four-year maturity indexed to the FOI inflation index (FOI Indice
delle famiglie italiane di operai ed impiegati) intended for retail investors and
listed on the MOT (Mercato Telematico delle Obbligazioni). This bond was issued
again in June and October, and was quite successful especially in October, also
due to particularly favorable market conditions.
0
50
100
150
200
250
300
350
Ja
n-1
2
Feb
-12
Mar-
12
Apr-
12
May-1
2
Ju
n-1
2
Ju
l-12
Aug
-12
Sep
-12
Oct-
12
No
v-1
2
De
c-1
2
Ja
n-1
3
Feb
-13

III. NET BORROWING AND PUBLIC DEBT
MINISTERO DELL’ECONOMIA E DELLE FINANZE 31
TABLE III.9: FACTORS DETERMINING PUBLIC DEBT (% of GDP)1
2011 2012 2013 2014 2015 2016 2017
Level (net of aid) (2) 120.0 124.3 126.9 125.2 121.8 117.8 113.8
Impact of aid (3) 0.8 2.7 3.5 3.8 3.7 3.6 3.5
Level (including loans) (2) 120.8 127.0 130.4 129.0 125.5 121.4 117.3
Changes over the previous year 1.5 6.2 3.4 -1.4 -3.5 -4.1 -4.1
Factors determining changes in public debt
(as a percentage of GDP)
Primary Surplus (on a cash basis) -1.2 -2.5 -2.4 -3.8 -4.3 -5.1 -5.7
Snow-ball effect 3.0 6.5 4.7 1.5 1.7 2.1 2.4
Of which interest (on a cash basis) 5.0 5.5 5.3 5.6 5.8 6.0 6.1
Stock-Flow adjustment -0.3 2.2 1.1 0.9 -0.9 -1.1 -0.8
Of which: difference between cash-basis
and accruals basis -0.4 0.0 -0.3 -0.1 -0.8 -0.8 -0.4
Net accumulation of financial
assets (4) 0.6 -0.4 -0.2 -0.6 -0.5 -0.7 -0.8
Of which: Proceeds from
privatization operations 0.0 -0.5 -1.0 -1.0 -1.0 -1.0 -1.0
Impact of Debt evaluation 0.5 0.5 0.3 0.3 0.4 0.3 0.3
Other (5) -1.0 2.1 1.3 1.4 0.0 0.1 0.1
p. m. Implicit interest rate on Debt 4.2 4.5 4.2 4.4 4.7 4.9 5.2
1) Rounding of the first decimal figure may cause inconsistencies between the figures presented in the Table.
2) Including and excluding Italy’s share of EFSF loans to Greece and the ESM programme. For the years 2011 -
2012 the amount of these loans to EMU Member States (bilateral or through the EFSF)) is equal to € 13,118 and
36,932 million respectively. Estimates for the years 2013-2017 include proceeds from privatization operations for
an amount equal to about 1 percentage point of GDP a year.
3) It includes the impact of Italy’s contribution to support the Euro Area: contributions to the Greek Loan Facility
(GLF), EFSF and ESM.
4) It includes the impact of contributions to GLF and the ESM.
5) The item ‘Other’, a residual item compared to the previous ones, includes: changes of active deposits of the
Ministry of the Economy and Finance with the Bank of Italy; statistical discrepancies; contributions to support the
Euro Area envisaged by the EFSF programme; effects of Decree Law No. 35/2013.
At times of great turbulence, the Treasury never resorted to sudden changes
in strategy: it resorted to a gradual rescheduling of the issuances of securities
with 2-10 year maturity, favoring those at three - and ten - year maturity, as
against a reduction in the number of securities with 15-30 year maturity, on the
variable – rate component (CCTeu) or the Euro-Area-inflation indexed bonds
(BTP€i). Conversely at these times the supply of off-the-run securities has been
stepped up, while in one case a share swap transaction was made, with the aim of
supporting Euro-Area inflation linked BTPs, which under certain market conditions
have shown a very negative performance also in terms of secondary market
liquidity.

ECONOMIC AND FINANCIAL DOCUMENT - SECTION I STABILITY PROGRAMME
32 MINISTERO DELL’ECONOMIA E DELLE FINANZE
TABLE III.10: GENERAL GOVERNMENT DEBT BY SUBSECTORS 1 (in millions of euro and as a percentage of GDP)
2011 2012 2013 2014 2015 2016 2017
Level net of financial aid to
Euro Area countries(2)
General government bodies 1,894,275 1,945,993 1,995,916 2,032,816 2,043,870 2,040,114 2,032,295
as % of GDP 120.0 124.3 126.9 125.2 121.8 117.8 113.8
Central government (3) 1,785,363 1,838,855 1,887,547 1,923,468 1,933,793 1,929,606 1,921,854
Local government (3) 135,159 131,810 133,039 134,018 134,747 135,177 135,469
Social security and welfare
agencies (3) 135 149 149 149 149 149 149
Level including loans to Euro Area
countries (2)
General government 1,907,392 1,988,658 2,051,352 2,094,275 2,105,502 2,101,937 2,094,348
as % of GDP 120.8 127.0 130.4 129.0 125.5 121.4 117.3
Central Government (3) 1,798,480 1,881,520 1,942,983 1,984,927 1,995,425 1,991,429 1,983,908
Local government (3) 135,159 131,810 133,039 134,018 134,747 135,177 135,469
Social security and welfare
agencies (3) 135 149 149 149 149 149 149
1) Rounding of the first decimal figure may cause inconsistencies between the figures among the various figures
presented in the Table.
2) Including and excluding Italy’s share of EFSF loans to Greece and the ESM programme. For the years 2011-
2012 the amount of these loans to EMU Member States (bilateral or through the EFSF)) is equal to € 13,118 and
36,932 million respectively. Estimates for the years 2013-2017 include proceeds from privatization operations for
an amount equal to about 1 percentage point of GDP a year.
3) Including non-consolidated interest.
Source: Bank of Italy, Supplement to the statistical bulletin ‘Finanza pubblica, fabbisogno e debito’ of 15 March
2013.
III.5 TREND OF DEBT-TO-GDP RATIO
While in 2011 the debt-to-GDP ratio was only marginally revised upward, from
120.7 per cent, reported in last September’s Update Note of the Economic and
Financial Document, to 120.8 per cent, the figure for 2012 now stands at a level
which is higher than that forecast in the EFD Update, as it has now reached 127
per cent. While in the first case the revision was due to standard statistical
revisions relating to both the aggregate stock of public debt (by the Bank of Italy)
and GDP (by ISTAT), what caused the increase over the forecasts for 2012 was
mainly the performance of the debt volume, which was €12 billion higher than the
September estimates 201215. This evolution is partly accounted for by a higher-
than-expected increase in the public sector borrowing requirement and partly by
an accelerated pace of bond issuance, which contributed to consolidating the
Treasury’s cash position at the end of the year.
For 2013 the debt-to-GDP ratio is forecast to increase further by over 3 GDP
percentage points compared to 2012, thus reaching 130.4 per cent, a figure which
is about 4.3 percentage points of GDP higher than the estimate made in the EFD
15 In line with forecasts, the 2012 debt stock was affected by the privatization operations of Fintecna, Sace
and Siemest, for a total amount of about € 7.8 billion; the operation will be completed in the course of the year and will involve another 0.9 billion.

III. NET BORROWING AND PUBLIC DEBT
MINISTERO DELL’ECONOMIA E DELLE FINANZE 33
Update of 2012. This evolution has different causes: a smaller role is played by the
‘carry-over’ effect from 2012 (about 0.7 points of GDP) and a GDP level for the
year estimated to be slightly smaller (by about 0.5 percentage points), while the
most significant factor is a substantial upward revision of the public sector
borrowing requirement (by about 3.3 points of GDP), also due to the measure to
unfreeze the payment of general government payables to suppliers16. Compared to
the EFD Update, no major changes result from the impact of loans granted to Euro
Area countries, whose overall effect on debt, in terms of GDP for the years 2012
and 2013, remains basically unchanged; however, the impact of the rescheduling
of the loan to Greece was taken into account.
In 2014 we witness a first, albeit moderate, reduction of the debt-to-GDP
ratio, which is forecast to stand at 129 per cent, slightly less than 6 percentage
points of GDP and above the September forecast. In addition to the obvious
reason, i.e. the higher level of the previous year, in this case this figure is also
due to a much higher (by about two GDP points) level of the public sector
borrowing requirement compared to that predicted in the EFD Update estimates,
mainly because of the impact of the above-mentioned Decree Law.
FIGURE III.4: DEBT-TO-GDP RATIO (including and excluding loans to Euro-Area countries)
From 2015 onwards the pace at which the ratio declines appears to be quite
sustained, about 4 GDP percentage points a year. The dwindling financial impact
of the mentioned Decree Law, combined with its positive impact on the real
economy are certainly the key factors underlying this decline, which is also clearly
favored by the virtuous performance of the borrowing requirement from 2016
onwards and the prospect of proceeds from the sale of real estate properties,
constantly fetching amounts equal to about 1 GDP percentage point a year also
after 2015.
In 2017 the ratio will reach 117.3 per cent, which, net of loans to Euro Area
countries, corresponds to about 113.8 per cent. Although this is still a high figure,
16 Decree Law No. 35/2013.
100
105
110
115
120
125
130
135
2000 2001 2002 2003 2004 2005 2006 2007 2008 2009 2010 2011 2012 2013 2014 2015 2016 2017
%
Debt-to GDP ratio (gross)
Debt-to GDP ratio (net)

ECONOMIC AND FINANCIAL DOCUMENT - SECTION I STABILITY PROGRAMME
34 MINISTERO DELL’ECONOMIA E DELLE FINANZE
if one compares it to the 126.9 per cent forecast for this year, it is evidence of a
constant and sustained consolidation effort.
III.6 THE DEBT RULE AND OTHER RELEVANT FACTORS
In order to promote economic stability, restore business confidence and
prevent future crises in the Euro Area and in the European Union, the European
Parliament and the Council adopted in October 2011 a package of six new
legislative acts, the so-called Six Pack. The latter changes the regulation (UE
1467/97) governing the excessive deficit procedure. The main novelties are the
introduction of a numerical criterion to assess the reduction of the debt-to-GDP
ratio and convergence towards the 60 per cent threshold as well as the
identification of a series of important factors to be considered in assessing
compliance with that criterion.
The debt rule
The criterion introduced with the so-called Six Pack envisages that Member
States, whose debt exceeds 60 per cent of GDP, should reduce that ratio at an
appropriate pace and converge towards the benchmark. For the reduction to be
considered adequate the distance of the debt-to-GDP ratio from the 60 per cent
threshold should be reduced at a pace of a twentieth a year, calculated on the
basis of the average of the three years before the assessment.
At operational level, failure to comply with the debt rule is assessed on the
basis of three successive quantitative conditions. If none of these conditions are
met, an excessive deficit procedure is triggered. More specifically, in case the
debt is higher than 60 per cent of GDP and moves away from the benchmark
developed on the basis of the average of the last three years, two further criteria
must be taken into account, that is to say: a) if, based on forecasts at unchanged
policies, a debt correction is expected in the two years following the first year
when the assessment is made; b) if there are significant effects that are due to
the impact of the economic cycle that explain the gap with the benchmark. Only
if both (a-b) conditions are not met, the excessive deficit procedure is triggered
and a report is drafted under Article 126(3) of TFUE.
For Member States currently undergoing the excessive deficit procedure a
transition period is envisaged for the application of the debt rule. As of the year
of the abrogation of the excessive deficit procedure and for the following three
years, the States concerned must envisage a structural fiscal adjustment of such
an extent as to secure realistic and continuous progress towards the debt
benchmark. The fiscal adjustment must in any case be designed in a way that
meets the following conditions:
Yearly structural adjustment must not vary from the minimum linear
structural adjustment required by over 0.25 per cent of GDP;
At any time during the transition period, the remaining yearly structural
adjustment should not exceed 0.75 per cent of GDP.

III. NET BORROWING AND PUBLIC DEBT
MINISTERO DELL’ECONOMIA E DELLE FINANZE 35
The first assessment by the Commission and the European Council of Italy’s
compliance with the debt rule will be made in 2015, that is to say at the end of
the three-year transition period after the excessive deficit procedure was closed.
Against this backdrop, the debt benchmark has been obtained on the series of
the planned debt including EFSF/ESM contributions, bilateral loans to Greece and
the other stock-flow adjustment factors, observed during the 2012-2014 period.
Based on these assumptions, in 2015 the benchmark would be 122.2 per cent of
GDP vis-à-vis the ratio planned by the Government equal to 125.5 per cent of
GDP, thereby signaling a possible a non-compliance with the debt criteria.
However, considering adjustment for the cycle and debt development in the years
after 2015 (the forward-looking benchmark calculated at t+2) the above criterion
does not seem to be violated.
In order to measure the quality of adjustment towards the benchmark, a
simulation exercise has been developed. The figures below present the isoquants
relating to the possible combinations between primary surplus (on the y axis) and
the differential between GDP growth and implicit interest rate (on the x axis) that
guarantee that debt-to-GDP ratio is equal to the benchmark. The exercise has
been made with reference to 2015, the first year when the debt rule shall be
applied (figure above), and to 2017 corresponding to the forward-looking
benchmark (figure below).
The points shown in the two figures portray the different combinations
between the primary surplus and the differentia between GDP growth and the
implicit interest rate corresponding, in the figure above, to the debt-to-GDP ratio
of 2012, 2013 and 2015 (with and without the impact of the economic cycle), and,
in the figure below, to 2017. As is clearly shown, the improvement in the primary
surplus achieved between 2012 and 2013 and planned for 2015 would allow to get
close to the benchmark and to overcome it if the debt in 2015 was adjusted for
the effects of the cycle in the three previous years. Moreover, despite the
presence of relevant factors, any gap in the debt reduction as against the
benchmark that might arise will be bridged by accelerating the privatization
process that will be set out more clearly by the next Government. In the following
years, maintaining a structurally balanced budget seems to be the necessary
prerequisite for complying with the debt rule by 2017 by an ample safety margin.

ECONOMIC AND FINANCIAL DOCUMENT - SECTION I STABILITY PROGRAMME
36 MINISTERO DELL’ECONOMIA E DELLE FINANZE
FIGURE III.5: COMBINATIONS OF PRIMARY SURPLUS, GROWTH RATE AND NOMINAL INTEREST RATES THAT ALLOW FOR MEETING THE DEBT BENCHMARK IN 2015 AND 2017
Fonte: Elaborazioni MEF.
The role of relevant factors in measuring debt
When, on the basis of the analysis of the previous section, the debt-to-GDP
ratio deviates from the benchmark and does not meet any of the additional
quantitative criteria described above, before opening an excessive deficit
procedure, the Commission is called upon to draw up a report17, in which
qualitative assessments of a certain number of “other relevant factors” are
carried out. An analysis of these factors is therefore a requirement in the
assessment leading to the launching of an excessive deficit procedure due to
failure to reduce the debt by an “appropriate rate”.
17 Under Article 126(3) TFUE.

III. NET BORROWING AND PUBLIC DEBT
MINISTERO DELL’ECONOMIA E DELLE FINANZE 37
In this regard, regulation 1467/97 as modified by the Six Pack has extended
the list of the relevant factors to be considered in assessing compliance with the
debt criterion.
These factors are important in assessing the overall fiscal sustainability of a
country and include: i) the developments of the debt over the medium terms, in
addition to risk factors such as maturity structure and the currency denomination
of the debt; ii) the stock-flow adjustment and its composition; iii) the
accumulated reserves and other financial assets; iv) the guarantees, in particular
those linked to the financial sector; v) the liabilities, both explicit and implicit,
related to ageing; vi) the level of private debt, to the extent that it may represent
a contingent implicit liability for the government.
Among these factors, the new provisions on the application of the debt
criterion attribute particular importance to financial aid to support the financial
stability of the Euro Area (EFSF and ESM and bilateral contributions to Greece) as
well as to the composition of the stock-flow adjustments.
If the non-compliance with the debt criterion is only due to the above-
mentioned relevant factors (also during the so-called transition period) the
excessive deficit procedure shall not be trigger against the State that does not
comply with the quantitative benchmarks.
With specific reference to Italy, some relevant factors that have an impact on
the debt level between 2012 and 2014 are: aid programmes to other European
countries (capital accounts contributions to ESM, payments into EFSF and bilateral
loans to Greece) and the settlement of general government payables (under
Decree Law No. 35 of April 8, 2013). Overall, these factors account for 1.9 per
cent of GDP in 2012, while their impact has been estimated at 2.1 per cent of GDP
in 2013 and finally at 1.6 per cent of GDP in 2014.


MINISTERO DELL’ECONOMIA E DELLE FINANZE 39
IV. SENSITIVITY ANALYSIS
IV.1 SENSITIVITY TO ECONOMIC GROWTH
The sensitivity of Italy's public finance to economic growth for the 2013-2017 period is assessed by generating two alternative macroeconomic scenarios which respectively provide for higher and lower growth vis-à-vis the baseline scenario, and which, among other things, allow for simulating the pattern of net borrowing and public debt in the event of improvement or deterioration of the underlying macroeconomic conditions. The higher and lower growth scenarios assume that real GDP growth is 0.5 percentage points per year above or below the forecast of the baseline scenario1.
The different GDP growth dynamics of the two alternative scenarios change the pattern of potential output and, therefore, of the output gap. The primary surplus is adjusted in both its structural and cyclical components. The total cyclical component is obtained by multiplying the output gap by the elasticity of the budget balance to economic growth, while the calculation of structural revenues and expenditures, which is needed for deriving the overall structural component, requires the application of a correction coefficient to baseline revenues and expenditures2. The change in the pattern of the primary surpluses influences the trend of the debt-to-GDP ratio and, consequently, interest expenditure. In deriving the debt-to-GDP ratio, it is assumed that the implicit interest rate and the stock-flow adjustment in the alternative scenarios are identical to those projected in the baseline scenario (Chapter III, Table III.9).
In the lower growth scenario, the net borrowing in 2013 would be equal to -3.1 per cent of GDP, or 0.2 percentage points higher than in the baseline scenario.
1 The higher growth scenario assumes stronger growth of the global economy, both for developed and
emerging countries, more robust international trade, and the absence of tensions on prices of oil and other commodities. The euro would l appreciate more than in the baseline scenario, whereas the spread between yields on sovereign debt among euro area countries would reduce compared to the assumption carried out in the baseline scenario. Italy's economy would witness stronger growth of exports and investments, while the unemployment rate would be lower due to better job market prospects. Instead, in the lower growth scenario, it is assumed that, vis-à-vis the baseline framework, global economic growth would be more contained, the trend of international trade would be unfavourable, and further tensions would appear on the sovereign debt market. The prices of oil and other commodities would increase and the euro would depreciate. The weakening of domestic and foreign demand would cause more modest growth and the labour market would remain limp.
2 In order to obtain the structural revenues and expenditure in the higher (lower) growth scenario it is necessary to add to the corresponding variable a component given by the product between revenue or expenditure elasticity to economic growth and the relative difference between the potential GDP in the alternative scenario and that of the baseline scenario. .

ECONOMIC AND FINANCIAL DOCUMENT - SECTION I STABILITY PROGRAMME
40 MINISTERO DELL’ECONOMIA E DELLE FINANZE
TABLE IV.1: SENSITIVITY TO GROWTH 1 (percentage value)
2012 2013 2014 2015 2016 2017
Higher growth scenario -0.8 1.0 3.8 3.9 3.7 3.9
Nominal GDP growth rate Baseline scenario -0.8 0.5 3.2 3.3 3.2 3.2
Lower growth scenario -0.8 -0.1 2.6 2.6 2.5 2.6
Higher growth scenario -2.4 -0.8 1.8 2.0 1.8 1.9
Real GDP growth rate Baseline scenario -2.4 -1.3 1.3 1.5 1.3 1.4
Lower growth scenario -2.4 -1.8 0.8 1.0 0.8 0.9
Higher growth scenario -0.4 0.2 0.5 0.6 0.7 0.8
Potential GDP growth rate Baseline scenario -0.5 0.0 0.2 0.3 0.3 0.5
Lower growth scenario -0.6 -0.2 0.0 0.0 0.0 0.1
Higher growth scenario -3.6 -4.6 -3.4 -2.0 -0.9 0.2
Output gap Baseline scenario -3.6 -4.8 -3.8 -2.6 -1.7 -0.8
Lower growth scenario -3.6 -5.1 -4.3 -3.4 -2.6 -1.8
Higher growth scenario -3.0 -2.6 -1.3 -0.9 0.1 0.8
Net borrowing Baseline scenario -3.0 -2.9 -1.8 -1.5 -0.9 -0.4
Lower growth scenario -3.0 -3.1 -2.2 -2.3 -1.7 -1.5
Higher growth scenario -1.1 -0.1 0.5 0.2 0.6 0.7
Cyclically adjusted budget balance Baseline scenario -1.1 -0.2 0.3 -0.1 0.0 0.0
Lower growth scenario -1.1 -0.3 0.2 -0.4 -0.3 -0.5
Higher growth scenario 2.5 2.6 4.2 4.8 5.9 6.6
Primary surplus Baseline scenario 2.5 2.4 3.8 4.3 5.1 5.7
Lower growth scenario 2.5 2.3 3.4 3.7 4.5 4.9
Higher growth scenario 4.5 5.1 6.0 5.9 6.4 6.5
Cyclically adjusted primary surplus Baseline scenario 4.5 5.1 5.9 5.7 6.1 6.1
Lower growth scenario 4.5 5.0 5.8 5.6 5.9 5.9
Higher growth scenario 127.0 129.5 126.9 122.1 116.5 110.5
Public debt Baseline scenario 127.0 130.4 129.0 125.5 121.4 117.3
Lower growth scenario 127.0 131.3 131.0 129.0 126.5 124.0 1) The rounding to the first decimal point may cause the lack of consistency between the variables. Note: The cyclically adjusted balances for the alternative scenarios were calculated by using the semi-elasticity of revenues (equal to 0.04) and expenditures (equal to -0.5) to economic growth, while the total cyclical component was calculated using the semi-elasticity of the net borrowing to economic growth (equal to 0.55). In addition, for technical reasons, it is assumed that the total amount of the future fiscal interventions (equal to 0.6 per cent of GDP during the2015-2017 period) is entirely realized through expenditure cuts.
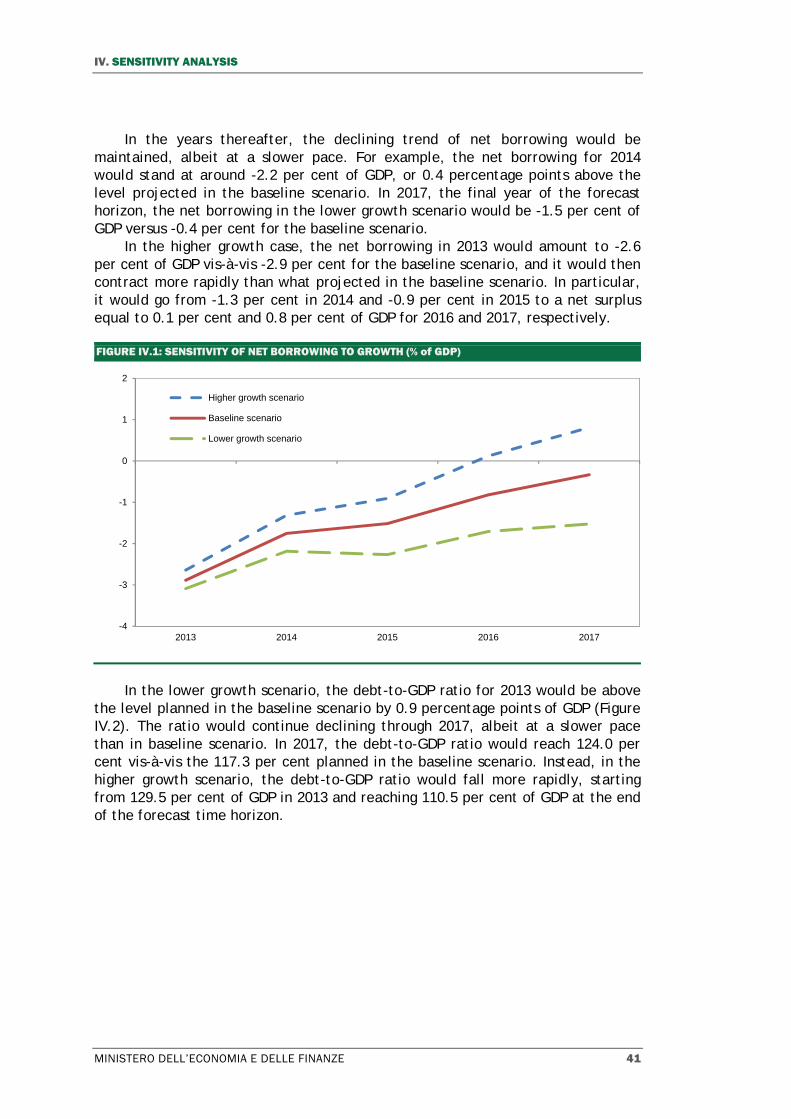
IV. SENSITIVITY ANALYSIS
MINISTERO DELL’ECONOMIA E DELLE FINANZE 41
In the years thereafter, the declining trend of net borrowing would be maintained, albeit at a slower pace. For example, the net borrowing for 2014 would stand at around -2.2 per cent of GDP, or 0.4 percentage points above the level projected in the baseline scenario. In 2017, the final year of the forecast horizon, the net borrowing in the lower growth scenario would be -1.5 per cent of GDP versus -0.4 per cent for the baseline scenario.
In the higher growth case, the net borrowing in 2013 would amount to -2.6 per cent of GDP vis-à-vis -2.9 per cent for the baseline scenario, and it would then contract more rapidly than what projected in the baseline scenario. In particular, it would go from -1.3 per cent in 2014 and -0.9 per cent in 2015 to a net surplus equal to 0.1 per cent and 0.8 per cent of GDP for 2016 and 2017, respectively.
FIGURE IV.1: SENSITIVITY OF NET BORROWING TO GROWTH (% of GDP)
In the lower growth scenario, the debt-to-GDP ratio for 2013 would be above
the level planned in the baseline scenario by 0.9 percentage points of GDP (Figure IV.2). The ratio would continue declining through 2017, albeit at a slower pace than in baseline scenario. In 2017, the debt-to-GDP ratio would reach 124.0 per cent vis-à-vis the 117.3 per cent planned in the baseline scenario. Instead, in the higher growth scenario, the debt-to-GDP ratio would fall more rapidly, starting from 129.5 per cent of GDP in 2013 and reaching 110.5 per cent of GDP at the end of the forecast time horizon.
-4
-3
-2
-1
0
1
2
2013 2014 2015 2016 2017
Higher growth scenario
Baseline scenario
Lower growth scenario

ECONOMIC AND FINANCIAL DOCUMENT - SECTION I STABILITY PROGRAMME
42 MINISTERO DELL’ECONOMIA E DELLE FINANZE
FIGURE IV.2: SENSITIVITY OF PUBLIC DEBT TO GROWTH (% OF GDP)
IV.2 SENSITIVITY TO INTEREST RATES
The sensitivity of the public debt to the trend of market interest rates is analysed by examining the level of interest expenditure in relation to the stock of government securities outstanding and by estimating the impact of potential shocks on the yield curve, with consequent sudden, permanent increases in the cost of issuing public debt securities on the primary market.
The results of the analysis depend on the current and future mix of the stock of negotiable government securities which, at the end of December 2012, consisted of domestic issues (96.32 per cent), and securities issued on foreign markets either in euros or another currency (3.68 per cent).
When considering all government securities outstanding at the end of 2012, including both domestic and foreign issues, the mix of the debt by type of instrument was essentially in line with that at the end of 2011, and therefore, the trend of the outstanding replicates that of the more recent years, except for the shorter term component (which includes BOTs) which slightly differentiated with respect to the previous trend. The debt structure as of 31 December 2012 compared with that as of December 2011 indicates growth in the BTP stock at nominal value (from 66.47 per cent to 66.79 per cent)3, and thus a continuation of what occurred in the past few years, but there is also a simultaneous increase in the BOT stock (from 8.30 per cent for 2011 to 9.22 per cent for 2012) which reflects a difference with respect to the recent past. Such dynamics were however offset by another reduction of the floating-rate component (CCTs and CCTeu), which went from 9.06 per cent in December 2011 to 7.48 per cent at the end of 2012.
3 It should nonetheless be noted that the weight of BTP securities with residual life of five years or less has
increased, even though only slightly.
110
115
120
125
130
135
2013 2014 2015 2016 2017
Higher growth scenario
Baseline scenario
Lower growth scenario

IV. SENSITIVITY ANALYSIS
MINISTERO DELL’ECONOMIA E DELLE FINANZE 43
Despite the market difficulties, especially in the March-July 2012 period, the Treasury nonetheless managed to move in step with the policy adopted in recent years in terms of reducing, or at least containing, the portion of the debt exposed to rate fluctuations. The increased issues in the BOT segment, which were partly needed to contribute to the refinancing of huge volumes of securities coming due in the first four months of the year, were more than offset by the decrease in CCT/CCTeu issues, which was moreover due to specific conditions of reduced market liquidity and depth manifested in some parts of the year, which caused a drastic reduction in the quantities offered (just over €5 billion versus €21 billion for the preceding year). The reduction of the CCT share was also affected by several buy-back transactions effected through the Amortization Fund for a total nominal volume of approximately €650 million.
The issues of 15-/30-year BTPs were conspicuously lower with respect to 2011, partly due to the high volatility of the segment, which made it quite difficult to place securities in this segment of the yield curve. Such situation led to a significant rebalancing of issues with 7-/10-year maturities, including through relying on off-the-run securities, and issues with 3-year maturities, even though the total volume of BTPs placed during the year was inevitably slightly lower than in 2011.
The ratio of foreign securities to the total debt also declined, going from 4.29 per cent in 2011 to 3.68 per cent in 2012, with part of the reduction reflecting fewer opportunities to issue at advantageous conditions.
The component of the debt indexed to the European HICP4 (BTP€i) experienced only a slight decrease (from 7.63 per cent in 2011 to 7.43 per cent in 2012), despite the significant market difficulties. The market for these Italian securities was adversely impacted by the downgrade of their rating by the rating agencies5, which automatically knocked the BTP€i out of important European bond indices. This especially penalised the issues with 10-, 15- and 30-year maturities, while the medium-term maturities, namely, those coming due in 5 and 10 years, experienced a reduction in volume, but not significantly if compared with the preceding year.
On the other hand, a sizeable increase was seen in the securities indexed to the national rate of inflation, partly due to the introduction of the BTP Italia, the new 4-year security dedicated to retail investors and indexed to Italian inflation6. This security was issued three times during 2012 for a total volume of more than €27 billion (equal to 1.65 per cent of the debt). The Treasury has used this instrument for consolidating its direct issuance to this type of clientele (which has historically been a crucial investor base for Italian public debt), making highly innovative use of MOT screen-based market, the bond market regulated and operated by Borsa Italiana.
Figure IV.3 illustrates the trends described thus far, with reference to the aggregate of domestic government securities only: stability of the fixed-rate component, the reduction of floating-rate component, the slight contraction of
4 Harmonised Index of Consumer Prices. 5 Reference is made to downgrade of Italy by the rating agency, Moody’s, in July, which was followed in
January by downgrades made by Fitch (to A-) and of Standard & Poor’s (from A3 to Baa2). 6 Consumer Price Index for Households Headed by Manual Labourers and Clerical Employees (FOI).

ECONOMIC AND FINANCIAL DOCUMENT - SECTION I STABILITY PROGRAMME
44 MINISTERO DELL’ECONOMIA E DELLE FINANZE
the issues indexed to the European HICP which is more than offset by the increase in the securities indexed to Italian inflation, for the effect of the introduction of the BTP Italia.
FIGURE IV.3: MIX OF DOMESTIC GOVERNMENT SECURITIES OUTSTANDING
Evaluating the exposure of the debt to interest-rate and refinancing risks on
the basis of summary measures that reflect the debt-management policy decisions made in 2012, it is possible to see that the magnitude of such risks, though slightly increasing over 2011, is still in line with recent years (Figure IV.4): the total average life of all government securities was 6.62 years as of 31 December 2012, decreasing with respect to the 6.99 years as of 31 December 2011, although such decline is modest if evaluated from an historical perspective. A similar trend was seen with the average refixing period which is also calculated with respect to the domestic government securities only; such period went from 5.81 years at the end of 2011 to 5.51 years at the end of 2012, thus attesting to a modest increase in variable-rate risk7.
Financial duration moved in the opposite direction, rising to 4.74 years as of 31 December 2012, compared with 4.66 at the end of 2011, with part of the change due to the trend of market rates and the scaling down of the floating-rate component of the debt.
The reductions in the average life and in the average refixing period can be explained by market conditions in 2012 that made the placements of 15- and 30-year BTPs less efficient and more risky, and that, to a lesser extent, limited the issues of 10-year BTPs when compared with 2011: the ratio of 15- and 30-year issues to total domestic securities issues went from 3.20 per cent in 2011 to 0.82 per cent in 2012, while the comparable ratio for 10-year securities went from
7 The downsizing of the CCT/CCTeu issues outstanding and the simultaneous increase in BOTs outstanding
will obviously tend to reduce the average life of the debt, but the same will increase the debt's financial duration when considering that the exposure to rate risk on the CCT/CCTeu is on average higher than that for the BOTs (with the former, the coupon is reset every six months, whereas it is done annually for the latter).
0%
10%
20%
30%
40%
50%
60%
70%
80%
1999 2000 2001 2002 2003 2004 2005 2006 2007 2008 2009 2010 2011 2012
Floating BTP€i Fixed Rate BTPItalia

IV. SENSI
MINISTER
13.21 pyear issin 2011 goes up
Fina2011 tovery moffset bthrough
FIGURE IV
Wh
in the fcounterto forecpercentadditionGDP in transferare lowEFD, arand CCTstabilizeborrowi
8 ThEmployeeswere issue
3,0
3,5
4,0
4,5
5,0
5,5
6,0
6,5
7,0
7,5
8,0
Yea
rs
ITIVITY ANALY
RO DELL’ECON
er cent in 2sues, includ to 22.08 p
p to 27.80 pally, the to
o 9.09 per carginal incby the benh the introd
V.4: AVERAGE
hen considefirst monthsrbalance thcasts done tage point nal debt buthe secondrred entire
wer in the fre explainedTeu), and bed via feweing requirem
he securities inds (FOI) were noed for the first t
1999 2000
A
D
YSIS
NOMIA E DELL
2011 to 10.ing HICP-lin
per cent in per cent. otal inflatiocent in 2012crease in enefits comiuction of th
E LIFE AND FIN
ering sensitis of 2013 anhe modest iin April 20on the yiel
urden equald year and ly to the cfirst two yed by an es
by the reducer maturitiement to be
dexed to Consuot included sinctime in 2012.
2001 2002
Average Life
Duration
LE FINANZE
21 per centnked securi2012. If the
n-linked iss2, if the BTexposure toing from ghe new inst
ANCIAL DURA
vity to intend that proincrease in 13, an instalds on gove to 0.15 po0.46 pointsost of the ears than ttimated lowction of thees or throug covered.
mer Price Indexce the figure w
2003 2004
t in 2012; oities8, rose e BTP Italia
sues went fTP Italia is io inflation;greater divtrument ded
ATION OF GOVE
erest rates,ojected for exposure tantaneous, ernment secoints of GDPs in the thidebt after he comparwer reliance total borrgh an expec
x for Householdwould not be c
2005 2006 2
on the othefrom 21.04
a securities
rom 7.63 pencluded, an; such incrersificationdicated to
ERNMENT SECU
the trend the next feto interest- permanentcurities woP in the firsrd year. Th 5.51 yearsable valuesce on floatrowing per ycted reduce
ds Headed by Momparable with
2007 2008 2
er hand, the per cent o are added
er cent of tnd thus entrease appen of supplyretail inves
URITIES
of the debtew years wi-rate risks. t upward sh
ould translat year, 0.33
his increases. Such valus set out ining-rate issyear, whiched level of
Manual Labourerh 2011, since s
009 2010 20
45
e 3- and 5-of the total , the ratio
the debt in tails only a ears amply y obtained stors.
t structure ill partially According hift of one ate into an 3 points of e would be ues, which n the 2012 sues (BOTs h would be the State's
rs and Clerical such securities
011 2012

ECONOMIC AND FINANCIAL DOCUMENT - SECTION I STABILITY PROGRAMME
46 MINISTERO DELL’ECONOMIA E DELLE FINANZE
The PA's interest expenditure for 2012 reflected an increase of approximately €8 billion year on year, going from 5.0 per cent of GP to 5.5 per cent. The increase is mostly attributable to the central administrations and in particular, to the main categories of domestic government securities, with the most significant increases being those for BOTs and BTPs/BTPs€i: in the case of BOTs, the increase stems from a higher quantity of securities issued year on year and from historically high rates on these securities near the end of 2011 and in the June-July 2012 period; instead, for the BTPs/BTPs€i, the change comes from the historically high rates at issuance (in particular, those at the end of 2011 and in the March-July 2012 period) and, to a much lesser extent, the increase in the absolute value of the stock with respect to 2011. The weighted average cost on the new issues was nonetheless once again falling in 2012, getting down to 3.11 per cent versus 3.61 per cent for 2011 (Figure IV.5), thus demonstrating how the increase in interest expenditure is mostly to be attributed to spill-over effects on 2012 of the cost of the issues placed in the final months of 2011.
FIGURE IV.5: RATIO OF INTEREST EXPENDITURE TO GDP AND WEIGHTED AVERAGE COST AT ISSUANCE
The interest expenditure estimates for 2013-2017 were developed by using
the Italian yield curve's implicit rates as of mid-March 2013; the estimates project that the ratio of interest expenditure to GDP will fall in 2013 to 5.3 per cent (versus 5.5 per cent for 2012) and will then increase modestly each year to get to 6.1 per cent in 2017. Even though the current shape of the yield curve suggests rising rates, particular for short- and medium-term maturities, and notwithstanding a slower rate at which the ratio of interest expenditure to GDP declines, the rather slow rate of increase in interest expenditure is mainly attributable to the debt structure and to absolute volumes to be issued in the next few years that should remain stable at the 2013 levels.
11,1
8,7
6,4
4,6
3,4
4,8
4,3
3,7
2,7
2,7
2,5 3,
3 4,1
4,1
2,2
2,1
3,6
3,1
0
2
4
6
8
10
12
14
1995 1996 1997 1998 1999 2000 2001 2002 2003 2004 2005 2006 2007 2008 2009 2010 2011 2012
average cost at issuance
interest burden

MINISTERO DELL’ECONOMIA E DELLE FINANZE 47
V. SUSTAINABILITY OF PUBLIC FINANCES
V.1 THE IMPACT OF POPULATION AGEING ON FISCAL SUSTAINABILITY
The assessment of fiscal sustainability is a fundamental part of budgetary surveillance within the European Union. Although there is not an unambiguous definition, the sustainability of public finances is normally described as a government's ability to meet the future financial charges on the debt. The capacity of repaying high levels of debt is dependent, amongst other things, on the degree of development of the financial markets, on perceived risks, on the capacity of policymakers to implement credible economic policies and, last but not least, on projected demographic trends over the medium/long term.
The deterioration of budget balances due to the 2009 financial crisis has contributed to generating additional risks for the sustainability of public budgets. Indeed, such risks are added to those already due to the process of population ageing. As widely acknowledged, the European population is likely to experience significant demographic changes in the next few decades, as a result of low fertility rates, a gradual increase in life expectancy and the retirement of the baby-boom generation1.
According to the projections of the 2012 Ageing Report2, the report jointly prepared by the European Commission and the Economic and Policy Committee, Working Group on Ageing (EPC-WGA), it is likely that the maintenance of sound and sustainable public finances in the medium/long term in some EU Member States could be jeopardized by the growing weight of population ageing with a negative impact on both economic growth and public expenditure3.
According to the European Commission's recent projections4, the fiscal risks generated by population ageing are relatively lower in Italy than in the other leading European countries thanks to the pension and healthcare reforms implemented by Italy in recent years. On the other hand, when considering Italy's high level of public debt, the sustainability of public finances in the medium/long term is subordinated to rigid control over public finance and the maintenance of high primary surpluses.
Consistent with the methodological indications agreed at a European level as part of the EPC-WGA, Italy traditionally runs medium/long-term projections in
1 In this regard, see the EUROPOP2010 projections published by Eurostat. 2 European Commission-Economic Policy Committee, (2012), The 2012-Ageing Report: Economic and
Budgetary Projections for the EU-27 member States (2010-2060). http://ec.europa.eu/economy_finance/publications/european_economy/2012/pdf/ee-2012-2_en.pdf. 3 For instance, the ratio between the inactive population of age 65 or older and the employed (20-64 age
bracket) is expected to rise from 40 in 2010 to 74 per cent in 2060 in the EU-27. 4 European Commission, (2012), Fiscal Sustainability Report 2012, European Economy No. 8.
http://ec.europa.eu/economy_finance/publications/european_economy/2012/pdf/ee-2012-8_en.pdf.

ECONOMIC AND FINANCIAL DOCUMENT - SECTION I STABILITY PROGRAMME
48 MINISTERO DELL’ECONOMIA E DELLE FINANZE
relation to four components of age-related expenditure: public expenditure for pensions, healthcare and long-term care (LTC) expenditures for the elderly and disabled, education expenditure and expenditure for social safety nets5.
The projections are based on the demographic assumptions of the Eurostat baseline scenario6, while the macroeconomic assumptions are those of the scenario agreed by the EPC-WGA for the 2012 Ageing Report (EPC-WGA baseline scenario). In addition, from 2011 to 2017, the projections incorporate national accounting data and the short-term macroeconomic framework outlined in the 2013 EFD (Chapter II)7. The interaction of the aforementioned assumptions determines a real GDP growth rate around 1.4 per cent per year on average for the 2013-2060 period. Starting from 2018, the GDP deflator and the inflation rate are assumed to be equal to 2 per cent.
The age-related expenditure projections reported in Table V.1 have been updated on the basis of the regulatory framework in place as of April 2013.
The pension expenditure projections are mainly based on the provisions established in the ‘Fornero Reform’ (Law No. 214/2011) 8. More specifically, for 2012 and 2013, the projections incorporate the effects of the indexing of pensions to the cost of living only for pensions that are no more than three times the minimum state pension. In addition, the forecast takes into account the provisions aimed at increasing the number of workers “safeguarded” from the increase in pension eligibility requirements provided in the most recent reform with reference to the specific cases defined by law during 2012. Finally, the projections take into account the measures to facilitate the accumulation of pension eligibility periods with various pension funds.
5 The projections have been carried out using the long-term forecasting model of the State General
Accounting Office (Ragioneria Generale dello Stato). 6 The demographic assumptions are those related to the Eurostat baseline, with the base year of 2010
(EUROPOP 2010). This scenario contemplates the following for Italy: i) a net annual flow of immigrants equal, on average, to 310,000, with a diminishing trend; ii) life expectancy at 2060 of 85.5 years for men and 89.7 years for women; and iii) a total fertility rate of 1.57 as of 2060.
7 The projections have been revised to include adjustments needed for reconciling the short-term macroeconomic data with the medium/long term structural values defined in the EPC-WGA baseline scenario. Such reconciliation concerned only the employment variables since the trend of productivity was left unchanged as from 2018. More specifically, the employment differences seen in 2017, in the comparison between the short-term forecasts of the and updated long-term baseline scenarios, are gradually zeroed out over a 5-year period, in the case of rates of activity, and over a 12-year period, in the case of the unemployment rate. Turning to the medium/long-term structural trends of the macroeconomic variables, the assumptions of the EPC-WGA baseline scenario call for an annual rate of change in real productivity that rises during the first part of the forecast period, before converging at 1.54 per cent as of 2030. The rate of employment (15-64 age bracket) is projected to rise from 56.8 per cent in 2012 to 60.3 per cent of the 2060. It is furthermore useful to note how the 2012 EPC-WGA baseline macroeconomic scenario combines the European Commission's employment projections produced in the 2011 spring forecasts (for the 2011-2012 period) and extrapolated to 2015, with the forecasts obtained with the cohort simulation model that were developed by the EPC-AWG. The combination of the two sets of forecasts that respectively cover the short term and the medium/long term was carried out using a method that creates discontinuity in the transition from 2015 to 2016. In Italy's case, this discontinuity translates into a 2.3 per cent reduction of the employment levels used for projecting GDP, when compared with the forecasts obtained with the cohort simulation model. In order to supply a representation of employment variables consistent with the employment trends actually incorporated into the growth assumptions defined in the scenario, the projected values of the rates of activity were recomputed to a corresponding extent. Accordingly, they are structurally 2.3 per cent below those published by the EPC-WGA in the 2012 Ageing Report.
8 The pension expenditure projections incorporate the financial effects of the measures contained in reforms adopted in 2011 and 2012, namely, those of Decree-Law No. 98/2011 (converted with amendments by Law No. 111/2011), Decree-Law No. 138/2011 (converted with amendments by Law no. 148/2011), Decree-Law No. 201/2011 (converted with Law No. 214/2011), Decree-Law No. 95/2012 (converted with Law No. 135/2012) and Law No. 228/2012 (Stability Law 2013).

V. SUSTAINABILITY OF PUBLIC FINANCES
MINISTERO DELL’ECONOMIA E DELLE FINANZE 49
The projections for healthcare expenditure for 2013-2017 include the cost-containment measures adopted since 2010 and already incorporated in the projections last year9. However, as a result of the recent ruling of the Constitutional Court10 which restricted the central government's regulatory power in matters for which is not exclusively responsible, the projections also take into account, for an amount equal to €2.0 billion, the additional financial effects due to the non-applicability some provisions establishing the cost-sharing of the private sectors in healthcare expenditure. In addition, the projection includes the additional cost-containment effects as provided by the measures contained in Decree-Law no. 95/201211 and in the 2013 Stability Law12.
Finally, the projections of the age-related expenditure incorporate the most recent regulatory changes with regard to the expenditure for social safety nets13 and education14.
Overall, the age-related expenditure for the 2010-2060 period remains stable at around 28 per cent of GDP (Table V.1). However, the expenditure falls slightly in the years after 2015, before climbing again as of 2035, thus reflecting the retirement of the baby-boom generation, to reach 29.3 per cent of GDP in 2050. In the outer years of the projections horizon, the age-related expenditure falls significantly, converging to the same level reported for 2010 as a percentage of GDP.
The examination of the individual expenditure items shows that pension expenditure as a share of GDP initially grows exclusively as a result of the economic recession (which is projected to continue again in 2013) and the consequent contraction in the output levels, and then declines to reach approximately 15.2 per cent of GDP between 2025 and 2030. Thereafter, the ratio starts to rise again, hitting a high of 16.3 per cent of GDP in 2040-2045. In the final years of the projections horizon, the ratio of pension expenditure to GDP rapidly declines to reach the level of 14.6 per cent in 2060.
The projection of healthcare expenditure is carried out on the basis of the methodology used for the so-called “reference scenario” developed by the EPC-WGA which takes into account not only the effects of population ageing, but also the consequences of other explicative factors15. Consequently, after initially
9 Decree-Law No. 78/2010 converted into Law No. 122/2010 and Decree-Law No. 98/2011 converted into
Law No. 111/2011. 10 Constitutional Court, Ruling No. 187/2012 about the provisions of Article 17, Paragraph 1, letter d) of
Decree-Law No. 98/2011. 11 Converted with Law No. 135/2012. 12 For additional information, see the detailed analysis contained in Section II of the 2013 EFD. 13 The projections of social safety nets incorporate the measures provided by Law No. 92/2012 covering
labour market reform and Law No. 228/2012 (2013 Stability Law), among which, the refunding over what had already been provided by Law No. 92/2012 of special wage supplementations schemes (ammortizzatori sociali in deroga).
14 The education expenditure projections incorporate the effects of cost containment coming from the process of streamlining public school staffing, including through the reduction of the gap in the student/teacher ratio vis-à-vis other countries (Decree-Law No. 112/2008 converted in the Law No. 133/2008). In addition, through 2017, the forecast takes into account the application of current law with respect to compensation trends, including therein the effects of the containment measures provided by Decree-Law No. 78/2010 (converted in Law No. 122/2010) and Decree-Law No. 98/2011 (converted in Law No. 111/2011), as well as the effects of Law No. 240/2010, Law No. 183/2011 (2012 Stability Law), Decree-Law No. 95/2012 (converted with Law No. 135/2012) and Law No. 228/2012 (2013 Stability Law).
15 The baseline scenario provides that: i) 50 per cent of the increases in life expectancy are considered as years spent in good health; ii) the trend of the unit cost moves in line with GDP per capita; and iii) the elasticity

ECONOMIC AND FINANCIAL DOCUMENT - SECTION I STABILITY PROGRAMME
50 MINISTERO DELL’ECONOMIA E DELLE FINANZE
decreasing for the effect of the measures to curb the trend of spending, the ratio between healthcare expenditure and GDP is expected to rise starting from 2020 and stands at approximately 8.0 per cent during the last decade of the projection period.
In terms of GDP, the long-term care expenditure for the elderly and disabled16 is projected to be stable for the initial years of the projection horizon, and then presents an increasing profile which continues over the entire period, reaching 1.6 per cent in 2060.
The forecast expenditure for social safety nets as a percentage of GDP goes instead from 0.7 per cent in 2010 to approximately 1.0 per cent in 2015, and then peters out gradually to reach a value of just over 0.6 per cent as from 2030.
Finally, the projection of education expenditure as a share of GDP17 shows a reduction in the initial years and up to 2017, mostly for the effect of the measures to contain spending on staff as envisaged by laws and regulations currently in force. The ratio then gradually declines further for 15 years for due to the decrease in the number of students, as caused by demographic trends. The ratio starts to grow again slightly during the final part of the projection period, standing at around 3.4 per cent of GDP in 2060.
of the unit cost with respect to GDP per capita is above 1.0 (it falls on a linear basis during the forecast period, going from the initial level of 1.1 to 1.0 in 2060). For the long-term care (LTC) component of healthcare expenditure, the “reference scenario” provides for the partial application of the increase of the life expectancy in line with what envisaged for the acute component of healthcare expenditure; the trend of the unit cost is pegged to GDP divided the total hours worked, and the elasticity of unit cost to GDP per worker is equal to 1.0 for the entire forecast period.
16 The public expenditure for Long-term Care consists of cash benefits for old or disabled people (80 per cent of the total amount) and social-assistance services supplied at a local level (20%). With reference to the latter, the projection of the ratio between the expenditure and GDP was carried out in accordance with the assumptions of the so-called “reference scenario”. Instead, with reference to monetary allowances, the amount of the benefits is tied to the trend in GDP per capita starting in 2018, in line with the methodology agreed at by EPC-WGA. The projections presented in the EDF differentiates from those prepared by the EPC-WGA for the fact of taking into account the structure by age of the persons receiving the benefits which, if ignored, would entail an underestimation of the trend of the expenditure.
17 The definition of education expenditure agreed at the level of the EPC-WGA includes the International Standard Classification of Education (ISCED) levels of education 1-6. Pre-primary school (ISCED 0 level) and life-long learning are thus excluded from the aggregate (See European Commission, Special Report n°1/2006). The total expenditure is quantified based on source data from UNESCO/OECD/EUROSTAT (UOE) (See European Commission, The 2012-Ageing Report: Underlying Assumptions and Projecting Methodologies, 2011). The forecast incorporates the updating of the UOE data in relation to the financial year of 2010.

V. SUSTAINABILITY OF PUBLIC FINANCES
MINISTERO DELL’ECONOMIA E DELLE FINANZE 51
TABLE V.1: PUBLIC EXPENDITURE FOR PENSIONS, HEALTHCARE, LONG-TERM CARE, EDUCATION AND UNEMPLOYMENT COMPENSATION (2010-2060)
2010 2015 2020 2025 2030 2035 2040 2045 2050 2055 2060
in % GDP
Total expenditure 50.5 49.3 53.3 51.5 50.0 49.3 48.5 47.6 46.0 43.8 41.3
Including: age-related expenditure 28.3 28.4 27.6 27.3 27.4 28.2 28.9 29.4 29.3 28.7 28.2
Pension expenditure 15.3 16.1 15.6 15.2 15.2 15.8 16.1 16.3 15.9 15.1 14.6
Healthcare expenditure 7.3 6.9 6.8 7.0 7.2 7.4 7.6 7.8 7.9 8.0 8.0
Including: long-term care 0.9 0.9 0.8 0.8 0.9 0.9 1.0 1.1 1.2 1.2 1.2
Expenditure for assistance to the elderly 1.0 1.0 1.0 1.0 1.1 1.2 1.2 1.3 1.4 1.5 1.6
Education expenditure 4.0 3.6 3.4 3.4 3.3 3.3 3.3 3.4 3.4 3.4 3.4
Expenditure for unemployment compensation 0.7 0.9 0.8 0.7 0.6 0.6 0.6 0.6 0.6 0.6 0.6
Interest expenditure 4.6 5.8 4.6 3.2 1.7 0.2 -1.2 -2.5 -3.8 -5.3 -7.0
Total revenues 46.1 49.4 49.5 49.5 49.4 49.4 49.4 49.4 49.4 49.4 49.4
Including: property income 0.6 0.6 0.6 0.6 0.6 0.5 0.5 0.5 0.5 0.5 0.5
ASSUMPTIONS %
Labour productivity growth rate 2.8 0.7 0.9 1.5 1.5 1.5 1.5 1.5 1.5 1.5 1.5
Real GDP growth rate 1.7 1.5 1.8 2.1 1.4 1.2 1.2 1.3 1.4 1.5 1.4
Male participation rate (20-64) 78.5 79.8 79.2 78.7 78.4 78.4 78.7 79.1 79.2 79.2 79.2
Female participation rate (20-64) 54.6 57.7 59.0 58.9 59.1 59.4 59.8 60.0 60.2 60.2 60.2
Total participation rate (20-64) 66.5 68.7 69.1 68.8 68.9 69.0 69.4 69.8 69.9 70.0 70.0
Unemployment rate 8.4 11.6 9.3 7.3 6.9 6.9 6.9 6.9 6.9 6.9 6.8
Population of age 65 and over/total population 20.2 21.4 22.3 23.5 25.5 27.8 29.8 31.1 31.5 31.6 31.7
Old-age dependency ratio (65 and over/[20-64]) 33.3 35.7 37.6 40.1 44.5 50.3 56.0 59.8 61.2 61.5 61.6
Notes: The forecast of the various expenditure components incorporates the financial effects of the reform measures adopted in 2011and 2012 as reported in the text. For the 2013-2017 period, the forecast incorporates the estimated healthcare expenditureunderlying the public-finance forecast. Source: MEF analyses developed using the long-term forecast model of the General State Accounting Office, with the use of Eurostatdata.

ECONOMIC AND FINANCIAL DOCUMENT - SECTION I STABILITY PROGRAMME
52 MINISTERO DELL’ECONOMIA E DELLE FINANZE
FOC
US
The pension reform The new rules introduced by the reform adopted with Law no. 214/2011 have significantly changed the pension system, improving its sustainability in the medium/long term and ensuring greater fairness between generations.
As of 2012, the reform establishes the extension of the contribution-based regime to all workers, including those who, on the basis of preceding legislation, would have received a pension calculated according to the earnings-related regime (namely, all individuals who had accrued more than 18 years of contributions as of 31 December 1995). In line with theregulatory frameworks of most European countries, the reform confirms two types of retirement: a) old age retirement which can allowed with at least 20 years of contributionsand a statutory age requirement pre-defined by the law; and b) early retirement allowed at an age below that for old age retirement but requiring a longer period of contributions18.
As of 2013, all age requirements (including those for obtaining social allowances) and the contribution requirements for being entitled to early retirement regardless of age are indexed to changes in life expectancy as measured by ISTAT with reference to the three preceding years. The adjustment of the eligibility requirements to changes in life expectancywill occur every three years and, starting from the adjustment subsequent to 2019, every two years, on the basis of an entirely administrative procedure19. In addition, starting from 2013, the calculation of the transformation coefficients20 at the time of retirement is extended up to the age of 70. Similarly, by subsequent legislative interventions, somesafeguard measures have been provided in order to guarantee a more gradual applicationof the reform for well identified categories of workers which are in the proximity to retirement and that present difficult situations related to the permanence in the labour market.21.
As a result of all of the reforms implemented since 2004, the average retirement age(taking into consideration both the statutory retirement age and the requirements for early retirement) rises from 60-61 during the 2006-2010 period to approximately 64 in 2020, 67 in 2040 and then around 68 in 2050. Cumulatively, the savings derived from the overall reform process started in 2004 amount to around 60 percentage points of GDP until 2050. One-third of those savings is due to the reform introduced with Law no. 214/2011 and two-thirds to previous measures.
18 For detail on the age and contribution requirements needed to be entitled for an old-age pension, early
retirement, and social allowances, see the box on the reform of the pension system included in the Update to the 2012 Stability Programme.
19 The adjustment of the requisites taking effect as of 2013, in accordance with the law (Article 12, Paragraph 12-bis of Decree-Law No. 78 of 31 May 2010, converted with amendments into Law No. 122 of 30 July 2010) has been set in three months. As a matter of facts, subsequent adjustments will be those estimated ex-post by ISTAT, according to the proceedings provided by current laws and regulations. It is worth noting that Law No. 214/2011 contains a safeguard clause on the basis of which the minimum age requirement for old-age pensions cannot be less than 67 for anyone becoming eligible for retirement as from 2021. However, on the basis of the latest ISTAT demographic projections, the statutory retirement age for old age pension is projected to be 67 as early as 2019.
20 The transformation coefficient is also to be updated with the same calendar used for adjusting the eligibility requirements. The adjustment taking effect on 1 January 2013 was adopted by a decree of 15 May 2012, published in the Official Journal of the Republic of Italy on 24 May 2012.
21 The total amount of workers entitled to such safeguard measures is approximately 130,000. The safeguard is applied to workers who will be entitled to a pension after 31 December 2011 (all people who have met the pension eligibility requirements by such date are expressly exempted from the application of the changes established by Law No. 214/2011) and that have difficulty of remaining in the labour market. Such workers must also fall within the categories expressly pre-defined by the law and, starting from 2013, may retire in the next few years on the basis of the rules previously in force. .

V. SUSTAINABILITY OF PUBLIC FINANCES
MINISTERO DELL’ECONOMIA E DELLE FINANZE 53
PUBLIC EXPENDITURE FOR PENSIONS AS % OF GDP UNDER DIFFERENT LEGISLATIONS 1
1) EPC-WGA Baseline scenario - 2013 Stability Programme.
V.2 DEBT SUSTAINABILITY
On the basis of the assumptions about the long-term demographic and macroeconomic trends and taking into consideration the projections for the ageing-related expenditures described in the previous section (Table V.1), the sustainability of the public finances in the baseline scenario is analysed both through the projection of the debt-to-GDP ratio over the years 2018-2060 and through the calculation of several sustainability indicators consistent with the methodology used by the European Commission22.
The projection of the debt-to-GDP ratio
The debt-to-GDP ratio and the structural primary surplus, net of the one-off measures indicated for 2017, represent the starting point for the exercise. Starting from 2018, the structural primary surplus is adjusted according to the pattern in the output gap (which is assumed to close on a linear basis during the 2018-2020 period), age-related expenditures, and property income23. It is also assumed that the real rate of interest (3.0 per cent per year) is kept constant over the 2018-2060 period, while the GDP deflator converges at 2.0 per cent in the three years after 2017. It follows that the nominal interest rate converges at 5.0 per cent in 2020.
The comparison between the trend of the debt-to-GDP ratio in the baseline scenario of this document and that presented in the preceding Stability
22 European Commission, 2012, Fiscal Sustainability Report 2012, European Economy No. 8. 23 Property income corresponds to capital income (debt and equity securities) and annuities from the
ownership of natural resources. The long-term trend thereof (2018-2060) is projected on the basis of the methodology agreed at the level of the EPC-WGA.
0.013
0.014
0.015
0.016
0.017
0.018
0.01920
06
2008
2010
2012
2014
2016
2018
2020
2022
2024
2026
2028
2030
2032
2034
2036
2038
2040
2042
2044
2046
2048
2050
2052
2054
2056
2058
2060
Current legislationLegislation before DL 201/2011Legislation before DL 98/2011Legislation before DL 78/2010Legislation before L. 243/2004

ECONOMIC AND FINANCIAL DOCUMENT - SECTION I STABILITY PROGRAMME
54 MINISTERO DELL’ECONOMIA E DELLE FINANZE
Programme shows a higher starting point for the debt-to-GDP ratio; this is due to low GDP growth, but also and more importantly, to Italy’s contributions to financial programs in support of Greece and the EFSF and the ESM as well as the payment of the public administration debts and arrears. However, on the basis of a structural primary surplus which, in 2017, is expected to be in line with the starting point planned in last year’s document (6.1 per cent of GDP), the debt-to-GDP ratio falls below the threshold of 60 per cent of GDP in 2027, with a couple of years of delay compared with the projection presented in the 2012 Stability Programme (Figure V.1)
FIGURE. V.1: PUBLIC DEBT PROJECTION COMPARED WITH PREVIOUS STABILITY PROGRAMME (% of GDP)
Source: MEF analyses developed using the long-term forecast model of the General State Accounting Office
The sustainability indicators
On the basis of the European Commission's methodology, the sustainability gaps (S1 and S2) and the required primary balance (RPB)24 are calculated as summary measures of the degree of the medium/long-term sustainability of the public finances. However, in comparison with the previous Stability Programme, a new method has been introduced for calculating S1, which differs from previous method in two aspects: the debt target of 60 per cent of GDP is brought to 2030 rather than 2060 and it is possible to assume a gradual cumulative fiscal effort through 2020 which then has to be kept constant for the subsequent 10 years. Accordingly, the new S1 measures the permanent adjustment of the structural primary balance (in percentage of GDP) needed to reach a debt level of 60 per cent of GDP in 2030, assuming linear improvement in the structural primary surplus from 2018 to 2020, and then maintaining the level of 2020 until 2030. Instead, the S2 indicator continues to measure the permanent adjustment of the
24 For a detailed description of the indicators, see Chapter 8 of the Fiscal Sustainability Report 2012,
European Economy No.8/2012.
0
20
40
60
80
100
120
140
2015
2016
2017
2018
2019
2020
2021
2022
2023
2024
2025
2026
2027
2028
2029
2030
2031
2032
2033
2034
2035
2036
2037
2038
2039
2040
2041
2042
2043
2044
2045
2046
2047
2048
2049
2050
2051
2052
Stability Programme 2012 Stability Programme 2013

V. SUSTAINABILITY OF PUBLIC FINANCES
MINISTERO DELL’ECONOMIA E DELLE FINANZE 55
structural primary balance needed so that the trend of the public debt will comply with the inter-temporal budget constraint over an infinite time horizon. Finally, the required primary balance (RPB) measures the average structural primary surplus in the first 5 years of the projection period (namely, from 2018 to 2022) consistent with the adjustment suggested by the value of S2. All of the indicators are based on growth forecasts and budget balances that are extrapolated by incorporating the medium/long-term projections of age-related expenditures. The higher and more positive the values of the S1 and S2 sustainability indicators, the greater will be the need for fiscal adjustment and thus, the greater the sustainability risk will be.
In turn, the S1 and S2 indicators may be broken down into components that provide useful information about the origin and the timing of the fiscal adjustments needed to guarantee the sustainability of the debt over the long term horizon (Table V.2).
The first component, the initial budgetary position, is common to both indicators, and measures the distance between the structural primary surplus as of 2017 (equal to 6.1 per cent of GDP) and the structural primary surplus that would keep the debt-to-GDP ratio constant at the initial level (117.3 per cent of GDP) ceteris paribus. With reference to S1, this component includes the cost of delaying the fiscal adjustment since it is assumed that the effort needed will not completely occur immediately, but is to be reached on a linear basis between 2018 and 2020, before staying constant for the decade thereafter. A second component, which is specific to S1, is the debt requirement in 2030; this shows the adjustment needed for bringing the debt from the initial level to 60 per cent of GDP in 2030. Finally, a third component, common to both indicators, measures the additional adjustment for covering the increase in age-related expenditures. In the case of S1, the adjustment is moved forward to 2030.
The results show a negative value for both the S1 and S2 indicators. It follows that the planned fiscal consolidation is shown to be sufficient for ensuring the long-term sustainability of the public finances. This conclusion is confirmed by the required primary balance which, with a value of 2.3 per cent, is below the primary surplus projected for 2017.
Despite the deterioration of the initial conditions due to a higher debt level forecast from 2013 to 2017, the significant increase of the structural primary balance projected over the time horizon covered by this Stability Programme will allow a convergence toward a debt level equal to 60 per cent of GDP, when moving that target forward to 2030, and will counterbalance the emergence of fiscal costs related to population ageing. Indeed, for both the S1 and S2 indicators, the value of the initial budgetary position remains negative (-4.9 per cent and -4.8 per cent, respectively), signalling the capacity of Italy's public finances, given the budget conditions planned for 2017, to cover the mounting interest-to-GDP ratio (snow ball effect) expected over the medium/long term.
On the other hand, considering the greater effort needed to achieve the debt-to-GDP ratio of 60 per cent in 2030 rather than in 2060 as previously envisaged, the components of S1 related to the debt requirement and the cost of ageing are higher than the values set out in the previous Stability Programme.

ECONOMIC AND FINANCIAL DOCUMENT - SECTION I STABILITY PROGRAMME
56 MINISTERO DELL’ECONOMIA E DELLE FINANZE
TABLE V.2: LONG-TERM SUSTAINABILITY INDICATORS
Sustainability indicators S1 S2 RPB Value -1.7 -4.5 2.3 including: Initial budgetary position -4.9 -4.8 -
Debt requirement in 2030 4.1 - -
Long-term changes in the primary balance 0.9 0.3 -
Source: MEF analyses
V.3 ANALYSIS OF SENSITIVITY OF PUBLIC-DEBT DYNAMICS OVER THE LONG TERM
The sensitivity analysis carried out in this section is aimed at (i) testing the robustness of the results in view of their intrinsic uncertainty and (ii) verifying under which reform assumptions and on the basis of which budget conditions, the sustainability of the debt can either be guaranteed or is at risk.
Accordingly, the discussion below refers to different alternative scenarios that replicate the assumptions underlying the sensitivity analyses included in the European Commission's 2012 Sustainability Report. Such scenario are set imposing permanent changes to the assumptions used for the baseline as far as demographic, macroeconomic and fiscal are concerned (for instance, the impact of the change in the initial level of the primary surplus on debt dynamic is simulated). In addition, the results are presented in relation to a so-called risk scenario in which the impact of non-demographic factors exerts additional pressure on the expected trend of healthcare expenditure and expenditure for long-term care of the elderly and disabled.
The sensitivity analysis with respect to demographic variables
Population ageing represents one of the most critical aspects that Italy will need to tackle in the coming decades. In this regard, it is particularly important to evaluate properly, through various simulations, both the impact of migratory flows expected in coming decades, and the consequences of an increase in total life expectancy on Italy's public finances over the medium and long term.
With reference to the impact of immigration, the simulation, in line with what agreed at the level of the EPC-WGA and on the basis of an ad-hoc demographic scenario developed by EUROSTAT, assumes the average net flow per year of immigrants decreases by 10 per cent with respect to the baseline assumption for the 2018-2060 period.
With regard to the simulation of the impact of the increase in life expectancy, it is assumed that the probabilities of death of both genders are adjusted downward so as to determine, as of 2060, a one-year increase in life expectancy vis-à-vis the assumption of the baseline scenario.
The trend of the public debt in the two alternative scenarios is compared with the baseline in Chart V.2. Given the values of the public debt and the structural primary balance projected by the Government as of 2017, the

V. SUSTAINABILITY OF PUBLIC FINANCES
MINISTERO DELL’ECONOMIA E DELLE FINANZE 57
consequences of a smaller immigration flow on debt sustainability appear negligible. Even the possible consequences of an increase in life expectancy appear barely relevant, mainly due to the introduction of the mechanisms to adjust the eligibility requirements for being entitled to a pensions and linking them to changes in life expectancy. In both cases, the debt-to-GDP ratio falls rapidly, and dips below 60 per cent around 2030.
FIGURE V.2: SENSITIVITY OF PUBLIC DEBT TO A REDUCTION OF THE NET FLOW OF IMMIGRANTS AND A 1-YEAR INCREASE IN LIFE EXPECTANCY (% of GDP)
Source: MEF analyses developed using the long-term forecast model of the General State Accounting Office.
The sensitivity analysis with respect to macroeconomic variables
The sensitivity analysis with respect to macroeconomic variables aims at testing the robustness of the projections of the debt-to-GDP ratio vis-à-vis alternative scenarios that assume more favourable or less favourable trends for labour productivity, the employment rate, and the activity rate of elderly and female workers.
With reference to productivity, the simulation exercise calls for two alternative scenarios in which the growth rate of labour productivity is permanently increased or decreased by 0.1 percentage points with respect to the baseline scenario starting in 2025. The convergence to the new level is to be achieved gradually during the 2018-2025 period and remains constant in the years thereafter. The impact on sustainability of a better (worse) trend of productivity appears only marginally significant in the short term and long term (Figure V.3).
0
20
40
60
80
100
120
2018
2019
2020
2021
2022
2023
2024
2025
2026
2027
2028
2029
2030
2031
2032
2033
2034
2035
2036
2037
2038
2039
2040
2041
2042
2043
2044
2045
2046
2047
2048
2049
2050
2051
2052
baseline net migration -10% Life expectancy (+ 1 year at birth)

ECONOMIC AND FINANCIAL DOCUMENT - SECTION I STABILITY PROGRAMME
58 MINISTERO DELL’ECONOMIA E DELLE FINANZE
FIGURE V.3: SENSITIVITY OF PUBLIC DEBT TO MACROECONOMIC ASSUMPTIONS. HIGHER AND LOWER GROWTH OF PRODUCTIVITY (% OF GDP)
Source: MEF analyses developed using the long-term forecast model of the General State Accounting Office.
Another simulation assumes that the rate of employment, calculated over the
population aged 15-64, is increased gradually through 2060 with its value being one percentage point higher than that assumed under the baseline framework. In this scenario, obtained by assuming a lower unemployment rate, the impact on the trend of debt-to-GDP ratio appears marginal during the first years of the simulation.
Instead, when considering a gradual increase in the activity rate of the population in the 55-64 age bracket by 5 percentage points in 2060 vis-à-vis the level projected in the baseline scenario, resulting in an overall increase of, the resulting pattern of the debt-to-GDP ratio experiences a significant downward shift starting in 2020 (Figure V.4).
FIGURE V.4: SENSITIVITY OF PUBLIC DEBT TO MACROECONOMIC ASSUMPTIONS. RATES OF EMPLOYMENT AND RATES OF ACTICIVITY OF THE ELDERLY AND WOMEN (% of GDP)
Source: MEF analyses developed using the long-term forecast model of the General State Accounting Office
0,00
20,00
40,00
60,00
80,00
100,00
120,00
2018
2019
2020
2021
2022
2023
2024
2025
2026
2027
2028
2029
2030
2031
2032
2033
2034
2035
2036
2037
2038
2039
2040
2041
2042
2043
2044
2045
2046
2047
2048
2049
2050
2051
2052
baseline productivity +0.1 p.p. productivity -0.1 p.p.
0
20
40
60
80
100
120
2018
2019
2020
2021
2022
2023
2024
2025
2026
2027
2028
2029
2030
2031
2032
2033
2034
2035
2036
2037
2038
2039
2040
2041
2042
2043
2044
2045
2046
2047
2048
2049
2050
2051
2052
2053
2054
2055
2056
2057
2058
2059
2060
Baseline
Activity rate of older workers + 5% as of 2060
Employment rate + 1%
Activity rate of women + 5% as of 2060
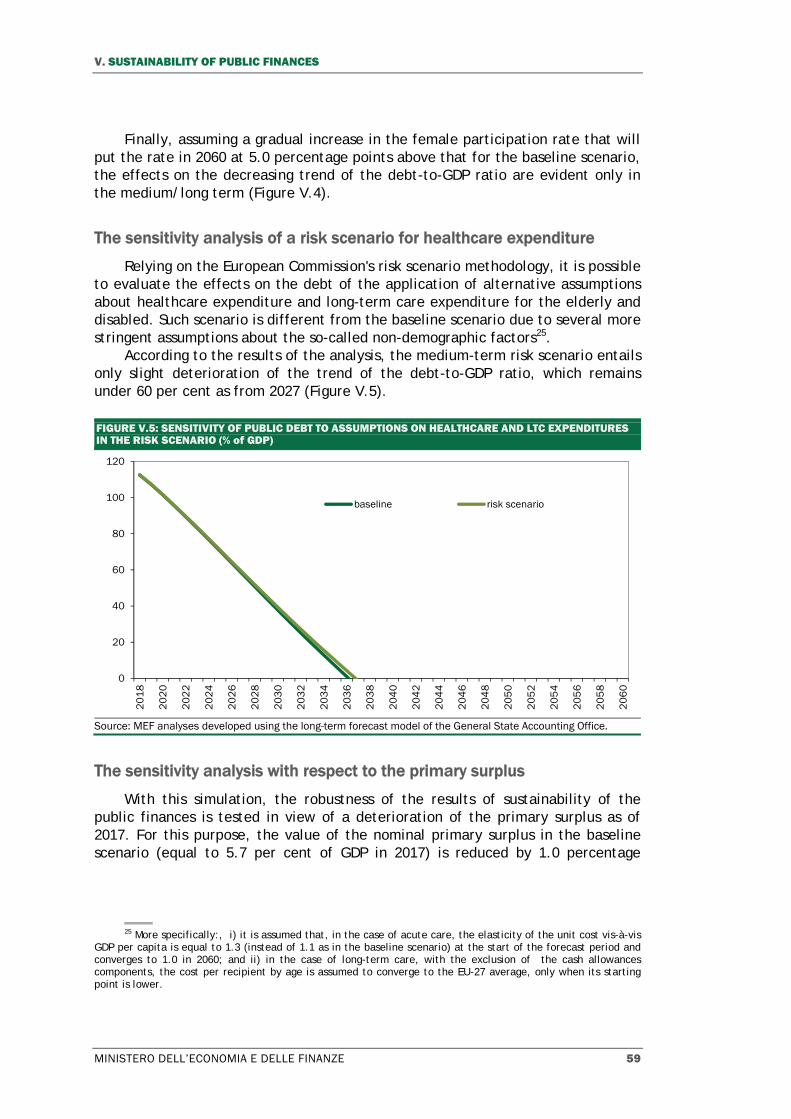
V. SUSTAINABILITY OF PUBLIC FINANCES
MINISTERO DELL’ECONOMIA E DELLE FINANZE 59
Finally, assuming a gradual increase in the female participation rate that will put the rate in 2060 at 5.0 percentage points above that for the baseline scenario, the effects on the decreasing trend of the debt-to-GDP ratio are evident only in the medium/long term (Figure V.4).
The sensitivity analysis of a risk scenario for healthcare expenditure
Relying on the European Commission's risk scenario methodology, it is possible to evaluate the effects on the debt of the application of alternative assumptions about healthcare expenditure and long-term care expenditure for the elderly and disabled. Such scenario is different from the baseline scenario due to several more stringent assumptions about the so-called non-demographic factors25.
According to the results of the analysis, the medium-term risk scenario entails only slight deterioration of the trend of the debt-to-GDP ratio, which remains under 60 per cent as from 2027 (Figure V.5).
FIGURE V.5: SENSITIVITY OF PUBLIC DEBT TO ASSUMPTIONS ON HEALTHCARE AND LTC EXPENDITURES IN THE RISK SCENARIO (% of GDP)
Source: MEF analyses developed using the long-term forecast model of the General State Accounting Office.
The sensitivity analysis with respect to the primary surplus
With this simulation, the robustness of the results of sustainability of the public finances is tested in view of a deterioration of the primary surplus as of 2017. For this purpose, the value of the nominal primary surplus in the baseline scenario (equal to 5.7 per cent of GDP in 2017) is reduced by 1.0 percentage
25 More specifically:, i) it is assumed that, in the case of acute care, the elasticity of the unit cost vis-à-vis
GDP per capita is equal to 1.3 (instead of 1.1 as in the baseline scenario) at the start of the forecast period and converges to 1.0 in 2060; and ii) in the case of long-term care, with the exclusion of the cash allowances components, the cost per recipient by age is assumed to converge to the EU-27 average, only when its starting point is lower.
0
20
40
60
80
100
120
20
18
20
20
20
22
20
24
20
26
20
28
20
30
20
32
20
34
20
36
20
38
20
40
20
42
20
44
20
46
20
48
20
50
20
52
20
54
20
56
20
58
20
60
baseline risk scenario

ECONOMIC AND FINANCIAL DOCUMENT - SECTION I STABILITY PROGRAMME
60 MINISTERO DELL’ECONOMIA E DELLE FINANZE
point, falling respectively to 4.7 per cent, 3.7 per cent and 2.7 per cent (Figure V.6).
The trend of the public debt changes significantly following the deterioration of the primary surplus as of 2017, and in particular for the levels below 4 per cent of GDP. More specifically, for an initial level of 3.7 per cent, the debt continues to decrease, but does not hit the threshold of 60 per cent until 2035 (Figure V.6). Instead, for a primary surplus of 2.7 per cent, it appears the debt-to-GDP ratio would stabilize at around 60 per cent. It is evident from these simulations that the sustainability of the public finances can be guaranteed by the baseline scenario and by the public-finance targets described in this Stability Programme, which require the maintenance of large primary surpluses.
FIGURE V.6: SENSITIVITY OF PUBLIC DEBT TO THE PRIMARY SURPLUS (% of GDP)
Source: MEF analyses developed using the long-term forecast model of the General State Accounting Office
V.4 THE IMPACT OF PENSION REFORMS ON SUSTAINABILITY
On the basis of the Government's programmed budget targets as of 2017 (namely, the achievement and maintenance of the medium-term objective), the sensitivity tests presented in the previous section show that the long-term trend of age-related expenditures should not put the sustainability of Italy's public debt at risk, even if macroeconomic, demographic or fiscal conditions were to be different. It should be noted, nonetheless, that this conclusion stems also from of a series of pension reforms over the past 20 years that have significantly contributed to reducing age-related expenditure.
Figure V.7 illustrates the implications on the debt-to-GDP ratio of the various measures adopted from 2004 to 2011 on the basis of a counterfactual analysis, which recomputes the initial levels of the debt and the primary surplus assuming the absence of the pension reforms considered. All of the reform measures considered, from 2004 to the most recent, have entailed structural effects, overall determining a reduction in the ratio of pension expenditure to GDP vis-à-
0
20
40
60
80
100
120
140
2018
2019
2020
2021
2022
2023
2024
2025
2026
2027
2028
2029
2030
2031
2032
2033
2034
2035
2036
2037
2038
2039
2040
2041
2042
2043
2044
2045
2046
2047
2048
2049
2050
2051
2052
2053
2054
2055
2056
2057
2058
2059
2060
5.7% (baseline) 4.7% 3.7% 2.7%
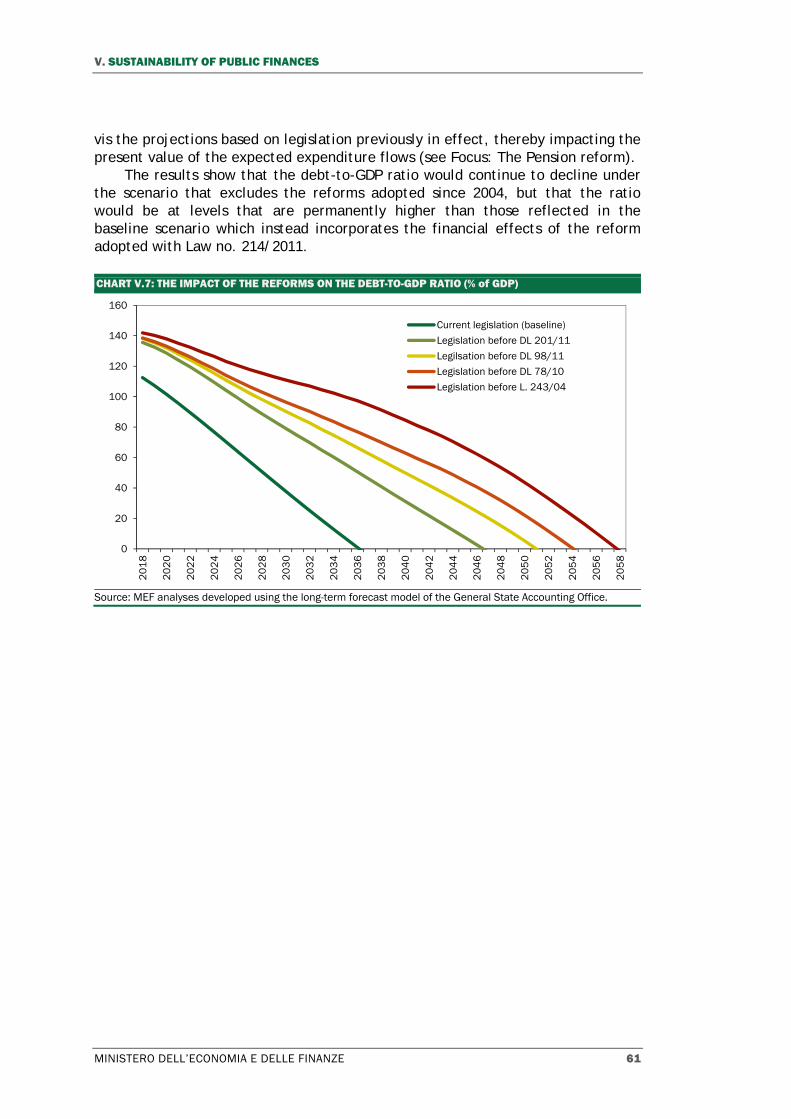
V. SUSTAINABILITY OF PUBLIC FINANCES
MINISTERO DELL’ECONOMIA E DELLE FINANZE 61
vis the projections based on legislation previously in effect, thereby impacting the present value of the expected expenditure flows (see Focus: The Pension reform).
The results show that the debt-to-GDP ratio would continue to decline under the scenario that excludes the reforms adopted since 2004, but that the ratio would be at levels that are permanently higher than those reflected in the baseline scenario which instead incorporates the financial effects of the reform adopted with Law no. 214/2011.
CHART V.7: THE IMPACT OF THE REFORMS ON THE DEBT-TO-GDP RATIO (% of GDP)
Source: MEF analyses developed using the long-term forecast model of the General State Accounting Office.
0
20
40
60
80
100
120
140
160
20
18
20
20
20
22
20
24
20
26
20
28
20
30
20
32
20
34
20
36
20
38
20
40
20
42
20
44
20
46
20
48
20
50
20
52
20
54
20
56
20
58
Current legislation (baseline)
Legislation before DL 201/11
Legilsation before DL 98/11
Legislation before DL 78/10
Legislation before L. 243/04

ECONOMIC AND FINANCIAL DOCUMENT - SECTION I STABILITY PROGRAMME
62 MINISTERO DELL’ECONOMIA E DELLE FINANZE
FOC
US
State guarantees As of 31 December 2012, the guarantees granted by the State amounted to approximately€100 billion, or 6.4 per cent of GDP; the guarantees granted to credit institutions followingthe recent financial crisis account for €85.7 billion of the total, or 5.5 per cent of GDP.
PUBLIC GUARANTEES (in € mn)
2012
Level in % of GDP
Stock guarantees 100,025 6.4
including: to the financial sector 85,679 5.5
Following are comments on the components of the aggregate:
Central guarantee fund for small- and medium-sized enterprise (SME). The fund is an industrial policy instrument of the Ministry for Economic Development which operatesthrough three distinct vehicles: direct guarantees, granted to banks and financialintermediaries; counter guarantees against guarantees granted by the collective-loan guarantee consortiums (Confidi) and other guarantee funds; and co-guarantees granted directly in favour of the financing parties and jointly to collective-loan guarantee consortiums (Confidi) and other guarantee funds or to guarantee funds set up by the EU or co-financed by the EU. As of 31 December 2011, the residual debtguaranteed amounted to approximately €8,318 million.
TAV S.p.A. The Ministry of Economy and Finance guarantees the fulfilment of theFerrovie dello Stato S.p.A.'s obligations with respect to TAV S.p.A., in relation to the concession, construction and operation of the high-speed train system. This is a surety bond designed to facilitate transactions to raise the funds on the financial marketsthat are needed for the design and construction of the high-speed network. As of 31December 2012, the residual debt guaranteed amounted to approximately €2,278 million.
Aid to the bailout of businesses. Such aid includes guarantees given by the State to companies to cover debt contracted with credit institutions for the financing of current operations and for the reactivation and completion of plant facilities, buildings andindustrial equipment. As of 31 December 2012, the residual debt guaranteed amounted to approximately €64.7 million.
Guarantees assumed by local government. The data related to the guarantees given by local governments are supplied by the Bank of Italy, which gathers the data throughthe information submitted directly the beneficiary institutions as part of their regulatory reporting. As of 31 December 2012, the residual debt guaranteed amounted to approximately €3,687 million.
Italian banks. Such guarantees are granted by the State to cover liabilities of Italian banks in relation to debt securities issued by the banks. As of 31 December 2012, the residual debt guaranteed amounted to approximately €85,679 million.

MINISTERO DELL’ECONOMIA E DELLE FINANZE 63
VI. QUALITY OF PUBLIC FINANCES
VI.1 ACTIONS TAKEN AND INDICATIONS FOR FUTURE YEARS
Actions taken
The actions taken by the Government with a decree-law in July1 and the 2013 Stability Law2 are part of a framework to maintain the stability of the public accounts. Altogether, the revenue and spending measures approved in 2012 provide for a significant reallocation of budget resources so as to achieve a reduction in fiscal pressure and a structural correction of the year-on-year trends of public expenditure.
The measures adopted to reduce fiscal burden are aimed at favouring the equity of the taxation system and supporting the development of the productive system.
On the spending side the measures reinforce, first with the provisions of the Decree-Law and then with those of the 2013 Stability Law, the spending-review process inaugurated in previous years. The measures adopted affect all levels of Government and provide for interventions which, on the basis of a comparative analysis, are aimed at the recovery of efficiency margins in the production of public goods and services and in public procurement procedures. More specifically, with regard to the General Government the request to formulate precise corrective measures in relation to specific savings targets assigned to each Ministry (according to a method already tested with the budgeting process in 2011), it will help to overcome the previous approach of linear cuts and of replanning initiatives/resources according to predetermined expenditure amount. The Local Government contribution to public finance measures is mainly made through the revision of the targets assigned to them within the Domestic Stability Pact and the reduction of treasury resources due to them. Additional savings come from healthcare initiatives, with spending measures provided in areas where operating inefficiencies or inappropriate use of resources have been detected.
In terms of net borrowing, the 2012 revenue and spending measures meet the targets set out in the Update to the 2012 EFD. In absolute terms, the planned correction amounts to approximately €600 million in 2012, €160 million in 2014 and €1 billion in 2015. The measures for 2013 provide for the use of the resources exceeding the structural balanced-budget objective for an amount of approximately €2.3 billion.
1 Decree-Law No.95/2012 converted by Law No.135/2012. 2 Law no. 228/2012.
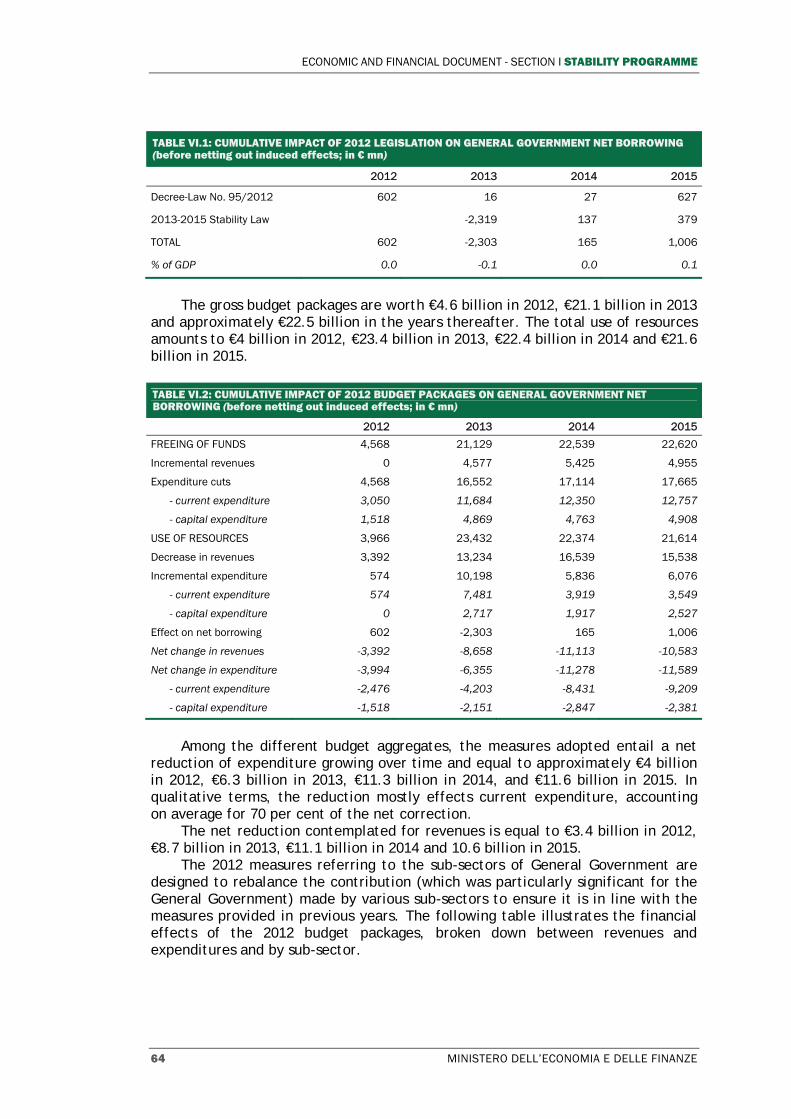
ECONOMIC AND FINANCIAL DOCUMENT - SECTION I STABILITY PROGRAMME
64 MINISTERO DELL’ECONOMIA E DELLE FINANZE
TABLE VI.1: CUMULATIVE IMPACT OF 2012 LEGISLATION ON GENERAL GOVERNMENT NET BORROWING (before netting out induced effects; in € mn)
2012 2013 2014 2015
Decree-Law No. 95/2012 602 16 27 627
2013-2015 Stability Law -2,319 137 379
TOTAL 602 -2,303 165 1,006
% of GDP 0.0 -0.1 0.0 0.1
The gross budget packages are worth €4.6 billion in 2012, €21.1 billion in 2013
and approximately €22.5 billion in the years thereafter. The total use of resources amounts to €4 billion in 2012, €23.4 billion in 2013, €22.4 billion in 2014 and €21.6 billion in 2015.
TABLE VI.2: CUMULATIVE IMPACT OF 2012 BUDGET PACKAGES ON GENERAL GOVERNMENT NET BORROWING (before netting out induced effects; in € mn)
2012 2013 2014 2015
FREEING OF FUNDS 4,568 21,129 22,539 22,620
Incremental revenues 0 4,577 5,425 4,955
Expenditure cuts 4,568 16,552 17,114 17,665
- current expenditure 3,050 11,684 12,350 12,757
- capital expenditure 1,518 4,869 4,763 4,908
USE OF RESOURCES 3,966 23,432 22,374 21,614
Decrease in revenues 3,392 13,234 16,539 15,538
Incremental expenditure 574 10,198 5,836 6,076
- current expenditure 574 7,481 3,919 3,549
- capital expenditure 0 2,717 1,917 2,527
Effect on net borrowing 602 -2,303 165 1,006
Net change in revenues -3,392 -8,658 -11,113 -10,583
Net change in expenditure -3,994 -6,355 -11,278 -11,589
- current expenditure -2,476 -4,203 -8,431 -9,209
- capital expenditure -1,518 -2,151 -2,847 -2,381
Among the different budget aggregates, the measures adopted entail a net
reduction of expenditure growing over time and equal to approximately €4 billion in 2012, €6.3 billion in 2013, €11.3 billion in 2014, and €11.6 billion in 2015. In qualitative terms, the reduction mostly effects current expenditure, accounting on average for 70 per cent of the net correction.
The net reduction contemplated for revenues is equal to €3.4 billion in 2012, €8.7 billion in 2013, €11.1 billion in 2014 and 10.6 billion in 2015.
The 2012 measures referring to the sub-sectors of General Government are designed to rebalance the contribution (which was particularly significant for the General Government) made by various sub-sectors to ensure it is in line with the measures provided in previous years. The following table illustrates the financial effects of the 2012 budget packages, broken down between revenues and expenditures and by sub-sector.

VI. QUALITY OF PUBLIC FINANCES
MINISTERO DELL’ECONOMIA E DELLE FINANZE 65
TABLE VI.3: CUMULATIVE IMPACT OF 2012 BUDGET PACKAGES ON GENERAL GOVERNMENT NET BORROWING, BY SUB-SECTOR (before netting out induced effects; in € mn)
2012 2013 2014 2015
GENERAL GOVERNMENT -1,990 -9,431 -9,317 -7,860
- net change in revenues -3,304 -8,723 -10,020 -9,140
- net change in expenditure -1,314 708 -703 -1,280
LOCAL GOVERNMENT 2,670 7,257 9,382 9,337
- net change in revenues -10 21 -943 -1,242
- net change in expenditure -2,680 -7,236 -10,325 -10,579
SOCIAL SECURITY FUNDS -78 -128 100 -471
- net change in revenues -78 45 -150 -201
- net change in expenditure 0 173 -250 270
TOTAL 602 -2,303 165 1,006
Revenue measures
The 2012 measures incorporate a total net reduction of the revenue in each year of the forecast period. The change mostly reflects the effects of the measures outlined in the Decree-Law approved prior to the summer, which accounts for €3.4 billion in 2012, €6.8 billion in 2013, €10.2 billion in 2014 and €10.3 billion in 2015, and to a lesser extent, the provisions of the 2013 Stability Law which determine approximate net reductions of €1.9 billion in 2013, €880 million in 2014 and €280 million in 2015.
The measures for reducing fiscal pressure are specifically aimed at supporting consumption and household disposable income, supplying incentives to the productive system, and favouring employment, in particular with respect to young people and smaller companies, and even more so, if the companies are operating in the Regions of southern Italy.
With reference to consumption, the Decree-Law defers the two-percentage-point increase in ordinary and reduced value-added-tax (VAT) rates to 1 July 2013 and through 31 December 2013, with a net effect of €3.3 billion in 2012, €6.6 billion in 2013 and €9.8 billion per year for 2014 and 2015. The measure is strengthened by a provision in the 2013 Stability Law that eliminates a one-percentage-point increase in the ordinary VAT rate for 2013 and completely eliminates the increase planned for reduced VAT starting from 2014 (with a revenue decrease equal to approximately €4.4 billion in 2013 and €2.3 billion per year for 2014 and 2015). In favour of households, the 2013 Stability Law increases deductions for dependent children, with the beneficial effects thereof equal to approximately €900 million in 2013, €1.3 billion in 2014 and €1.2 billion in 2015; the law also provides an incentive for productivity in businesses, by allowing the extension of the tax relief on productivity contracts (for an amount equal to €950 million in 2013, €1 billion in 2014 and €200 million in 2015). In order to encourage employment, IRAP deductions are to be raised for (i) workers hired on permanent contracts in the southern Regions (with an additional increase if used for workers

ECONOMIC AND FINANCIAL DOCUMENT - SECTION I STABILITY PROGRAMME
66 MINISTERO DELL’ECONOMIA E DELLE FINANZE
under the age of 35) and (ii) companies classified as 'small' in relation to the value of the taxable base. The total reduction of revenue arising from the relief measures is €860 million in 2014 and just over €1 billion in 2015.
Among measures providing for revenue increases (almost all of which are contained in the Stability Law), roughly one-half of the revenue comes from the introduction of stamp duties on financial transactions (Tobin tax) and from the stabilization of the increase in fuel excise taxes. The total effect of the two measures is equal to €2.1 billion in 2013 and €2.3 billion per year in 2014 and 2015. Another €800 million in 2013, €1.2 billion in 2014 and €800 million in 2015 will come from the increase in technical reserves for insurance companies, and from the non-deferral (five years) of the recognition of incremental values consequent to the realignment of the tax and book values of goodwill and other intangible assets derived from business combinations, mergers and divestitures.
Spending measures
The measures contained in the 2012 budget packages will determine net total structural expenditure reduction that increases over the forecast period and is equal to more than €11 billion in 2015. The corrective measures impact all sectors of the public administration, and are based on an approach, already used with resolve by the Government in previous years, which aims to reinforce the effectiveness and efficiency of public expenditure.
In this regard, the Decree-Law, in referring to the public administrations' purchases of goods and services, has provided for reinforcing the centralized procurement system for several categories of goods, as well as the nullification of the contracts signed in violation thereof. The projected reduction of expenditure from these measures is calculated on the basis of the statistical comparison of the operating costs sustained by various administrations. In order to support the reorganization of administrative units, the measures call for the downsizing of both managerial resources and the General Government work force (by a minimum of 20 per cent and 10 per cent, respectively), while a limitation on personnel turnover has been renewed for fire-fighters, the police force, universities and research entities (these measures should produce total savings that increase over time to get to more than €700 million in 2015). Specific parameters of reference have been defined in terms of floor space/employee in order to promote better use of public housing and to reduce the rental costs.
The targeted savings for General Government (equal to €1.5 billion for 2013 and 2014 and €1.6 billion starting in 2015) were assigned through the Decree-Law enacted in mid-2012, and are pursued through the measures that each Ministry indicated for the draft of the 2013 Stability Law or, alternately, via linear reduction of the appropriations capable of being reshaped.

VI. QUALITY OF PUBLIC FINANCES
MINISTERO DELL’ECONOMIA E DELLE FINANZE 67
TABLE VI.4: IMPACT OF DECREE-LAW NO. 95/2012 ON GENERAL GOVERNMENT NET BORROWING (before netting out induced effects; in € mn)
2012 2013 2014 2015
FREEING OF FUNDS 4,568 10,839 11,559 12,073
Incremental revenues 0 72 0 0
Expenditure cuts 4,568 10,767 11,559 12,073
Expenditure cuts by Ministries 0 1,528 1,574 1,649
Contribution of Regions, Provinces and Municipalities 2,300 5,200 5,500 5,775
Reduction of financing to National Healthcare System 900 1,800 2,000 2,100
Expenditure cuts in public procurement 141 615 615 615
Reduction of long-term contributions fund 500 500 400 400
Reduction of financing to entities and research entities 153 410 410 410 Measures affecting public employment (including turnover for fire-fighters and police force) 107 319 665 730
Other 467 394 394 393
USE OF RESOURCES 3,966 10,823 11,532 11,445
Decrease in revenues 3,392 6,837 10,237 10,300
Reduction of VAT rates 3,280 6,560 9,840 9,840
Other 112 277 397 460
Incremental expenditure 574 3,986 1,295 1,145 Tax credits on mortgage amortisation for reconstruction in Emilia Romagna 0 450 450 450
Earthquakes 0 550 550 0
Measures to support road haulage 0 400 0 0
International peacekeeping missions 0 1,000 0 0
Protected workers within pension reform 0 0 190 590
Fund for urgent and non-deferrable initiatives 0 658 0 0
North Africa emergency requirement 495 0 0 0 Taxpayer-designated charitable donations deducted from taxes paid (.005) 0 400 0 0
Other 79 528 105 105
IMPACT ON NET BORROWING 602 16 27 627
Additional savings are expected from the provisions for local governments and
the healthcare sector. The revision of the targets assigned to Local Governments with the Domestic Stability Pact and the reduction of Treasury resources accruing to them as initially provided by the Decree-Law (€2.3 billion in 2012 and more than €5 billion starting in 2013) has been rounded out by the Stability Law's measures (€2.2 billion per year for the 2013-2015 period). Amongst other things, the latter measures stipulate a rebalancing of the burden between Regions and Municipalities, providing for a reduction of the percentage applied for the purpose of calculating financial balance targets to be achieved for 2013 for those Municipalities with a population of less than 5,000.
In the healthcare sector, the measures adopted aim to ensure more efficient resource management, especially for pharmaceutical expenditure, where the mandatory discount applied to the National Healthcare Service (NHS) has been increased, the ceiling for Regional pharmaceutical assistance has been cut, and the ceiling for hospital pharmaceutical expenditure has been redetermined. More specifically, a 10-per-cent price reduction for the purchase of goods and services is provided for the entire duration of the contracts (with pharmaceuticals and

ECONOMIC AND FINANCIAL DOCUMENT - SECTION I STABILITY PROGRAMME
68 MINISTERO DELL’ECONOMIA E DELLE FINANZE
medical devices excluded), while the expenditure ceiling for medical devices has been cut with respect to the previously set levels. These provisions should lead to total savings of €900 million in 2012, €2.4 billion in 2013 and approximately €3 billion per year for 2013 and 2014.
Part of the savings obtained will be used for financing investments that principally regard initiatives to support healthcare infrastructure, certain non-deferrable expenditures related to reconstruction efforts in areas affected by recent natural disasters, and the expansion of the number of persons classified as 'protected' within the most recent pension reform.
Key initiatives include the financing of reconstruction efforts related to the earthquakes in Emilia Romagna (€550 million per year for 2013 and 2014), international peacekeeping missions in 2013 (€1 billion), and the expansion of number of persons classified as 'protected' within the most recent pension reform for an amount of €190 million in 2014 and €590 million in 2015. Investments are planned for ensuring the continuity of extraordinary maintenance work and other works in process for the railway and road networks, the continuation of the construction of the MO.S.E Project to protect Venice from floods, and the design, construction and operation of the new Turin-Lyon rail link, to a total amount of just over €500 million in 2013, €740 million in 2014 and €1.1 billion in 2015. The use of resources (a total of €800 million in 2013, €1.1 billion in 2014 and approximately €890 million in 2015) has also been authorised for: setting up a fund to pay lease payments for public buildings transferred to real estate funds; increasing of the fund for social-policy initiatives, for persons who are not self-sufficient, for scholarships and waste disposal services for the City of Aquila; and the financing of the funds related to international aid initiatives underwritten by Italy.
Finally, the incremental expenditure covers the creation of a fund for financing charges for local public transportation. The resources for the fund will come from excise taxes on gasoline and diesel fuel, which will be subdivided among the Regions based on efficiency-related criteria. All financial resources previously earmarked by the State for this purpose (with the elimination of the related funds counted as part of expenditure cuts) will flow into the new fund, with a net increase per year of approximately €450 million compared with the resources appropriated before the reorganisation.

VI. QUALITY OF PUBLIC FINANCES
MINISTERO DELL’ECONOMIA E DELLE FINANZE 69
TABLE VI.5: IMPACT OF 2013 STABILITY LAW ON GENERAL GOVERNMENT NET BORROWING (before netting out induced effects; in € mn)
2013 2014 2015 FREEING OF FUNDS 10,290 10,980 10,547
Incremental revenues 4,505 5,425 4,955 Stamp duties on financial transactions 1,004 1,215 1,202 Stabilisation of increase in fuel excise taxes 1,107 1,107 1,107 Increase in technical reserve provisions for insurance companies 623 374 374 Reduction in tax relief on purchase of company cars 412 549 532 Non-deferral of the substitute tax system 200 846 423 Increase in single state tax - elimination of stamp-duty exemption on penal certificates - VAT on cooperative services 305 458 458 Reduction in tax benefits on diesel fuel for farmers 154 100 100 Other 700 777 759
Expenditure cuts 5,785 5,555 5,592 Streamlining of healthcare expenditure 600 1,000 1,000 Spending cuts for Regions, Provinces and Municipalities 2,200 2,200 2,200 TPL Fund - abolition of Chapter 2817 and 2802 MEF 1,135 1,157 1,093 Current expenditure cuts by Ministries (Decree Law No.
95/2012) 16 -1 -1 Other 1,834 1,199 1,300
USE OF RESOURCES 12,609 10,843 10,168
Decrease in revenues 6,397 6,302 5,238 Deferral of increase in VAT rates 4,442 2,324 2,324 Extension of tax relief for labour productivity 950 1,000 200 Increase in tax deductions for dependent children 939 1,341 1,206 Reduction of regional tax on productive activity (IRAP) via lump-sum deductions for hiring of permanent workers 0 862 1,014 Fund for exclusion of IRAP for persons without a business organisation 0 188 252 Other 66 586 242
Incremental expenditure 6,212 4,541 4,931 Fund for building rents 249 847 590 Tax credit for road haulage contractors 159 212 212 Fund for financing TPL 1,600 1,600 1,600 Fund for social-policy initiatives, for persons not self-sufficient and City of Aquila - waste disposal 260 0 0 Smaller budget contribution by Local Government, incentive-based stability pact, and municipal solidarity fund 600 0 0 Extraordinary maintenance of rail network 250 300 300 Extraordinary maintenance of road network 200 100 0 Construction of MOSE system 45 200 253 Turin - Lyon rail line 20 140 550 Multilateral development funds and global fund for the environment 295 295 295 Other 2,534 847 1,131
IMPACT ON NET BORROWING -2,319 137 379 - Total expenditure cuts by Ministries (Decree Law No. 95/2012) 16 -1 -1 - Total effects of 2013 Stability Law -2,335 139 380

ECONOMIC AND FINANCIAL DOCUMENT - SECTION I STABILITY PROGRAMME
70 MINISTERO DELL’ECONOMIA E DELLE FINANZE
Indications for future years
With the cyclical phase still unfavourable, the achievement of the budget balance and the respect of financial stability will need to be rounded out by measures to support and relaunch growth and employment.
In moving in this direction, in April 2013, the Government approved an urgent provision capable of injecting liquidity into the economic system, through authorising the payments of the Public Administration's commercial debts as of 31 December 20123.
The Government's action draws on the recent acknowledgement by European leaders of the need for differentiated fiscal consolidation that permits some controlled flexibility in actions to favour growth and employment. The measure is acknowledged as extraordinary, and does not alter the substantial stability and sustainability of the financial framework.
The measures adopted allow for injecting a total of approximately €40 billion of new liquidity into the economic system over the 2013-2014 two-year period, which will cause the borrowing requirement to increase by approximately €20 billion in each of the two years (Table VI.6A). In terms of net borrowing, the impact is more modest because of the different ways in which the planned initiatives are implemented. More specifically, the €7.5 billion deficit increase in 2013 (0.5 per cent of GDP) refers to the payment of debts for capital expenditures.
The measures implemented regard the General Government, Regions, Provinces and Municipalities, and NHS Entities, and apply differently depending on the segment and the type of debt to which they refer.
The 2014 Stability Law could further reinforce the measures provided in the decree-law, with the assignment of Government securities to settle the PA's trade debts in case the creditors have transferred their receivables to banks or financial intermediaries. Any such initiative would be planned in respect of public finance objectives established in the planning documents, and would be subject to agreement of the European authorities and deliberation in Parliament.
As far as the borrowing requirement of the public administrations is concerned, the most significant part of the urgent provision adopted in April regards Local Government. The Regions, Provinces and Municipalities will be able to order incremental payments, for sums not related to healthcare, in the amount of €12.2 billion in 2013 and €7 billion in 2014. The NHS entities will instead be able to make use of incremental resources totalling €5 billion in 2013 and another €9 billion in 2014 for the payment of their commercial debts. For the General Government, some €2.5 billion in 2013 and €4 billion in 2014 will be made available for accelerating the payment of past tax refunds, and another €500 million in 2013 for the payment of debts related to supplies and public tenders.
In terms of net borrowing, the Local Government accounts for €7.2 billion of the increased deficit, with the General Government accounting for €300 million.
With reference to the Regions, Provinces and Municipalities, the provision allows for some easing of the constraints within the Domestic Stability Pact, allowing the exclusion from the target balance of Municipalities' and Provinces'
3 Decree-Law No. 35/2013.

VI. QUALITY OF PUBLIC FINANCES
MINISTERO DELL’ECONOMIA E DELLE FINANZE 71
certain and liquid capital account payments collectible as of 31 December 2012 (€5 billion in 2013). For this purpose, such entities may use resources already available in the budget (prior-year surpluses). The Regions' payments of the same type of debts are excluded from the Domestic Stability Pact (€1.4 billion in 2013).
In order to favour the transfer of liquidity to the Provinces and Municipalities, the Regions' payments of residual current liabilities due to the Provinces and Municipalities will be excluded from the constraints of the Domestic Stability Pact.
In the case of Regions, Provinces and Municipalities that do not have sufficient liquidity to make the payments (whether capital account payments arising from the easing of the Domestic Stability Pact's constraints or past debts for current expenditure), the Decree provides for the creation of a special fund for the General Government's granting of loans. For the 2013-2014 period, such advances can be for up to €4 billion for Provinces and Municipalities and up to €8 billion for the Regions and Autonomous Provinces.
The aforementioned fund will also provide advances to NHS entities for accelerating the payments of the past-due debts as of 31 December 2012, in relation to current expenditure, for a total of €14 billion (€5 billion in 2013 and €9 billion in 2014). The rules also provide for certain structural measures for defining direct mechanisms to prevent future delays within the payments system, with the setting of strict constraints on the Regions' management of the liquidity earmarked for financing the NHS.
The advances made to the Regions, Provinces and Municipalities, inclusive of those in favour of the NHS, are to be repaid, with interest thereon, over a 30-year period. The principal amounts repaid by the entities are to be earmarked for the amortization of the incremental debt coming from the collecting of the necessary resources to finance the fund.
Finally, payments made by the Regions as part of national co-financing of initiatives realized with the contribution of European structural funds will also be excluded from the Domestic Stability Pact's constraints for an amount of €800 million in 2013. This will facilitate the achievement of the spending objectives outlined by regional programmes co-financed by the European Union for 2007-2013, guaranteeing significant improvement of the capacity to draw on the structural funds available for the 2012-2014 three-year period.
Additional resources (€500 million in 2013) have also been provided for General Government to cover payment of commercial debts contracted by the Ministries for trade accounts due as of 31 December 2012 in relation to supplies and public tenders. For any portion of the debts that is not settled and with a view toward preventing the accrual of more debts, the General Government will be required to come up with special measures for reorganizing and streamlining expenditure.
The Government has also reprogrammed fiscal reimbursements, with acceleration of payment of tax refunds and increased offsetting regarding tax credits earned in prior years (due to an increase in the offsetting limits). Incremental payments of €6.5 billion have been provided for this purpose, including €2.5 billion in 2013 and €4 billion in 2014. Finally, it will be possible for taxpayers to offset certain, liquid, and enforceable receivables that have not legally expired as of 31 December 2012 due from the public administrations in

ECONOMIC AND FINANCIAL DOCUMENT - SECTION I STABILITY PROGRAMME
72 MINISTERO DELL’ECONOMIA E DELLE FINANZE
relation to supplies and tenders, with the sums due following insolvency proceedings arising from tax disputes.
TABLE. VI.6A: IMPACT OF DECREE-LAW NO.35/2013 (before netting out induced effects; in € mn)
2013 2014 2015
Borrowing requirement -20,000 -19,400 190
% of GDP -1.27 -1.19 0.01
Net borrowing -7,500 600 570 % of GDP -0.48 0.04 0.03
TABLE. VI.6B: IMPACT OF DECREE-LAW NO. 35/2013 ON GENERAL GOVERNMENT NET BORROWING (before netting out induced effects; in € mn)
2013 2014 2015
Gross budget measures 207 607 577
Incremental revenues 200 600 0
Expenditure cuts 7 7 577
- current expenditure 7 7 321
- capital expenditure 0 0 256
Measures 7,707 7 7
Decrease in revenues 7 7 7
Incremental expenditure 7,701 1 0
- current expenditure 1,901 1 0
- capital expenditure 5,800 0 0
Impact on net borrowing -7,500 600 570
Net change in revenues 194 594 -7
Net change in expenditure 7,694 -7 -577
- current expenditure 1,894 -7 -321
- capital expenditure 5,800 0 -256
TABLE. VI.6C: IMPACT OF DECREE-LAW NO.35/2013 ON GENERAL GOVERNMENT NET BORROWING BY SUB-SECTOR (before netting out induced effects; in € mn)
2013 2014 2015
GENERAL GOVERNMENT -300 600 570
- net change in revenues 194 594 -7
- net change in expenditure 494 -7 -577
LOCAL GOVERNMENT -7,200 0 0
- net change in revenues 0 0 0
- net change in expenditure 7,200 0 0
SOCIAL SECURITY FUNDS 0 0 0
- net change in revenues 0 0 0
- net change in expenditure 0 0 0
TOTAL -7,500 600 570

VI. QUALITY OF PUBLIC FINANCES
MINISTERO DELL’ECONOMIA E DELLE FINANZE 73
TABLE. VI.6D: IMPACT OF KEY MEASURES OF DECREE-LAW NO. 35/2013 2012 ON GENERAL GOVERNMENT NET BORROWING (before netting out induced effects; in € mn)
2013 2014 2015
INCREMENTAL RESOURCES 207 607 577
Incremental revenues 200 600 0
including:
Increase in value-added taxes 0 600 0
Expenditure cuts 7 7 577
including:
Reduction in spending appropriations that can be reshaped 0 0 570
USE OF RESOURCES 7,707 7 7
Decrease in revenues 7 7 7
Incremental expenditure 7,701 1 0
including:
Easing of Domestic Stability Pact for Provinces and Municipalities 5,000 0 0 Domestic Stability Pact: Regions and Autonomous Provinces: Acceleration of transfers to Provinces and Municipalities and payments to suppliers 1,400 0 0 National co-financing of EU structural funds - exception to Domestic Stability Pact 800 0 0 Payment of General Government debts - increase in fund for settlement of General Government's trade debts 500 0 0
IMPACT ON NET BORROWING -7,500 600 570
FOC
US Macroeconomic impact of fiscal consolidation measures adopted in 2012
The starting point for an analysis of the macroeconomic impact of fiscal consolidation measures adopted in 20124 is a basic simulation that generates a profile for the various aggregates based on unchanged legislation5. The framework of the exogenous variables for public finance is then modified by incorporating the measures adopted into the model and simulating this new scenario. The comparison between the results of the two simulations makes it possible to estimate the impact of the measures on GDP and other aggregates.
Based on the simulations done, the overall macroeconomic impact of the two budget laws is reported in the table. The difference between the rates of the annual percentage change obtained by taking into account the budget packages and the base simulation rates is reported for each aggregate. The simulations done show that the approved measures produce practically no effect on the level of economic activity and employment.
However, the impact is not neutral with respect to the mix of domestic demand. On the one hand, domestic demand is directly impacted by reduction of public expenditure (both in terms of public consumption and in terms of investment); on the other hand, it benefits from the positive effects on consumption of the increase in tax deductions for dependent children and the easing of the planned VAT rate increase. When compared with the base scenario, the lower increase in VAT rates will also cause a decrease in inflation for the period considered.
4 In 2012, the main fiscal consolidation measures are those approved with Decree-Law No. 95/2012,
converted into Law No. 135/2012 (spending review) and with the 2013 Stability Law (Law No. 228/2012). 5 The simulation was done with the Department of Treasury's econometric model (ITEM).

ECONOMIC AND FINANCIAL DOCUMENT - SECTION I STABILITY PROGRAMME
74 MINISTERO DELL’ECONOMIA E DELLE FINANZE
The simulations do not incorporate any possible increase in tax rates as provided by theStability Law6. The impact on economic activity would certainly be negative, and the magnitude of the increase would depend on decisions by the individual municipalities, thatwould be difficult to project.
The macroeconomic effects are based on unchanged legislation; any deferral of the planned increase in VAT rates and/or the introduction of municipal tax on garbage and services (TARES), planned for July 2013, could generate expansive effects on the level of economic activity in 2013.
MACROECONOMIC IMPACT OF FISCAL CONSOLIDATION MEASURES
Differences in the percentage rate of change 2013 2014 2015
GDP 0.0 -0.1 0.1
Private consumption 0.2 0.3 0.2
Public consumption -0.5 -0.5 -0.2
Investment -1.1 -1.2 -0.3
Exports 0.0 0.1 0.1
Imports -0.2 0.0 -0.1
Employment 0.0 0.0 0.0
Private consumption deflator -0.5 -0.2 -0.1
Finally, it should be emphasised that improving the efficiency of public expenditure will probably have positive long-term growth effects that are not captured by econometric models and extend well beyond the models' projection horizon.
6 The 2013 Stability Law provides that Municipalities may increase the property-tax (IMU) rates on buildings
for productive use by 0.3 percentage points.

VI. QUALITY OF PUBLIC FINANCES
MINISTERO DELL’ECONOMIA E DELLE FINANZE 75
FOC
US
The fight against tax evasion In recent years, tax authorities have achieved encouraging results in their efforts to fight tax evasion and tax fraud: more than €32.0 billion of incremental tax revenues were ensured to the Treasury during the 2009-2011 three-year period and, on the basis of initial indications, another €12.5 billion were collected in 2012.
RESULTS OF THE FIGHT AGAINST TAX EVASION: TAX AND NON-TAX REVENUES (million of euros)
Source: Revenue Agency (Agenzia delle Entrate).
In order to provide another impulse to the fight against tax evasion, and to round out the measures already outlined in 20117, the ‘Task Force for the Fight Against Tax Evasion’ set up by Prime Minister Monti carried out its activity in 2012. Additional directives that were issued in March 2012 not only simplified tax laws, but they also made the fight against evasion even more prominent8.
In April 2012, the Cabinet approved a legislative bill containing a mandate for revision of the tax system. The bill is aimed at continuing the activity to fight tax evasion and tax avoidance, and at reordering tax erosion9.
For this purpose, the bill has provided for defining the methods for estimating tax evasion and for monitoring the results of the fight against evasion. The reporting refers to all major taxes, and is based on comparisons between national accounting data and data acquired through the tax registry. The results are calculated and published on an annual basis. As part of the budget process, the Government prepares an annual report on the strategy followed and the results achieved10.
7 In 2011, measures to fight tax evasion were initially outlined in the financial package approved during the
summer (Decree-Law No. 98/2011, converted by Law No. 111/2011 and Decree-Law No. 138/2011, converted by Law No. 148/2011) and later, in the month of December (Decree-Law No.201 converted by Law No.214/2011).
8 Decree-Law No. 16/2012 referring to ‘Urgent measures on the subject of taxation simplification, making taxation more efficient, and strengthening tax audit procedures’.
9 The bill was presented to the Lower House (A.C. 5291) on 15 June 2012, and was examined from 11 September to 9 October 2012 by the Commission VI, where numerous parts of the original text consisting of 17 articles were amended, and the bill ended up with 4 articles. The bill was then approved by the Lower House with a confidence vote on 12 October 2012, and was sent to the Senate on 16 October 2012 (A.S. 3519).
10 Article 2, Paragraph 4,5 A.S. 3519.
0
2.000
4.000
6.000
8.000
10.000
12.000
14.000
2007 2008 2009 2010 2011 2012

ECONOMIC AND FINANCIAL DOCUMENT - SECTION I STABILITY PROGRAMME
76 MINISTERO DELL’ECONOMIA E DELLE FINANZE
The legislative bill also contemplates the building of better relationships between the taxauthorities and taxpayers. Forms of increased communication and cooperation betweenfirms and tax authorities are to be defined. In the case of large business, structuredcorporate systems are to be delineated for management and control of taxation risk, withclear assignment of responsibility within the overall internal controls system. Incentives, including the relaxation of certain formalities and the reduction of possible penalties, will be provided for the taxpayers who elect to use such tools. In the case of smaller businesses and self-employed individuals, taxpayer assistance services (including, for example, taxreturn preparation and computation of taxes) will be reviewed and expanded in order to ensure better compliance with tax law11. Finally, the bill calls for defining principles and criteria to be pursued in order to reinforce audit initiatives, in particular through targeted audits carried out with the participation of other public authorities. The revision of the laws and regulations should also result in more widespread use of electronic invoicing and payment systems subject to tracking, and reinforced international cooperation12.
As provided by the Stability Law for 2013-201513, starting in 2013, the Economic and Financial Document will report the value, in relation to the previous year, of the incremental structural revenues actually collected from the activity to fight tax evasion, while the Update to the Economic and Financial Document will include a report about the results of the tax-evasion prevention measures14.
With reference to international cooperation, Italy, France, Germany, the UK, Spain and theUnited States have defined the Model Intergovernmental Agreement with the common objective of intensifying the fight against international tax evasion and adopting an intergovernmental approach for the application of the. Foreign Account Tax Compliance Act (FACTA). The Model Agreement represents an important step in the effort to fight international tax evasion through the automated exchange of information. Indeed, with the bilateral agreements that are to be signed on the basis of the Model Agreement, specific data that financial institutions report to their respective tax authorities will be automaticallyexchanged in both directions between the United States and the other countries, inaccordance with existing agreements against double taxation. This will eliminate the need for the financial institutions involved to enter into separate contractual agreements with theU.S. tax authorities. The aforementioned countries will continue, in close cooperation withother countries, the OECD and the European Union, to promote the automated exchange ofdata and to work on common reporting principles and the application of due diligence standards as tools for coming up with a broad-based, global approach to the effective fight against international tax evasion, while keeping the burden of compliance to a minimumlevel. In May 2012, a bilateral working group was set up between the Ministries of Financeof Italy and Switzerland with the objective of studying financial and taxation matters.
11 Article 3, Paragraphs 2,3,4 and 5, A.S. 3519. 12 Article 3, Paragraph 11, A.S. 3519. 13 Article 1, Paragraphs 299 and 300, Law No. 228/2012. 14 Such report will need to indicate the strategies for fighting evasion and the comparison of the results
with the planned objectives.
VI. QUALITY OF PUBLIC FINANCES
MINISTERO DELL’ECONOMIA E DELLE FINANZE 77
FOC
US
Italian public development aid Over the next four years (2014-2017), the Government plans to consolidate the actions needed for gradually realigning Italy to the international standards for development cooperation (OECD average), with the objective of improving the quality and quantity of public development aid (PDA). This will allow Italy to raise its international profile, to establish a presence in strategic areas, to meet standards of excellence, and to enjoy comparative advantages.
Based on unchanged legislation, the estimates for 2013 provide for PDA equal to 0.15-0.16 per cent of gross national income, with an upturn with respect to 2012 (0.13 per cent). The following schedule has been outlined for 2014-2017: 2014 PDA (0.18-0.20 per cent); 2015 PDA (0.21-0.24 per cent); 2016 PDA (0.23-0.27 per cent), and 2017 PDA (0.28-0.31 per cent).
In order to achieve such targets, government measures will need to concentrate on the quantity and quality of the annual appropriations, and in particular, through:
Ongoing reorganisation and streamlining of expenditure for development cooperation, including through action designed to reform legislative provisions that govern cooperation, based on principles of unity of action and operation together with Parliament;
Confirming a gradual annual increase of at least 10 per cent in the appropriations provided by Law No. 49 of 1987, on the basis of the amounts available for 2013;
Refinancing of development funds (in particular, the IDA and African Development Fund), whose negotiations terminate at the end of 2013.


MINISTERO DELL’ECONOMIA E DELLE FINANZE 79
VII. INSTITUTIONAL ASPECTS OF PUBLIC FINANCE
VII.1 BALANCED BUDGET IMPLEMENTATION RULE
During the 2012 the process of bringing the national legislative framework in line with the most recent EU policies and the relevant regulations on fiscal and budgetary rules continued, consistently with the provisions of the Fiscal Compact (the Treaty on Stability, Coordination and Governance in the Economic and Monetary Union), required the introduction of the balanced budget rule as a national legal provision.
The introduction of this rule follows up on the commitment undertaken by the Italian Government in March 2001 as part of the Euro Plus Pact and the more stringent budgetary constraints introduced by the Six Pack in October 2011.
With a view to transposing EU regulations, in addition to the ratification of the Fiscal Compact, Parliament also adopted two specific legislative measures. The first one is a Constitutional law adopted in April 2012, which introduced a balanced budget rule in the Constitution, in compliance with EU legislation which the constitutional provision clearly refers to, according to the State ensures that the revenues and expenditure of its budget are balanced, allowing for the upturns and the downturns of the cycle1, and that its debt is sustainable. Moreover, additional provisions have been adopted for both central and decentralised levels of government to facilitate the achievement of the fiscal objectives. More specifically, as regards the fiscal discipline of local authorities, the constitutional reform explicitly mentions that reliance on borrowing is allowed only if needed to finance investment expenditure, at the same time amortization plans are envisaged and the balanced budget rule for the overall local authorities (taken together) of each Region is complied with.
The second measure, introduced through a law adopted by an absolute majority of the members of each House of Parliament in December 20122, lays down the implementation of the principles adopted in the constitutional reform and has envisaged regulations to strengthen the framework of fiscal and budgetary rules, explicitly mentioning, among other things, the ways in which fiscal performance is to be monitored, how the correction mechanism has to work in case of variance from the structural balanced budget target, and the definition of exceptional events which allow variance from the policy objective.
In the new regulatory framework, the balanced budget rule is in line with EU legislation provisions in structural terms and requires the Government to secure the achievement of at least the medium-term objective (MTO), and in any case
1 Const. Law No. 1/2012. 2 Law No. 243/2012.

ECONOMIC AND FINANCIAL DOCUMENT - SECTION I STABILITY PROGRAMME
80 MINISTERO DELL’ECONOMIA E DELLE FINANZE
compliance with the path to progressively move towards that objective as of 2014. Forecast values are therefore ex ante values in the planning documents and actual compliance with them is assessed ex post.
Among the fiscal objectives special attention is paid to the public debt criterion, which is explicitly emphasized among the objectives set out in the planning documents. More specifically it has been envisaged that in case of underperformance with respect to the European benchmark (60 per cent of GDP), when budgetary objectives are setting, allowance should be made for the need to secure that any variation with respect to benchmark figures should be reduced as envisaged by European regulations.
The fiscal rule framework is further strengthened by a rule on general government expenditure. More specifically, the forecasted yearly rate of expenditure growth cannot exceed that envisaged for complying with European rules (expenditure benchmark) and the financial planning and budgetary documents must state the level of general government expenditure that is compatible with this constraint for the three-year period considered3.
Exceptions to the balanced budget rule are explicitly envisaged by the relevant regulations as the possibility of temporary variance from the structural policy objectives only in cases of: i) serious economic recession; ii) extraordinary situations, beyond the government’s control, including serious natural disasters, with significant repercussions on the country’s the general economic situation. With a view to avoiding a discretional use of this exception, it has been envisaged that any temporary variance from objectives, due to efforts to cope with the above-mentioned situations, may be allowed upon the Government’s request, after consulting the European Commission, and subjected to authorization given by an absolute majority vote of the two Houses of Parliament. As Government submits a request to that effect, the fiscal objectives shall be revised and a plan to cut expenditure to achieve the policy objective shall be set out in a report to be submitted to Parliament.
Greater focus is given to fiscal monitoring and surveillance: the Government is now required to inform Parliament of any risk of variance from the policy objectives with respect to the general government consolidated account or the structural balance, and at the end of the year the Court of Auditors audits the financial statements of Regions and local authorities, as well as general government bodies other than regional or local authorities.
Finally, specific mechanisms defined at EU level have been envisaged if significant variances of fiscal performance from the policy objectives, which may undermine efforts to achieve the medium-term objective in the following financial years, are found ex post. In this case, the Government has to state the causes as well as the corrective measures it intends to adopt to bring the structural balance back in line with the MTO figure. Measures will have to be developed for the various levels of general government, also with regard to the margin for overshooting that they may be allowed.
With a view to outlining the special provisions of each level of government and the tasks they are responsible for as part of the Italian institutions, the
3 For a thorough analysis of the implementation of the rules see Chapter 3.
VII. INSTITUTIONAL ASPECTS OF PUBLIC FINANCE
MINISTERO DELL’ECONOMIA E DELLE FINANZE 81
balanced budget rule and the system of fiscal rules is set out in further detail. Similarly to what has been envisaged for all general government bodies, the balanced budget rule for the State is set in structural terms and envisages that the figure of the net balance to be financed or used (referred to as the difference between final revenues and expenditure) each year, must be in line with the policy objectives set in the planning documents. Conversely, the balanced budget rule is applied to regional and local authorities in nominal terms. For these bodies a budget is considered in equilibrium when it is balanced, both on a cash and an accrual basis, according to two parameters: i) the balance between the final revenues and final expenditure; ii) the balance between current revenues and current expenditure, including the capital share of amortisation of loan installments. These bodies can still resort to borrowing for investment spending, provided that an amortization plan is drawn up and the overall total of budgets of the local authorities in each Region is balanced.
In order to ensure the necessary coordination among the various government tiers and to achieve the debt and borrowing reduction targets assigned, it has been envisaged, with criteria similar to those for the State, that additional contributions may be asked of the regional and local authorities, on top of those envisaged for compliance with the balanced budget rule. In addition, during downturns and in exceptional cases, the State may contribute to funding essential services and basic benefits relating to civic and social rights provided by other levels of government as a proportion of decentralised agencies’ own revenues affected by the economic cycle. In exchange, these bodies that had to resort to borrowing will be asked to contribute to the reduction of public debt during upturns, to an extent that will depend on their share of revenues that is sensitive to the cycle.
As regards the Government budget, the reform, (which will have to be further detailed with the relevant changes to be made to ordinary accounting and fiscal laws) is aimed at strengthening its allocative and planning function. To this end, the budget law has now substantial nature (while earlier it could not order changes to the existing legislation) and the contents of the current Stability Law has become a part of the budget law. This facilitates a more thorough analysis of the whole extent of the government budget, instead of only the measures introduced by the package adopted at the end of the year; it also highlights alternative uses of public funds that may be ordered within the limits of the budgetary constraints and in line with the broader net borrowing targets. To ensure the necessary level of transparency about the innovations that have been introduced, the law shall be made up of two parts: one showing year-on-year forecasts and the other containing the new legislative measures and their financial impact. The rules concerning the Regions and local authorities and the provisions concerning the Government budget shall come into force as of 2016.
Pursuant to EU provisions, a Parliamentary Budget Office has been set up within the two Houses of Parliament, a body functioning in complete independence in terms of the functions it performs and the opinions it expresses. It has its own budget and own resources which will be allocated under the relevant law with effect as of 2014. It conducts analyses, audits and assessments on: i) macroeconomic and fiscal forecasts, ii) the macroeconomic impact of the

ECONOMIC AND FINANCIAL DOCUMENT - SECTION I STABILITY PROGRAMME
82 MINISTERO DELL’ECONOMIA E DELLE FINANZE
most important laws, iii) fiscal performance, also by subsectors and compliance with the budgetary rules, iv) long-term fiscal sustainability, v) the roll-out and use of corrective mechanisms and on slippages in case of exceptional situations.
VII.2 FISCAL RULES
The new rules called for at European level and transposed into the national legislation are accompanied by other fiscal rules securing budget discipline, that already exist within the Italian fiscal governance framework; they are: the Domestic Stability Pact that defines how Regions and Local Government authorities shall contribute to achieving the fiscal objectives, and the Healthcare Pact and pharmaceutical expenditure ceilings.
The Domestic Stability Pact4 defines specific constraints that the Local Government authorities must comply with, together with information, communication and certification requirements vis-à-vis the Ministry of the Economy and Finance, and a system of sanctions in case of failure to comply. The Pact envisages a clear rule in terms of budget balance5 for Municipalities and Provinces and a constraint on the nominal growth of final expenditure for Regions.
With the Stability Law for the 2013-2015 period 6 the objectives of the Domestic Stability Pact and the transfers to Local Government authorities, as envisaged by the spending review measures, remain unchanged. A significant novelty is represented by the update of the baseline figure to calculate the objective, obtained by calculating the average of current expenditure commitments recorded over the 2007-2009 period. By updating the above baseline figure another element to assess the virtuosity of Local Government authorities has been introduced: the Local Government authorities that cut current expenditure commitments in financial year 2009 were assigned a less stringent objective compared to that of other Local Government authorities, which, instead, recorded an increase in current expenditure for that year. The Stability Law 2013 has confirmed that, starting from 2013, the Domestic Stability Pact also applies to Provinces and Municipalities with a population of more than 5,000 inhabitants, as well as Municipalities with a number of residents ranging between 1,001 and 5,000. As from 2014 the Domestic Stability Pact shall also apply to the
4 The Domestic Stability Pact was introduced by Art. 28 of the additional package of the Financial Law
1999. The Pact underwent a series of reforms over the years until the redrafting of its rules in 2008 as the 2009- 2011 three-year plan to balance the budget was introduced (Decree Law No.112/2008, confirmed as converted by Law No. 133/2008, Article 77-bis). On that occasion various mechanisms were introduced to reward ‘virtuous’ entities: these mechanisms were based on two economic indicators relating to the degree of structural rigidity and financial independence, as well as more effective sanctions in case of failure to comply.
5 For the purpose of determining the specific programmed target, the financial balance between final revenues and final expenditures (net of revenues from credit collections and expenditure for granting of loans) is again proposed as the Domestic Stability Pact's parameter of reference. Such balance is computed on a mixed-accrual basis (i.e. assuming ascertained revenues and spending commitments for the current part, and collected revenue and payments for the capital account). For 2012, 2013 and the years thereafter, the target financial balance is obtained by multiplying average current expenditure for the 2006-2008 three-year period, reported in terms of commitments as stated in the final accounts, for a fixed percentage. More recent amendments have essentially provided for exclusion of revenue and expenditure items from the computation of the targets, mostly to facilitate the realisation of public investment at a local level and to cover extraordinary events.
6 Law No. 228/2012.

VII. INSTITUTIONAL ASPECTS OF PUBLIC FINANCE
MINISTERO DELL’ECONOMIA E DELLE FINANZE 83
Unions of Municipalities with up to 1,000 inhabitants and, as soon as the relevant provisions are implemented through an inter-ministerial decree, it shall also apply to special enterprises, institutions and in-house companies directly entrusted with the management of local public services.
As regards the regime of exceptions, the provisions of the Domestic Stability Pact 2013 introduced some changes to the previously existing framework, envisaging further exceptions for the funds coming from the special accounting of the Regions hit by the earthquake of 20 and 29 May 2012 and the costs paid through their own resources, coming from voluntary contributions and donations from private individuals and Local Government authorities affected by the same earthquake. Still excluded from the calculation of the financial balance are: i) items concerning resources coming directly or indirectly from the European Union, related to the call for emergency status, II) items relating to the expenditure sustained by the State for the management and maintenance of assets transferred by federal State property allocation and III) part of the expenditure for the infrastructure investment of Local Government entities, limited to 2013 and 2014.
To strengthen the consolidation process and to reduce the debt-to-GDP ratio, as already provided for by budgetary rules already in force7, the mechanism to curb the nominal rate of growth of local authorities' debt has been confirmed. Local authorities may take on new long-term secured loans and may source other forms of financing through the market only if their annual debt-servicing expenditure, when summed with the charges for other financial obligations outstanding8 , does not exceed the limit of 6 per cent in 2013 and the 4 per cent from 2014, with respect to the first three revenue items in accounting statements made two years prior to the year in which loans are expected to be taken out. Furthermore, as from 2013, Local Government entities will have to reduce the magnitude of the public debt. The procedures for reaching the debt reduction target are to be outlined by decree of the Ministry of the Economy and Finance, following consultation with the Joint Conference. Some of the sanctions foreseen in the case of non-compliance with the Domestic Stability Pact will be applied to entities failing to reduce their debt, including, for example, limitation on current expenditure and personnel hiring. In order to meet the saving targets of ordinary statute Regions, the rule of checking final expenditure, introduced as of 2002, will continue to be applied. In line with the previous three-year period, distinct targets have been set with regard to the financial accruals basis and the euro-compatible accruals basis; the latter was introduced in 2013 with a view to bringing the definition of objectives into line with the ESA95 methodology. Healthcare expenditure, which is governed by specific regulations, is not included in the calculation nor is expenditure for granting loans; similarly, current and capital expenditure for programmes co-funded by the European Union, for the part related to EU funds, are excluded from the calculation. A substantial part of the exclusions envisaged by the Stability Law 2012 remains unchanged9.
7 Law No. 183/2011, Article 8. 8 Charges for previously contracted long-term secured loans, previously issued bond loans, credit lines and
guarantees granted pursuant to Article 207 of the Consolidated Act for Local Entities, net of the state and regional interest subsidies.
9 Art. 32, paragraph 4, of Law No. 183 of 2011.

ECONOMIC AND FINANCIAL DOCUMENT - SECTION I STABILITY PROGRAMME
84 MINISTERO DELL’ECONOMIA E DELLE FINANZE
In addition to the Domestic Stability Pact, among the rules concerning Regions those pertinent to the “Healthcare Pact” are emphasized as they aim at achieving proper planning of public health spending, not covered by the Domestic Stability Pact budgetary rules.
The Healthcare Pact fixes the amount of resources to be allotted to the National Health Service and is aimed at improving the quality of services by ensuring uniformity throughout the system. As part of the spending review measures, programmes have been envisaged in expenditure areas in which management inefficiencies and inadequacies in the use of resources have been found. These measures have been further strengthened by the Stability Law 2013. With regard to expenditure for goods and services procurement, as of 2013 the following rules shall apply: (i) ten per cent cut of the amounts and corresponding volumes of the procurement of goods and services, with the possibility for Regions to achieve the expected economic and financial measures also through alternative measures, ensuring in any case a balanced health budget; (ii) a new expenditure ceiling for the purchase of medical equipment set at 4.8 per cent by 2013 and 4.4 per cent starting from 2014. Rationalisation measures of health expenditure also include a reduction in procurement from private providers for specialised outpatient and in-patient care so as to reduce spending by 0.5 per cent over 2011, by 0.5 per cent for 2012, by 1.0 per cent by 2013 and by 2.0 per cent as of 2014.
As regards pharmaceutical expenditure, the spending review measures introduced a lower ceiling for local pharmaceutical expenditure, bringing it from 13.3 per cent to 13.1 per cent in 2012. As from 2013, the ceiling has been set at 11.35 per cent. The same decree introduced – with effect from 2013 – the payback mechanism in the event that in-patient pharmaceutical costs should overshoot the expenditure ceiling.
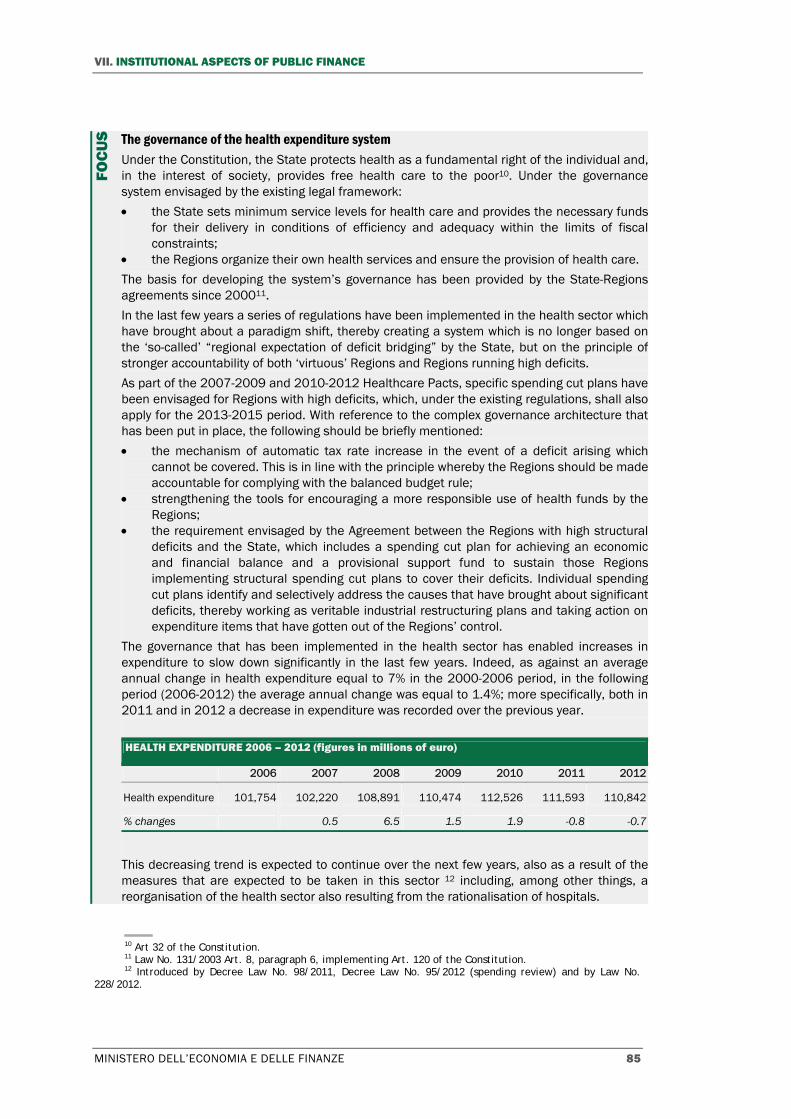
VII. INSTITUTIONAL ASPECTS OF PUBLIC FINANCE
MINISTERO DELL’ECONOMIA E DELLE FINANZE 85
FOC
US
The governance of the health expenditure system Under the Constitution, the State protects health as a fundamental right of the individual and,in the interest of society, provides free health care to the poor10. Under the governancesystem envisaged by the existing legal framework:
the State sets minimum service levels for health care and provides the necessary funds for their delivery in conditions of efficiency and adequacy within the limits of fiscalconstraints;
the Regions organize their own health services and ensure the provision of health care.
The basis for developing the system’s governance has been provided by the State-Regions agreements since 200011.
In the last few years a series of regulations have been implemented in the health sector which have brought about a paradigm shift, thereby creating a system which is no longer based onthe ‘so-called’ “regional expectation of deficit bridging” by the State, but on the principle ofstronger accountability of both ‘virtuous’ Regions and Regions running high deficits.
As part of the 2007-2009 and 2010-2012 Healthcare Pacts, specific spending cut plans have been envisaged for Regions with high deficits, which, under the existing regulations, shall also apply for the 2013-2015 period. With reference to the complex governance architecture that has been put in place, the following should be briefly mentioned:
the mechanism of automatic tax rate increase in the event of a deficit arising which cannot be covered. This is in line with the principle whereby the Regions should be madeaccountable for complying with the balanced budget rule;
strengthening the tools for encouraging a more responsible use of health funds by the Regions;
the requirement envisaged by the Agreement between the Regions with high structural deficits and the State, which includes a spending cut plan for achieving an economic and financial balance and a provisional support fund to sustain those Regionsimplementing structural spending cut plans to cover their deficits. Individual spending cut plans identify and selectively address the causes that have brought about significant deficits, thereby working as veritable industrial restructuring plans and taking action on expenditure items that have gotten out of the Regions’ control.
The governance that has been implemented in the health sector has enabled increases inexpenditure to slow down significantly in the last few years. Indeed, as against an average annual change in health expenditure equal to 7% in the 2000-2006 period, in the following period (2006-2012) the average annual change was equal to 1.4%; more specifically, both in 2011 and in 2012 a decrease in expenditure was recorded over the previous year.
HEALTH EXPENDITURE 2006 – 2012 (figures in millions of euro)
2006 2007 2008 2009 2010 2011 2012
Health expenditure 101,754 102,220 108,891 110,474 112,526 111,593 110,842
% changes 0.5 6.5 1.5 1.9 -0.8 -0.7
This decreasing trend is expected to continue over the next few years, also as a result of the measures that are expected to be taken in this sector 12 including, among other things, a reorganisation of the health sector also resulting from the rationalisation of hospitals.
10 Art 32 of the Constitution. 11 Law No. 131/2003 Art. 8, paragraph 6, implementing Art. 120 of the Constitution. 12 Introduced by Decree Law No. 98/2011, Decree Law No. 95/2012 (spending review) and by Law No.
228/2012.

ECONOMIC AND FINANCIAL DOCUMENT - SECTION I STABILITY PROGRAMME
86 MINISTERO DELL’ECONOMIA E DELLE FINANZE
ANNUAL RATE OF CHANGE IN HEALTH EXPENDITURE1
1) For the 2013-2015 period the expenditure figures shown above also consider the impact of decision No. 187 of the Constitutional Court, which declared illegitimate the provision concerning the introduction of new prescription charges (for 2,000 as of 2014, envisaged by Decree Law No. 98/2011). It was found to be illegitimate with regard to the measure envisaged by a rule (a regulation), in that the State may exert its rule-making powers only in matters of its exclusive responsibility. Hence, in the lack of an alternative provision, the State had to increase spending by € 2,000 as of 2014.
It should also be noted that, as of this year, the method of standard costs shall be applied in setting health spending requirements13. It is a method which, in confirming the current financial planning and the relevant expenditure containment, improves the institutional set-up, allowing comparison between Regions, both in terms of allocation of funds and in terms of analysing existing inefficiencies or inadequacies, thereby providing an additional institutionalfoundation to the planning effort which is being made.
Again, with regard to the implementation of fiscal federalism, the regulations concerning the harmonisations of budgets14, represent a further improvement of the existing accountingprocedures in the health sector: particularly important are provisions intended to ensure that the area of health financing can be easily identified in the regional budget, and to regulate theaccounting procedure of the so-called health management centers within the Regions (shares of funding for the national health service not attributed to health authorities, but directlymanaged by the Regions) regional consolidation of health-care accounts, specific exemptions to existing civil-code provisions in order to take into account the specific concerns and issues of these authorities, as well as the transparency of cash flow relating to the funding of health care.
13 Implementing legislative decree No.68/2011 on fiscal federalism. 14 Legislative Decree No.118/2011.
7.0%
1.4% 1.4%
0,0%
1,0%
2,0%
3,0%
4,0%
5,0%
6,0%
7,0%
8,0%
2000‐2006 2006‐2012 2012‐2015
DEF 2013 HEALTH EXPENDITURE
Actual
Forecast

VII. INSTITUTIONAL ASPECTS OF PUBLIC FINANCE
MINISTERO DELL’ECONOMIA E DELLE FINANZE 87
In a nutshell, the design of expenditure and quality benchmarks, the standardisation of accounting documents, the sanctions that may be imposed in the event of a deficit, have created a system based on a correct principle of full accountability of the Regions. The complex architecture described above has been further consolidated by strengthening thequarterly monitoring system of expenditure factors, done centrally while analyzing the details of each individual health authority. Strengthening the analytical and monitoring capabilities of health expenditure also means strengthening forecasting tools that are becoming ever more effective in financial planning. Indeed, with reference to fiscal documents at least in the last five years the expenditure levels that have actually been recorded have not exceeded forecastlevels, thereby contributing, also in this sector which is being discussed, to a general gradual fiscal stabilisation process and especially to containing public expenditure increases.

The 2013 ECONOMIC AND FINANCIAL DOCUMENT
is available on-line at the internet address listed below:
www.mef.gov.it • www.dt.tesoro.it • www.rgs.it
ISSN: 2239-5539