submitted by prime minister - dt.tesoro.it · submitted by prime minister paolo gentiloni silveri...
TRANSCRIPT

Section

Submitted by Prime Minister
Paolo Gentiloni Silveri
and Minister of the Economy and Finance
Pier Carlo Padoan
Adopted by the Cabinet on 11 April 2017
Section


MINISTERO DELL’ECONOMIA E DELLE FINANZE I
INTRODUCTION
The course of action pursued and the results achieved
The 2017 Economic and Financial Document (EFD) is the fifth prepared during
the current legislature; it offers the opportunity to evaluate the course of action
pursued and the results achieved to date, which can also serve as the basis for
orienting future economic-policy decisions.
After a serious and lengthy crisis, Italy’s economy embarked on a gradual
recovery in 2014 and picked up additional momentum in 2015 and 2016. GDP for
2014 was revised upward by almost €10 billion in nominal terms, while for 2015,
it is more than €9 billion above the estimates on one year ago.
The recovery has been more gradual compared with previous economic
cycles, which were followed by less acute and shorter term crises, but the
current recovery is still extremely significant, first and foremost in consideration
of the high level of employment involved: based on the latest data available, the
number of employed was 734,000 above the lowest point hit in September 2013.
The measures contained in the Jobs Act have also had the effect of improving
conditions in the labour market, prompting reductions in the number of people
not in the labour force, the unemployment rate, and the reliance on long-term
wage supplementation schemes (CIG). Benefiting from this scenario, household
consumption rose by 1.3 percent in 2016, also supported by the government’s
various economic-policy measures.
Various data also attest to the recovery of the Italian economy’s competitive
capacity, which had stalled for years due to the stagnation of productivity during
the decade prior to the crisis: in the past two years, the trade surplus reached
historically high levels, and was among the most significant in the European
Union. The prospects for the sectors catering to international demand likewise
remain favourable for 2017.
The revival of growth and competitiveness benefited from the expansionist
measures adopted by the government, which were also synchronised with the
need to continue fiscal consolidation. The deficit descended from 3.0 percent of
GDP in 2014 to 2.7 percent in 2015 and then to 2.4 percent in 2016; the primary
surplus (i.e. the difference between revenue and expenditure, net of the interest
on the public debt) amounted to 1.5 percent of GDP in 2016.
In order to appreciate fully the country’s effort in terms of fiscal adjustment
in recent years, it is sufficient to note that Italy, along with Germany,

ECONOMIC AND FINANCIAL DOCUMENT 2017
II MINISTERO DELL’ECONOMIA E DELLE FINANZE
maintained the highest primary surplus on average in the Euro Area between
2009 and 2016, and was one of the few countries to have produced a surplus, with
most of the other Member States witnessing deterioration in their position during
the period.
Budget policy has prioritised initiatives to favour investment, productivity,
and social cohesion. The decision to employ the incremental tax revenue
produced from the fight against tax evasion for the reduction of taxes has made
it possible, along with stronger growth, to reduce fiscal pressure significantly. The sum of the various tax reductions or equivalent measures (starting from the
€80 monthly personal income tax reduction for low- and middle-income full-time
workers) has already resulted in a reduction of fiscal pressure from 43.6 percent
in 2013 to 42.3 percent in 2016 (net of the aforementioned €80 reduction). In
addition to the tax relief in favour of households, the total corporate tax rate
was significantly lowered through adjustments to the regional tax on productive
activity (IRAP) in 2015, the single municipal tax (IMU) in 2016, and the corporate
income tax (IRES) in 2017.
The trend of the debt-to-GDP ratio also reflects a strategy focused on
supporting growth and the sustainability of the public finances: after rising by
more than 32 percentage points between 2007 and 2014, the ratio essentially
stabilised in the past two years, with such result even more important in view of
the limited momentum of prices during the period.
Prospects for growth and public finance, in view of the strategy adopted
to date
The government’s priority objective – and that of the budget policy outlined
in the EFD – continues to be a steady increase in growth and employment, in
respect of fiscal sustainability; in this regard, the forecasts in this document are
based on the principles of prudence that have ensured highly reliable estimates
and projections in recent years, and are designed to assure reliability in the fiscal
planning.
The Italian economy’s cyclical trend is favourable. In the second half of 2016,
the growth picked up additional momentum, benefiting from the rapid increase
of industrial production and, from the standpoint of demand, the acceleration of
investments and exports. Italian business confidence is conspicuously rising within
a European framework that is increasingly more solid.
Against this backdrop, concerns remain in relation to geopolitical risks and
the consequences of possible protectionist trade policies promoted by the new
U.S. administration. The various factors underlying the growing uncertainty have
increasingly included the results of referenda or elections in Europe and the
United States, which currently not only seem to suggest the alternation between
differing political visions, but they also risk triggering systematic effects of
instability.

INTRODUCTION
MINISTERO DELL’ECONOMIA E DELLE FINANZE III
Compared with the previous forecasts, the current framework benefits from
the expansion of the markets for Italy’s exports, and a less robust euro. The
improvement of economic data and expectations in developed economies,
including Italy, could justify a significant upward revision of the GDP growth
forecast for 2017. This document has nonetheless intentionally incorporated
cautious assessments, with the policy-scenario growth forecast for 2017 set at 1.1
percent (which is only 0.1 percent above that indicated in the 2016 EFD Update).
The government intends to continue in the wake of the economic policies
adopted since 2014, with the aims of freeing the country’s resources from the
excessive weight of taxation and simultaneously relaunching investment and
employment, while also respecting the needs for fiscal consolidation. The policy
scenario projects the net borrowing will continue to fall, amounting to 2.1
percent of GDP in 2017, and then 1.2 percent in 2018 and 0.2 percent in 2019,
before zeroing out in 2020; the forecasts incorporate the fiscal-policy and
spending-control measures currently being defined, which are expected to drive
down general government net borrowing by 0.2 percent of GDP in 2017. The
change in the structural balance is in line with the preventive arm of the
Stability and Growth Pact for the entire 2018-2020 three-year period. The
balanced structural budget is to be fully achieved in 2019 and 2020.
With reference to the safeguard clauses still provided for increases in VAT
rates and excise tax rates, the government intends to substitute them with
spending and revenue measures, inclusive of additional initiatives to fight tax
evasion. Such objective will be pursued in the 2018 Budget Law, the contents of
which are to be defined in the coming months, including in view of the reform of
budgeting procedures that will facilitate the spending review.
The forecast of the debt-to-GDP ratio for 2017 is 132.5 percent; the
projection incorporates possible precautionary recapitalisation of certain banks
and the proceeds from real property disposals and the sale of equity interests in
State-owned companies. Following the stabilisation achieved in recent years, the
debt-to-GDP ratio, as forecast, entails the first modest decrease since the start
of the crisis.
The government has also prioritised the continuation of actions to relaunch
public investment; the budgets adopted between 2008 and 2013 entailed lengthy
public projects, and thus had a significant impact in slowing the growth of
investment spending in later years. To ensure greater efficiency and the
streamlining of investment expenditure, Italy needs to reinstate proper planning
and assessment of public projects, thereby providing the procedural and financial
certainty essential to investment activity; in view of shortcomings in the planning
and assessment capacities of the contracting entities and the administrations
planning and financing the completion of public works, the government intends to
set up central entities that will supply technical and assessment support to the
administrations, including local government bodies.

ECONOMIC AND FINANCIAL DOCUMENT 2017
IV MINISTERO DELL’ECONOMIA E DELLE FINANZE
Alongside the revival of public investment, the government intends to
continue the pursuit of reinforcing the competitive capacity of Italian businesses,
in the wake of the measures provided in the past three years. The measures
undertaken for supporting all productive factors have channelled the energies of
Italian businesses toward expansion in size and at an international level, thereby
categorically opening up the Italian economy to the possibilities of attracting
capital, personnel, and ideas from abroad. The ‘Finance for Growth’ measures
are helping businesses to improve their governance and to access the capital
markets; the recent reform of the Individual Savings Plans provides the very first
mechanism to allow for the investment of private savings in Italy’s real economy.
The incentives to labour productivity have rounded out the effects of the
Jobs Act, while the incentives in terms of amortisation are supporting the
recovery of private investment, and in particular, investment in technology. The
recently introduced R&D tax credit and the patent box represent additional
incentives to Italian businesses to position themselves at the high end of the
value chain. In addition, the corporate tax cut has allowed Italian businesses to
improve their competitive position, particularly with respect to the largest
European countries; more in general, the measures affecting corporate taxation
have favoured the capitalisation of companies, since taxation is now neutral
regardless of the legal form of incorporation.
The banking system will continue to play a crucial role in supporting the
investments of Italian businesses and households. At the same time, the
introduction and promotion of new financing channels and instruments is
expected to reduce corporate and consumer dependence on banking
intermediaries only. Certain measures introduced starting in 2015 have been
designed to help banks adapt their business models to the opportunities offered
by the new environment; these initiatives have significantly reshaped and
reinforced the banking system, removing some of the constraints that slowed its
development over time, including, for example, excessive fragmentation of
supply and disproportionately lengthy time periods for recovering doubtful loans.
The reform of the mutual banks (banche popolari), the reforms initiated by
the banking foundations with the support of the government, and the reform of
the cooperative credit banks are three major initiatives toward consolidation of
the banking sector: the new entities created through business combinations have
given Italy larger, stronger and more transparent banks, which are capable of
protecting and enhancing the value of saving, and of supporting the economic
recovery through more modern and efficient services to households and
businesses. The reforms promoted with the objective of augmenting the quality
of bank governance and reinforcing the banks’ capacity to raise capital on the
market are also facilitating the unwinding of doubtful loan positions; in this
regard, the introduction of guarantee mechanisms for the securitisation of non-
performing loans and the acceleration of the timing for credit recovery (which is
particularly lengthy in Italy) are reducing recovery costs, thus improving the
valuation of doubtful loans in the event of their sale. The latest data show
positive indications of a turnaround in this area.

INTRODUCTION
MINISTERO DELL’ECONOMIA E DELLE FINANZE V
National Reform Programme
The measures to stimulate growth, investment and employment have been
accompanied by efforts in recent years to remove the structural obstacles to
growth on many fronts, including, for example, the labour market, the banking
sector, the capital market, fiscal rules, education, the public administration, and
the civil justice system. The 2017 National Reform Programme is aimed at the
continuation of the ambitious reforms unveiled in 2014 for structurally modifying
the country’s socio-economic fabric; a large part of the initial measures has been
completed, as also recognised by the European Commission’s recent report on
Italy.
The main initiatives adopted in the past 12 months include: projects to lay
the foundation for a public administration that is more efficient,
straightforward, digital, frugal and transparent; the identification of operational
mechanisms to deal with the build-up of non-performing loans as a result of the
crisis; the introduction of instruments in the banking system for maximising
market solutions with the support of State guarantees; and the completion of
labour market reform, which is facilitating growth of employment and better
quality labour. In addition, for the first time, the country has equipped itself
with a structural, national mechanism to fight poverty (Support for Active
Inclusion to be substituted by Inclusion Income), which aims at promoting the
reinsertion into society and the labour force of those who have been excluded.
The Industria 4.0 Plan is aimed at promoting changes in production and
technology for the purpose of significantly augmenting competitiveness, and is
based on measures to support productivity, flexibility and competitiveness in
Italian production. Numerous achievements have been made with regard to the
civil justice system, and the pending administrative caseload has been
substantially reduced. Progress has also been made with the
infrastructure/logistics simplification and plans, and the revival of rundown areas
on the outskirts of major cities. Budget reform has been finalised through
combining two previous laws (Budget Law and Stability Law) into a single,
integrated piece of legislation. The reform of the fiscal administration has been
fully initiated at a formal level, and is today producing major effects partly due
to the adoption of attitudes and conduct that are improving relationships with
taxpayers, and increasing the rate of spontaneous compliance. Finally,
enhancements have been made to the programmes for repatriating highly trained
Italians, and for attracting other human capital resources.
Even though the reforms adopted have been numerous and significant, we
need to continue to move forward, without hesitation: the measures affecting
the structure of the economy need time to fully wield their effects and, through
supporting one another, to relaunch growth potential.
Among its priorities, the government is focused on creating markets that are
more open to competition in various sectors, with the objective of rendering
ECONOMIC AND FINANCIAL DOCUMENT 2017
VI MINISTERO DELL’ECONOMIA E DELLE FINANZE
appreciable benefits to the public in terms of greater supply, investment,
productivity, and growth: from professional services, to retailing, to local public
services. In this regard, the rapid approval of the Annual Law for Competition is
an essential objective, together with the immediate definition of an appropriate
legislative mechanism to be used as the basis for the next steps in deregulation.
Turning to the issue of labour, the Jobs Act will need to be followed by the
enhancement of active labour policies, policies to stimulate skills development,
and measures to support family welfare. On the other hand, the labour-related
initiatives also represent the basis for policies to stimulate growth and
productivity. Against this backdrop, the government has acknowledged the
fundamental role of second-level wage bargaining, whose value needs to be
further enhanced through increasingly focused initiatives regarding corporate
welfare programmes.
The fight against poverty will be concentrated on an innovative strategy
outlined by an enabling act approved by Parliament in March 2017, which the
government firmly intends to implement during the months ahead. The act
authorises the government to intervene in three spheres: i) the approval of the
Inclusion Income, a broad-based economic-support measure for households below
the poverty level that will take the place of the Support for Active Inclusion; the
number of eligible beneficiaries gradually increases (in 2017 alone, more than
400,000 households representing 1.77 million people will be covered); the
measure redefines the economic benefit conditioned on participation in social-
inclusion projects, and enhances the services for helping to lift people out of
poverty; ii) the reorganisation of the social benefits for the purpose of fighting
poverty (purchases card for minors, and unemployment allowances (ASDI)); and
iii) the strengthening and coordination of social services projects, designed to
ensure greater territorial uniformity in the delivery of the benefits. The
resources appropriated amount to a total of approximately €1.2 billion for 2017
and €1.7 billion for 2018.
The implementation of the measures to reform the justice system will
proceed in the months ahead, with particular regard to criminal proceedings, the
efficiency of civil proceedings, and the statutes of limitation. The government’s
intervention is aimed at reconciling the need for ensuring timing consistent for
the ascertainment of the facts of a crime, with the need to ensure a reasonable
duration of the trial proceedings. The resources available to the judicial
administration are to be increased. The adoption of best practices will be further
promoted so as to allow for qualitative and quantitative harmonisation of the
performance of the courts. The completion of the legislative framework for
insolvencies will make the management of insolvency proceedings more effective,
while it is also designed to establish more standard regulation of the subject and
to provide greater certainty to failing businesses.
The reconciliation of the 2007-2013 planning cycle was concluded in March
2017. Despite the spending delays experienced through 2013, the reconciliation
process ended on 31 March 2017 with full absorption of European resources, and

INTRODUCTION
MINISTERO DELL’ECONOMIA E DELLE FINANZE VII
this was due to effective re-programming, a renewed political stimulus, and new
administrative-support actions with regard to the operating authorities. The new
2014-2020 planning cycle was inaugurated with an accent on i) reinforcing
institutional cooperation and coordinated planning with the regions through the
steering committee for management of the development and cohesion funds, and
ii) a new policy for southern Italy, based on an active role of the government and
the vesting of high levels of responsibility with the territorial administrations,
implemented through the Masterplan and the Pacts for Southern Italy.
Consistent with the approach taken by the previous government, a greater
emphasis has been placed on the central role of cohesion policies and on making
the ‘southern Italy issue’ a national issue. The objective of achieving a turning
point in the policies and trend regarding the divide between southern Italy and
the rest of the nation has been affirmed through immediate measures providing
for i) the reinforcement of the tax credit on private investment; ii) the
rebalancing of ordinary capital expenditure of the central government to the
benefit of southern Italy; iii) institutional changes to favour the effectiveness of
the planning of initiatives in the area; and iv) the acceleration of expenditure for
cohesion programmes. Alongside these measures, the economy of southern Italy
has shown signs of revitalisation in the past two years.
The measures to support both income and system modernisation continue to
be flanked by a uniform strategy of revising public spending. The continuation of
the fiscal consolidation effort will also be based on a new phase of the spending
review, which will need to be more selective, but also consistent with the
principles established by budget reform. This objective is also to be sought
through more extensive use of the mechanisms to streamline the public
procurement of goods and services.
Equitable and sustainable well-being
The crisis and the globalisation that preceded it have highlighted the limits
of economic policies exclusively concentrated on GDP growth. The increasing
wealth gap in recent decades in Italy and most highly developed countries, and
the continuing insufficient attention to environmental sustainability necessitate
an enrichment of public debate and economic-policy strategies.
In recognition of this need, in August 2016, the Italian Parliament approved
almost unanimously the inclusion of equitable and sustainable well-being
indicators in the reform of the accounting and public-finance law, and provided
for adding such indicators to the government’s economic-policy objectives. The
EFD will report on the trend of the main aspects of well-being in the past three
years, and will provide a forecast of the future trend of these variables, along
with the impact of the policies. Italy is the first highly developed country to
establish a policy of this nature.
While awaiting the equitable and sustainable well-being indicators that are
to be selected and defined by a special committee as mandated by the law and

ECONOMIC AND FINANCIAL DOCUMENT 2017
VIII MINISTERO DELL’ECONOMIA E DELLE FINANZE
are to be used by the government for future monitoring of the trend of well-
being and the impact of the policies, the government has elected to move
forward on a provisional basis with the inclusion of several indicators this year.
Alongside the traditional objectives (first and foremost, GDP and employment,
which continue to be crucial indicators for estimating and promoting the well-
being of the population), the EFD illustrates the trends of average disposable
income, income inequality, the rate of non-participation in the labour market,
and CO2 and other climate-altering gas emissions. The EFD also sets policy
objectives for these variables.
The data for the 2014-2016 three-year period show substantial improvement
of the indicators considered, with the exception of gas emissions, which obviously
reflect the effects of the economic recovery. More specifically, the inequality
index reflects significant improvement due to the growth of the employment and
the effectiveness of the measures implemented in recent years. The government
has set the objective of continuing to reduce inequality in the next three years.
European Union: needed reform
The Italian government believes it is imperative to continue promoting its
strategy for the reform of European institutions. There is a need for new
governance, which, alongside monetary and financial integration, will have to
start from recognition of the core issues of economic growth, employment and
social inclusion, introducing mechanisms for the sharing of risks between Member
States, in addition to tools for reducing the risks associated with each of them.
Increasing risk-sharing increases the Member States’ adjustment and flexibility
capacities in dealing with shocks, thereby contributing to reducing the risks
specific to each Member State. The new governance of the area should provide
budget-policy incentives favourable to growth, also improving the distribution of
growth among the Member States.
Europe needs to have shared mechanisms in order to alleviate the costs of
labour reallocation and the costs of crises that can afflict one specific sector or
territory; a common macroeconomic stabilisation mechanism will also allow
countries subject to strict budget constraints to adopt anti-cyclical policies,
addressing higher unemployment in the event of asymmetric shocks. Greater risk-
sharing among the countries would not reduce the incentives to adopt national
reforms. Instead, the failure to implement joint efforts to meet new, common
challenges will put Europe’s essential public goods at risk for the integration
process.
The management of the flows of migrants and asylum seekers into the
countries of the European Union represents an unprecedented challenge that
Europe is facing with regard to the free movement of persons, the respect of
human rights, and the security of European citizens. It is a system crisis that
requires a common response at a European level, through common border
management. It is necessary to plan and implement integration policies in the
national labour markets; this would allow for capturing the benefits historically

INTRODUCTION
MINISTERO DELL’ECONOMIA E DELLE FINANZE IX
associated with immigration, which, for an ageing society, will outweigh in the
medium/long term the short-term costs associated with the management of the
migratory flows. At the same time, there is a need for stronger, more targeted
cooperation with the countries of origin/transit of the flows, which should
contemplate an investment plan to tackle the fundamental causes of the
phenomenon, and the pursuit of decent living conditions, security, and work. The
financial and operational support offered to the partner countries will need to be
accompanied by their precise commitments in terms of effective border controls,
reduction of migrant flows, cooperation regarding repatriation/re-admission, and
stronger actions to combat human trafficking and terrorism.
***
In view of the fiscal consolidation required by the high public debt
accumulated in previous years, the limited budget leeway since 2014 has been
used to support growth and competitiveness. Given a new focus on the budget
mix, and the cutting of unproductive spending to finance investment and the
reduction of the fiscal burden, the country has embarked on a narrow virtuous
path bounded by the two contrasting needs of cutting the deficit and supporting
growth. Along this path, Italy has returned to positive GDP growth, avoided
dangerous declines in prices, contained the public deficit, and stabilised the
public debt.
While such results should not be underestimated, it is also important not to
underestimate the strict constraints that Italy continues to face in terms of
public finance, in relation to a probable tightening of monetary policy, medium-
term objectives that are still to be reached, and significant, widespread
geopolitical risks. The objective, mix and intensity of the economic policies to be
adopted by the government will continue in the direction of the path indicated.
The intensity of fiscal consolidation, but also the other economic-policy
options, will therefore be evaluated not only based on short-term objectives,
but, more importantly, for their medium-/long-term implications, also
considering that the path toward solid public finance is a commitment owed to
future generations. Sound public finances produce concrete effects on the
budget, since they contribute to holding down interest expenditure, which
absorbs resources that could otherwise be allocated to economic-policy
objectives, such as the reduction of the fiscal burden, investments, and social
inclusion.
A careful reflection about the concrete value of the country’s credibility also
seems particularly important in view of the consensus expectation that the ECB
will conclude its quantitative easing programme by the end of 2018. Italy cannot afford to be caught unprepared for such a development.


MINISTERO DELL’ECONOMIA E DELLE FINANZE XI
CONTENTS
I. OVERALL FRAMEWORK AND ECONOMIC-POLICY OBJECTIVES
I.1 Macroeconomic and public finance forecasts
I.2 Equitable and sustainable well-being
II. MACROECONOMIC FRAMEWORK
II.1 International scenario
II.2 Italy’s economy
III. NET BORROWING AND PUBLIC DEBT
III.1 Final data and forecasts at unchanged legislation
III.2 Migrants emergency, security and safeguarding of the territory
III.3 Public finance: policy scenario
III.4 Financial impact of National Reform Programme measures
III.5 Trend of debt-to-GDP ratio
III.6 The debt rule and the other relevant factors
IV. SENSITIVITY AND SUSTAINABILITY OF THE PUBLIC FINANCES
IV.1 Short-term scenarios
IV.2 Medium-term scenarios
IV.3 Long-term scenarios
V. QUALITY OF THE PUBLIC FINANCES
V.1 Actions taken and indications for future years
V.2 Spending review
VI INSTITUTIONAL ASPECTS OF PUBLIC FINANCE
VI.1 State budget reform: recent legislative developments
VI.2 Fiscal rules for local government

ECONOMIC AND FINANCIAL DOCUMENT - SECTION I STABILITY PROGRAMME
XII MINISTERO DELL’ECONOMIA E DELLE FINANZE
TABLES
Table I.1 Summary of macroeconomic framework based on unchanged legislation
Table I.2 Summary of macroeconomic framework based on policy scenario
Table I.3 Public finance indicators
Table II.1 Macroeconomic framework scenario at unchanged legislation
Table II.2 Base assumptions
Table II.3a Macroeconomic prospects
Table II.3b Prices
Table II.3c Labour market
Table II.3d Sector accounts
Table III.1 General government budgetary prospects
Table III.2 Estimate of expenditure sustained for migrants crisis: 2011-2017
Table III.3 Estimate of expenditure sustained for security in 2016
Table III.4 Differences compared with the previous Stability Programme
Table III.5 Amounts to be excluded from the expenditure rule
Table III.6 Scenario at unchanged policies
Table III.7 State sector and public sector: cash balances
Table III.8 Cyclically adjusted budget
Table III.9 Financial impact of measures in NRP grids
Table III.10 Public debt determinants
Table III.11 General government debt by subsector
Table III.12 Compliance with debt rule: forward-looking benchmark
Table IV.1 Heat map about variables underlying the SO indicator for 2016
Table IV.2 Summary of macro-fiscal shocks
Table IV.3 Sensitivity to growth
Table IV.4 Public expenditure for pensions, healthcare, long-terme care, education
and unemployment compensation
Table IV.5 Sustainability indicators
Table V.1 Cumulative net effects of 2016 main legislation on general government
net borrowing
Table V.2 Cumulative effects of 2016 main legislation on general government net
borrowing
Table V.3 Cumulative net effects of 2016 main legislation on general government
net borrowing by subsector
Table V.4 Effects of the Decree-Law No. 189/2016 on general government net
borrowing
Table V.5 Effects of the Decree-Law No. 237/2016 on general government net
borrowing
Table V.6 Effects of the Decree-Law No. 243/2016 on general government net
borrowing

CONTENTS
MINISTERO DELL’ECONOMIA E DELLE FINANZE XIII
Table V.7 Effects of the Decree-Law No. 244/2016 on general government net
borrowing
Table V.8 Cumulative net effects of the 2017-2019 budget and initial measures in
2017
Table V.9 Cumulative effects of the 2017-2019 budget and initial measures in
2017
Table V.10 Cumulative net effects of the 2017-2019 budget and initial measures in
2017 on general government net borrowing by subsector
Table V.11 Effects of the 2017-2019 budget on general government net borrowing
Table V.12 Effects of the Decree-Law No. 8/2017 on general government net
borrowing
Table V.13 Effects of the Decree-Law No. 13/2017 on general government net
borrowing
Table V.14 Measures to streamline expenditure

ECONOMIC AND FINANCIAL DOCUMENT - SECTION I STABILITY PROGRAMME
XIV MINISTERO DELL’ECONOMIA E DELLE FINANZE
FIGURES
Figure I.1 Net borrowing, primary balance and interest expenditure
Figure I.2 Average disposable income, GDP per capita and disposable income
inequality index - policy scenario
Figure I.3 Non-participation rate to labour market – policy scenario
Figure I.4 GDP per capita, CO2 and other climate-altering gas emissions - policy
scenario
Figure II.1 Export and import volumes by geographic area - 2016
Figure II.2 Export and import volumes by sector – 2016
Figure II.3 Interest rates to non-financial businesses and households
Figure III.1 Number of migrants rescued at sea: 1991-2016
Figure III.2 Number of migrants rescued at sea: Quarterly data for 2014-2017
Figure III.3 Immigrants at reception facilities: 2013-2017
Figure III.4 Public debt determinants
Figure III.5 Trend of debt-to-GDP ratio (inclusive and net of the support to Euro Area
countries)
Figure III.6 Minimum linear structural adjustment and debt rule at unchanged
legislation
Figure III.7 Minimum linear structural adjustment and debt rule in policy scenario
Figure IV.1 Interest expenditure as percentage of GDP and weighted average cost at
issuance
Figure IV.2 Trend of government securities yields: 1-, 5- and 10-year maturities
Figure IV.3 BTP-BUND yield differential: 10-year benchmark
Figure IV.4A Stochastic projection of the debt-to-GDP ratio with temporary shocks
Figure IV.4B Stochastic projection of the debt-to-GDP ratio with permanent shocks
Figure IV.5 SO indicator and sub-components
Figure IV.6 Medium-term forecast of debt-to-GDP ratio in high- and low-growth
scenarios
Figure IV.7 Public debt sensitivity to increase/decrease in net flow of immigrants
Figure IV.8 Sensitivity to macroeconomic assumptions. Higher / lower productivity
growth
Figure IV.9 Sensitivity to macroeconomic assumptions. Higher / lower TFP growth
Figure IV.10 Sensitivity to macroeconomic assumptions. Rates of employment and
rates of activity of the elderly
Figure IV.11 Sensitivity of public debt to assumptions of healthcare expenditure in risk
scenario
Figure IV.12 Public debt sensitivity to primary surplus
Figure IV.13 Impact of reforms on debt-to-GDP ratio
Figure VI.1 Local government: net borrowing and debt
CONTENTS
MINISTERO DELL’ECONOMIA E DELLE FINANZE XV
FOCUS SECTIONS
Chapter II Industria 4.0 Plan, accelerated depreciation, and the investment
response
Forecast errors with respect to 2016 and revision of the estimates for
2017 and subsequent years
Analysis of risk (or sensitivity) against the exogenous variables
Chapter III Investments clause
Tables required for the purpose of using the migrants clause within the
sphere of the Stability and Growth Pact
Assessment of significant deviations and the expenditure rule
Estimation of potential GDP, output gap and structural balance with an
alternative model compared with the methodology agreed at a European
level
Chapter IV Pension system reform
S1 indicator of medium-term fiscal sustainability
State guarantees
Chapter V Measures to fight tax evasion
Public Aid for Development (PDA)


MINISTERO DELL’ECONOMIA E DELLE FINANZE 1
I. OVERALL FRAMEWORK AND ECONOMIC-POLICY
OBJECTIVES
I.1 MACROECONOMIC AND PUBLIC FINANCE FORECASTS
The Italian economy is entering its third year of recovery – a gradual recovery
that is still significant when considering the numerous factors impeding expansion
and the uncertainty at both the European and global level. According to the most
recent data, employment has risen by 734,000 jobs with respect to the low hit in
September 2013.1 GDP grew in real terms by 0.1 percent in 2014, 0.8 percent in
2015, and 0.9 percent in 2016 (1.0 percent, according to data adjusted for
working days).
The government’s objective is to steer the GDP growth rate higher, toward a
level that will allow for recovering the ground lost during the 2009-2013 period,
when Italy witnessed a contraction of GDP without precedent in recent history.
Hitting this objective will contribute to sustaining employment and facilitating the
decline of the debt-to-GDP ratio. Budget policy combines ongoing fiscal
consolidation with a growth process backed by the initiatives outlined in the
National Reform Programme, which are based on structural reforms, and aimed at
creating the conditions for returning to a more rapid, yet sustainable, expansion.
The growth forecasts in this Stability Programme should therefore be
interpreted as prudent assessments. The recent trend of the Italian economy is
indeed encouraging. The growth gained new momentum in the second half of
2016, partly due to a surge in industrial production and, from the standpoint of
demand, an acceleration of investments and exports. The year 2017 seems to have
started on the right foot. Seasonally-adjusted industrial production experienced a
month-on-month decline in January, but then recovered in February, and the
annualised average rate for the last three months was 3 percent higher than that
registered in the previous three months. Italian business confidence indices
increased significantly during the first quarter, with those referring to industry
rising in March to their highest level since 2007.
Significant improvement in the confidence of businesses and consumers has
also been seen at a European and international level. Growth has accelerated in
Europe. Concerns remain with respect to geopolitical factors and the medium-
term consequences of Brexit, and were recently intensified by the trade policies
aired by the new U.S. administration. Notwithstanding such elements, the outlook
for the short term is more favourable than what had been expected in September
2016 (the government’s last update of the official forecast), in terms of both the
expansion projected for Italy’s export markets, and the level of the euro exchange
rate.
1 ISTAT reporting on the Labour Force, February 2017, published on 3 April 2017.

ECONOMIC AND FINANCIAL DOCUMENT - SECTION I STABILITY PROGRAMME
2 MINISTERO DELL’ECONOMIA E DELLE FINANZE
The improvement of the economic data and expectations in the world’s most
developed countries (including Italy) could justify a significant upward revision of
GDP growth forecast for 2017 and to a lesser extent, for 2018, with the latter year
more likely to be affected by the gradual rise of market interest rates. The data in
this EFD intentionally reflect a more cautious approach, including for the fact that
the production data and GDP in the world’s leading economies have not yet
equalled the dynamism indicated by the expectations of businesses and
households. The real GDP growth at unchanged legislation is thus forecast at 1.1
percent for 2017.
The updated forecast for 2018 and 2019 is instead slightly lower than in the
past, with growth pegged at 1.0 percent in 2018 and 1.1 percent in 2019 (versus
the 1.2 percent forecast for both years in the Draft Budgetary Plan 2017 prepared
in October 2016). The new forecast for 2020 projects growth of 1.1 percent.
The more cautious approach with regard to 2018-2019 is mainly explained by
the uncertainty affecting the medium-term scenario in Europe and worldwide, and
by the recent increase of interest rates, which, according to the convention
followed in formulating the forecasts, implies higher than previously expected
levels in the future. It should also be noted that the official forecast does not
significantly differ from the consensus, including in light of the validation by the
Parliamentary Budget Office2.
From the standpoint of nominal growth, the forecast at unchanged legislation
reflects not only the expected trend of prices, but also the increase in indirect
taxes provided by the so-called safeguard clauses.3 Nominal GDP, which grew by
1.6 percent in 2016, should accelerate to 2.2 percent in 2017 and 2.9 percent in
2018-2019, remaining around 2.8 percent in 2020. This would improve public debt
sustainability, albeit in the presence of an increase in the yields on government
securities. The nominal growth rate would actually be close to the implicit cost of
public debt financing for the entire 2018-2020 three-year period.
TABLE I.1: SUMMARY OF MACROECONOMIC FRAMEWORK BASED ON UNCHANGED LEGISLATION (1) (% changes, unless otherwise indicated)
2016 2017 2018 2019 2020
GDP 0.9 1.1 1.0 1.1 1.1
GDP deflator 0.8 1.1 1.8 1.8 1.7
Consumption deflator 0.0 1.2 2.1 2.1 1.8
Nominal GDP 1.6 2.2 2.9 2.9 2.8
Employment (FTEs) 1.4 0.8 0.8 0.7 0.7
Employment (labour force) 1.3 0.6 0.7 0.6 0.7
Unemployment rate 11.7 11.5 11.2 10.8 10.2
Current account balance (% of GDP) 2.6 2.3 2.6 2.6 2.5
(1) Discrepancies, if any, are due to rounding.
2 The macroeconomic scenario at unchanged legislation was validated by the Parliamentary Budget Office
(PBO) on 31 March 2017. The PBO uses forecasts formulated with its own models, and with the support of three independent forecasting specialists.
3 According to such clauses, the VAT rates would go up by three percentage points in January 2018, along with a slight increase in excise taxes on fuels. The standard VAT rate would then rise by another 0.9 percentage points in January 2019.

I. OVERALL FRAMEWORK AND ECONOMIC-POLICY OBJECTIVES
MINISTERO DELL’ECONOMIA E DELLE FINANZE 3
Turning to the policy-scenario forecast, the data incorporate the fiscal-policy
and spending-control measures to be implemented in the near term. Such
measures will reduce general government net borrowing by 0.2 percent of GDP in
2017 in structural terms. Having considered the timing and the mix of the these
measures, the updated forecast under the policy scenario, net of rounding, is
equal to the growth projected at unchanged legislation, namely, 1.1 percent.
The policy-scenario forecast for the 2018-2020 three-year period reflects the
government’s plan to pursue budget policy in line with European rules and Italian
laws and regulations. The net borrowing targets for 2018 and 2019 are unchanged
with respect to last September and the Draft Budgetary Plan 2017. This implies
net borrowing under the policy scenario that is only marginally lower than the
scenario at unchanged legislation for 2018, and that is significantly lower in 2019.
As a result, the GDP growth in the policy-scenario forecast, net of rounding, is
equal to that at unchanged legislation in 2018 and instead, slightly lower in 2019
(1.0 percent versus 1.1 percent). In 2020, the focus will be on achieving a fully
balanced budget, both in nominal and structural terms (with the latter being
adjusted for the cyclical component and temporary measures). However, the
reduction of the deficit is limited (0.2 percentage points of GDP) and the growth
forecast is accordingly equal to that at unchanged legislation, namely, 1.1
percent.
TABLE I.2: SUMMARY OF MACROECONOMIC FRAMEWORK BASED ON POLICY SCENARIO (1) (% changes, unless otherwise indicated)
2016 2017 2018 2019 2020
GDP 0.9 1.1 1.0 1.0 1.1
Deflator GDP 0.8 1.2 1.7 1.9 1.7
Consumption deflator 0.0 1.2 1.7 2.1 1.8
Nominal GDP 1.6 2.3 2.7 3.0 2.8
Employment (FTEs) 1.4 0.8 0.9 0.9 0.7
Employment (labour force) 1.3 0.6 0.8 0.8 0.8
Unemployment rate 11.7 11.5 11.1 10.5 10.0
Current account balance (% of GDP) 2.6 2.3 2.6 2.8 2.8
(1) Discrepancies, if any, are due to rounding.
Turning to public finance, the scenario based on unchanged legislation puts
the general government net borrowing (2.7 percent and 2.4 percent of GDP in
2015 and 2016, respectively) at 2.3 percent for 2017, before descending to 1.3
percent in 2018, 0.6 percent in 2019 and finally, 0.5 percent in 2020. Compared
with prior official forecasts, the increase in the yields on government securities
implies higher interest expenditure, with increasing effects over the 2018-2020
period. The main factor that instead drives down the deficit is the increase in VAT
rates as provided by the safeguard clauses for 2018 and 2019; such increase is
expected to improve the budget balance by 1.1 points of GDP in 2018 and another
0.2 points in 2019.
ECONOMIC AND FINANCIAL DOCUMENT - SECTION I STABILITY PROGRAMME
4 MINISTERO DELL’ECONOMIA E DELLE FINANZE
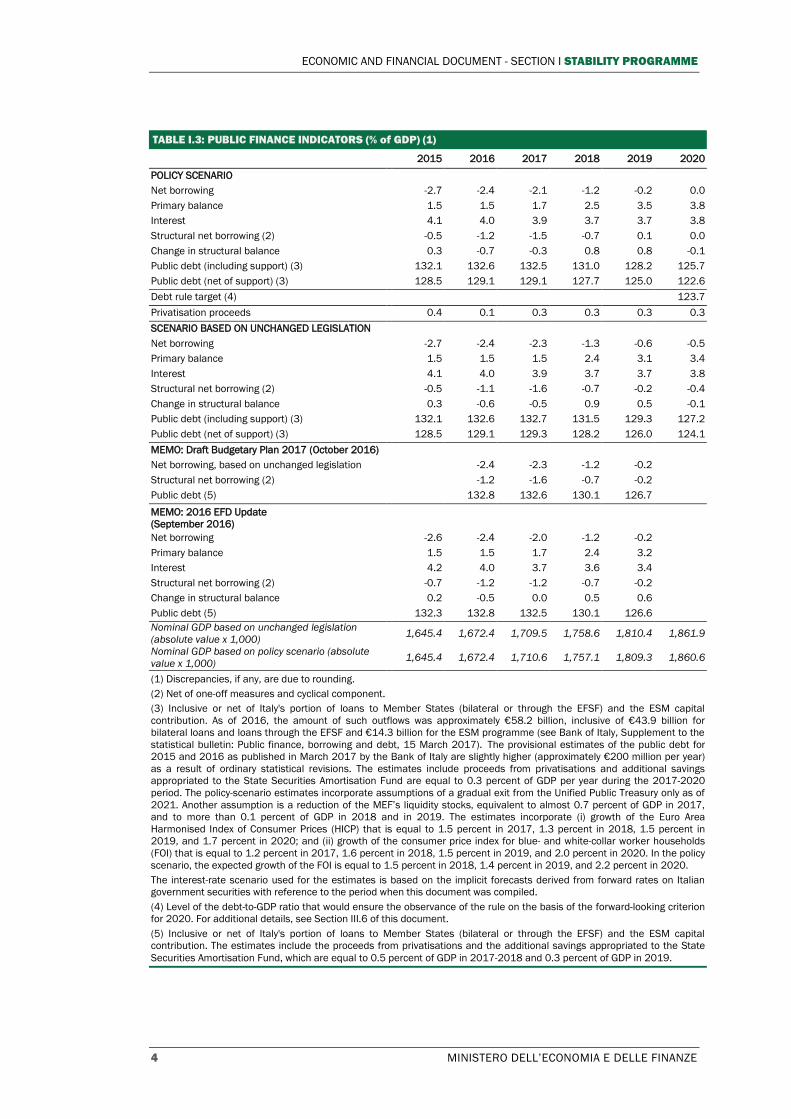
TABLE I.3: PUBLIC FINANCE INDICATORS (% of GDP) (1)
2015 2016 2017 2018 2019 2020
POLICY SCENARIO
Net borrowing -2.7 -2.4 -2.1 -1.2 -0.2 0.0
Primary balance 1.5 1.5 1.7 2.5 3.5 3.8
Interest 4.1 4.0 3.9 3.7 3.7 3.8
Structural net borrowing (2) -0.5 -1.2 -1.5 -0.7 0.1 0.0
Change in structural balance 0.3 -0.7 -0.3 0.8 0.8 -0.1
Public debt (including support) (3) 132.1 132.6 132.5 131.0 128.2 125.7
Public debt (net of support) (3) 128.5 129.1 129.1 127.7 125.0 122.6
Debt rule target (4) 123.7
Privatisation proceeds 0.4 0.1 0.3 0.3 0.3 0.3
SCENARIO BASED ON UNCHANGED LEGISLATION
Net borrowing -2.7 -2.4 -2.3 -1.3 -0.6 -0.5
Primary balance 1.5 1.5 1.5 2.4 3.1 3.4
Interest 4.1 4.0 3.9 3.7 3.7 3.8
Structural net borrowing (2) -0.5 -1.1 -1.6 -0.7 -0.2 -0.4
Change in structural balance 0.3 -0.6 -0.5 0.9 0.5 -0.1
Public debt (including support) (3) 132.1 132.6 132.7 131.5 129.3 127.2
Public debt (net of support) (3) 128.5 129.1 129.3 128.2 126.0 124.1
MEMO: Draft Budgetary Plan 2017 (October 2016)
Net borrowing, based on unchanged legislation -2.4 -2.3 -1.2 -0.2
Structural net borrowing (2) -1.2 -1.6 -0.7 -0.2
Public debt (5) 132.8 132.6 130.1 126.7
MEMO: 2016 EFD Update
(September 2016)
Net borrowing -2.6 -2.4 -2.0 -1.2 -0.2
Primary balance 1.5 1.5 1.7 2.4 3.2
Interest 4.2 4.0 3.7 3.6 3.4
Structural net borrowing (2) -0.7 -1.2 -1.2 -0.7 -0.2
Change in structural balance 0.2 -0.5 0.0 0.5 0.6
Public debt (5) 132.3 132.8 132.5 130.1 126.6
Nominal GDP based on unchanged legislation
(absolute value x 1,000) 1,645.4 1,672.4 1,709.5 1,758.6 1,810.4 1,861.9
Nominal GDP based on policy scenario (absolute
value x 1,000) 1,645.4 1,672.4 1,710.6 1,757.1 1,809.3 1,860.6
(1) Discrepancies, if any, are due to rounding.
(2) Net of one-off measures and cyclical component.
(3) Inclusive or net of Italy's portion of loans to Member States (bilateral or through the EFSF) and the ESM capital
contribution. As of 2016, the amount of such outflows was approximately €58.2 billion, inclusive of €43.9 billion for
bilateral loans and loans through the EFSF and €14.3 billion for the ESM programme (see Bank of Italy, Supplement to the
statistical bulletin: Public finance, borrowing and debt, 15 March 2017). The provisional estimates of the public debt for
2015 and 2016 as published in March 2017 by the Bank of Italy are slightly higher (approximately €200 million per year)
as a result of ordinary statistical revisions. The estimates include proceeds from privatisations and additional savings
appropriated to the State Securities Amortisation Fund are equal to 0.3 percent of GDP per year during the 2017-2020
period. The policy-scenario estimates incorporate assumptions of a gradual exit from the Unified Public Treasury only as of
2021. Another assumption is a reduction of the MEF’s liquidity stocks, equivalent to almost 0.7 percent of GDP in 2017,
and to more than 0.1 percent of GDP in 2018 and in 2019. The estimates incorporate (i) growth of the Euro Area
Harmonised Index of Consumer Prices (HICP) that is equal to 1.5 percent in 2017, 1.3 percent in 2018, 1.5 percent in
2019, and 1.7 percent in 2020; and (ii) growth of the consumer price index for blue- and white-collar worker households
(FOI) that is equal to 1.2 percent in 2017, 1.6 percent in 2018, 1.5 percent in 2019, and 2.0 percent in 2020. In the policy
scenario, the expected growth of the FOI is equal to 1.5 percent in 2018, 1.4 percent in 2019, and 2.2 percent in 2020. The interest-rate scenario used for the estimates is based on the implicit forecasts derived from forward rates on Italian
government securities with reference to the period when this document was compiled.
(4) Level of the debt-to-GDP ratio that would ensure the observance of the rule on the basis of the forward-looking criterion
for 2020. For additional details, see Section III.6 of this document.
(5) Inclusive or net of Italy's portion of loans to Member States (bilateral or through the EFSF) and the ESM capital
contribution. The estimates include the proceeds from privatisations and the additional savings appropriated to the State
Securities Amortisation Fund, which are equal to 0.5 percent of GDP in 2017-2018 and 0.3 percent of GDP in 2019.

I. OVERALL FRAMEWORK AND ECONOMIC-POLICY OBJECTIVES
MINISTERO DELL’ECONOMIA E DELLE FINANZE 5
Under the policy scenario, the government promptly activates structural
measures to reduce the structural borrowing by 0.2 points of GDP in 2017, which
then amount to almost 0.3 percent of GDP in terms of effects on the subsequent
years. The package includes measures designed to curb the evasion of VAT and
other taxes, with initiatives such as the enlargement of the sphere of application
of the so-called split payment. Certain expenditures are also reduced further. The
package is rounded out by incremental investment of €1.0 billion per year for the
2017-2020 period for the areas affected by the recent earthquakes.
The combined effect of the planned measures leads to a downward revision of
the net borrowing under the policy scenario, which goes from 2.3 percent to 2.1
percent of GDP for 2017. The policy scenario then projects a pronounced decline
in the deficit for the two subsequent years, to 1.2 percent of GDP in 2018 and 0.2
percent in 2019. With an additional, slight improvement in the balance, the
forecast provides for a balanced budget in 2020. The changes estimated in the
structural balance are fully in line with the preventive arm of the Stability and
Growth Pact for the entire 2018-2020 three-year period. A slight surplus of the
structural balance would be actually achieved in 2019, and the Medium-Term
Objective would be maintained in 2020.
FIGURE I.1: NET BORROWING, PRIMARY BALANCE AND INTEREST EXPENDITURE (% of GDP)
Source: ISTAT. From 2017 EFD policy scenario targets.
With reference to the budget policy mix for the next three years, the
safeguard clauses are expected to be repealed, starting with the structural effects
of the April 2017 budget package and additional revenue recovery (through the
fight against tax evasion), with tax rates held equal. In terms of expenditure, a
new spending review is to be undertaken, including in consideration of the reform
of the budget formation procedures. The ministries will contribute to the
achievement of the programmed objectives, with at least €1.0 billion of savings on
expenditure per year. Such contribution will be covered by the Decree of the
President of the Council of Ministers as provided by new laws and regulations.
-6
-4
-2
0
2
4
6
8
Primary balance Interest expenditure Net borrowing

ECONOMIC AND FINANCIAL DOCUMENT - SECTION I STABILITY PROGRAMME
6 MINISTERO DELL’ECONOMIA E DELLE FINANZE
The government also intends to find room for enacting expansionist measures
and measures to reduce fiscal pressure, so as to ensure continuity to the measures
introduced in prior years. These initiatives will be flanked by the pursuit of the
reform effort in all areas that affect the nation’s investment climate. The timing
for the impact of investment-support measures also depends on the extent of the
information available about them. It is important that businesses, the public, and
investors are fully aware of the changes and the incentives that have been
implemented in the past three years. A special effort will accordingly be
addressed to ensuring better accessibility and improvement with respect to
information about ‘doing business’ in Italy.
With reference to the trend of the public debt, the debt-to-GDP ratio hit
132.6 percent in 2016, slightly increasing over 2015 (132.1 percent). The increase
was almost nil when considering that the Treasury’s liquidity at the end of 2016
had risen to more than 0.4 percent of GDP. The debt-to-GDP ratio is by now
moving toward stabilisation, and is then poised to gradually decline - a result that
was anything but expected in light of the low nominal growth of recent years.
Under the policy scenario, the debt-to-GDP ratio for 2017 (inclusive of
possible measures to support a precautionary recapitalisation of banks) is forecast
at 132.5 percent, which would represent the first decrease to date since the
crisis. The scenario assumes the use of approximately one-half of the resources
made available for the precautionary recapitalisation of banks through Decree-
Law No. 237 of 23 December 2016 (€20 billion).
The forecast for 2017 also incorporates proceeds from the sales of real estate
and shareholdings in public companies (0.3 percent of GDP), as well as a decrease
in the Treasury’s liquidity. The decline of the debt-to-GDP ratio is also facilitated
by an increase in the primary surplus, which goes from 1.5 percent in 2016 to 1.7
percent in 2017. The forecast also results in a decrease in the gap between the
implicit cost of the debt (2.97 percent) and nominal GDP growth (2.3 percent).
The decline of the debt-to-GDP ratio should gain momentum in the 2018-2020
period, partly due to a higher primary surplus, which should rise to 3.8 percent of
GDP in 2020. As pointed out above, the implicit cost of the debt should be close to the
nominal GDP growth rate for the entire 2018-2020 three-year period. In 2019, it
will be slightly below of the nominal GDP growth rate, ranging around 2.9 percent compared with a nominal growth rate of 3.0 percent. Privatisations should
continue to contribute to decreasing the debt-to-GDP ratio by about 0.3 percent
of GDP per year. Certain technical factors are likely to slow the decrease of the debt-to-GDP
ratio, including the fact that the borrowing requirement is forecast to remain
above net borrowing over the entire period. As a result, the programme outlined here, even though quite ambitious in terms of the budget balances, will not satisfy
the debt rule in 2018 (using the forward-looking criterion as of 2020).
It should nonetheless be noted that the full-scale implementation of the government’s programme is likely to generate significant savings on interest
payments not yet incorporated into forecast4. The levels of yields actually seen
4 As in the past, the technical assumption is based on government securities yields reported for the two
weeks prior to the preparation of the Stability Programme. These data are used for calculating forward rates,

I. OVERALL FRAMEWORK AND ECONOMIC-POLICY OBJECTIVES
MINISTERO DELL’ECONOMIA E DELLE FINANZE 7
from now through 2020 could be below those implied by the yield curve for two
reasons: euro rates might rise less than currently projected, and the differential between Italian yields and euro swap rates might contract as a result of credible
reforms and deficit reduction, albeit in a framework of uncertainty as perceived
by investors. The debt-to-GDP ratio would benefit from either assumption. The trade-off between stronger or weaker fiscal discipline, and between
various economic-policy options thus needs to be assessed in light of the fact that
greater credibility can lead to significant savings on interest expenditure, thereby freeing up resources for the reduction of the fiscal burden and for social cohesion.
Such consideration is also important in view of the consensus expectation that the
ECB will conclude its quantitative easing programme by the end of 2018. Italy cannot afford to be find itself unprepared for such a development.
I.2 EQUITABLE AND SUSTAINABLE WELL-BEING
The well-being of a society generally benefits from an increase in GDP, but
well-being does not coincide with such indicator. The quality and sustainability of
the environment, economic inequalities, the quality of work, health, and the level
of education of the population are (some of) the aspects that contribute to the
well-being of a society. As advocated by experts in various fields (see the Stiglitz-
Sen-Fitoussi Commission) and by various international organisations (e.g. United
Nations, OECD, and the European Commission), it is time for economic policy ‘to
go beyond GDP’.
With the aim of responding to this need, in 2016, the Italian Parliament
approved almost unanimously the inclusion of equitable and sustainable well-being
indicators in economic planning. Italy is now the first European Union and G7
country where the government is required to systematically evaluate, ex ante and
ex post, the impact of policies on various aspects of well-being.
Law No. 163 of 2016 provides for the inclusion of the indicators in the
budgeting cycle, upon their selection by a special committee and after
Parliamentary decision. While awaiting the final selection of the indicators, the
government has elected to move forward on an experimental basis with the
inclusion of a first group of indicators in the budget process related to this EFD. In
order to effect, on an experimental basis, the forecast exercises in accordance
with the objectives provided by Article 1, Paragraph 6 of Law No. 163 of 2016, the
committee, upon the request of the Minister of the Economy and Finance, has
provisionally selected four indicators with respect to the EFD for 2017: average
disposable income, an inequality index, the non-participation rate to the labour
market, and CO2 and other climate-altering gas emissions.
By applying in advance the provisions contemplated by the reform once the
process of the selection of indicators is concluded and definitive, each of the four
indicators is represented with respect to the trend of the past three years, and
again with respect to a forecast based on unchanged legislation and a forecast
that includes the policy measures included in the EFD. The forecasts for all of the
and given the strong positive slope of the Italian yield curve, they imply a strong increase in such yields over the next three years.
ECONOMIC AND FINANCIAL DOCUMENT - SECTION I STABILITY PROGRAMME
8 MINISTERO DELL’ECONOMIA E DELLE FINANZE
experimental exercises have been realised by using specially developed
econometrics tools linked to models available at the MEF (see technical exhibit).
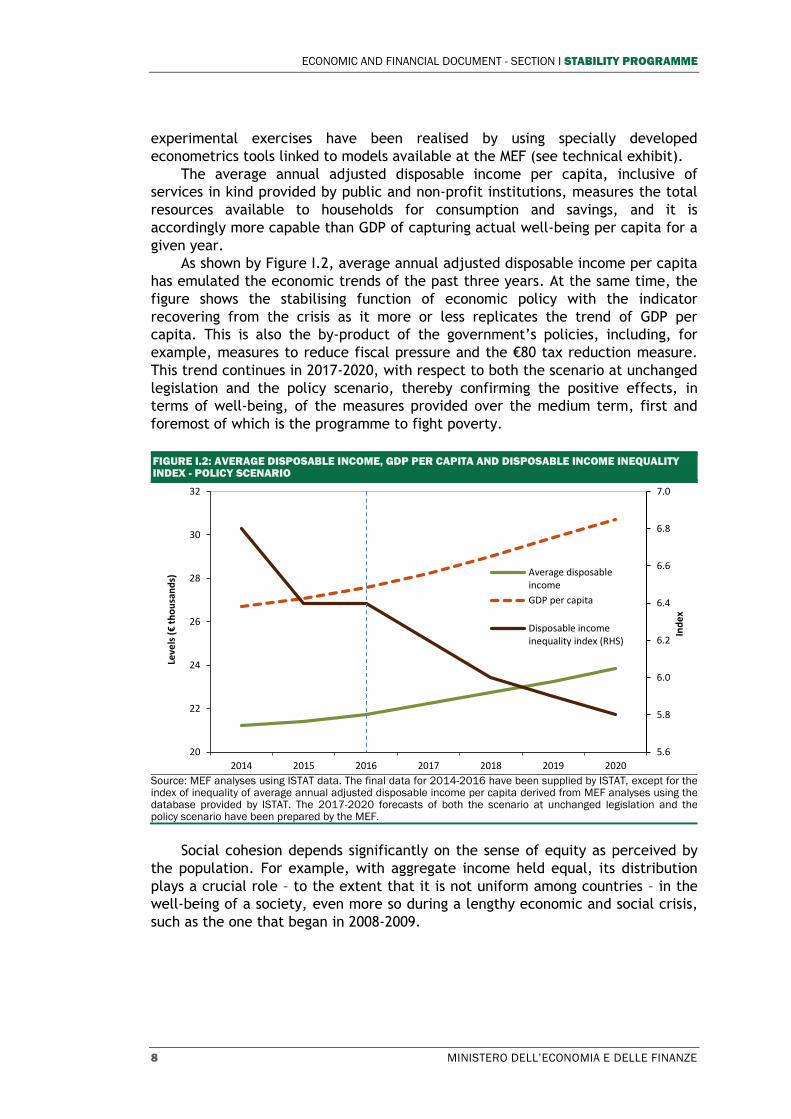
The average annual adjusted disposable income per capita, inclusive of
services in kind provided by public and non-profit institutions, measures the total
resources available to households for consumption and savings, and it is
accordingly more capable than GDP of capturing actual well-being per capita for a
given year.
As shown by Figure I.2, average annual adjusted disposable income per capita
has emulated the economic trends of the past three years. At the same time, the
figure shows the stabilising function of economic policy with the indicator
recovering from the crisis as it more or less replicates the trend of GDP per
capita. This is also the by-product of the government’s policies, including, for
example, measures to reduce fiscal pressure and the €80 tax reduction measure.
This trend continues in 2017-2020, with respect to both the scenario at unchanged
legislation and the policy scenario, thereby confirming the positive effects, in
terms of well-being, of the measures provided over the medium term, first and
foremost of which is the programme to fight poverty.
FIGURE I.2: AVERAGE DISPOSABLE INCOME, GDP PER CAPITA AND DISPOSABLE INCOME INEQUALITY INDEX - POLICY SCENARIO
Source: MEF analyses using ISTAT data. The final data for 2014-2016 have been supplied by ISTAT, except for the index of inequality of average annual adjusted disposable income per capita derived from MEF analyses using the database provided by ISTAT. The 2017-2020 forecasts of both the scenario at unchanged legislation and the policy scenario have been prepared by the MEF.
Social cohesion depends significantly on the sense of equity as perceived by
the population. For example, with aggregate income held equal, its distribution
plays a crucial role – to the extent that it is not uniform among countries – in the
well-being of a society, even more so during a lengthy economic and social crisis,
such as the one that began in 2008-2009.
5.6
5.8
6.0
6.2
6.4
6.6
6.8
7.0
20
22
24
26
28
30
32
2014 2015 2016 2017 2018 2019 2020
Ind
ex
Leve
ls (€
th
ou
san
ds)
Average disposableincome
GDP per capita
Disposable incomeinequality index (RHS)

I. OVERALL FRAMEWORK AND ECONOMIC-POLICY OBJECTIVES
MINISTERO DELL’ECONOMIA E DELLE FINANZE 9
The inequality index selected, i.e. the interquintile ratio of the distribution
of the equivalent incomes5, measures the relationship between (i) the income of
20 percent of the population with the highest income, and (ii) the income of the
20 percent of the population with the lowest income. A reduction of this ratio
therefore indicates greater equity in resource distribution. The decision to start
monitoring the trend of inequality and its relationship with the government’s key
policies is consistent with the inclusion of this theme in the Italian G7 Presidency
agenda.
The high level of inequality affecting the Italian economy is confirmed by
data that show, however, a reduction in the most recent years. The decrease for
the 2014-2017 period (see Figure I.3) is influenced by the improvement of the
labour market and by the various fiscal measures that have been adopted,
including the €80 tax reduction measure, the so-called ‘fourteenth month’ benefit
payment for retirees, additional tax deductions for income from employment and
pensions, the new measures to fight poverty, the elimination of the single
municipal tax (IMU) and the tax on indivisible services for main dwellings (TASI),
and the revision of taxation on financial income (see technical exhibit). For the
years 2017-2020, the scenario at unchanged legislation considers the effects of the
measures already adopted (assuming, as a first approximation, that such measures
do not affect the underlying distribution of primary income, i.e. income from
employment and business). Also considered are the increases in employment
contemplated in the macroeconomic framework at unchanged legislation, which
contribute to a slight improvement of the indicator. The overall effect is a
modest, yet steady, trend in reducing inequality. Instead, the policy scenario
incorporates the objectives that the government intends to achieve through its
actions in the next three years with respect to the structure of taxation and social
contributions.
The third aspect of well-being is related to work, which continues to assume
a primary role in a person’s life not only as a source of income, but also as a
factor of social inclusion and self-esteem. The non-participation rate to the labour
market corresponds to the ratio between (i) the sum of the unemployed and those
available for work, and (ii) the total labour force (with all variables referring to
the age bracket of 15 to 74 years old). Compared with the unemployment rate
regularly considered in the EFD, this indicator allows for also taking into account
the phenomenon of discouragement.
5 Equivalent income is defined by the ratio of total household disposable income (cash and in-kind) to the
‘equivalent’ number of households (through weights derived from the equivalence scale used by ISTAT for the purpose of correcting income per capita or for the intra-household economies of scale).

ECONOMIC AND FINANCIAL DOCUMENT - SECTION I STABILITY PROGRAMME
10 MINISTERO DELL’ECONOMIA E DELLE FINANZE
FIGURE I.3: NON-PARTICIPATION RATE TO LABOUR MARKET – POLICY SCENARIO
Source: ISTAT. From 2017 EFD policy-scenario targets.
The data show an ongoing reduction in the non-participation rate starting in
2015, as a result of the improved macroeconomic framework, labour market
reform (Jobs Act), and the introduction of incentives for the hiring of full-time
personnel on open-ended contracts.
The detail by gender shows the extent to which the inclusion of women in the
labour market has improved, with women representing a large segment of the
potential labour force. Still, more than one-fifth of the reference population does
not have a job, even though willing to enter the market. In both the policy
scenario and the scenario at unchanged legislation, the projections indicate
continuing improvements as a result of greater labour-market participation of
segments of potential workers who are re-entering the market encouraged by a
better outlook for employment and supported by of the active policies
implemented.
A longsighted policy sets not only the objective of enhancing well-being
today, but it also aims to ensure its sustainability over the long term, so as not to
jeopardise the possibilities for future generations. From this perspective,
environmental sustainability plays a key role. The indicator relative to CO2 and
other climate-altering gas emissions was selected with a view toward providing
guidance for the policies that have an impact on environmental sustainability.
Amongst other things, this variable is already included in the Europe 2020
strategy.
Notwithstanding a recovery of the productive and industrial cycle, CO2-
equivalent emissions remain virtually stable during the period considered, with
evidence of an ongoing decarbonisation of the economic system (Figure I.4). In
2016, every inhabitant ‘generated’ an average of 7.4 tons of CO2-equivalent
emissions. The measures introduced in recent years have produced evident
effects, and include rapid growth of the energy generated from renewable
sources, 65-percent tax deductions for the energy-requalification projects with
17.5
18.5
19.5
20.5
21.5
22.5
23.5
2014 2015 2016 2017 2018 2019 2020

I. OVERALL FRAMEWORK AND ECONOMIC-POLICY OBJECTIVES
MINISTERO DELL’ECONOMIA E DELLE FINANZE 11
respect to private-sector properties (Ecobonus) and, more in general, numerous
initiatives aimed at improving energy efficiency.
FIGURE I.4: GDP PER CAPITA, CO2 AND OTHER CLIMATE-ALTERING GAS EMISSIONS – POLICY SCENARIO
Source: ISTAT. From 2017 EFD policy-scenario targets.
In line with EU commitments, the policy scenario provides for further
reduction of emissions, partly due to the measures outlined by the government.
Such measures include the rollover and enhancements of the Ecobonus,
regulations on minimum requisites for buildings, and the design and construction
of infrastructure for alternative fuels, which will encourage the more widespread
use of low-emissions fuels.
7.0
7.2
7.4
7.6
7.8
8.0
8.2
8.4
8.6
-0.2
0.0
0.2
0.4
0.6
0.8
1.0
1.2
1.4
2014 2015 2016 2017 2018 2019 2020
To
ns
% c
ha
nge
y/
y GDP per capita
CO2 and other climate-altering
gas emissions (RHS)


MINISTERO DELL’ECONOMIA E DELLE FINANZE 13
II. MACROECONOMIC FRAMEWORK
II.1 INTERNATIONAL SCENARIO
In 2016, global GDP grew by approximately 3.0 percent, remaining essentially
in line with 2015. Notwithstanding a recovery in recent months, the expansion of
international trade has continued to be very weak, while the elasticity of
international demand to GDP growth has fallen by 50 percent compared with the
long-term average1, following a steady pattern of the past five years.
In the United States, GDP growth in 2016 amounted to 1.6 percent, markedly
declining with respect to 2015 (2.6 percent). In view of the continuing weakness
of the international cycle and domestic investment, the Federal Reserve decided
to leave the reference rate unchanged at 0.25-0.50 percent for most of the year.
During the final months of 2016 and the first months of 2017, the U.S. economy
witnessed strong signs of acceleration; the protraction of historically low levels of
unemployment (4.9 percent) was rounded out by growing levels of confidence in
the private sector, and a new, positive impulse to household wealth linked to the
buoyant trend of the financial market. Consistent with the favourable economic
conditions, the FOMC approved two 25-basis-point increases in the reference rate,
one in December 2016 and another in March 2017, thereby reassuring the gradual
approach to the future increases projected for 2017 and 2018.
In Japan, GDP rose by 0.9 percent, thus accelerating in comparison with 2015
(0.5 percent), and reflecting the positive contribution of both exports and public
consumption. The Bank of Japan has maintained extremely accommodating
monetary policy in 2017, and has projected a favourable trend of the economy in
the short/medium term.
In China, the year of 2016 ended with an annual GDP growth rate of 6.7
percent, which was on target with the government’s projections. This growth
rate, which was the weakest of the past 20 years, reflects China’s transition to a
more mature and balanced economy. The growth target was nonetheless achieved
at the price of another increase in public and private debt. In this regard, many
analysts believe the Chinese government in 2017 will be more oriented toward a
deleveraging process (in order to reduce financial risks) rather than the
achievement of higher growth. In terms of monetary policy, the Chinese central
bank countered market expectations by raising short-term rates, providing a new
indication of gradual tightening in view of indications of stabilisation coming from
the country’s economy. This move also indicates China’s intention to stem the
outflow of capital and to maintain control over the financial-system-related risks
generated by years of expansionist policies.
1 See the European Commission’s new projections and those of leading international organisations (IMF,
World Bank and OECD) to be made available in April and May.

ECONOMIC AND FINANCIAL DOCUMENT - SECTION I STABILITY PROGRAMME
14 MINISTERO DELL’ECONOMIA E DELLE FINANZE
In the Euro Area, the GDP growth of 1.7 percent for 2016 reflects a marginal
acceleration over the previous year (1.6 percent), and is mainly attributable to
the contribution of private consumption. The economic recovery continues to be
marked by the positive performance of the labour market, as a result of broad-
based structural reforms in various Member States; the unemployment rate
gradually descended during the year, reaching 9.6 percent in January 2017 (from
10.3 percent in January 2016).
The Euro Area’s fiscal policy took on a less restrictive tone in 2016, and is
projected to remain as such again in 2017.
Turning to monetary policy, the European Central Bank’s strong expansionist
bent – which was further accentuated at the start of 20162 – contributed to
ensuring financial stability, averting deflation, and improving economic
conditions. The year of 2016 ended with an acceleration of growth, which is
continuing in the first months of 2017, and a significant rise in inflation after a
long period of rates close to zero. However, inflation (which slipped to 1.5
percent year on year in March, from 2.0 percent of February) has been somewhat
volatile; the upward pressure during the first two months of the year was mainly
linked to the prices of energy goods, whereas the core component still remains
weak.
Taken altogether, the global economy is on the path of gradual recovery. The
year of 2017 got off to a good start for highly developed countries, with results
that exceeded, with only a few exceptions, the expectations of analysts. More
specifically, the U.S. elections provided new momentum to the already positive
performance of the American economy, pushing up the expectations of growth (at
least for the near term). The economic recovery grew stronger, and should
accelerate in 2017, including in emerging markets, albeit with performance that
varies from country to country. The latest data on industrial production and
commercial trade indicate a broad-based and vibrant recovery of the
manufacturing sector.
According to the European Commission’s forecasts prepared in January, the
growth rate of international trade, weighted for Italy, should go from 2.6 percent
in 2016 to 3.6 percent in 2017, and to 4.1 percent in the two years thereafter.
These projections are to be revised with the forthcoming spring forecast cycle,
and will be published in May; it is likely they will reflect a slight upward revision3.
With reference to foreign-exchange movements, the appreciation of the
dollar that coincided with the outcome of the U.S. elections was followed by a
period of adjustment. Market expectations, which are normally developed from
projections of currencies based on assumption of the ‘covered interest-rate
parity’, are suggesting an appreciation of the euro. This technique does, however,
2 More specifically, the ECB adopted a larger-than-expected package of expansionist measures in order to
fend off deflationary trends and to facilitate the granting of credit to the real economy; these measures included: an expansion of the size and mix of the securities purchases; an additional reduction of official rates and new measures for refinancing banks at exceptionally favourable conditions. In addition, the ECB’s Executive Board extended the term of the securities purchase programme until December 2017 in order to keep the expansionary monetary conditions adequate for ensuring an increase in inflation. As of April, the monthly purchases were to return to €60 billion, as in the initial phase of the programme.
3 The projections of international trade weighted for Italy have been developed by making reference to the forecasts covering growth of import demand on the part of the Italy’s leading trade partners that were prepared in March by Oxford Economics, which essentially revised upward the figure for 2017.

II. MACROECONOMIC FRAMEWORK
MINISTERO DELL’ECONOMIA E DELLE FINANZE 15
often lead to flawed forecasts and, in actuality, forecasts of exchange rates are
subject to very high uncertainty. It is therefore procedurally more accurate to
assume a future exchange rate near current levels; such methodology is followed
by all leading international bodies, including the European Commission.
With reference to the oil price, forward rates suggest a marginal rebound for
2017-2018, to be followed by a period of near stabilisation. The price increases
seen at the end of 2016 have been partially reversed; the probability of any
significant increases, in a baseline scenario, is rather limited given the less-than-
strict enforcement of the agreements to hold down production volumes and a
higher-than-expected elasticity of U.S. supply. The price of crude oil is obviously
always subject to uncertainty, which is currently particularly linked to risks of a
geopolitical nature.
The international scenario continues to be marked by the prevalence of
downside risks of an economic nature and possible geopolitical tensions; however,
the possibility of more favourable scenarios is increasing. The possible damages to
international trade and the global economy from possible protectionist measures
on the part of the U.S. administration (which is taking the first steps in this
direction) are still to be verified. The medium-term effects of Brexit remain
difficult to quantify since the UK’s exit process has only just been formalised, with
the outcomes, terms and conditions still to be defined.
The upside risks include a stronger recovery of both world trade and the
Chinese economy, although in the latter case there are still concerns related to
high levels of debt in certain sectors of the economy and the continuing strong
growth of credit.
The nations with current account deficits, high U.S.-dollar denominated debt,
and greater dependence on trade with the United States could be subject to
greater downside risks in the near term.
II.2 ITALY’S ECONOMY
In 2016, the Italian economy grew by 0.9 percent, slightly surpassing the last
official forecasts. After stalling in the second quarter, and as contemplated by the
estimates in September, GDP picked up momentum in the final part of the year,
growing at annualised rates closed to 1.0 percent. Domestic demand, net of
inventories, has shown a profile of continuous expansion. Instead, the trend of
inventories cut the growth rate by some tenths of one percentage point. The
performance of net exports was mixed, contributing in the second half to
decreasing growth due to the effects of a strong recovery of imports.
Private consumption, which has been recovering since 2014, continued to
expand, benefitting from better labour market conditions, a sizeable recovery of
real disposable income (+1.6 percent compared with +0.8 percent of 2015), and
the improvement of the conditions for accessing credit. As in 2015, the
consumption of durable goods in 2016 proved to be the driving factor, partly due
to automobile purchases. Also noteworthy is the increase in the consumption of
services, which rebounded to levels well above those prior to the crisis.
Household wealth continues to remain solid as a result of low indebtedness.
Debt sustainability has been favoured both by the growth of nominal gross
ECONOMIC AND FINANCIAL DOCUMENT - SECTION I STABILITY PROGRAMME
16 MINISTERO DELL’ECONOMIA E DELLE FINANZE
disposable income (+1.6 percent in 2016), and by low interest rates. In 2016, the
propensity to save increased on average by 8.6 percent; investments in housing
rose by 3.7 percent, presumably for the effect of the sizeable increase in
disposable income.
Investments experienced unexpected growth, once again driven by the
component related to transportation systems and equipment (27.3 percent).
Investments in machinery also started to grow again, albeit at more modest rates;
the segment benefited from incentives regarding accelerated depreciation
implemented with the 2016 Stability Law. The construction sector witnessed a
recovery in the second half of the year. The annual figure reflects an increase (1.1
percent) for the first time since 2007, partly due to the positive trend of
investments in housing; infrastructure investments have nonetheless remained at
a standstill.
Industria 4.0 Plan, accelerated depreciation, and the investment response
“Industria 4.0” (“I4.0”) refers to an industrial automation trend that integrates new
productive technologies in order to improve working conditions and to raise plant
productivity and product quality. More specifically, the new productive processes are based
on products designed and built with new materials, mechatronics, robotics, employment of
advanced ICT technologies for the virtualisation of transformation processes, and systems
for the enhancing the value of human resources in factories. The term “Industria 4.0” was
coined by the German government, which presented a special plan in 2011, and made it a
reality at the end of 2013. The positive results of the German programme led other
countries to adopt this approach.
In Italy, the National Industria 4.0 Plan, approved with the 2017 Stability Law, consists of a
series of measures to support productivity, flexibility and competitiveness of output, so as to
exploit the opportunities offered by this new industrial revolution. The accelerated
depreciation regulations introduced with the 2016 Stability Law have been confirmed and
enhanced. In addition, a major package of initiatives has been rolled out: measures to
stimulate innovative investment and to reinforce skills (Scuola Digitale [Digital School] and
Alternanza Scuola Lavoro [School-Work Programmes]), and measures to finance growth.
The Italian economy is in great need of investments that incorporate new technologies. An
opinion poll commissioned by the Italian Association of Producers of Machine Tools,
Robotics and Automation (UCIMU) suggests, for example, that the stock of machine tools in
Italy’s metal-mechanical industry became substantially obsolete during the years of
recession. The average age rose from 10 years and five months in 2005 to 12 years and 8
months in 2014. On the one hand, these statistics demonstrate the need for renewing
capital goods to improve their productivity; on the other hand, they highlight the existing
potential for a sharp recovery of investments.4
Chapter II of the National Reform Programme contains an econometric assessment of the
effects of the Industria 4.0 Plan on Italy’s key macroeconomic variables and also describes
details of the measures contemplated. According to the MEF’s estimates, the impact of
such measures on investments and consumption would be immediate and positive, and
would be strengthened over time. Compared with the baseline scenario, the growth of
investments and consumption would generate an increase of GDP of 1.2 percent after five
years and 1.9 percent after 10 years; the estimated effect on GDP in the long term is equal
to 4.1 percent.
The assessments made have obviously ascribed the first significant effects to investments.
It will be important to monitor the behaviour of this component of GDP in the next few
4 See UCIMU, Italian Industry Stock of Machine Tools and Production Systems, November 2015.
FO
CU
S

II. MACROECONOMIC FRAMEWORK
MINISTERO DELL’ECONOMIA E DELLE FINANZE 17
quarters, even though it is not possible to distinguish – ex-post – between the effects of the
incentives and the economic recovery in process. It is also noted that the measures related
to 2017 will build on and reinforce the stimulus measures already implemented for 2016.
According to the national accounting data, the investment recovery became more evident
starting in the final two quarters of 2016. The rebound has been led by a particularly strong
increase in expenditure on transportation systems and equipment, the component that has
responded with greater vigour in the near term; though less intense, the response of
investment in machinery has also been positive. Business surveys about investment goods
also provide favourable indications, pointing to improvements in orders (domestic orders, in
particular) and production starting in the final quarter of 2016.
INVESTMENTS AND ORDERS (% change y/y and indices)
Source: Istat.
In terms of production, Italy’s most advanced sectors (such as plastics, hi-tech and machine
tools, robotics and automation) are starting to see the first effects of the National Industria
4.0 Plan, since such sectors are already ready to supply their customers with advanced and
innovative production systems. The machine tools, robotics and automation industry already
ended 2016 on a very positive note, and according to the UCIMU, 2017 should yield a 4.0
percent increase in production and a 6.8 percent increase in domestic demand for machine
tools and robotics. Traditionally at the leading edge of technology, the manufacturers of
machinery and equipment for the processing of plastic materials and rubber are also
generating positive signs: some 43 percent of the sample monitored by the trade
association, Assocomaplast, reported growth in orders, some of which is due to the impetus
of the incentives for Industria 4.0.
Turning to the analysis of all sectors of the economy, the Bank of Italy’s most recent
quarterly survey (related to the first quarter of 2017) supplies encouraging signs, with
almost one-third of the industrial and services firms interviewed (33.9 percent) planning to
invest more in 2017 than in 2016, whereas only 18.7 percent of the firms anticipate
reduction of investment.5 Among large companies, some 49.1 percent plan to increase
investment in 2017, while only 11.5 percent intend to reduce investment.
The same survey indicates that the Industria 4.0 Plan incentives are deemed important by
66.1 percent of the industrial and services firms interviewed (81.5 percent for large
5 See Bank of Italy, Survey on expectations about inflation and growth, First quarter 2017, 10 April 2017.
-70
-60
-50
-40
-30
-20
-10
0
10
20
30
-25
-20
-15
-10
-5
0
5
10
15
20
25
1T07 1T08 1T09 1T10 1T11 1T12 1T13 1T14 1T15 1T16 1T17
Gross fixed investment
Orders expectations for the next three months (RHS)
Order books (RHS)

ECONOMIC AND FINANCIAL DOCUMENT - SECTION I STABILITY PROGRAMME
18 MINISTERO DELL’ECONOMIA E DELLE FINANZE
companies). These data are encouraging in terms of the probable trend of high-tech
investments during the remainder of 2017 and in the first half of 2018 (the incentive then
ends, provided that an advance payment of at least 20 percent is paid by the end of 2017).
The trend of exports was better than expected. Aided by the acceleration of
the world trade at the end of 2016 and the depreciation of the euro, exports rose
by 2.4 percent. The trend of imports was more buoyant (2.9 percent) thanks to
the recovery of both domestic demand and the industrial productive cycle.
Regarding the sectors of value added , there were no unexpected
developments: the recovery of the manufacturing industry remains confirmed. The
industrial production data indicate an increase of 1.7 percent over 2015. The
rebound has been driven by capital goods (3.8 percent) and intermediate goods
(2.2 percent), while the production of consumer goods remained essentially flat
and the production of energy goods was slightly down year on year. The
construction sector also moved back into positive territory, putting an end to a
downturn that lasted several years. Instead, a decrease was seen in the added
value of the farming sector (which is nonetheless a component that has a limited
weight on GDP). The ongoing, weak performance of the services sector (0.6
percent) had the effect of decelerating the economic recovery, although results
varied with regard to the sector’s components. Financial and insurance activity
logged a hefty decline (-2.3 percent), while retailing, hospitality, food and
beverage, transportation and warehousing services (approximately 20 percent of
GDP) registered an acceleration (1.7 percent). The trend of real estate and
professional services, which together account for just over 20 percent of the total
economy, was slightly positive (0.8 percent and 1.3 percent, respectively).
With reference to businesses, and in particular, non-financial businesses,
profits in 2016 rose by 42 percent (an increase of 0.9 percentage points) partly
due to 5.2 percent growth of gross operating profit. The rate of investment
increased (19.7 percent, +0.2 percentage points over 2015); gross fixed
investment, again in nominal terms, was up by 4.1 percent. The latest data
published by the Bank of Italy in relation to June 2016 indicate profitability
growth, a 5-percent annual rise in the gross operating margin, and a decrease in
financial charges (for the effect of lower interest) to 15.5 percent of the gross
operating margin, the lowest level since 20066.
As in 2015, the data on the labour market in 2016 are encouraging, and
demonstrate that the measures introduced (Jobs Act and social-welfare
contribution incentives) have had positive effects on employment. The growth of
the employed accelerated in terms of standard units (1.4 percent), as well as with
respect to national accounting and the labour force survey (LFS) data (+1.3
percent for both). According to analyses of data reported on the LFS, the growth
of the number of employed reflects increases in employees with term and open-
ended contracts, whereas the number of self-employed declined. The
improvement in the number of employed was accompanied by an acceleration in
the participation rate, and so the unemployment rate fell by only 0.2 percentage
points, to stand at 11.7 percent.
6 Bank of Italy, Report on Financial Stability, No. 2, 18 November 2016.

II. MACROECONOMIC FRAMEWORK
MINISTERO DELL’ECONOMIA E DELLE FINANZE 19
Wage moderation has continued. Compensation per employee rose by an
annual average of 0.3 percent, while labour productivity, measured according to
FTEs, declined by 0.5 percent; as a result, the unit labour cost increased by 0.8
percent for the economy as a whole.
Given the continuation of the low prices of energy goods, inflation was close
to zero: the consumer price index contracted (-0.1 percent) for the first time
since 1959, while core inflation remained in positive territory, although slowing if
compared with 2015 (0.5 percent from 0.7 percent). The change in the GDP
deflator was greater; it rose by 0.8 percent, reflecting improvement in the terms
of trade.
Foreign trade
Global industrial production and trade7 slowed further in 2016, although the
latest data on volumes indicate more robust growth rates toward the end of the
year.
Against this backdrop, total exports of goods in volume terms grew by 1.2
percent with respect to the previous year, and it is estimated that Italian’s share
of exports within international trade remained essentially unchanged.
The trend of exports to the EU was moderately satisfactory (3.0 percent),
while flows outside of the EU diminished (-0.8 percent) mainly due to the
difficulties of the main energy producing countries (in particular, the OPEC
countries and Russia), the continuation of the crisis in Latin America (especially in
Brazil), and the difficult conditions faced by certain countries in North Africa. In
the markets outside of Europe, the most impressive data regarded exports to the
United States (2.7 percent) and China (6.4 percent). From a sector perspective,
the exports of the pharmaceutical products reflected the highest increase (6.0
percent), followed by chemical and food products, beverages, and tobacco
products (4.3 percent) and transportation systems and equipment (4.2 percent).
7 In 2016, world trade and industrial production grew respectively by 1.3 percent and 1.8 percent (-0.7
percentage points and -0.1 percentage points compared with 2015). Source: CPB Netherlands Bureau for Economic Policy Analysis, ‘World Trade Monitor’, 24 March 2017.
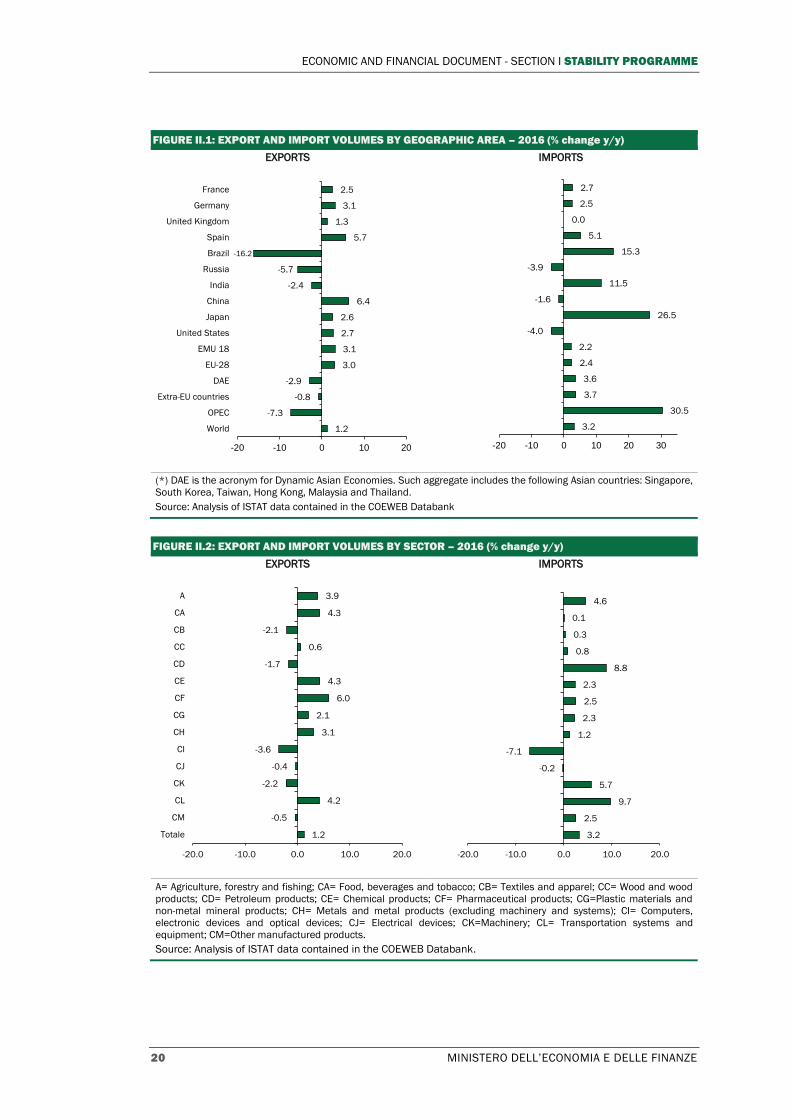
ECONOMIC AND FINANCIAL DOCUMENT - SECTION I STABILITY PROGRAMME
20 MINISTERO DELL’ECONOMIA E DELLE FINANZE
FIGURE II.1: EXPORT AND IMPORT VOLUMES BY GEOGRAPHIC AREA – 2016 (% change y/y)
EXPORTS IMPORTS
(*) DAE is the acronym for Dynamic Asian Economies. Such aggregate includes the following Asian countries: Singapore,
South Korea, Taiwan, Hong Kong, Malaysia and Thailand.
Source: Analysis of ISTAT data contained in the COEWEB Databank
FIGURE II.2: EXPORT AND IMPORT VOLUMES BY SECTOR – 2016 (% change y/y)
EXPORTS IMPORTS
A= Agriculture, forestry and fishing; CA= Food, beverages and tobacco; CB= Textiles and apparel; CC= Wood and wood
products; CD= Petroleum products; CE= Chemical products; CF= Pharmaceutical products; CG=Plastic materials and
non-metal mineral products; CH= Metals and metal products (excluding machinery and systems); CI= Computers,
electronic devices and optical devices; CJ= Electrical devices; CK=Machinery; CL= Transportation systems and
equipment; CM=Other manufactured products.
Source: Analysis of ISTAT data contained in the COEWEB Databank.
1.2
-0.5
4.2
-2.2
-0.4
-3.6
3.1
2.1
6.0
4.3
-1.7
0.6
-2.1
4.3
3.9
-20.0 -10.0 0.0 10.0 20.0
Totale
CM
CL
CK
CJ
CI
CH
CG
CF
CE
CD
CC
CB
CA
A
3.2
2.5
9.7
5.7
-0.2
-7.1
1.2
2.3
2.5
2.3
8.8
0.8
0.3
0.1
4.6
-20.0 -10.0 0.0 10.0 20.0
1.2
-7.3
-0.8
-2.9
3.0
3.1
2.7
2.6
6.4
-2.4
-5.7
-16.2
5.7
1.3
3.1
2.5
-20 -10 0 10 20
World
OPEC
Extra-EU countries
DAE
EU-28
EMU 18
United States
Japan
China
India
Russia
Brazil
Spain
United Kingdom
Germany
France
3.2
30.5
3.7
3.6
2.4
2.2
-4.0
26.5
-1.6
11.5
-3.9
15.3
5.1
0.0
2.5
2.7
-20 -10 0 10 20 30
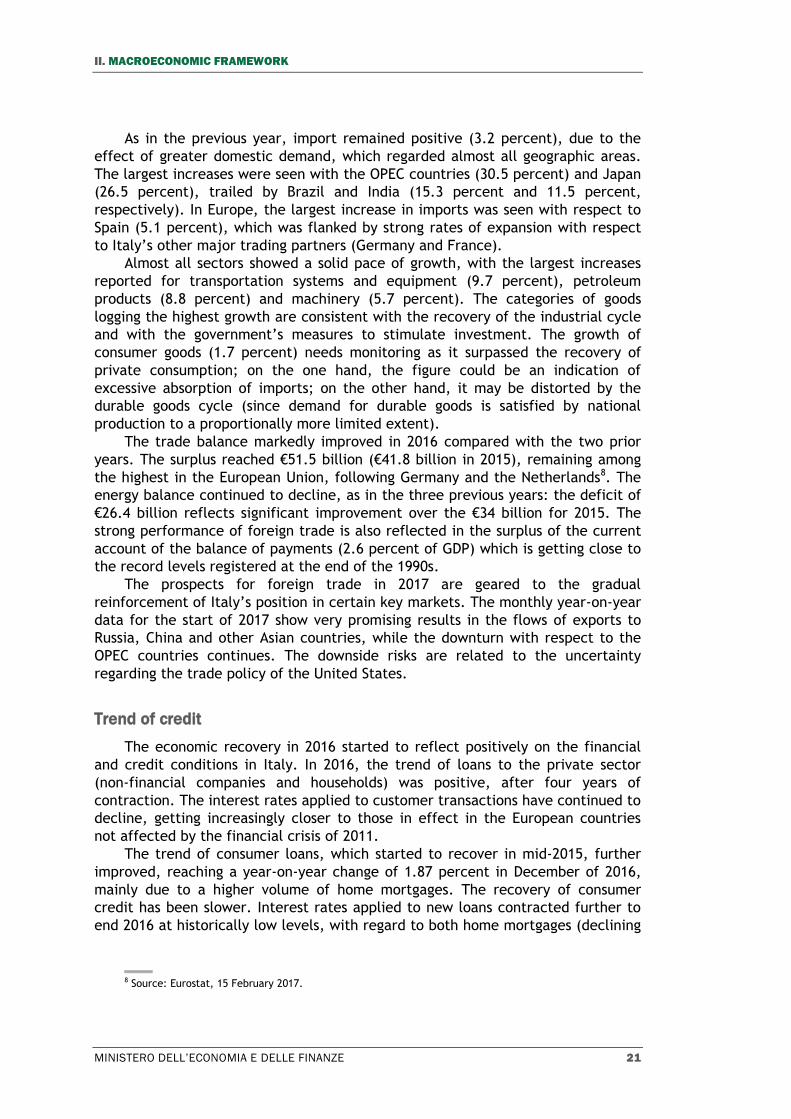
II. MACROECONOMIC FRAMEWORK
MINISTERO DELL’ECONOMIA E DELLE FINANZE 21
As in the previous year, import remained positive (3.2 percent), due to the
effect of greater domestic demand, which regarded almost all geographic areas.
The largest increases were seen with the OPEC countries (30.5 percent) and Japan
(26.5 percent), trailed by Brazil and India (15.3 percent and 11.5 percent,
respectively). In Europe, the largest increase in imports was seen with respect to
Spain (5.1 percent), which was flanked by strong rates of expansion with respect
to Italy’s other major trading partners (Germany and France).
Almost all sectors showed a solid pace of growth, with the largest increases
reported for transportation systems and equipment (9.7 percent), petroleum
products (8.8 percent) and machinery (5.7 percent). The categories of goods
logging the highest growth are consistent with the recovery of the industrial cycle
and with the government’s measures to stimulate investment. The growth of
consumer goods (1.7 percent) needs monitoring as it surpassed the recovery of
private consumption; on the one hand, the figure could be an indication of
excessive absorption of imports; on the other hand, it may be distorted by the
durable goods cycle (since demand for durable goods is satisfied by national
production to a proportionally more limited extent).
The trade balance markedly improved in 2016 compared with the two prior
years. The surplus reached €51.5 billion (€41.8 billion in 2015), remaining among
the highest in the European Union, following Germany and the Netherlands8. The
energy balance continued to decline, as in the three previous years: the deficit of
€26.4 billion reflects significant improvement over the €34 billion for 2015. The
strong performance of foreign trade is also reflected in the surplus of the current
account of the balance of payments (2.6 percent of GDP) which is getting close to
the record levels registered at the end of the 1990s.
The prospects for foreign trade in 2017 are geared to the gradual
reinforcement of Italy’s position in certain key markets. The monthly year-on-year
data for the start of 2017 show very promising results in the flows of exports to
Russia, China and other Asian countries, while the downturn with respect to the
OPEC countries continues. The downside risks are related to the uncertainty
regarding the trade policy of the United States.
Trend of credit
The economic recovery in 2016 started to reflect positively on the financial
and credit conditions in Italy. In 2016, the trend of loans to the private sector
(non-financial companies and households) was positive, after four years of
contraction. The interest rates applied to customer transactions have continued to
decline, getting increasingly closer to those in effect in the European countries
not affected by the financial crisis of 2011.
The trend of consumer loans, which started to recover in mid-2015, further
improved, reaching a year-on-year change of 1.87 percent in December of 2016,
mainly due to a higher volume of home mortgages. The recovery of consumer
credit has been slower. Interest rates applied to new loans contracted further to
end 2016 at historically low levels, with regard to both home mortgages (declining
8 Source: Eurostat, 15 February 2017.

ECONOMIC AND FINANCIAL DOCUMENT - SECTION I STABILITY PROGRAMME
22 MINISTERO DELL’ECONOMIA E DELLE FINANZE
on average to 2.3 percent from 2.8 percent in 2015) and consumer credit (down to
7.6 percent from 7.9 percent).
The year of 2016 also brought the stabilisation of credit flows to non-financial
companies; the annual change was positive (0.1 percent) for the first time since
2012. Interest rates on new corporate loans also steadily declined, going from 1.92
percent in December 2015 to 1.54 percent in December 2016.
The positive trend continued into the first months of 2017. In January, loans
to the private sector rose by 1.2 percent year on year, with a 2.2 percent increase
in loans to consumers and a 0.9 percent in loans to businesses. According to
preliminary data supplied by the Italian Banking Association (ABI), the growth of
the loans accelerated to 1.5 percent in February and 1.8 percent in March.
The improvements have not, however, been all-encompassing. In the first
place, the flow of credit increased further only with respect to companies without
problem debts (to the detriment of companies in difficulty). In addition, the
recovery of corporate lending is unfolding differently depending on business size
and sector of activity.
FIGURE II.3: INTEREST RATES TO NON-FINANCIAL BUSINESSES AND HOUSEHOLDS (% change y/y)
Source: Bank of Italy.
The latest Bank Lending Survey for the Euro Area, published in January, does
not report any substantial changes in the loan supply criteria with respect to
Italian households and businesses (particularly for large businesses, although it
does report modest easing with respect to small- and medium-sized firms). The
average margins applied to loans for both types of customers continue to
decrease. For the first quarter of 2017, there are no changes expected in the
credit supply criteria with respect to businesses, whereas some easing is
anticipated with respect to consumer credit. The demand for corporate loans (to
both small and large businesses) remained virtually unchanged, while it grew
stronger in the case of consumer loans. There are no changes contemplated in
corporate demand for credit during the first three months of the year, compared
0
2
4
6
8
10
12
0
1
2
3
4
5
6
7
8
Jan-07 Jan-08 Jan-09 Jan-10 Jan-11 Jan-12 Jan-13 Jan-14 Jan-15 Jan-16 Jan-17
Non-fin corp: up to euros 1 mm Non-fin corp: more than euros 1 mm
Households: for house pourchases Households: for consumer credit (RHS)
II. MACROECONOMIC FRAMEWORK
MINISTERO DELL’ECONOMIA E DELLE FINANZE 23
with a slight increase in the demand from households. Finally, the number of
corporate and consumer loan applications rejected was on the decline.
Outlook for the Italian economy
Scenario at unchanged legislation
The most recent data provide positive indications for the first quarter, and in
particular, for the manufacturing sector. The results emerging from sector-
confidence survey are favourable: following the gradual improvement seen since
December, the expectations of the sector’s businesses were much stronger in
March, returning to the levels reached in 2007. The surge in confidence is
associated with improved perceptions about orders and production, and in
particular, better expectations from producers of capital goods, whose
assessments presumably take into account the incentives enacted by the
government, particularly for the capital goods covered by Industria 4.0. The
Purchasing Managers Index (PMI) has shown ongoing, significant improvement in
the first three months of the year, reaching a six-year high in March. In addition,
the capacity utilisation rate is at an historically high level.
Unlike the recent survey results and the very positive performance in the final
months of 2016, the industrial production index opened the year with a larger-
than-expected decline (-2.3 percent versus December). This result was affected
by a correction for the days worked, which can cause strong volatility in December
and January, due to the variance between holidays and the days when companies
are actually closed. The index recovered nonetheless in February, growing by 1.0
percent over the prior month. Overall, the average seasonally adjusted industrial
production index for the three months ending in February reflects growth of 0.74
percent over the previous three months (3.0 percent annualised rate).
The construction sector also witnessed a rebound in production toward the
end of 2016, followed by a sizeable drop of the sector index in January. Property
sales, particularly residential property sales, continued to grow in number during
2016 and housing prices grew slightly on an annual basis in the fourth quarter, for
the first time in five years. The sector should provide further indications of
recovery in 2017, including in view of the ongoing acceleration of public
investment.
In March the surveys show improvement in consumer confidence, which,
though falling below the peak of December, is still at the levels seen last fall. The
outlook is even better for investment; the results of some business surveys9 are
the basis for cautious optimism, given the positive perceptions about the incentive
measures, which have been further expanded in 2017.
In the meantime, the revival of the credit supply to the economy is ongoing,
as indicated above. Encouraging signs have also come from first monthly data on
foreign trade, which is mostly positive. The indications, as confirmed by orders
from abroad (data derived from the PMI), are also favourable.
9 Bank of Italy, Economic Bulletin, January 2017.

ECONOMIC AND FINANCIAL DOCUMENT - SECTION I STABILITY PROGRAMME
24 MINISTERO DELL’ECONOMIA E DELLE FINANZE
TABLE II.1: MACROECONOMIC SCENARIO AT UNCHANGED LEGISLATION (% change, unless otherwise
indicated)
2016 2017 2018 2019 2020
INTERNATIONAL EXOGENOUS VARIABLES
International trade 2.8 3.4 3.5 3.9 3.7
Oil price (Brent, USD/barrel, futures) 49.0 54.4 53.8 53.4 53.6
USD-EUR exchange rate 1.107 1.060 1.060 1.060 1.060
ITALY MACRO DATA (VOLUMES)
GDP 0.9 1.1 1.0 1.1 1.1
Imports 2.9 4.4 2.8 3.6 3.8
Final national consumption 1.2 0.8 0.4 0.7 0.8
Household consumption and NPISH 1.4 1.0 0.5 0.8 0.8
Government expenditure 0.6 0.3 -0.1 0.2 0.8
Investments 2.9 3.7 3.1 3.4 3.5
- machinery, equipment and other fixed assets 2.1 3.4 3.7 3.6 3.8
- transportation means 27.3 11.6 1.5 3.7 4.6
- construction 1.1 2.6 2.7 3.1 3.2
Exports 2.4 3.7 3.2 3.3 3.1
Memo item: Current account balance (% of GDP) 2.6 2.3 2.6 2.6 2.5
CONTRIBUTIONS TO GDP GROWTH (1)
Net exports -0.1 -0.1 0.2 0.0 -0.1
Inventories -0.5 0.0 0.0 0.0 0.0
Domestic demand, national net of inventories 1.4 1.3 0.8 1.1 1.3
PRICES
Import deflator -3.4 2.5 1.5 1.8 1.7
Export deflator -0.9 1.7 2.0 1.9 1.9
GDP deflator 0.8 1.1 1.8 1.8 1.7
Nominal GDP 1.6 2.2 2.9 2.9 2.8
Private consumption deflator 0.0 1.2 2.1 2.1 1.8
Memo item: HICP, net of imported energy, % change (2) 0.5 1.0 1.2 1.4
LABOUR Labour cost 0.3 1.0 1.1 1.5 1.5
Productivity (measured on GDP) -0.5 0.3 0.3 0.4 0.4
Unit labour cost (measured on GDP) 0.8 0.8 0.8 1.1 1.0
Employment (FTEs) 1.4 0.8 0.8 0.7 0.7
Unemployment rate 11.7 11.5 11.2 10.8 10.2
Employment rate (ages 15 to 64) 57.2 57.9 58.3 58.8 59.5
Memo item: Nominal GDP (in € mn) 1,672.438 1,709.547 1,758.562 1,810.380 1,861.903
(1) Discrepancies, if any, are due to rounding.
(2) Source: ISTAT.
Note: Cut-off date of the exogenous variables: 15 March 2017.
GDP and components in volume (chain-linked volumes, base year of 2010), data not adjusted for working days.
The trend of rising inflation continued in March, albeit at a more modest pace
than in the previous month. The increase was driven by the more volatile
components (unregulated energy goods and unprocessed foods) in relation to
higher oil prices, and rounded out by the acceleration of prices for transportation

II. MACROECONOMIC FRAMEWORK
MINISTERO DELL’ECONOMIA E DELLE FINANZE 25
services. However, core inflation rose only slightly, and stood marginally above
0.5 percent. When considering the trend of oil prices, which have been stable
around US$50/barrel, the price index is expected to grow by just over 1 percent
for the year.
As described above, the international scenario at the start of 2017 is
altogether better than expected. Monetary conditions continue to be
accommodative, facilitating greater access to credit and supporting the expansion
of consumption and investments. The stock markets have continued to perform
positively. Still, the tensions in the markets mainly linked to the outcome of the
forthcoming elections in several European countries have prompted a rise in long-
term rates.
According to the new scenario at unchanged legislation, GDP for 2017 should
grow by 1.1 percent in real terms and 2.2 percent in nominal terms.
Notwithstanding the favourable prospects emerging from international scenario,
the growth forecast for 2017 has been revised only slightly upward (0.1
percentage points) when compared with the figures indicated in the 2016 EFD
Update (see box entitled ‘Forecast errors with respect to 2016 and revision of the
estimates for 2017 and subsequent years’). In 2018, the real growth rate should
decrease, falling back to 1.0 percent; the indirect tax increase provided by the
safeguard clauses in previous legislation would impede the trend of the economy
to accelerate further. In the final two years of the forecast, the GDP growth rate
is set at 1.1 percent. From a medium-term perspective and in the absence of any
unfavourable shocks, the overall reforms implemented in recent years should lead
to greater optimism; at the same time, however, due to the prudence required by
the budget planning process, the growth projections were kept fairly
conservative.
As far as the various components of GDP are concerned, the growth over the
entire forecast period is likely to be driven by domestic demand. Foreign demand
should supply a marginally positive contribution on average.
Investments are the most dynamic variable, propelled by the recovery of
exports, favourable financial conditions, and fiscal incentives. The gradual
recovery of corporate profit margins and balance sheets also has the potential to
play an important role. Investments in construction are poised to grow at a more
limited pace, but they should gradually improve.
Household consumption is projected to slow in 2018-2019 as a result of higher
indirect taxes, and it should increase marginally in 2020. In addition, the trend of
consumption is expected to reflect the deceleration of real disposable income
resulting from price increases (for effect of increased indirect taxes in 2018) and
wage moderation. The profile of consumption is nonetheless conservative, as it
incorporates the maintenance of the savings rates posted in 2016. The
unemployment rate should gradually descend to hover just above 10 percent in
2020.
Exports should expand at a rate slightly below that of Italy’s key foreign
markets, and imports will likely be spurred by greater domestic demand. The
current account balance should thus be around 2.5 percentage points of GDP at
the end of the forecast period.
Taken altogether, the forecasts do not substantially differ from the average
Consensus Forecasts (0.8 percent in 2017 and 0.9 percent in 2018). The box which

ECONOMIC AND FINANCIAL DOCUMENT - SECTION I STABILITY PROGRAMME
26 MINISTERO DELL’ECONOMIA E DELLE FINANZE
follows takes a more in-depth look at the technical reasons for the revision of the
growth forecast for 2017.
Forecast errors with respect to 2016 and revision of the estimates for 2017 and subsequent years10
This section analyses the revision of the growth forecasts compared with the Draft
Budgetary Plan (DBP) published in October 2016, in view of (i) the actual data for 2016, as
published by ISTAT in early March, and (ii) new assumptions about international
macroeconomic scenario. The comparison is done with the assumptions on public finance
being held constant, and thus, it is useful in providing indications about the scenario at
unchanged legislation in the EFD11.
First of all, Table R1 shows the differences (Column C, forecast error) between the values of
the main macroeconomic aggregates forecast for 2016 in the DBP (Column A) and the
actual data (Column B). It is noted that the DBP forecasts started from the third quarter of
2016 and that the actual data also include the revisions made by ISTAT to the first two
quarters of 2016; accordingly, the difference indicated in Column C is due both to (i) the
forecast error, as strictly defined, for the third and fourth quarters of the year, and (ii) the
aforementioned revision.
With reference to GDP (first row of the table), it is possible to note that the forecasts turned
out to be prudent (negative forecast error equal to two tenths of one point); the DBP
correctly projected the growth for the second half of the year, and, at the same time, ISTAT
made upward revisions to the data for the first two quarters of 2016. Looking at the
components of the domestic demand, consumption was essentially in line with the
estimates, whereas investments in machinery and transportation systems and equipment
were better than the forecast; the same can be said for exports, as a result of a recovery in
the final months of the year. The trends of consumer prices and the GDP deflator were
instead weaker than forecast, but only due to a downward revision of the ISTAT estimates
for the first two quarters. Employment grew by more than the estimated values, thus fully
reflecting the positive effects of the Jobs Act and the incentives with respect to social
contributions.
The next columns consider the revisions of the forecasts for 2017.
Column D “Change - Carry-over effect” shows the extent to which 2016-to-2017 statistical
carry-over effect changed between the value estimated in the DBP and the value that was
definitively determined now that the 2016 data are complete; Column D shows, in essence,
the extent to which the 2017 annual forecast would be changed by considering only the
effect of the final data for 2016; the calculation implicitly assumes that the quarter-on-
quarter changes for the four quarters of 2017, as incorporated into the DBP, are left
unchanged.
As in the case of private consumption, the change of the effect of carry-over for GDP is
equal to zero, whereas the value of Column D is positive, and often above one point, in the
case of investments, imports and exports. This implies that the 2017 growth profile for such
variables should be revised upward compared with the DBP, purely for the effect of the new
data, and with other factors held constant. Similar conclusions can be reached with respect
to the GDP deflator and consumption.
The revision of the forecast should also be influenced by changes in the international
framework with respect to October. Column E (“Delta - International scenario”) shows the
10 Reference is made to the quarterly economic accounts data which are adjusted for business days.
Considering the raw annual figure, i.e. not adjusted for days worked, the final increase in GDP in 2016 is 0.9 percent, compared with a DPB growth forecast of 0.8 percent.
11 However, see the observations in relation to Column I.
FO
CU
S
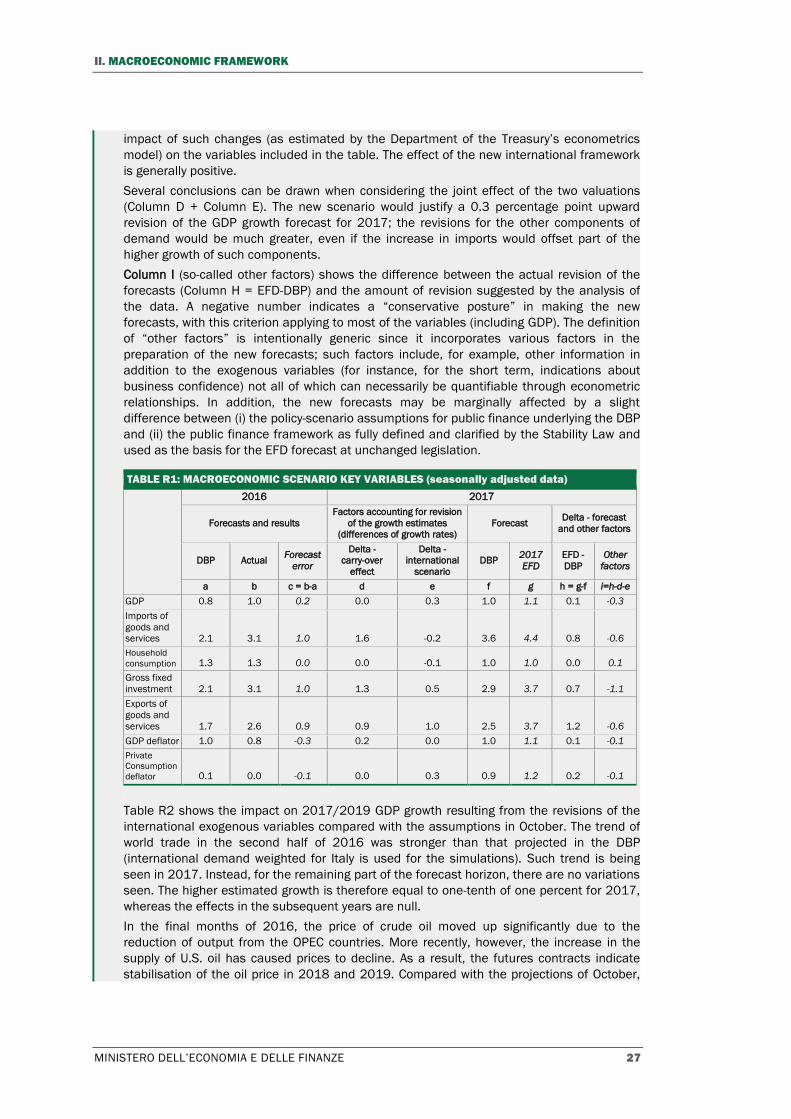
II. MACROECONOMIC FRAMEWORK
MINISTERO DELL’ECONOMIA E DELLE FINANZE 27
impact of such changes (as estimated by the Department of the Treasury’s econometrics
model) on the variables included in the table. The effect of the new international framework
is generally positive.
Several conclusions can be drawn when considering the joint effect of the two valuations
(Column D + Column E). The new scenario would justify a 0.3 percentage point upward
revision of the GDP growth forecast for 2017; the revisions for the other components of
demand would be much greater, even if the increase in imports would offset part of the
higher growth of such components.
Column I (so-called other factors) shows the difference between the actual revision of the
forecasts (Column H = EFD-DBP) and the amount of revision suggested by the analysis of
the data. A negative number indicates a “conservative posture” in making the new
forecasts, with this criterion applying to most of the variables (including GDP). The definition
of “other factors” is intentionally generic since it incorporates various factors in the
preparation of the new forecasts; such factors include, for example, other information in
addition to the exogenous variables (for instance, for the short term, indications about
business confidence) not all of which can necessarily be quantifiable through econometric
relationships. In addition, the new forecasts may be marginally affected by a slight
difference between (i) the policy-scenario assumptions for public finance underlying the DBP
and (ii) the public finance framework as fully defined and clarified by the Stability Law and
used as the basis for the EFD forecast at unchanged legislation.
TABLE R1: MACROECONOMIC SCENARIO KEY VARIABLES (seasonally adjusted data)
2016 2017
Forecasts and results
Factors accounting for revision
of the growth estimates (differences of growth rates)
Forecast Delta - forecast
and other factors
DBP Actual Forecast
error
Delta - carry-over
effect
Delta - international
scenario
DBP 2017
EFD
EFD -
DBP
Other
factors
a b c = b-a d e f g h = g-f i=h-d-e
GDP 0.8 1.0 0.2 0.0 0.3 1.0 1.1 0.1 -0.3
Imports of
goods and services 2.1 3.1 1.0 1.6 -0.2 3.6 4.4 0.8 -0.6
Household
consumption 1.3 1.3 0.0 0.0 -0.1 1.0 1.0 0.0 0.1
Gross fixed
investment 2.1 3.1 1.0 1.3 0.5 2.9 3.7 0.7 -1.1
Exports of
goods and
services 1.7 2.6 0.9 0.9 1.0 2.5 3.7 1.2 -0.6
GDP deflator 1.0 0.8 -0.3 0.2 0.0 1.0 1.1 0.1 -0.1
Private
Consumption
deflator 0.1 0.0 -0.1 0.0 0.3 0.9 1.2 0.2 -0.1
Table R2 shows the impact on 2017/2019 GDP growth resulting from the revisions of the
international exogenous variables compared with the assumptions in October. The trend of
world trade in the second half of 2016 was stronger than that projected in the DBP
(international demand weighted for Italy is used for the simulations). Such trend is being
seen in 2017. Instead, for the remaining part of the forecast horizon, there are no variations
seen. The higher estimated growth is therefore equal to one-tenth of one percent for 2017,
whereas the effects in the subsequent years are null.
In the final months of 2016, the price of crude oil moved up significantly due to the
reduction of output from the OPEC countries. More recently, however, the increase in the
supply of U.S. oil has caused prices to decline. As a result, the futures contracts indicate
stabilisation of the oil price in 2018 and 2019. Compared with the projections of October,
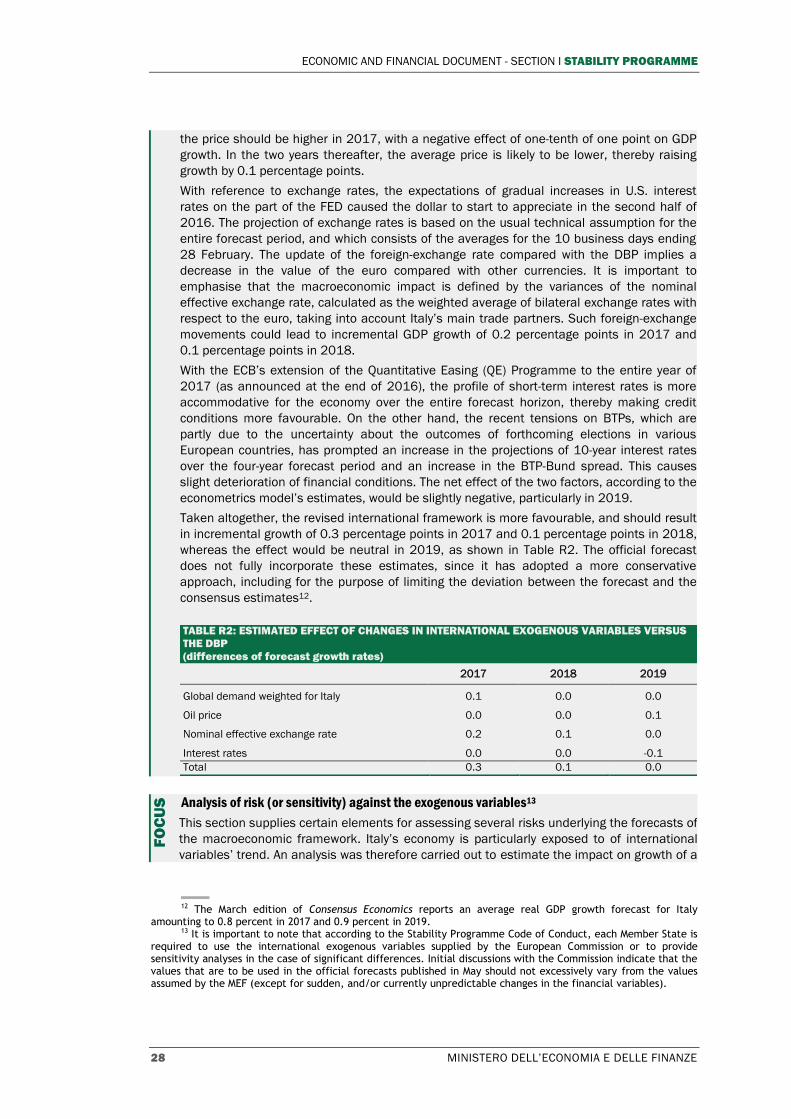
ECONOMIC AND FINANCIAL DOCUMENT - SECTION I STABILITY PROGRAMME
28 MINISTERO DELL’ECONOMIA E DELLE FINANZE
the price should be higher in 2017, with a negative effect of one-tenth of one point on GDP
growth. In the two years thereafter, the average price is likely to be lower, thereby raising
growth by 0.1 percentage points.
With reference to exchange rates, the expectations of gradual increases in U.S. interest
rates on the part of the FED caused the dollar to start to appreciate in the second half of
2016. The projection of exchange rates is based on the usual technical assumption for the
entire forecast period, and which consists of the averages for the 10 business days ending
28 February. The update of the foreign-exchange rate compared with the DBP implies a
decrease in the value of the euro compared with other currencies. It is important to
emphasise that the macroeconomic impact is defined by the variances of the nominal
effective exchange rate, calculated as the weighted average of bilateral exchange rates with
respect to the euro, taking into account Italy’s main trade partners. Such foreign-exchange
movements could lead to incremental GDP growth of 0.2 percentage points in 2017 and
0.1 percentage points in 2018.
With the ECB’s extension of the Quantitative Easing (QE) Programme to the entire year of
2017 (as announced at the end of 2016), the profile of short-term interest rates is more
accommodative for the economy over the entire forecast horizon, thereby making credit
conditions more favourable. On the other hand, the recent tensions on BTPs, which are
partly due to the uncertainty about the outcomes of forthcoming elections in various
European countries, has prompted an increase in the projections of 10-year interest rates
over the four-year forecast period and an increase in the BTP-Bund spread. This causes
slight deterioration of financial conditions. The net effect of the two factors, according to the
econometrics model’s estimates, would be slightly negative, particularly in 2019.
Taken altogether, the revised international framework is more favourable, and should result
in incremental growth of 0.3 percentage points in 2017 and 0.1 percentage points in 2018,
whereas the effect would be neutral in 2019, as shown in Table R2. The official forecast
does not fully incorporate these estimates, since it has adopted a more conservative
approach, including for the purpose of limiting the deviation between the forecast and the
consensus estimates12.
TABLE R2: ESTIMATED EFFECT OF CHANGES IN INTERNATIONAL EXOGENOUS VARIABLES VERSUS
THE DBP
(differences of forecast growth rates)
2017 2018 2019
Global demand weighted for Italy 0.1 0.0 0.0
Oil price 0.0 0.0 0.1
Nominal effective exchange rate 0.2 0.1 0.0
Interest rates 0.0 0.0 -0.1
Total 0.3 0.1 0.0
Analysis of risk (or sensitivity) against the exogenous variables13
This section supplies certain elements for assessing several risks underlying the forecasts of
the macroeconomic framework. Italy’s economy is particularly exposed to of international
variables’ trend. An analysis was therefore carried out to estimate the impact on growth of a
12 The March edition of Consensus Economics reports an average real GDP growth forecast for Italy
amounting to 0.8 percent in 2017 and 0.9 percent in 2019. 13 It is important to note that according to the Stability Programme Code of Conduct, each Member State is
required to use the international exogenous variables supplied by the European Commission or to provide sensitivity analyses in the case of significant differences. Initial discussions with the Commission indicate that the values that are to be used in the official forecasts published in May should not excessively vary from the values assumed by the MEF (except for sudden, and/or currently unpredictable changes in the financial variables).
FO
CU
S

II. MACROECONOMIC FRAMEWORK
MINISTERO DELL’ECONOMIA E DELLE FINANZE 29
different profile of key exogenous variables vis-à-vis that projected for the scenario at
unchanged legislation. This analysis does not provide complete alternatives scenarios that
are consistent with one another; it instead analyses the sensitivity of one variable at a time.
The first two simulations respectively refer to global demand and the nominal effective
exchange rate for Italy. The assumption is lower growth of international trade weighted for
Italy, with a reduction of 0.5 percentage points in 2017 and 1.0 percentage point in 2018
and in 2019; the trade growth rates move back to those in the scenario at unchanged
legislation only as of 2020. The negative impact would be a maximum of 0.2 percentage
points (in 2018 and 2019). The simulation partly reflects the effects of possible
intensification of protectionist measures (duties and quotas) that would directly cause a
decrease in world trade. There are, however, other channels – for example, a downturn in
consumer and/or business confidence – not directly captured by the world trade variable; a
more adverse scenario would lead to more negative estimates of GDP14.
For exchange rates, the technical assumption incorporated into the scenario at unchanged
legislation (exchange rates at constant levels)15 is abandoned, and instead, the analysis
uses the rates provided between the U.S. dollar and leading currencies, based on covered
interest-rate parity. According to this forecast method, the financial markets would
incorporate appreciation of the euro and a change in the overall nominal effective exchange
rate of 5.7 percent in the 2018-2020 three-year period. The effects indicated in the table
are significant; GDP growth would be adversely affected by an amount possibly exceeding
0.5 percentage points. However, the appreciation of the euro built into this model would
occur with respect to almost all other currencies, and would produce a growing change over
time. This sort of situation occurs extremely rarely; in addition, this method does not
normally supply any appreciable results in terms of forecasting performance.
For the oil price, the forecast based on crude oil futures used in the scenario at unchanged
legislation is replaced by an assumption that prices increase rapidly and permanently by
US$20 per barrel starting in 2018. Normally this occurs in relation to supply shocks. In such
case, the growth would be lower, with the biggest contraction of 0.3 percentage points in
2019.
Finally, it is assumed that bank interest rates fall more rapidly, favoured by less financial
fragmentation, which would have a favourable impact on GDP, since it would fuel
consumption and investments. This effect would also counter the upward pressure on rates
caused by the ECB’s gradual unwinding of expansionist policy.
EFFECTS ON GDP OF DIFFERENT ASSUMPTIONS ABOUT INTERNATIONAL EXOGENOUS VARIABLES (impact on growth rates)
2016 2017 2018 2019 2020
1. Global demand weighted for Italy 0.0 -0.1 -0.2 -0.2 0.0
2. Assumption on nominal effective exchange rate 0.0 0.0 -0.3 -0.7 -0.6
3. Assumption on oil price 0.0 0.0 -0.2 -0.3 -0.1
4. More favourable financial conditions 0.0 0.0 0.1 0.2 0.2
14 A recent simulation produced by Oxford Economics with the global model added to the reduction of the
flows of goods, various adverse effects on confidence, the reduction of the labour supply for some countries (linked to the block on immigration) and the consequent response of monetary policies; the latter would generate an appreciation of the euro compared with the baseline scenario. The reduction of GDP growth for Italy is more immediate and of a greater magnitude, moving beyond 0.4 percentage points in both 2017 and 2018.
15 Equal to an observed average for the final 10 business days.

ECONOMIC AND FINANCIAL DOCUMENT - SECTION I STABILITY PROGRAMME
30 MINISTERO DELL’ECONOMIA E DELLE FINANZE
Policy scenario
In the policy scenario, real GDP grows by 1.1 percent in 2017, in line with the
scenario at unchanged legislation, after considering the timing and mix of the
budget package. The forecast for the three-year period thereafter takes into
account of the fiscal-policy orientation. The policy scenario reflects a lower
weight of indirect taxes compared with the scenario at unchanged legislation and,
as a result, a more limited increase in consumer prices on average. Measures to
offset the decrease in indirect taxes, including spending cuts and the reduction of
tax evasion, are designed to ensure the pursuit of the public finance objectives.
In the 2018-2020 three-year period, and particularly in 2018, inflation is
slightly lower in the policy scenario, with a consequent increase of the purchasing
power of households. Also worth noting is a higher increase in employment linked
to a selective reduction of the tax wedge on labour.
GDP is set to grow by 1.0 percent in 2018 and in 2019, and 1.1 percent in
2020. In this final year, the growth is aligned to that in the scenario at unchanged
legislation since the additional forecast reduction of the deficit is insignificant.
TABLE II.2: BASE ASSUMPTIONS
2016 2017 2018 2019 2020
Short-term interest rate (1) n.a. -0.15 0.46 1.16 1.84
Long-term interest rate (1) 1.40 2.28 2.98 3.33 3.63
USD/EUR exchange rate 1.107 1.060 1.060 1.060 1.060
Change in nominal effective exchange rate 1.1 -0.9 0.0 0.0 0.0
World GDP, excluding EU 3.4 3.6 3.8 3.6 3.5
EU GDP 1.9 1.7 1.5 1.5 1.5
Global demand weighted for Italy 3.3 4.1 3.5 3.7 3.7
World imports volumes, excluding EU 2.2 3.2 3.4 4.2 4.1
Oil price (Brent, USD/barrel) 49.0 54.4 53.8 53.4 53.6
(1) Short-term interest rate: the average of the forecast rates on 3-month government securities issued during the
year. Long-term interest rate: the average of the forecast rates on 10-year government securities issued during the
year.

II. MACROECONOMIC FRAMEWORK
MINISTERO DELL’ECONOMIA E DELLE FINANZE 31
TABLE II.3A: MACROECONOMIC PROSPECTS
2016 2016 2017 2018 2019 2020
Level (1) % change
Real GDP 1,568,691 0.9 1.1 1.0 1.0 1.1
Nominal GDP 1,672,438 1.6 2.3 2.7 3.0 2.8
COMPONENTS
Private consumption (2) 946,487 1.4 0.9 0.6 0.7 0.7
Public expenditure (3) 313,732 0.6 0.2 0.1 0.1 0.7
Gross fixed investment 271,663 2.9 3.6 3.0 2.7 3.2
Inventories (% of GDP)
-0.5 0.0 0.0 0.0 0.1
Exports of goods and services 480,967 2.4 3.7 3.2 3.5 3.5
Imports of goods and services 446,245 2.9 4.4 2.9 3.4 4.1
CONTRIBUTIONS TO REAL GDP GROWTH
Domestic demand - 1.4 1.2 0.9 1.0 1.1
Change in inventories - -0.5 0.0 0.0 0.0 0.1
Net exports - -0.1 -0.1 0.1 0.1 -0.1
(1) In € mn.
(2) Expenditure for final consumption of households and NPISH.
(3) Public administration.
Note: Discrepancies, if any, are due to rounding.
TABLE II.3B: PRICES
2016 2016 2017 2018 2019 2020
Level (1) % change
GDP deflator 106.6 0.8 1.2 1.7 1.9 1.7
Private consumption deflator 107.1 0.0 1.2 1.7 2.1 1.8
HICP 99.9 -0.1 1.2 1.7 2.1 1.8
Public consumption deflator 100.7 0.7 0.8 0.0 0.1 0.0
Investment deflator 104.7 -0.1 2.1 2.0 2.2 2.3
Export deflator 104.3 -0.9 1.7 2.1 1.9 2.0
Import deflator 99.4 -3.4 2.5 1.5 1.6 1.6
TABLE II.3C: LABOUR MARKET
2016 2016 2017 2018 2019 2020
Level (1) % change
Employment (national accounts) 24,814 1.3 0.6 0.8 0.8 0.7
Employment, hours worked 42,923,848 1.7 0.8 0.9 0.9 0.7
Unemployment rate
11.7 11.5 11.1 10.5 10.0
Labour productivity on employment 63,217 -0.4 0.4 0.3 0.2 0.2
Labour productivity on hours worked 36.5 -0.8 0.3 0.2 0.1 0.1
Compensation of employees 667,283 2.4 2.1 2.4 2.5 2.4
Compensation per employee 40,022 0.3 1.0 1.2 1.5 1.5
(1) Units of measure: thousands for the number of employed (national accounts) and number of hours worked;
labour productivity in euros at constant values; total compensation of employees in millions of euros;
compensation per employee in euros.
TABLE II.3D: SECTOR ACCOUNTS
% of GDP 2016 2017 2018 2019 2020
Net lending/borrowing with the rest of the world 2.5 2.2 2.5 2.7 2.8
Balance of goods and services 3.5 3.1 3.5 3.7 3,7
Balance of primary income and transfers -0.9 -0.8 -0.8 -0.8 -0,8
Capital account -0.1 -0.1 -0.1 -0.1 -0,1
Borrowing/surplus of the private sector 4.9 4.3 3.7 2.9 2.8
Borrowing/surplus of the public administrations -2.4 -2.1 -1.2 -0.2 0.0

MINISTERO DELL’ECONOMIA E DELLE FINANZE 33
III. NET BORROWING AND PUBLIC DEBT
III.1 FINAL DATA AND FORECASTS AT UNCHANGED LEGISLATION
According to the provisional estimates published by ISTAT on 4 April, the ratio
between general government net borrowing and GDP amounted to 2.4 percent for
2016, with an improvement of 0.3 percentage points compared with the result for
2015. This estimate indicates the achievement of the target set in the EFD Update
published last autumn.
In 2016, the general government net borrowing amounted to €40.8 billion,
with a reduction of almost €3.4 billion compared with 2015. The improvement is
attributable to both the decrease in interest expenditure (approximately €1.8
billion) that created budget margins, and a higher primary surplus (approximately
€1.6 billion).1
With the trend of prices continuing to approach deflation and the European
Central Bank’s accommodative monetary policy, interest rates on new issues of
government securities fell below 1 percent, and general government interest
expenditure decreased for the fourth consecutive year to total €66.3 billion. The
intensity of the reduction proved more limited than that for the 2013-2015 three-
year period, also due to a turnaround in the final months of 2016, when the
inflation rate moved back into positive territory. The ratio of interest expenditure
to GDP descended from 4.1 percent in 2015 to 4.0 percent, remaining in line with
the forecasts prepared in September and in the previous EFD.
The primary surplus-to-GDP ratio amounted to 1.5 percent for 2016, in line
with the expectations and stabile compared with the result for 2015. The latter
figure has been revised to 1.5 percent of GDP from the 1.4 percent published on 1
March. The primary surplus achieved in 2016 allowed for holding down the
increase in the debt-to-GDP ratio, with such increase being 0.2 percentage points
less than the pre-established target.
According to European Commission data, the level of Italy’s primary surplus
for 2016 was one of the best in the Europe, thereby reinforcing Italy’s position
with respect to other European countries burdened by a high public debt, all of
which reported primary deficits. The primary surplus for the Euro Area for 2016
amounted to 0.5 percent of GDP, whereas that for the European Union was 0.3
percent. For the 2010-2016 period, Italy reported a ratio between primary surplus
and GDP amounting to approximately 1.4 percent, which was among the highest in
the Euro Area.2
1 Compared with the reporting to Eurostat at the end of September 2016, the extraordinary revisions of the
historical series made by ISTAT increased net borrowing for 2015 from 2.6 percent to 2.7 percent, whereas the estimate for 2014 was left unchanged, at 3.0 percent of GDP.
2 AMECO data.
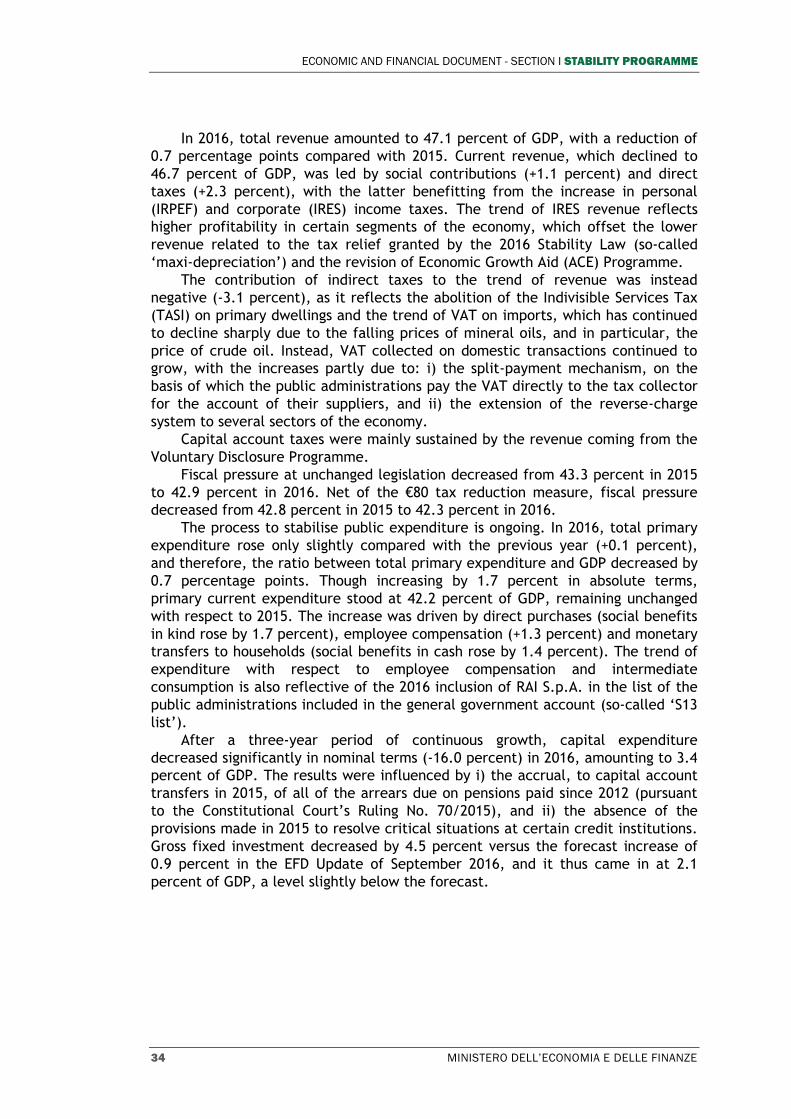
ECONOMIC AND FINANCIAL DOCUMENT - SECTION I STABILITY PROGRAMME
34 MINISTERO DELL’ECONOMIA E DELLE FINANZE
In 2016, total revenue amounted to 47.1 percent of GDP, with a reduction of
0.7 percentage points compared with 2015. Current revenue, which declined to
46.7 percent of GDP, was led by social contributions (+1.1 percent) and direct
taxes (+2.3 percent), with the latter benefitting from the increase in personal
(IRPEF) and corporate (IRES) income taxes. The trend of IRES revenue reflects
higher profitability in certain segments of the economy, which offset the lower
revenue related to the tax relief granted by the 2016 Stability Law (so-called
‘maxi-depreciation’) and the revision of Economic Growth Aid (ACE) Programme.
The contribution of indirect taxes to the trend of revenue was instead
negative (-3.1 percent), as it reflects the abolition of the Indivisible Services Tax
(TASI) on primary dwellings and the trend of VAT on imports, which has continued
to decline sharply due to the falling prices of mineral oils, and in particular, the
price of crude oil. Instead, VAT collected on domestic transactions continued to
grow, with the increases partly due to: i) the split-payment mechanism, on the
basis of which the public administrations pay the VAT directly to the tax collector
for the account of their suppliers, and ii) the extension of the reverse-charge
system to several sectors of the economy.
Capital account taxes were mainly sustained by the revenue coming from the
Voluntary Disclosure Programme.
Fiscal pressure at unchanged legislation decreased from 43.3 percent in 2015
to 42.9 percent in 2016. Net of the €80 tax reduction measure, fiscal pressure
decreased from 42.8 percent in 2015 to 42.3 percent in 2016.
The process to stabilise public expenditure is ongoing. In 2016, total primary
expenditure rose only slightly compared with the previous year (+0.1 percent),
and therefore, the ratio between total primary expenditure and GDP decreased by
0.7 percentage points. Though increasing by 1.7 percent in absolute terms,
primary current expenditure stood at 42.2 percent of GDP, remaining unchanged
with respect to 2015. The increase was driven by direct purchases (social benefits
in kind rose by 1.7 percent), employee compensation (+1.3 percent) and monetary
transfers to households (social benefits in cash rose by 1.4 percent). The trend of
expenditure with respect to employee compensation and intermediate
consumption is also reflective of the 2016 inclusion of RAI S.p.A. in the list of the
public administrations included in the general government account (so-called ‘S13
list’).
After a three-year period of continuous growth, capital expenditure
decreased significantly in nominal terms (-16.0 percent) in 2016, amounting to 3.4
percent of GDP. The results were influenced by i) the accrual, to capital account
transfers in 2015, of all of the arrears due on pensions paid since 2012 (pursuant
to the Constitutional Court’s Ruling No. 70/2015), and ii) the absence of the
provisions made in 2015 to resolve critical situations at certain credit institutions.
Gross fixed investment decreased by 4.5 percent versus the forecast increase of
0.9 percent in the EFD Update of September 2016, and it thus came in at 2.1
percent of GDP, a level slightly below the forecast.

III. NET BORROWING AND PUBLIC DEBT
MINISTERO DELL’ECONOMIA E DELLE FINANZE 35
TABLE III.1: GENERAL GOVERNMENT BUDGETARY PROSPECTS (1)
2016 2017 2018 2019 2020
Level (2) % of GDP % of GDP
Net borrowing by sector
1. General government -40,809 -2.4
-2.1 -1.2 -0.2 0.0
Difference: policy scenario vs scenario at
unchanged legislation (3) 0.2 0.1 0.4 0.5
2. Central government -46,831 -2.8 -2.6 -1.5 -0.8 -0.6
3. State
4. Local government 4,233 0.3 0.2 0.1 0.1 0.1
5. Social security funds 1,789 0.1 0.1 0.1 0.1 0.1
General government
6. Total revenue 788,502 47.1
46.8 47.0 47.0 46.5
7. Total expenditure 829,311 49.6 49.1 48.3 47.6 47.0
8. Net borrowing -40,809 -2.4 -2.3 -1.3 -0.6 -0.5
9. Interest expenditure 66,272 4.0 3.9 3.7 3.7 3.8
10. Primary surplus 25,463 1.5 1.5 2.4 3.1 3.4
11. One-off measures (4) 3,193 0.2 0.3 0.1 0.0 0.0
Selected components of revenue
12. Total taxes 495,848 29.6
29.2 29.5 29.5 29.1
12a. Indirect taxes 242,199 14.5 14.5 15.5 15.5 15.4
12b. Direct taxes 248,450 14.9 14.6 14.0 13.9 13.7
12c. Capital taxes 5,199 0.3 0.2 0.1 0.1 0.1
13. Social contributions 221,440 13.2 13.1 13.2 13.4 13.3
14. Property income 11,510 0.7 0.6 0.6 0.5 0.5
15. Other revenue 59,704 3.6 3.8 3.6 3.6 3.6
15.a Other current revenue 58,263 3.5 3.5 3.5 3.4 3.4
15.b Other capital revenue 1,441 0.1 0.3 0.2 0.2 0.2
16. Total revenue 788,502 47.1 46.8 47.0 47.0 46.5
Memo item: Fiscal pressure 42.9 42.3 42.8 42.8 42.4
Memo item: Fiscal pressure net of €80 tax
reduction measure 42.3 41.8 42.2 42.3 41.9
Selected components of expenditure
17. Employee compensation + Intermediate
consumption 255,150 15.3
15.1 14.6 14.3 14.0
17a. Employee compensation 164,084 9.8 9.8 9.4 9.2 9.0
17b. Intermediate consumption 91,066 5.4 5.4 5.2 5.1 5.1
18. Total social transfers 382,025 22.8 22.8 22.6 22.5 22.4
Incl.: unemployment benefits 14,628 0.9 0.9 0.9 0.8 0.8
18a. Social transfers in kind 44,511 2.7 2.6 2.5 2.5 2.4
18b. Social benefits other than in kind 337,514 20.2 20.2 20.1 20.0 20.0
19. Interest expenditure 66,272 4.0 3.9 3.7 3.7 3.8
20. Production subsidies 30,605 1.8 1.7 1.6 1.5 1.5
21. Gross fixed investment 35,048 2.1 2.1 2.2 2.1 2.0
22. Capital transfers 21,613 1.3 1.2 1.3 1.2 1.1
23. Other expenditure 38,598 2.3 2.3 2.2 2.2 2.2
24. Total expenditure 829,311 49.6 49.1 48.3 47.6 47.0
Primary current expenditure 705,701 42.2 41.9 41.1 40.5 40.1
Total primary expenditure 763,039 45.6 45.2 44.6 43.9 43.1
1) The first line of the table shows the policy-scenario targets; the remaining figures show estimates at unchanged legislation. Discrepancies, if any, are due to rounding.
2) Figures in millions.
3) The difference quantifies the forecast combined effect of the April 2017 budget package and the future 2018 Budget Law.
4) The plus sign indicates one-off measures to reduce the deficit.

ECONOMIC AND FINANCIAL DOCUMENT - SECTION I STABILITY PROGRAMME
36 MINISTERO DELL’ECONOMIA E DELLE FINANZE
For 2017, the estimates at unchanged legislation put the net borrowing at 2.3
percent of GDP, with an improvement of approximately 0.1 percentage points
compared with 2016. A significant improvement in such balance is projected for
the later years, with a deficit of 0.5 percent of GDP forecast for 2020. Such trend
is basically the effect of the stronger primary surplus expected as from 2018.
Interest expenditure is projected to decrease to 3.9 percent of GDP in 2017 and
3.7 percent in 2018 and 2019, and then to rebound back again to reach 3.8
percent of GDP in 2020. The upward revision of interest expenditure compared
with the previous forecasts (+0.3 percentage points of GDP in 2019 compared with
the October 2016 forecast) reflects the expectation of higher interest rates. The
primary surplus should remain stable at 1.5 percent of GDP in 2017, and then
steadily rise to 2.4 percent in 2018, 3.1 percent in 2019 and 3.4 percent in 2020,
partially based on forecasts of stronger growth of the economy.
The increase of tax revenue at unchanged legislation is driven by indirect
taxes, for the effect of the implementation of clauses to safeguard the public
finances (as provided by previous legislation); such clauses will entail increases in
VAT rates and excise taxes on mineral oils as from 2018, in the absence of any
revenue or expenditure measures to cover the planned revenue increase. The new
measures to combat tax evasion and to reform tax collection (including the
programme providing for discounted early settlement of tax debts) as contained in
the 2017 Budget Law and in the fiscal decree-law3 will expand the taxable base
for value-added taxes, and will contribute to changing the mix of revenue, with a
heavier weighting of indirect taxes. The ratio of indirect taxes to GDP should grow
from 14.5 percent in 2017 to 15.4 percent at the end of the forecast period, while
the ratio of direct taxes to GDP is projected to decrease from 14.6 percent in 2017
to 13.7 percent in 2020. The decrease in capital taxes in the years of 2017 and
2018 is due, inter alia, to the ongoing reduction of one-off revenue from the
Voluntary Disclosure Programme.
Social contributions are estimated to grow by 1.4 percent in 2017, while the
growth in 2018 and in 2019 will be stronger: 3.7 percent and 3.8 percent,
respectively. This forecast reflects the trend of employee compensation, the
trend of employment underlying the forecasts of the macroeconomic framework,
and the abolition of measures that reduce social contributions for new hires. In
terms of GDP, social contributions go from 13.1 percent in 2017 to 13.3 percent in
2020.
Overall fiscal pressure is expected to decrease by 0.6 percentage points in
2017, to total 42.3 percent of GDP. The aggregate should then increase to 42.8
percent in 2018 and 2019, before sliding back to 42.4 percent at the end of the
forecast period.
The forecasts at unchanged legislation contemplate a decrease in the ratio of
total primary expenditure to GDP, from 45.2 percent in 2017 to 43.1 percent in
2020. The downward trend is expected to be driven by primary current
expenditure, which is forecast to go from 41.9 percent of GDP in 2017 to 40.1
percent of GDP in 2020. Employee compensation and intermediate consumption
are respectively projected to fall to 9.0 percent and 5.1 percent of GDP in 2020.
3 Decree-Law No. 193/2016, converted by Law No. 225/2016.

III. NET BORROWING AND PUBLIC DEBT
MINISTERO DELL’ECONOMIA E DELLE FINANZE 37
The trend of gross fixed investment in the next few years indicates a recovery
of spending, with growth of nearly 2.8 percent in 2017 moving up to 6.5 percent in
2018. The estimates include the expansionist measures enacted with the 2017
Budget Law for the design and construction of infrastructure and the securing of
the territory in the aftermath of the recent earthquakes. The decrease in 2020 is
due to the phase-out, at unchanged legislation, of the support measures provided
in prior years.
In the European Commission’s Winter Forecast published in February 2017,
the net borrowing to GDP was estimated at 2.3 percent in 2016, whereas the
preliminary 2016 data reported by ISTAT at the end of March put the ratio at 2.4
percent of GDP. The Commission’s estimate of the 2017 deficit is 2.4 percent,
while the updating of the projections in this document has put the ratio at a
slightly lower 2.3 percent of GDP. In 2018, according to the Commission’s
estimates at unchanged policies, the deficit should rise to 2.6 percent of GDP,
since the Commission has not considered the incremental revenue to be derived
from the implementation of the clauses regarding VAT and excise taxes.4
Investment clause
The inclusion of public investments in the budget flexibility provided by the Stability and
Growth Pact for structural reforms is aimed at providing incentives for governments to
spend money on projects that foster structural reforms, thereby reinforcing long-term growth
and thus, the sustainability of the public finances.
The applicability of the investment clause was clarified in 2015,5 starting with the
Commission’s communication on 13 January 2015,6 by including all projects co-financed by
European Structural and Investment Funds (ESI Funds).7 In line with the European
orientation of employment policies and with the implementation of the Europe 2020
Strategy, the investment clause also includes the following co-financed projects: Youth
Employment Initiative (YEI) and the European Fund for Strategic Investment (EFSI), the latter
of which is part of the Investment Plan launched in Europe. The use of the investment
clause is allowed on the condition that European co-financing does not substitute for
nationally funded investments, so that – under the assumption that the EU share remains
constant - total public investments do not diminish during the year in which the country
makes use of the flexibility. Compliance with this requirement is subject to an ex-post
evaluation by the European Commission, conducted in the year subsequent to the
implementation of the clause on the basis of final data, so as to confirm the ex-ante
evaluation made against the forecasts.
The definition of the expenditure item to be considered for the purposes of the evaluation is
quite important. The aggregate of gross fixed investment (with available data indicating a
4.5 percent reduction in 2016 compared with the previous year) is not completely
representative of the public sector’s investment policy for three main reasons. First, the
privatisation policy of past years has confirmed that, in the case of many public utility
services, the State has sold ownership of the activity, thereby taking on the role of market
regulator. Investments of public interest are currently made by disbursing subsidies to
businesses, which, according to the ESA criteria, are booked as investment subsidies. This
category includes, for example, the subsidies recently paid to businesses developing the
4 The comparison of the estimates at unchanged legislation in this EFD with the Commission’s latest
estimates was done in compliance with EU Directive No. 85/2011. 5 Common position approved by the ECOFIN Council in February 2016. 6 European Commission communication ‘Making the best use of the flexibility within the existing rules of
the Stability and Growth Pact’ of 13 January 2015. 7 Funds listed in Regulation No. 1303/2013.
FO
CU
S

ECONOMIC AND FINANCIAL DOCUMENT - SECTION I STABILITY PROGRAMME
38 MINISTERO DELL’ECONOMIA E DELLE FINANZE
ultra-broadband and the upgrading of the national railway network being done by RFI S.p.A.
supported by the Connecting Europe Facility (CEF). Accordingly, an accurate valuation of the
national commitment to investment also needs to include investment subsidies to
businesses.
Second, the expenditure for gross fixed investment also includes expenditure financed with
European resources, which, as known, is subject to significant fluctuations, depending on
the multiple-year phases of the planning cycle and the implementation of the co-financed
programmes. In order to properly analyse the trend of the national financial commitment,
the share financed by the EU needs to be eliminated from the data.
Considering these factors, and adopting, therefore, a definition of public investment
consistent with the purposes of the investment clause, the reference amount for 2016 is
slightly higher than the level reported for 2015, and, therefore, it is in line with the European
rule (Table R.1).
TABLE R.1: GENERAL GOVERNMENT EXPENDITURE FOR INVESTMENTS AND INVESTMENT SUBSI-
DIES, NET OF EU PORTION (in € mn)
2014 2015 2016
Gross fixed investment, net of real estate dismissal (a)
38,046 37,629 35,831
Investment subsidies to businesses (b) 10,978 13,489 12,959
EU share (c) 3,790 3,062 300
Total (a+b-c) 45,234 48,056 48,490
In addition, it is noted that gross fixed investment does not include certain important
expenditures, which are eligible for the purposes of the investment clause and can be
considered as investments according to an economic interpretation (soft infrastructure).
Among such expenditures are those for projects targeted to social cohesion, regional
development, rural development, and the maritime sector.
Given the reasons set out above, the Italian government believes that the requisites set by
the investment clause (as already verified upon presentation of the request for the
invocation of the flexibility contained in the 2016 Draft Budgetary Plan, and in the
documents thereafter) continue to be satisfied.
The projects realised in 2016 through use of the budget leeway granted by the European
Commission were related to areas associated with those affected by the implementation of
structural reforms, so as to capitalise on the synergies between reforms and budget policy,
to make a significant impact on growth potential, and to tackle ongoing imbalances, on a
basis consistent with the Commission’s recommendations about the proper use of the
flexibility clauses.
National expenditure on projects co-financed by the European Union and realised in 2016
was approximately €3.5 billion, or roughly 0.2 percent of GDP. An important portion of the
resources made available under the clause was used for projects sustained by the
European Regional Development Fund (ERDF) for the expansion of research and
technological development, the competitiveness of SMEs, the enhancement of sustainable
transportation and energy efficiency systems, and the implementation of the digital agenda.
The projects co-financed by the European Agricultural Fund for Rural Development (EAFRD)
and European Maritime and Fisheries Fund (EMFF) were carried out in synergy with the
other sources of financing and contributed to supporting SMEs competitiveness in the two
specific sectors of reference. The improvement of the business operating environment and
the development of the digital economy will constitute the driving force for productivity,
innovation and growth for all of sectors of the economy, while the Commission’s recent
guidelines suggest that energy efficiency will facilitate the transition to a competitive and
sustainable economy.

III. NET BORROWING AND PUBLIC DEBT
MINISTERO DELL’ECONOMIA E DELLE FINANZE 39
TABLE R.2: NATIONAL EXPENDITURE IN 2016 (in € mn)
ERDF (1) ESF YEI EAFRD EMFF CEF (2) Total
National expenditure 1,497 263 115 587 15 1,021 3,498
% of GDP 0.1 0.0 0.0 0.0 0.0 0.1 0.2
1) Part of the expenditure sustained in 2016 (approximately €1 billion) regards the completion, with
national resources, of the projects co-financed by the ERDF in the 2007-2013 period.
2) Includes approximately €700 million of expenditure related to projects approved for the financing of the
CEF, but not co-financed as a result of the lack of EU budget resources. The amount does not include the
additional expenditure in relation to the Trans-European Network (TEN) projects, approximately €1.1 billion
that Italy intends to request in 2017.
A high priority has been placed on i) the projects designed to promote sustainable
employment, social inclusion, education and training, which are supported by the European
Social Fund (ESF), and ii) initiatives to favour the employment of young people, through the
implementation of projects as part of the Youth Employment Initiative. The projects realised
are aimed at upgrading human capital resources alongside the reforms implemented in the
labour market and the education system; the projects embrace measures for supporting the
participation rates to the labour market, employment and labour mobility, investments in
education and professional training (including life-long learning) and measures to prevent
social exclusion.
A significant portion of the expenditure regarded projects associated with the Connecting
Europe Facility (CEF). These projects have strengthened certain railway axes and strategic
links along the trans-European corridors, and have financed works and studies to increase
the levels of airport security and to transform freight terminals into smart hubs. All of the
projects considered for the purposes of the investment clause have been positively
evaluated by the Commission by virtue of their recognised strategic relevance for the entire
European Union. The realisation of the projects has mostly entailed higher capital transfers
to companies (such as RFI) external to the public administration that are responsible for the
execution of the works.
Taken altogether, the national expenditure that falls within the investment clause is equal to
0.2 percentage points of GDP, versus a temporary deviation granted by the Council to Italy
equalling 0.25 percentage points of GDP,8 corresponding to an expenditure target of
approximately €4.2 billion.
The partial realisation of the expenditure target is due to various factors. In general, the mid-
2016 revision of the rules applicable to public tenders may have affected the performance
of public investments, as a result of the normal delays involved in transitioning to a new
system, whose impact was difficult to quantify at the time when Italy requested the
flexibility. Moreover, a legislative decree amending the new rules has recently been drafted.
8 Specific recommendations about the Stability Programme and National Reforms Programme on 12 July
2016.
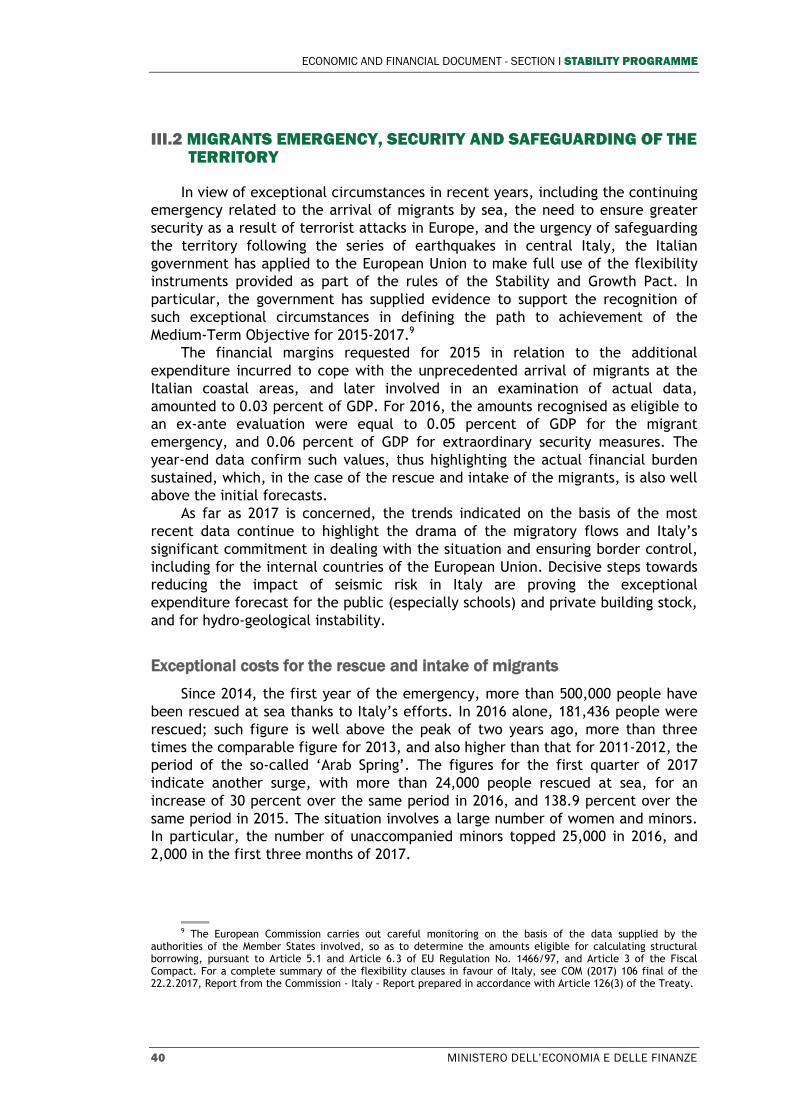
ECONOMIC AND FINANCIAL DOCUMENT - SECTION I STABILITY PROGRAMME
40 MINISTERO DELL’ECONOMIA E DELLE FINANZE
III.2 MIGRANTS EMERGENCY, SECURITY AND SAFEGUARDING OF THE TERRITORY
In view of exceptional circumstances in recent years, including the continuing
emergency related to the arrival of migrants by sea, the need to ensure greater
security as a result of terrorist attacks in Europe, and the urgency of safeguarding
the territory following the series of earthquakes in central Italy, the Italian
government has applied to the European Union to make full use of the flexibility
instruments provided as part of the rules of the Stability and Growth Pact. In
particular, the government has supplied evidence to support the recognition of
such exceptional circumstances in defining the path to achievement of the
Medium-Term Objective for 2015-2017.9
The financial margins requested for 2015 in relation to the additional
expenditure incurred to cope with the unprecedented arrival of migrants at the
Italian coastal areas, and later involved in an examination of actual data,
amounted to 0.03 percent of GDP. For 2016, the amounts recognised as eligible to
an ex-ante evaluation were equal to 0.05 percent of GDP for the migrant
emergency, and 0.06 percent of GDP for extraordinary security measures. The
year-end data confirm such values, thus highlighting the actual financial burden
sustained, which, in the case of the rescue and intake of the migrants, is also well
above the initial forecasts.
As far as 2017 is concerned, the trends indicated on the basis of the most
recent data continue to highlight the drama of the migratory flows and Italy’s
significant commitment in dealing with the situation and ensuring border control,
including for the internal countries of the European Union. Decisive steps towards
reducing the impact of seismic risk in Italy are proving the exceptional
expenditure forecast for the public (especially schools) and private building stock,
and for hydro-geological instability.
Exceptional costs for the rescue and intake of migrants
Since 2014, the first year of the emergency, more than 500,000 people have
been rescued at sea thanks to Italy’s efforts. In 2016 alone, 181,436 people were
rescued; such figure is well above the peak of two years ago, more than three
times the comparable figure for 2013, and also higher than that for 2011-2012, the
period of the so-called ‘Arab Spring’. The figures for the first quarter of 2017
indicate another surge, with more than 24,000 people rescued at sea, for an
increase of 30 percent over the same period in 2016, and 138.9 percent over the
same period in 2015. The situation involves a large number of women and minors.
In particular, the number of unaccompanied minors topped 25,000 in 2016, and
2,000 in the first three months of 2017.
9 The European Commission carries out careful monitoring on the basis of the data supplied by the
authorities of the Member States involved, so as to determine the amounts eligible for calculating structural borrowing, pursuant to Article 5.1 and Article 6.3 of EU Regulation No. 1466/97, and Article 3 of the Fiscal Compact. For a complete summary of the flexibility clauses in favour of Italy, see COM (2017) 106 final of the 22.2.2017, Report from the Commission - Italy - Report prepared in accordance with Article 126(3) of the Treaty.

III. NET BORROWING AND PUBLIC DEBT
MINISTERO DELL’ECONOMIA E DELLE FINANZE 41
The current crisis reflects the difficulties arising from the ongoing conflicts in
the eastern Mediterranean area, insufficient border controls in Libya, and a
growing number of people fleeing from hostile environmental conditions linked to
climate change. The situation has created unprecedented pressure on the
European Union’s external borders, which is generating political and social
tensions that are difficult to control.
FIGURE III.1: NUMBER OF MIGRANTS RESCUED AT SEA: 1991-2016
Source: Port Authorities and Interior Ministry.
FIGURE III.2: NUMBER OF MIGRANTS RESCUED AT SEA: QUARTERLY DATA FOR 2014-2017
Source: Port Authorities and Interior Ministry.
0
20,000
40,000
60,000
80,000
100,000
120,000
140,000
160,000
180,000
200,000
19
91
19
92
19
93
19
94
19
95
19
96
19
97
19
98
19
99
20
00
20
01
20
02
20
03
20
04
20
05
20
06
20
07
20
08
20
09
20
10
20
11
20
12
20
13
20
14
20
15
20
16
0
10,000
20,000
30,000
40,000
50,000
60,000
70,000
80,000
1Q 2Q 3Q 4Q
2014
2015
2016
2017

ECONOMIC AND FINANCIAL DOCUMENT - SECTION I STABILITY PROGRAMME
42 MINISTERO DELL’ECONOMIA E DELLE FINANZE
A common response of Europe is desirable and necessary with regard to the
asylum system,10 the protection of human rights, and the management of external
borders. This position was argued by the Italian government in the document
entitled ‘A Shared European Policy Strategy for Growth, Jobs and Stability’
published in February 2016.11 During its meeting in October 2016, the European
Council actually agreed about the emergency nature of the flows and the need to
prevent clandestine immigration along the rim of the central Mediterranean. The
Council also recognised ‘the significant contribution, including of a financial
nature, of the Member States on the front lines in recent years.’ In effect, the
management of the external borders is an issue of common responsibility. Italy is
playing a fundamental role in ensuring such management, and is making an
exceptional financial effort to fulfil humanitarian obligations on the part of the
European Union.
FIGURE III.3: MIGRANTS IN RECEPTION FACILITIES: 2013 - 2017
Legend: CPSA: Emergency healthcare and reception facilities; CDA: Reception facilities, CARA: Reception facilities
for asylum seekers; SPRAR: System of Protection for Asylum Seekers and Refugees. The SPRAR is made up of a
network of local entities supported by entities in the services sector. The network is involved in projects for the
integration of asylum seekers and refugees, and it makes use, with the limits available, of the National Fund for
Asylum Policies and Services, which is managed by the Interior Ministry. The SPRAR was created as a network of
secondary reception facilities at integrating into the social fabric the persons who already have some form of
international protection. As a result of the emergency in North Africa and the increase of migratory flows, the
SPRAR is now also involved in the initial acceptance of asylum seekers.
Source: Interior Ministry.
10 Currently governed by Regulation (EU) No. 604/2013 of 26 June 2013 – so-called Dublin III – that sets the
criteria for determining the Member State responsible for examining an application for international protection presented in one of the Member States by a citizen of a non-EU country, or by a stateless person.
11 http://www.governo.it/sites/governo.it/files/ASharedPolicyStrategy_20160222.pdf
35,499
76,683
137,218 137,855
9,592
7,394
14,694 13,385
20,975
19,715
23,822 23,867
22,118
820.0 1416.0
0
20,000
40,000
60,000
80,000
100,000
120,000
140,000
160,000
180,000
200,000
2013 2014 2015 2016 2017
(31 March)
hot spot
total
SPRAR
CARA/CDA E CPSA
temporary structures
820
Hotspot
1.416
Hotspot

III. NET BORROWING AND PUBLIC DEBT
MINISTERO DELL’ECONOMIA E DELLE FINANZE 43
The intensification of the arrivals is producing considerable pressure on Italy’s
capacity to take in migrants. The number of people housed at the various
reception facilities has risen from 22,000 in 2013 to 104,000 in 2015 and to
176,000 in 2016.12 Most of the refugees (approximately 77 percent) are housed in
provisional facilities, since there is very limited capacity at the centrally
managed, conventional facilities for asylum seekers and the locally managed
facilities for the System of Protection for Asylum Seekers and Refugees. The
applications for asylum have also risen significantly, numbering 123,000
applications in 2016. In the first two months of 2017, more than 24,000
applications were filed, for an increase of approximately 59 percent over the
same period of 2016.13
The implementation of the EU plans for the redistribution of the migrants14
has not yielded the expected outcomes. In this regard, Italy has been forced to
adopt other measures to alleviate the burden on local governments in areas with a
high density of immigrants. Italy introduced a new national ‘intake plan’ that aims
to achieve more equitable distribution of the migrants and the refugees across the
entire national territory (based on criteria of proportionality and sustainability).
For this purpose, a total of €100 million was appropriated in 2016 for the
municipalities that take in persons filing for international protection, with a
subsidy of up to €500 per person.15 As a sign of continuity with the commitments
taken at a European level, several hotspots have been activated to identify
migrants with the collaboration of officials from the European Asylum Support
Office (Easo), Frontex and Europol, and additional developments are in process or
planned, including mobile facilities at sea.16
In view of the drastic situation, in February 2017, the Council of Ministers
approved i) a decree-law that introduces urgent provisions on the subject,17 and
ii) a law, approved definitively by Parliament in March, containing measures for
the protection of unaccompanied foreign minors.
12 Source: Interior Ministry. 13 Source: Interior Ministry. 14 The EU plan for the redistribution of the migrants called for a total of 160,000 transfers from Greece and
Italy by September 2017, including 40,000 from Italy within the first year (and approximately 12,000 thereafter). As of 20 March 2017, only 4,438 asylum seekers had been transferred from Italy to other countries of the European Union (approximately 11 percent of the total), see
https://ec.europa.eu/home-affairs/sites/homeaffairs/files/what-we-do/policies/european-agenda-migration/press-material/docs/state_of_play_-_relocation_en.pdf and Interior Ministry.
15 Article 12, Decree-Law No. 193 of 2016. 16 The 1,600 existing hotspots are to be rounded out by another 1,950, including those under construction
in Messina and Palermo and those planned for Corigliano Calabro, Crotone and Reggio Calabria. Other initiatives are also planned in Sardinia.
17 Decree-Law No. 13 of 17 February 2017, ‘Urgent measures for acceleration of proceedings on the subject of international protection, and for combatting illegal immigration,’ which was definitively approved on 12 April 2017.

ECONOMIC AND FINANCIAL DOCUMENT - SECTION I STABILITY PROGRAMME
44 MINISTERO DELL’ECONOMIA E DELLE FINANZE
The measures adopted have provided, inter alia, for the following:
the creation within the legal system of sections specialised in the subjects of
immigration, international protection, and the unrestricted movement of the
citizens of the European Union; 18
the acceleration of administrative proceedings within territorial commissions
with respect to the recognition of international protection, and the related
legal recourse, with the employment of a new process model that aims to
reduce the duration of the proceedings;
more rapid procedures for identification and for the definition of the legal
position of citizens of non-EU countries, through the hotspots already
identified and the use of centres for initial intake;
the strengthening of deportation measures and of the network of
identification and deportation centres (now known as ‘repatriation centres’);
the promotion of initiatives for the integration and the employment, on a
voluntary basis, of the applicants for international protection, with respect to
activity carried out for social purposes in favour of local communities.
All of these circumstances indicate that the expenditure sustained for dealing
with the crisis, including based on the commitment undertaken in accordance with
European directives,19 cannot be evaluated only in terms of the year-on-year
increase, but it must be evaluated by considering that Italy is bearing a huge
burden in carrying out an activity for the account of the European Union by reason
of its front-line geographical position with respect to the external borders.
The pronounced increase in the number of migrants arriving and those
present at the end of 2016 is reflected in currently available data; these data are
the basis for an upward revision of the estimates presented in the Draft Budgetary
Plan.20 Based on the current data, Italy’s expenditure for the rescue operations,
healthcare, and lodging with respect to all migrants, plus the education of
unaccompanied minors, was €3.6 billion (0.22 percent of GDP), net of EU
subsidies, in 2016; based on the forecast of a stationary situation in 2017, the
comparable net expenditure will be €4.2 billion (0.25 percent of GDP). Should the
inflow of migrants continue to grow, the expenditure could rise to €4.6 billion
(0.27 percent of GDP) in 2017.21 The updating of the data presented includes a
18 The sections will have jurisdiction over: non-recognition of the right of stay in the national territory in
favour of EU citizens; contestation of the order for removal for reasons of public security with respect to EU citizens; recognition of international protection; non-issue, non-renewal or non-revocation of the permit of stay for humanitarian reasons; denial of the nulla osta to family reunification and the permit of stay for family reasons; and status check of stateless persons. In such disputes, the court’s ruling will be made by one judge.
19 Some of the new provisions are also aimed at closing out the infraction proceeding No. 2013/0276, currently pending a reasoned opinion pursuant to Article 258 of the Treaty on the Functioning of the European Union, initiated by the European Commission for the non-ratification of the Directive No. 2011/51/EU of the European Parliament and Council that amends Directive 2003/109/EU in relation to the status of citizens of non-EU countries who are long-term residents, for extending the sphere of application thereof to the beneficiaries of international protection.
20 In relation to 2017, a conditional provision equal to 0.14 percent of GDP was provided for the migrants emergency – equal to the total expenditure made in 2017, net of the amounts already recognised in 2015 and in 2016 - and another 0.18 percent of GDP was provided for the safeguarding of the territory.
21 The preliminary data for 2016 and the forecast data for 2017 are consistent with the forecasts prepared by international organisations: according to the IMF, the public-budget impact of the expenditure for migrants in Italy has been even greater, up to 0.24 percent of GDP in 2016 (see IMG (2016), The Refugee Surge in Europe: Economic Challenges https://www.imf.org/external/pubs/ft/sdn/2016/sdn1602.pdf).

III. NET BORROWING AND PUBLIC DEBT
MINISTERO DELL’ECONOMIA E DELLE FINANZE 45
revision of the entire historical series since 2011 for the component related to the
quantification of the EU subsidy, which is now valued based on the actual credit
by the EU budget in favour of Italy, instead of based on a provisional estimate.
TABLE III.2- ESTIMATE OF EXPENDITURE SUSTAINED FOR MIGRANTS CRISIS. YEARS: 2011 - 2017
2011 2012 2013 2014 2015
2016
DBP
Oct. 2015
2016
Report on
relevant
factors
Feb. 2017
2016
Preliminary
2017
DBP
Oct. 2016
2017
Updated
in € mn
Total: constant
scenario 840.0 920.1 1,324.9 2,030.4 2,665.6 3,430.6 3,542.9 3,719.3 3,914.1 4,304.0
Total: growth scenario - - - -
2,665.6 4,227.2 4,239.6
4,261.7
4,700.3
% of total
Sea rescue 29.6 27.0 41.6 37.0 29.0 25.4 24.6 18.5 20.8 18.8
Reception 36.4 39.9 34.8 38.6 50.3 58.3 59.6 66.5 64.9 68.2
Healthcare and
education 34.0 33.2 23.6 24.4 20.8 16.3 15.8 15.1 14.3 13.0
% of total
Current 95.3 93.2 78.2 83.2 90.5 87.7 88.6 94.3 90.0 90.9
Capital 4.7 6.8 21.8 16.8 9.5 12.3 11.4 5.7 10.0 9.1
in € mn
EU subsidies 56.0 90.7 78.8 70.3 106.6 112.1 112.1 120.8 87.0 91.0
Total net of the EU
subsidies: constant
scenario 784.0 829.3 1,246.1 1,960.1 2,559.0 3,318.5 3,430.8 3,598.5 3,827.1 4,213.0
% of GDP
Total, net of EU
subsidies 0.05 0.05 0.08 0.12 0.16 0.20 0.21 0.22 0.22 0.25
Diff. vis-à-vis t-1 0.00 0.00 0.03 0.04 0.04 0.04 0.05 0.06 0.03 0.05
Total, net of EU
subsidies: growth
scenario
4,115.1
4,174.6
4,609.3
% of GDP
Total, net of EU
subsidies
0.25 0.24 0.27
Note: The data do not include the expenditure related to the North African emergency, which was classified as such in 2011 and was
officially ended on 1 January 2013. The growth scenario considers the arrival of: another approximately 1,000 minors each year at an
average cost of €45 per day; another approximately 62,000 people at the government’s reception and temporary facilities, at an
average cost of €32.50 per day; and approximately 3,500 asylum seekers and refugees added to the protection system at an average
cost of €35 per day
Source: Analyses by MEF and State General Accounting Department.

ECONOMIC AND FINANCIAL DOCUMENT - SECTION I STABILITY PROGRAMME
46 MINISTERO DELL’ECONOMIA E DELLE FINANZE
Tables required for the purpose of using the migrants clause within the sphere of the Stability and Growth Pact
TABLE R.1 - IMPACT ON NET BORROWING BY FUNCTIONAL CATEGORY: 2011 - 2017 (in € mn)
2011 2012 2013 2014 2015
2016
preliminary
estimates
2017
updated
forecasts
1. Intake and initial assistance 232.5 258.4 390.0 749.9 1,255.6 2,328.0 2,759.1
2. Transport
(including rescue operations) 293.7 326.7 596.3 753.4 827.2 729.4 854.7
3. Healthcare assistance 74.6 86.5 137.7 207.8 243.7 250.0 250.0
4. Administrative costs (including
examination of asylum applications) 27.9 29.8 26.0 32.2 29.1 35.2 31.2
5. Subsidies to Turkey
(excluded from EU budget) - - - - - 66.6 98.9
6. Other costs and measures
(education) 211.2 218.7 174.9 287.1 310.0 310.0 310.0
7. Impact on net borrowing (7) = Ʃ (1..6) 840.0 920.1 1,324.9 2,030.4 2,665.6 3,719.3 4,304.0
Note: The data do not include the expenditure related to the North African emergency, which was classified as
such in 2011 and was officially ended on 1 January 2013. Compared with previous estimates, the annual series
of data related to EU subsidies has been revised, and is based on the actual EU credits in favour of Italy.
Source: Analyses by MEF and State General Accounting Department.
TABLE R.2 - IMPACT ON NET BORROWING BY ECONOMIC CATEGORY: 2011 - 2017 (in € mn)
2011 2012 2013 2014 2015 2016
preliminary
estimates
2017
updated
forecasts
1. Employee compensation (D.1) 97.1 82.7 81.0 84.3 88.1 102.3 102.2
2.Intermediate consumption (P.2) 190.0 198.6 218.0 346.8 426.6 367.7 373.1
3.Social benefits (D.62, D.63) 149.1 160.2 306.0 636.6 1,172.3 2,212.7 2,614.6
4.Subsidies (D.3) - - - - - - -
5.Gross fixed capital formation (P.51) 39.5 62.7 288.7 340.1 253.7 212.7 390.0
6.Capital transfers (D.9) - - - - - - -
7.Other 364.4 415.8 431.2 622.7 724.7 823.8 824.0
8.Impact on net borrowing (8) = Ʃ (1..7) 840.0 920.1 1,324.9 2,030.4 2,665.6 3,719.3 4,304.0
9.Compensation from EU 56.0 90.7 78.8 70.3 106.6 120.8 91.0
10.Impact on borrowing, net of EU
contributions (10) = (8)-(9) 784.0 829.3 1,246.1 1,960.1 2,559.0 3,598.5 4,213.0
11.Total impact on nominal deficit, net
of the EU subsidies (% of GDP) 0.05 0.05 0.08 0.12 0.16 0.22 0.25
Note: The data do not include the expenditure related to the North African emergency, which was classified as
such in 2011 and was officially ended on 1 January 2013. The table incorporates several approximations where
unit costs were not available by economic category. More specifically, current expenditure on defence is
considered entirely as intermediate consumption (due to prevalence); other expenditure includes outlays for
education, healthcare, subsidies to Turkey (excluded from EU budget) and EU funds and related national co-
financing. Compared with previous estimates, the annual series of data related to EU subsidies has been revised,
and is based on the actual EU credits in favour of Italy.
Source: Analyses by MEF and State General Accounting Department.
FO
CU
S

III. NET BORROWING AND PUBLIC DEBT
MINISTERO DELL’ECONOMIA E DELLE FINANZE 47
TABLE R.3 - ADDITIONAL SPECIFIC INFORMATION ABOUT COSTS
2013 2014 2015 2016
2017
(1Q)
1. Arrivals (total no. of persons, incl. refugees in transit) 42,925 170,100 153,842 181,436 24,280
2. Asylum seekers (total no. of persons) (1) 26,620 63,456 83,970 123,600 24,209
3. Positive decisions (total no. of persons) (2) 14,392 21,861 29,548 36,660 5,721
Note: (1) Data updated as of February 2017.
(2) Positive outcomes include refugees, persons to whom subsidiary international protection has been granted,
and persons to whom humanitarian international protection has been granted. Data updated as of February
2017.
Source: Interior Ministry.
Reinforcing national security in view of international events related to se-
rious acts of terrorism
In December 2015, the Italian government requested to make use of
additional financial margins for 2016 for the purpose of reinforcing national
security in view of the serious acts of terrorism that took place in Paris and
created an alert for all European countries.
Extraordinary measures have been adopted to mitigate the risks related to
the possibility of the occurrence of terrorist violence. Such measures have
included: the modernisation of equipment in use by the nation’s security and
defence forces; enhancements to surveillance capacity, including at foreign
locations; the development of the cyber security; and increased compensation to
law-enforcement and defence personnel.22 The initiatives provided overall have
been quantified at around 0.06 percent of GDP, for approximately €980.5 million
for 2016 alone.
For some of the provisions, such as the increase in compensation to law-
enforcement and defence personnel, precise monitoring of the expenditure has
been implemented with the use of a specific account of the operating budget. In
other cases where funds are distributed over the year based on needs as
identified, it is possible to come up with an estimate of the additional expenditure
sustained through a reconstruction of the operational records of the budget items
involved. The total expenditure of €1,038.3 million (0.062 percent of GDP in 2016)
is slightly above that initially forecast since additional resources were pinpointed
to cover the needs emerging for some of the budget items involved in the
initiatives.
22 Article 1, Paragraphs 965, 967-969, 971-972 of the 2016-2018 Stability Law.

ECONOMIC AND FINANCIAL DOCUMENT - SECTION I STABILITY PROGRAMME
48 MINISTERO DELL’ECONOMIA E DELLE FINANZE
TABLE III.3: ESTIMATE OF EXPENDITURE SUSTAINED FOR SECURITY IN 2016 (in € mn)
Security measures 2016 2016
preliminary
estimates
Fund for enhancement of initiatives and instrumentation related to cyber security
(Article 1, Paragraph 965, 2016 Stability Law) 150.0 145.0
Fund for modernisation of security and defence tools and equipment
(Article 1, Paragraph 967, 2016 Stability Law) 50.0 68.7
Renewal and upgrade of bulletproof vests for State Police
(Article 1, Paragraph 968, 2016 Stability Law) 10.0 10.0
Fund for extraordinary measures for defence and public security
(Article 1, Paragraph 969, 2016 Stability Law) 245.0
182.0
112.0
Investments to expand security at government-owned properties
(Article 1, Paragraph 971, 2016 Stability Law) 15.0 25.1
€80 to law-enforcement personnel (Article 1, Paragraph 972, 2016 Stability Law) 510.5 471.5
23.9
TOTAL 980.5 1,038.3
% of GDP 0.059 0.062
Note: Certain budget items that benefited from extraordinary resources for 2016 had an initial appropriation,
as indicated in the draft of the budget law. In such cases, in order to show the additional portion used and to
keep the figures conservative, the values indicated are representative of the expenditure incurred (committed)
in excess with respect to the initial appropriation.
(1) The fund has been allocated through two decrees of the Minister of the Economy and Finance, the first of
which is in favour of the Defence Ministry only and the second of which applies to peacekeeping missions.
(2) Expenditure related to the extraordinary subsidy for the exceptional national security needs.
(3) Portion used for additional subsidies as part of peacekeeping missions.
Source: Analyses by MEF and State General Accounting Department.
Prevention of seismic risk, hydrogeological instability and securing
schools
The earthquakes that struck central Italy repeatedly in 2016 and 2017 ended
with the loss of life, numerous personal injuries, and huge damage to private and
public buildings, roads, and historical and artistic landmarks. In 2017, the country
will have to cover sizeable costs for immediate intervention and for initiating the
rebuilding of the damaged areas.23
Italy has been coping with natural disasters for a long time. Given its
morphological profile, significant geophysical activity of its subsoil and a strong
propensity toward hydrogeological instability, the country is exposed to the risk of
destructive events and frequent landslides. The impact of the disasters is
amplified by shortcomings in territorial planning, abuses of the environment and
the land, and insufficient maintenance, particularly on account of reduced
resources for such work as a result of measures to curb public spending. These
factors not only put the population at risk, but they also contribute to the build-
up of the need for future intervention.
The support measures for the recovery of the damaged areas accordingly
need to be rounded out by extraordinary intervention to move beyond the nation’s
vulnerability in dealing with the frequency of these destructive events. Therefore,
in addition to the lump-sum expenditure appropriated for the catastrophe, the
2017 Budget Law has provided incremental tax incentives for works that will
mitigate the risk of earthquake damage; most of these incentives apply to private
homes. More specifically, 50 percent of the eligible maintenance expenditure for
23 The measures designed to cover immediate intervention are already considered as one-off measures.

III. NET BORROWING AND PUBLIC DEBT
MINISTERO DELL’ECONOMIA E DELLE FINANZE 49
buildings constituting primary residences, secondary residences, condominiums,
and production facilities in the areas of earthquake risk (extended to include Zone
3) will be tax deductible. Taxpayers may make use of this incentive from 1
January 2017 to 31 December 2021 for a maximum expenditure of €96,000 per
year for each property unit, to be divided into five equal annual quotas starting
from the year in which the expenditures were incurred (instead of the normal
period of 10 years). In addition, if the outcome of the work is a reduction of
earthquake risk with the changeover to a lower risk category, the deductible
amount is 70 percent (75 percent for common areas of condominiums), and with
the decrease of two risk categories, the deductible amount is 80 percent (85
percent for common areas of condominiums).24 The deduction is already
applicable, and was approved by an implementation decree of the Ministry of
Infrastructure and Transportation, with effective date of 1 March 2017, that
incorporates the certification form and the guidelines for the evaluation and
certification of the risk category of the buildings, as approved by the High Council
of Public Works. The cost of the tax incentives for securing the buildings is
estimated at €2 billion, which represents an advance of approximately 15 percent
of the total expenditure projected for 2017. 25
The President of the Council of Ministers is also set to issue certain decrees
for the allocation of the long-term ‘Investment Fund’ established by the Budget
Law,26
a significant portion of which will be allocated in 2017 for ensuring the
securing of school and public-office buildings, and the adoption of measures to
mitigate the risk of damages due to earthquakes and hydro-geological instability
(estimated at €0.5 billion).
Finally, at a local level, additional efforts have been undertaken to safeguard
the territory, with the concession of additional investment margins to regions and
municipalities (estimated at €0.5 billion), with some of the funding to be
specifically allocated to school buildings.27 Local entities inaugurated a dedicated
web platform at the end of February 201728 to outline their financial needs for
projects already initiated or subject to initiation, and, with a decree of the
Minister of the Economy and Finance, additional financial resources were assigned
for the year of 2017, as part of the implementation of the so-called ‘Vertical
National Solidarity Pact’.29
Taken altogether, the additional tax incentives for earthquake-resistance
works and the public investment measures will entail a charge equal to nearly
0.18 percent of GDP for 2017.
24 Article 1, Paragraph 2, 2017-2019 Budget Law 25 Including specific work for making buildings more earthquake resistant and approximately 30 percent of
the expenditure for adjustments, energy requalification and restructuring, which, according to an analysis of the data taken from recent tax returns, can be attributed to securing the buildings.
26 Article 1, Paragraph 140, 2017-2019 Budget Law 27 Article 1, Paragraphs 485 and 495, 2017-2019 Budget Law 28 http://pareggiobilancio.mef.gov.it; http://italiasicura.governo.it/site/home/news/articolo1803.html. 29 Decree of the Minister of the Economy and Finance No. 41337 of 14 March 2017.
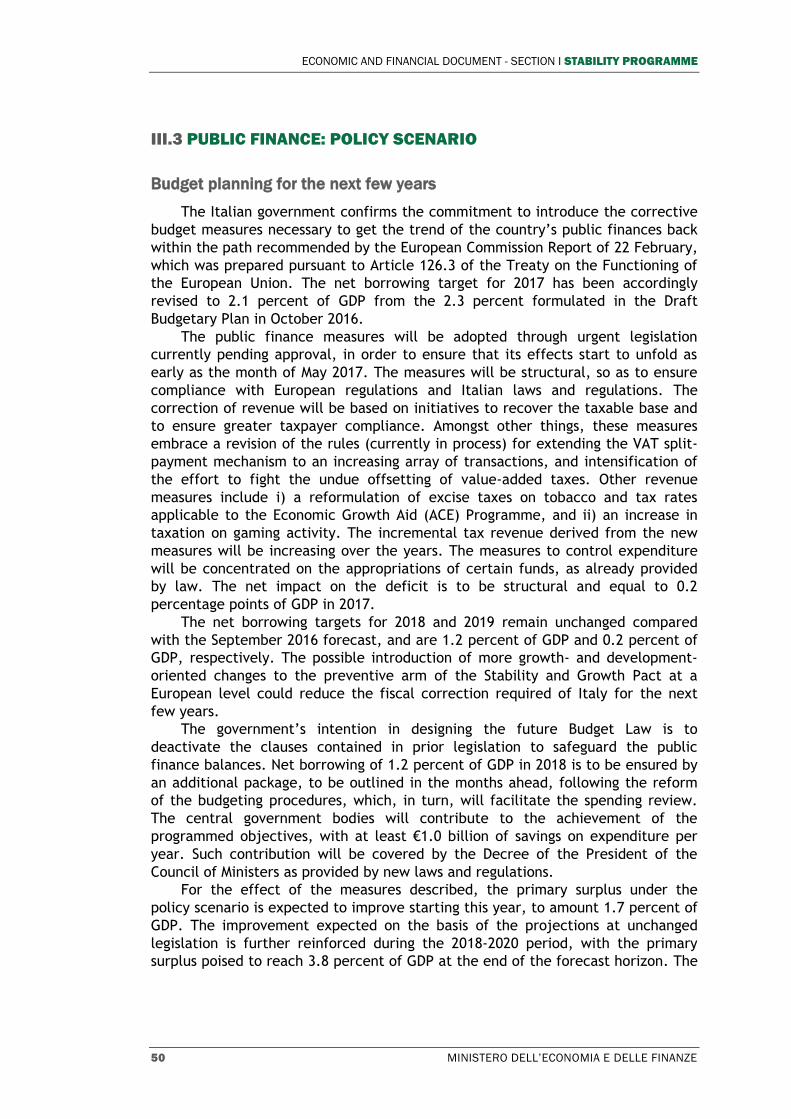
ECONOMIC AND FINANCIAL DOCUMENT - SECTION I STABILITY PROGRAMME
50 MINISTERO DELL’ECONOMIA E DELLE FINANZE
III.3 PUBLIC FINANCE: POLICY SCENARIO
Budget planning for the next few years
The Italian government confirms the commitment to introduce the corrective
budget measures necessary to get the trend of the country’s public finances back
within the path recommended by the European Commission Report of 22 February,
which was prepared pursuant to Article 126.3 of the Treaty on the Functioning of
the European Union. The net borrowing target for 2017 has been accordingly
revised to 2.1 percent of GDP from the 2.3 percent formulated in the Draft
Budgetary Plan in October 2016.
The public finance measures will be adopted through urgent legislation
currently pending approval, in order to ensure that its effects start to unfold as
early as the month of May 2017. The measures will be structural, so as to ensure
compliance with European regulations and Italian laws and regulations. The
correction of revenue will be based on initiatives to recover the taxable base and
to ensure greater taxpayer compliance. Amongst other things, these measures
embrace a revision of the rules (currently in process) for extending the VAT split-
payment mechanism to an increasing array of transactions, and intensification of
the effort to fight the undue offsetting of value-added taxes. Other revenue
measures include i) a reformulation of excise taxes on tobacco and tax rates
applicable to the Economic Growth Aid (ACE) Programme, and ii) an increase in
taxation on gaming activity. The incremental tax revenue derived from the new
measures will be increasing over the years. The measures to control expenditure
will be concentrated on the appropriations of certain funds, as already provided
by law. The net impact on the deficit is to be structural and equal to 0.2
percentage points of GDP in 2017.
The net borrowing targets for 2018 and 2019 remain unchanged compared
with the September 2016 forecast, and are 1.2 percent of GDP and 0.2 percent of
GDP, respectively. The possible introduction of more growth- and development-
oriented changes to the preventive arm of the Stability and Growth Pact at a
European level could reduce the fiscal correction required of Italy for the next
few years.
The government’s intention in designing the future Budget Law is to
deactivate the clauses contained in prior legislation to safeguard the public
finance balances. Net borrowing of 1.2 percent of GDP in 2018 is to be ensured by
an additional package, to be outlined in the months ahead, following the reform
of the budgeting procedures, which, in turn, will facilitate the spending review.
The central government bodies will contribute to the achievement of the
programmed objectives, with at least €1.0 billion of savings on expenditure per
year. Such contribution will be covered by the Decree of the President of the
Council of Ministers as provided by new laws and regulations.
For the effect of the measures described, the primary surplus under the
policy scenario is expected to improve starting this year, to amount 1.7 percent of
GDP. The improvement expected on the basis of the projections at unchanged
legislation is further reinforced during the 2018-2020 period, with the primary
surplus poised to reach 3.8 percent of GDP at the end of the forecast horizon. The

III. NET BORROWING AND PUBLIC DEBT
MINISTERO DELL’ECONOMIA E DELLE FINANZE 51
trend of interest expenditure is similar to that evidenced by the estimates at
unchanged legislation, with the aggregate to equal 3.8 percent of GDP in 2020.30
The government remains firmly committed to continuing, on a basis
compatible with budget objectives, the process of reducing the fiscal burden on
the income of households and businesses, and to consider the resources needed
for the public employment contract renewal.
Taken altogether, the strategy that the government intends to pursue to
reduce the deficit would be fully in line with the rules of the Stability and Growth
Pact.
TABLE III.4: DIFFERENCES COMPARED WITH THE PREVIOUS STABILITY PROGRAMME
2016 2017 2018 2019
REAL GDP GROWTH RATE
2016 Stability Programme 1.2 1.4 1.5 1.4
2017 Stability Programme 0.9 1.1 1.0 1.0
Difference -0.3 -0.3 -0.5 -0.4
NET BORROWING (% of GDP)
2016 Stability Programme -2.3 -1.8 -0.9 0.1
2017 Stability Programme -2.4 -2.1 -1.2 -0.2
Difference -0.1 -0.3 -0.4 -0.3
PUBLIC DEBT (% of GDP)
2016 Stability Programme 132.4 130.9 128.0 123.8
2017 Stability Programme 132.6 132.5 131.0 128.2
Difference 0.2 1.6 3.0 4.4
1) Discrepancies, if any, are due to rounding.
Results: structural balance and expenditure rule
The general government net borrowing target for 2016 has been provisionally
reported at 2.4 percent of GDP. The corresponding structural balance would be
equal to 1.2 percent of GDP, with a deterioration of approximately 0.7 percentage
points compared with 2015. Such deterioration is in line with the increase of the
structural deficit, as allowed by European rules in view of the flexibility clauses
approved for 2016. In addition, the trend of the expenditure aggregate is
consistent with the objective required for 2017. The European Commission’s
assessment will be conducted based on the costs actually incurred in 2016, as
indicated in this Stability Programme.
In 2017, the structural balance corresponding to net borrowing at unchanged
legislation of 2.3 percent of GDP is equal to 1.6 percent of GDP, with a
deterioration of approximately 0.5 percentage points compared with 2016. The
new policy scenario presented herein provides for reducing general government
net borrowing to 1.2 percent of GDP in 2018. According to the Department of the
Treasury’s estimates based on the methodology agreed at a European level,31 the
30 This is only due to a slightly higher level of nominal GDP. The policy scenario for public finance does not
actually incorporate the favourable effects on interest payments that could arise from the programme itself. The implicit cost of the public debt is actually the same for both scenarios.
31 The Treasury’s estimates are based on the production-function methodology agreed at an EU level and they differ from the Commission’s estimates as a result of the underlying macroeconomic forecasts and in view of the fact that this Treasury’s estimates cover a four-year time horizon (ending in 2020), while the Commission’s

ECONOMIC AND FINANCIAL DOCUMENT - SECTION I STABILITY PROGRAMME
52 MINISTERO DELL’ECONOMIA E DELLE FINANZE
structural balance would deteriorate from -1.2 percent of GDP for 2016 to -1.5
percent for 2017, with a structural change equal to approximately -0.3 percentage
points of GDP.
For 2017, according to the Commission’s forecasts released in late February
the output gap is expected to be -0.8 percent of potential GDP, suggesting a
return to normal cyclical conditions. The correction of the structural balance
required in 2017 would therefore be more than 0.5 percentage points,32 including
due to the high public debt. The Commission nonetheless recognised as admissible
(based on an ex-ante assessment of the forecasts) expenditure for exceptional
circumstances related to the management of migrants and the earthquakes, in an
amount of more than 0.3 percentage points of GDP. The structural correction
required for 2017 is thus reduced to approximately 0.3 percentage points.
Instead, in this EFD, the estimate of the output gap for 2017, based on the
methodology agreed at a European level, is equal to -1.8 percent of potential
GDP. Such level, which exceeds the representative threshold of -1.5 percent of
potential GDP, would suggest the continuation of adverse cyclical conditions again
in 2017, and the fiscal consolidation required would be set at 0.5 percentage
points of GDP (approximately 0.2 percentage points, if corrected for the
expenditure related to exceptional events). The Commission will make its
assessment on the Spring Forecasts that are due to be issued in May; however, the
indications coming from the plausibility checks33 about the estimates of the output
gap would point to a confirmation of the status of negative cyclical conditions
again for 2017. In light of such considerations, the change of approximately -0.3
percentage points of the structural deficit estimated in the policy scenario of this
EFD is to be considered essentially compatible with the objectives delineated by
European rules.
In the later years of the policy scenario, the structural deficit is forecast to
decrease to 0.7 percent in 2018, and then to reach a slight surplus in 2019. The
Medium-Term Objective of the structural budget balance would be maintained in
2020.
forecasts do not go beyond 2018. In addition, the MEF uses a grid search for optimal selection with regard to the initialisation of the variances for the calculation of the NAWRU (in this regard, see the Focus section ‘Sensitivity of the NAWRU to initialisation parameters of latent factors’ published in the 2015 EFD), while the Commission sets the related bounds based on discretionary assessments.
32 European Commission, ‘Vade Mecum on the Stability and Growth Pact - 2016 edition’, Institutional Paper 021, March 2016.
33 The European Commission and the Output Gap Working Group (OGWG) have recently perfected a methodology for evaluating the plausibility of the estimates of the output gap obtained through the agreed production-function model. Through a technical panel, the output gap of the different European countries is regressed with respect to variables deemed highly correlated with the economic cycle, including: capacity used in the manufacturing sector; a measure of slack in the economy constructed by using sector confidence indices; the rate of wage inflation; and the short-term unemployment rate. The estimates of the output gap obtained on the basis of this methodology panel are compared with the year prior to the current year, with the official values obtained based on the production function and, if the variance is greater than a given threshold, it can be inferred therefrom that the official estimate is at risk of not being plausible. The difference between the official output gap and that derived from the panel model for the year prior to the current year is simply applied to the Commission’s forecasts for the subsequent two years. In this regard, Italy’s output gap estimated in the Commission’s 2017 Winter Forecast with the official methodology is -1.6 percent of potential GDP in 2016, whereas the panel model produces an output gap that is 0.7 percentage points of GDP greater, namely, -2.3 percent. Applying this difference to 2017, Italy’s output gap would go from -0.8 percent, corresponding to a situation of normal cyclical conditions, to -1.5 percent of potential GDP, which confirms the presence of negative cyclical conditions for 2017.

III. NET BORROWING AND PUBLIC DEBT
MINISTERO DELL’ECONOMIA E DELLE FINANZE 53
TABLE III.5: AMOUNTS TO BE EXCLUDED FROM THE EXPENDITURE RULE
2016 2017 2018 2019 2020
Level (1) % of GDP % of GDP
Expenditure on EU programmes fully matched
by EU funds 960 0.1 0.2 0.1 0.2 0.2
- incl.: expenditure for investments fully
matched by EU funds 300 0.0 0.1 0.1 0.1 0.1
Cyclical unemployment benefit expenditure (2) 2,280 0.1 0.1 0.1 0.1 0.0
Discretionary revenue (3) -9,575 -0.6 -0.2 0.9 0.2 0.0
Revenue increases mandated by law 0.0 0.0 0.0 0.0 0.0 0.0
(1) Figures in millions.
(2) The cyclical unemployment benefit expenditure has been calculated with the methodology currently used by
the European Commission, based on the unemployment gap.
(3) Discretionary revenue is inclusive of social contributions.
TABLE III.6: SCENARIO AT UNCHANGED POLICIES
2016 2017 2018 2019 2020
Level (1) % of GDP % of GDP
Total revenue at unchanged policies 788,503 47.1 46.8 47.0 47.0 46.5
Total expenditure at unchanged policies 829,312 49.6 49.1 48.4 47.7 47.1
Detail of expenditure
Current expenditure 771,974 46.2 45.7 44.9 44.3 44.0
Incl.:
Employee compensation 164,084 9.8 9.8 9.5 9.2 9.0
Intermediate consumption 135,577 8.1 8.0 7.8 7.6 7.5
Capital expenditure 57,338 3.4 3.4 3.5 3.3 3.1
Incl.:
Gross fixed capital formation 35,048 2.1 2.1 2.2 2.2 2.0
Investment subsidies 15,874 0.9 0.9 0.9 0.9 0.9
(1) Figures in millions.
TABLE III.7: STATE SECTOR AND PUBLIC SECTOR: CASH BALANCES (1)
2016 2017 2018 2019 2020
Level (2) % of GDP % of GDP
Public sector balance -46,278 -2.8 -3.5 -2.1 -1.1 -1.0
Central government -47,831 -2.9 -3.8 -2.6 -1.7 -1.5
State sector -47,765 -2.9 -3.8 -2.6 -1.7 -1.5
Local government 1,554 0.1 0.1 0.1 0.1 0.1
Social security funds 0 0.0 0.0 0.0 0.0 0.0
(1) The first line reports the policy-scenario figures; the remaining figures describe the trends at unchanged legisla-
tion.
(2) Figures in millions.

ECONOMIC AND FINANCIAL DOCUMENT - SECTION I STABILITY PROGRAMME
54 MINISTERO DELL’ECONOMIA E DELLE FINANZE
TABLE III.8: CYCLICALLY ADJUSTED BUDGET (% of GDP) (1)
2015 2016 2017 2018 2019 2020
GDP growth rate at constant prices 0.8 0.9 1.1 1.0 1.0 1.1
Net borrowing -2.7 -2.4 -2.1 -1.2 -0.2 0.0
Interest expenditure 4.1 4.0 3.9 3.7 3.7 3.8
Potential GDP growth rate -0.1 -0.2 0.1 0.3 0.4 0.6
Factor contribution to potential growth:
Labour 0.3 0.0 0.2 0.4 0.4 0.4
Capital -0.1 -0.1 0.0 0.0 0.1 0.2
Total Factor Productivity -0.2 -0.1 -0.1 -0.1 0.0 0.0
Output gap -3.8 -2.7 -1.8 -1.1 -0.5 0.0
Cyclical component of the budget balance -2.1 -1.5 -1.0 -0.6 -0.3 0.0
Cyclically adjusted budget balance -0.6 -1.0 -1.1 -0.6 0.1 0.1
Cyclically adjusted primary surplus 3.5 3.0 2.7 3.1 3.8 3.8
One-off measures -0.2 0.2 0.3 0.1 0.0 0.0
Revenue measures 0.2 0.3 0.5 0.2 0.0 0.0
Expenditure measures (incl. property disposals) -0.4 -0.1 -0.2 -0.1 0.0 0.0
Budget balance, net of one-off measures -2.5 -2.6 -2.5 -1.3 -0.2 0.0
Cyclically adjusted budget balance, net of one-off measures -0.5 -1.2 -1.5 -0.7 0.1 0.0
Cyclically adjusted primary surplus, net of one-off measures 3.7 2.8 2.4 3.0 3.8 3.8
Change in budget balance, net of one-off measures 0.7 -0.1 0.2 1.1 1.1 0.2
Change in cyclically adjusted budget balance, net of
one-off measures 0.3 -0.7 -0.3 0.8 0.8 -0.1
(1) Rounding to the first decimal point may cause inconsistencies in the values presented in the table.
Assessment of significant deviations and the expenditure rule
For those countries to which the preventive arm of the Stability and Growth Pact (SGP) is
applicable, the path toward achievement of the Medium-Term Objective (MTO) is evaluated
on the basis of two parameters: 1) the change of the structural balance; and 2) the
expenditure rule.
As far as the first parameter is concerned, the adjustment path toward the MTO, as
measured on the basis of the change in the structural balance, is modulated each year in
relation to the following criteria:34 i) the economy’s cyclical conditions as summarized by the
measurement of the output gap; ii) the level of the opening structural balance; iii) the level
of the debt-to-GDP ratio; and iv) the existence of medium-term risks to public finance
sustainability, as evaluated on the basis of the S1 indicator. For example, in ‘normal’ cyclical
conditions (represented by an output gap of between -1.5 percent and 1.5 percent of
potential GDP), a country that has a debt-to-GDP ratio above 60 percent and, on the basis of
S1, average risks of sustainability, must move toward its MTO through a reduction of the
structural balance of more than 0.5 percentage points of GDP. The Commission’s
Communication of January 2015 has clarified that modulated annual adjustments on the
basis of cyclical conditions can be reduced for the application of the structural reforms and
the investment clauses or following unusual events beyond the government’s control,
including severe recessions or earthquakes or the manifestation of expenditure linked to
migration flows. This implies that against the required annual adjustment of the structural
balance (0.5 percentage points of GDP) in normal cyclical conditions, the joint application of
the reforms and investment clauses can permit maximum easing of the structural balance
for up to -0.25 percentage points of GDP.
34 See the matrix that specifies the annual adjustment toward the MTO based on the economic cycle
presented in the Commission’s communication ‘Making the best use of flexibility within the existing rules of the Stability and Growth Pact’ of 13 January 2015.
FO
CU
S

III. NET BORROWING AND PUBLIC DEBT
MINISTERO DELL’ECONOMIA E DELLE FINANZE 55
With reference to the expenditure rule and to countries that have not yet achieved their
MTO, European regulations, as confirmed by national legislation,35 establish that the
aggregate expenditure of reference must grow at a rate equal to the difference between the
average growth rate of potential GDP36 and the so-called convergence margin. The
convergence margin is, in turn, calibrated in relation to the economy’s cyclical conditions so
that, for example, in ‘normal’ cyclical conditions (i.e. annual output gap of between -1.5
percent and 1.5 percent of potential GDP), the expenditure aggregate is reduced so as to
ensure annual improvement in the structural balance that is equal to or greater than 0.5
percent of GDP. As clarified by the European Commission, the modulation of the expenditure
rule’s parameters also occurs in the event of the application of the flexibility granted for
structural reforms and/or for the investment clause and/or for other possible clauses in
relation to unusual events.
With regard to the adjustment path toward the MTO, there are significant deviations if there
is a shift of 0.5 percentage points of GDP over one year, or an average of 0.25 percentage
points over preceding two years, compared with the path identified based on the change of
the structural balance and the expenditure rule. However, only the existence of a significant
deviation reported on ex-post data can lead to the opening of an infraction procedure.
In 2015, the macroeconomic assumptions in the EFD produced an output gap of -3.8
percent of potential GDP in the policy scenario and in the scenario based on unchanged
legislation. The cyclical conditions would thus have been defined as particularly adverse
(‘very bad times’) and the required adjustment of the structural balance and the
convergence margin of the expenditure rule would have needed to ensure improvement of
0.25 percentage points of GDP in structural terms. On an annual basis and on average for
the two years, the structural deficit of 2015 recalculated for the current year decreased in
line with the required adjustment, whereas it deviated by approximately 0.1 percentage
points of GDP if the changes frozen in recent years are considered. With regard to the
expenditure rule, the annual deviation would not be significant (approximately 0.2 points of
GDP, while there would be no deviation due to the data frozen in previous years and against
the past two-year average.
Given the cumulative activation of the reforms and investment clauses and the granting of
additional flexibility for unusual events, the structural deficit for 2016 was allowed to
increase by 0.36 percentage points of GDP with respect to 2015. Similarly, the expenditure
aggregate was allowed to increase by 0.8 percent in real terms. In comparison with these
parameters, the deviation of the structural balance in 2016 was not significant, amounting
to 0.3 percentage points of GDP on an annual basis and 0.2 percentage points of GDP
against the average of 2015 and of 2016. With regard to the expenditure rule, the annual
deviation was not significant, amounting to 0.1 percent on an annual basis and 0.2 percent
as the two-year average of 2015 and of 2016. More specifically, the average variance for
the two-year period would be nil, had the results frozen for the previous years not been
considered.
In 2017, in the EFD’s scenario at unchanged legislation, in view of the continuing negative
cyclical conditions and the required reduction of the structural balance of 0.5 percentage
points of GDP, the Commission has granted additional flexibility (to be verified ex-post) for
the equivalent of 0.32 points of GDP with reference to the refugee crisis and the costs of the
recent earthquakes that struck central Italy. The required adjustment of the structural
balance is therefore around 0.18 percentage points of GDP. This value, however, reflects
Italy’s non-compliance with the structural balance needed to converge towards the MTO
35 Law No. 243/2012. 36 The average growth rate of potential GDP is computed on the basis of the production-function method
agreed at a European level, considering a 10-year average of the European Commission’s forecast centred on the year for which the estimation is being made. The 10-year average accordingly includes the four years prior to that for the estimation, and the five subsequent years (forecast of two years and mechanical extrapolation for the last three).
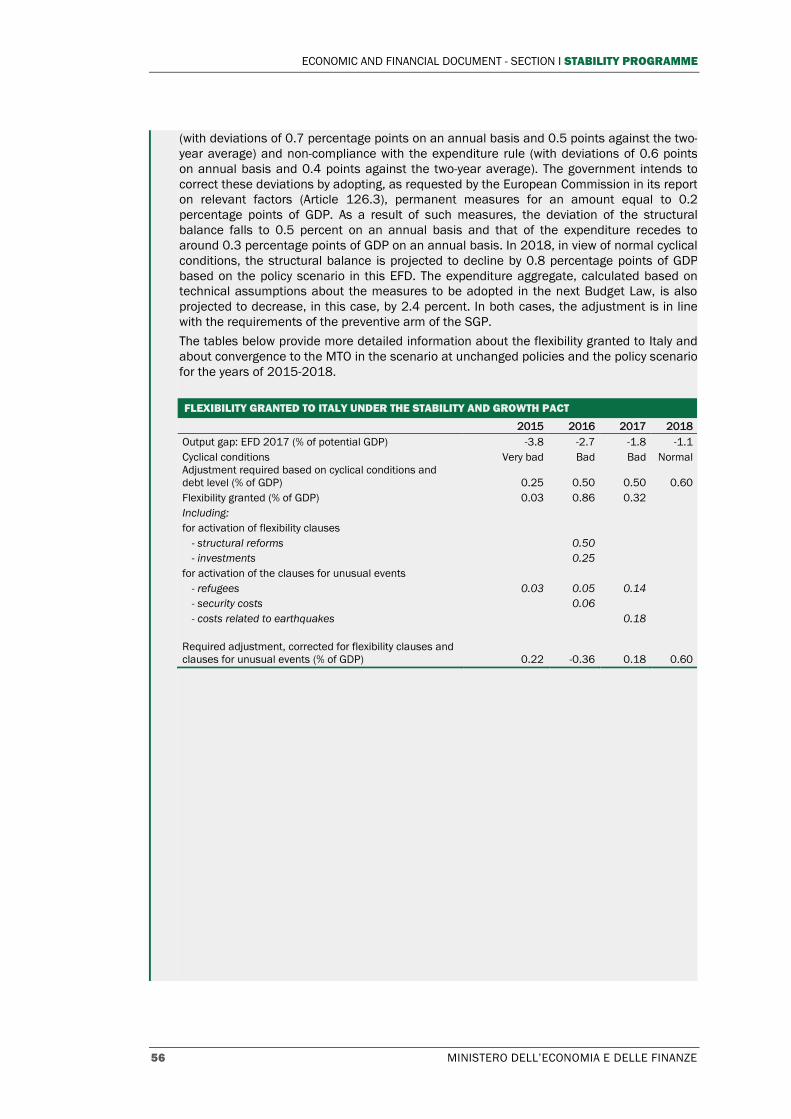
ECONOMIC AND FINANCIAL DOCUMENT - SECTION I STABILITY PROGRAMME
56 MINISTERO DELL’ECONOMIA E DELLE FINANZE
(with deviations of 0.7 percentage points on an annual basis and 0.5 points against the two-
year average) and non-compliance with the expenditure rule (with deviations of 0.6 points
on annual basis and 0.4 points against the two-year average). The government intends to
correct these deviations by adopting, as requested by the European Commission in its report
on relevant factors (Article 126.3), permanent measures for an amount equal to 0.2
percentage points of GDP. As a result of such measures, the deviation of the structural
balance falls to 0.5 percent on an annual basis and that of the expenditure recedes to
around 0.3 percentage points of GDP on an annual basis. In 2018, in view of normal cyclical
conditions, the structural balance is projected to decline by 0.8 percentage points of GDP
based on the policy scenario in this EFD. The expenditure aggregate, calculated based on
technical assumptions about the measures to be adopted in the next Budget Law, is also
projected to decrease, in this case, by 2.4 percent. In both cases, the adjustment is in line
with the requirements of the preventive arm of the SGP.
The tables below provide more detailed information about the flexibility granted to Italy and
about convergence to the MTO in the scenario at unchanged policies and the policy scenario
for the years of 2015-2018.
FLEXIBILITY GRANTED TO ITALY UNDER THE STABILITY AND GROWTH PACT
2015 2016 2017 2018
Output gap: EFD 2017 (% of potential GDP) -3.8 -2.7 -1.8 -1.1
Cyclical conditions Very bad Bad Bad Normal
Adjustment required based on cyclical conditions and
debt level (% of GDP) 0.25 0.50 0.50 0.60
Flexibility granted (% of GDP) 0.03 0.86 0.32
Including:
for activation of flexibility clauses
- structural reforms
0.50
- investments
0.25
for activation of the clauses for unusual events
- refugees 0.03 0.05 0.14
- security costs
0.06
- costs related to earthquakes
0.18
Required adjustment, corrected for flexibility clauses and
clauses for unusual events (% of GDP) 0.22 -0.36 0.18 0.60
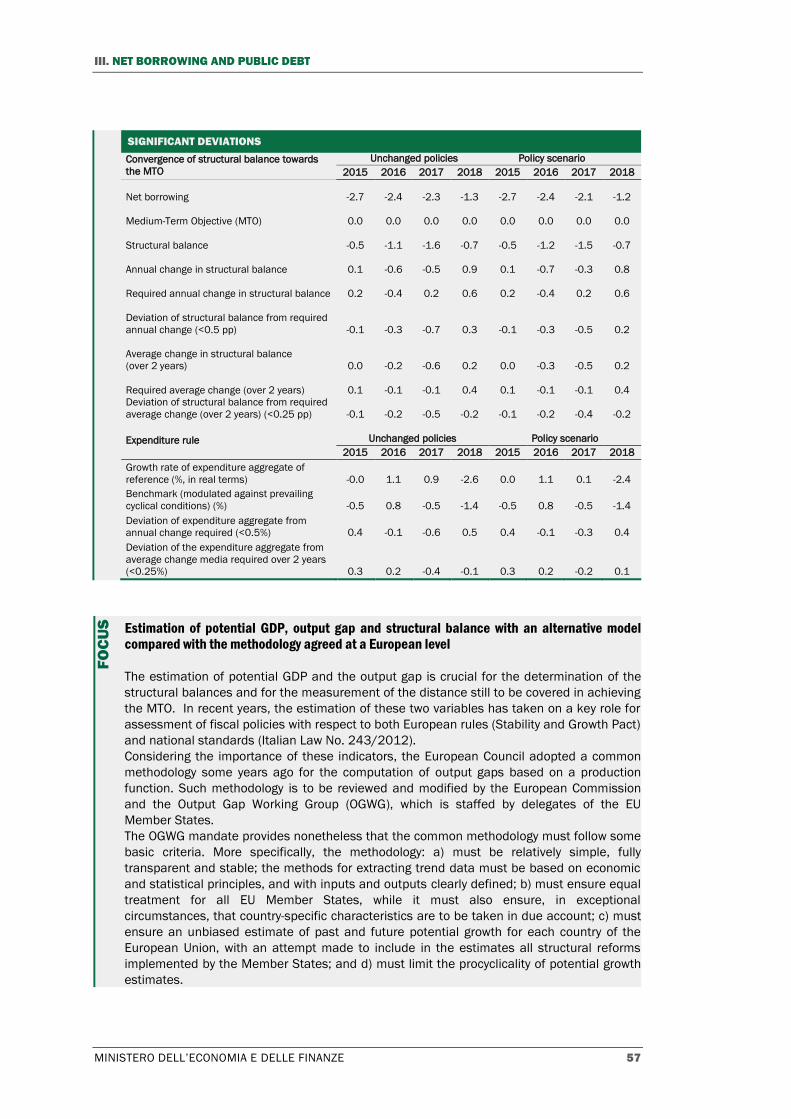
III. NET BORROWING AND PUBLIC DEBT
MINISTERO DELL’ECONOMIA E DELLE FINANZE 57
SIGNIFICANT DEVIATIONS
Convergence of structural balance towards
the MTO
Unchanged policies Policy scenario
2015 2016 2017 2018 2015 2016 2017 2018
Net borrowing -2.7 -2.4 -2.3 -1.3 -2.7 -2.4 -2.1 -1.2
Medium-Term Objective (MTO) 0.0 0.0 0.0 0.0 0.0 0.0 0.0 0.0
Structural balance -0.5 -1.1 -1.6 -0.7 -0.5 -1.2 -1.5 -0.7
Annual change in structural balance 0.1 -0.6 -0.5 0.9 0.1 -0.7 -0.3 0.8
Required annual change in structural balance 0.2 -0.4 0.2 0.6 0.2 -0.4 0.2 0.6
Deviation of structural balance from required
annual change (<0.5 pp) -0.1 -0.3 -0.7 0.3 -0.1 -0.3 -0.5 0.2
Average change in structural balance
(over 2 years) 0.0 -0.2 -0.6 0.2 0.0 -0.3 -0.5 0.2
Required average change (over 2 years) 0.1 -0.1 -0.1 0.4 0.1 -0.1 -0.1 0.4
Deviation of structural balance from required
average change (over 2 years) (<0.25 pp) -0.1 -0.2 -0.5 -0.2 -0.1 -0.2 -0.4 -0.2
Expenditure rule Unchanged policies Policy scenario
2015 2016 2017 2018 2015 2016 2017 2018
Growth rate of expenditure aggregate of
reference (%, in real terms) -0.0 1.1 0.9 -2.6 0.0 1.1 0.1 -2.4
Benchmark (modulated against prevailing
cyclical conditions) (%) -0.5 0.8 -0.5 -1.4 -0.5 0.8 -0.5 -1.4
Deviation of expenditure aggregate from
annual change required (<0.5%) 0.4 -0.1 -0.6 0.5 0.4 -0.1 -0.3 0.4
Deviation of the expenditure aggregate from
average change media required over 2 years
(<0.25%) 0.3 0.2 -0.4 -0.1 0.3 0.2 -0.2 0.1
Estimation of potential GDP, output gap and structural balance with an alternative model compared with the methodology agreed at a European level
The estimation of potential GDP and the output gap is crucial for the determination of the
structural balances and for the measurement of the distance still to be covered in achieving
the MTO. In recent years, the estimation of these two variables has taken on a key role for
assessment of fiscal policies with respect to both European rules (Stability and Growth Pact)
and national standards (Italian Law No. 243/2012).
Considering the importance of these indicators, the European Council adopted a common
methodology some years ago for the computation of output gaps based on a production
function. Such methodology is to be reviewed and modified by the European Commission
and the Output Gap Working Group (OGWG), which is staffed by delegates of the EU
Member States.
The OGWG mandate provides nonetheless that the common methodology must follow some
basic criteria. More specifically, the methodology: a) must be relatively simple, fully
transparent and stable; the methods for extracting trend data must be based on economic
and statistical principles, and with inputs and outputs clearly defined; b) must ensure equal
treatment for all EU Member States, while it must also ensure, in exceptional
circumstances, that country-specific characteristics are to be taken in due account; c) must
ensure an unbiased estimate of past and future potential growth for each country of the
European Union, with an attempt made to include in the estimates all structural reforms
implemented by the Member States; and d) must limit the procyclicality of potential growth
estimates.
FO
CU
S

ECONOMIC AND FINANCIAL DOCUMENT - SECTION I STABILITY PROGRAMME
58 MINISTERO DELL’ECONOMIA E DELLE FINANZE
Both the European Commission and the Output Gap Working Group (OGWG) have
recognised the existence of critical theoretical and empirical aspects of the currently used
methodology, and they have introduced various changes at various times.37 Despite this, as
far as Italy is concerned, there are still open questions that need to be appropriately
examined and resolved.
The Italian government remains of the opinion that the methodology agreed at an EU level
for the estimation of potential GDP and the output gaps is not suited for supplying an
impartial assessment of Italy’s potential growth with regard to i) past years, when it has
produced a less-than-plausible result of the growth rate of the trend of the Total Factor
Productivity (TFP), which has been regularly negative since 2003, and ii) future years, when
the estimates are pro-cyclical and not in line with the key macroeconomic notions.
In this regard, the Department of the Treasury initially presented proposed methodological
changes in the 2015 EFD38 and rounded out the proposals in the 2016 EFD.39 Although not
modifying the production-function system agreed at an EU level, such proposed changes
would allow for resolving some of the problems linked to the estimates of Italy’s potential
GDP.
In this box, the results in terms of output gap and the structural budget balance derived
from the application of an alternative methodology are presented for the estimation of
Italy’s potential GDP and are based on two marginal changes to the model agreed at a
European level.
The first change regards the estimation of the breakdown between the TFP trend and cycle.
The breakdown is obtained by using an economic-cycle indicator as the endogenous
variable of the latent factors model; such variable is given by the linear combination
between a labour-hoarding measure (such as the hours the number of the hours for wage-
supplementation schemes (CIG) distinguished by sector), and the capacity utilisation
derived from business surveys (CUBS) currently used in the official methodology. In line with
the assumption of neutral propagation of technological innovation among productive factors
(on which the official production-function model is currently based), the weighted assigned
to the labour-hoarding variable corresponds with the labour-elasticity parameter, which is
set at 0.65 for all European countries. Instead, the weight assigned to the CUBS variable,
which is assumed to be very correlated with the extent of use of the capital factor, is set at
0.35.
The second change is instead represented by the methodology for the optimal selection of
the maximum and minimum parameters for the initialisation of the variances of the
innovations of the latent factors in the model for estimating the Non-Accelerating Wage
Rate of Unemployment (NAWRU). In place of the totally discretionary procedure used by the
European Commission, the methodology developed by the Department of the Treasury
provides for the application of a grid-search procedure, which, through a very high number
of iterations, optimally selects the maximum and minimum parameters from a statistical
standpoint. Such changes to the official methodology, although marginal, lead to significant
changes in the estimates of Italy’s potential GDP and output gap.
The application of the alternative methodology to the macroeconomic policy scenario set
37 Recently, the OGWG approved the modification of the NAWRU model that is currently estimated by
associating the short-term results with a medium-term structural unemployment rate. This latter variable, in turn, is derived from a panel method in which NAWRU is regressed against structural variables (such as the tax wedge, the unemployment subsidies replacement rate, a variable about active labour-market policies and an employment-protection legislation index). In addition, the OGWG has decided to introduce a panel model (plausibility tool) to support methodology agreed for evaluating the plausibility of the official model’s estimates.
38 In this regard, see the focus section ‘Sensitivity of the NAWRU to initialisation parameters of latent factors’ in the 2015 EFD (2015 Stability Programme, pages 18-22).
39 In this regard, see the focus section ‘Innovation in the methodology agreed at an EU level for estimation of potential GDP’ in the 2016 EFD (2016 Stability Programme, pages 44-51).

III. NET BORROWING AND PUBLIC DEBT
MINISTERO DELL’ECONOMIA E DELLE FINANZE 59
out in this EFD produces estimates of the potential growth for Italy that are very different
from those obtained with the official methodology. More specifically, when processing the
historical data, the estimation of the trend of the TFP would no longer peak in 2003, with a
subsequent decreasing trend, but, more reasonably, it would show gradually decelerating
positive growth.
When using the enhanced model, the level of potential GDP is steadily higher as from 2017
through 2020, with consequent output gap values that are significantly wider. More
specifically, Italy’s output gap would be -2.5 percent of potential GDP in 2017 (versus -1.8
percent in the policy scenario of this EFD), -1.9 percent in 2018 (versus -1.1 percent), -1.4
percent in 2019 (versus -0.5 percent) and -1.0 percent in 2020 (versus 0.0 percent). As it is
possible to note, with the alternative model, the gap between real and potential growth does
not close at the end of the forecast horizon, but remains in negative territory, thereby
denoting the continuation of the negative cyclical phase of the Italian economy, with
sizeable consequences on fiscal policy.
Indeed, corresponding to such values for the output gap, the structural budget balance
would be equal to -1.1 percent of GDP in 2017 (versus -1.5 percent of GDP in the policy
scenario of this EFD), -0.3 percent in 2018 (versus -0.7 percent), 0.5 percent in 2019
(versus 0.1 percent). The MTO would substantially already be achieved in 2018, and
overachieved as from 2019.
ENHANCED MODEL: POTENTIAL GROWTH AND OUTPUT GAP
Output gap Structural deficit
2017 EFD Enhanced model 2017 EFD Enhanced model
2016 -2.7 -3.4 -1.2 -0.8
2017 -1.8 -2.5 -1.5 -1.1
2018 -1.1 -1.9 -0.7 -0.3
2019 -0.5 -1.4 0.1 0.5
2020 0.0 -1.0 0.0 0.5
ENHANCED MODEL: POTENTIAL GROWTH AND OUTPUT GAP
POTENTIAL GROWTH OUTPUT GAP
Source: MEF analyses. Source: MEF analyses.
-0.4
-0.2
0
0.2
0.4
0.6
0.8
2016 2017 2018 2019 2020
Potential Growth (PolicyScenario EFD 2017)
Potential Growth(Enhanced Model)
-04
-04
-03
-03
-02
-02
-01
-01
00
01
2016 2017 2018 2019 2020
Output gap (PolicyScenario EFD 2017)
Output Gap(Enhanced Model)

ECONOMIC AND FINANCIAL DOCUMENT - SECTION I STABILITY PROGRAMME
60 MINISTERO DELL’ECONOMIA E DELLE FINANZE
III.4 FINANCIAL IMPACT OF NATIONAL REFORM PROGRAMME MEASURES
The grids provided as exhibits to the National Reform Programme are
subdivided and published by the 10 policy areas.40 The grids contain both updates
of the measures approved in preceding years, and new measures emerging during
the review of provisions going into effect between April 2016 and March 2017
The measures are thoroughly described in the grids, with respect to both
regulatory and financial details.41 The financial effects in the grids are stated in
terms of higher/lower revenue and higher/lower expenditure both for the State
budget and the public administrations and quantified with reference to the
related balances. Except for certain cases, the quantification of the impacts in
the grids highlights the measures’ costs and benefits for Italy’s public finances,
regardless of the resources to finance each measure. The following table
summarizes the impact on the State budget42 of the measures contained in the
grids, subdivided by area. For additional details about the measures, reference
should be made to Section II.3 of the National Reform Programme.
40 The grids and the ‘Guide to the interpretation of the grids’ are available online (only in the Italian
version) in the section of the 2017 EFD ‘NRP – Provisions organised by area of action (grids)’. 41 See ‘Guide to the interpretation of the grids’, ibidem. 42 This decision is mainly due to the significance of the central government in defining and implementing
the measures. In order to analyse the impacts in terms of net borrowing, reference should be made to the column ‘Impact on the public budget’ for each policy area.

III. NET BORROWING AND PUBLIC DEBT
MINISTERO DELL’ECONOMIA E DELLE FINANZE 61
TABLE III.9: FINANCIAL IMPACT OF MEASURES IN NRP GRIDS (in € mn)
2016 2017 2018 2019 2020
Containment of public expenditure and taxation
Higher expenditure 3 3,900 5,273 5,098 5,109
Higher revenue 0 7,981 11,101 11,011 10,344
Lower expenditure 0 1,569 2,234 3,751 19
Lower revenue 0 15,370 5,419 3,010 3,098
Administrative efficiency
Higher expenditure 0 171 61 58 54
Lower expenditure 0 6 6 3 0
Lower revenue 0 4 4 4 4
Infrastructure and development
Higher expenditure 400 2,089 3,668 3,834 3,328
Lower Expenditure 0 80 80 80 80
Lower revenue 0 10 79 93 97
Product markets and competition
Higher revenue 0 50 50 0 0
Higher expenditure 0 184 184 0 0
Labour and pensions
Higher expenditure 1,662 4,207 4,402 4,237 4,000
Higher revenue 0 34 55 73 101
Lower expenditure 0 100 50 0 0
Lower revenue 0 573 754 813 788
Innovation and human capital
Higher expenditure 4 321 1,518 1,588 1,442
Higher revenue 0 2,010 8 15 0
Lower expenditure 0 5 5 5 5
Lower revenue 0 12 78 143 13
Support to businesses
Higher expenditure 1,017 427 550 611 482
Higher revenue 0 381 1,519 352 446
Lower expenditure 0 8 186 33 0
Lower revenue 220 266 1,628 2,996 2,201
Energy and environment
Higher expenditure’ 51 358 557 592 356
Higher revenue 542 167 675 84 84
Lower expenditure 0 0 100 9 9
Lower revenue 0 138 1,513 1,603 1,624
Financial system
Higher expenditure 330 20,144 129 134 38
Higher revenue 224 202 175 144 112
Lower revenue 0 79 36 30 24
Federalism
Higher expenditure 0 101 1,472 1,757 1,757
Higher revenue 0 0 0 0 7,682
Lower Expenditure 0 5 0 0 0
Lower revenue 0 3 3 3 3
1) Net of imports included in Table E, exhibit to 2017 Budget Law.
Source: Analyses of the State General Accounting Department using data from technical reports (‘Annex No.3’) and
information reported in official documents. The figures exclude the resources of the cohesion and action
programmes, and the various funds earmarked for European initiatives.

ECONOMIC AND FINANCIAL DOCUMENT - SECTION I STABILITY PROGRAMME
62 MINISTERO DELL’ECONOMIA E DELLE FINANZE
III.5 TREND OF DEBT-TO-GDP RATIO
The trend of the debt-to-GDP ratio in the past few years is a confirmation
that recent public-finance policies have allowed for achieving a first, key
objective, that of essentially stabilising the ratio. In the 2015-2016 two-year
period, the ratio averaged just over 132 percent, growing annually by 0.5 percent
of GDP, after the average annual growth was approximately 4.9 percentage from
2008 to 2014.
The preliminary figure of 132.6 percent for 2016 is also the result of
statistical revisions to the 2014-2015 GDP figures that were made in March by
ISTAT,43 whereas the Bank of Italy did not make any significant changes to the
total debt stock for such years.44 As a result of the GDP revisions, the debt-to-GDP
ratio descended by 0.1 percentage points to 131.8 percent for 2014 and by 0.2
percentage points to 132.1 percent for 2015, compared with the final figures set
out in the EFD Update of September 2016. In both cases, the improvement is thus
attributed to an upward revision of GDP.
In 2016, the debt-to-GDP ratio was thus almost 0.6 percentage points of GDP45
above the 2015 level, which is a slight increase in line with the forecast contained
in the 2016 EFD Update and the 2017 DBP. On the one hand, nominal GDP for 2016
grew at a rate slightly above that reflected in last autumn’s forecasts; on the
other hand, the general government debt stock for 2016 rose over the 2015 level
by almost 0.1 percentage points less than what had been reflected in the
forecasts. The latter development is mainly the result of the Public Sector’s
borrowing requirement, which, at approximately 2.8 percent of GDP, was almost
0.4 percentage points below the forecast in the 2016 EFD Update and the 2017
DBP. The main factor serving as an offset to the trend of such requirement was
the increase in the Treasury’s available liquidity, which rose by approximately €8
billion between the end of 2015 and the end of 2016. Such increase is partly due
to the Treasury’s intentional decision to start off the year of 2017 with a
satisfactory liquidity reserve, considering the sizeable volume of securities
maturing, and partly due to the trend of the borrowing requirement, which was
lower than expected at year end, with the magnitude of the reduction becoming
evident when the debt securities issuance programme had already been
concluded. In addition to the Public Sector’s borrowing requirement, the other
factors influencing the trend of the debt (such as issuing discounts and revaluation
of securities indexed to inflation) were instead essentially in line with the
September forecasts, whereas the accounting reclassifications referable to
transactions in derivatives came in at values slightly below those in the forecasts,
partly due to the trend of the European swap curve in the final months of the
year.
43 See ISTAT press release ‘GDP and General Government Net Borrowing’ dated 1 March 2017. 44 See Bank of Italy Bulletin ‘Public finance: borrowing requirement and debt - January 2017’ dated 15
March 2017. 45 Any discrepancies in the comparison between levels are due to rounding.

III. NET BORROWING AND PUBLIC DEBT
MINISTERO DELL’ECONOMIA E DELLE FINANZE 63
FIGURE III.4: PUBLIC DEBT DETERMINANTS (% of GDP)
In 2017, the debt-to-GDP ratio is forecast to total 132.5 percent, thereby
confirming the turnaround estimated in the 2016 EFD Update and the 2017 DBP,
with an expected reduction of almost 0.2 percentage points46 in line with the
previous forecasts.
On the one hand, the Public Sector’s borrowing requirement for 2017 is
projected to total 3.5 percent of GDP, rising significantly over the 2.8 percent for
2016, including partly as a result of the measures announced to support the
banking system.47 In addition, the projected increase in inflation in Italy and in
Europe as a whole48 will also have an effect on the debt through i) higher interest
expenditure on securities with real yields (BTP€i and BTP Italia), and ii) the direct
revaluation of the debt due to inflation with respect to the stock of securities
outstanding. These effects will nonetheless be more than mitigated by three
factors: i) the reduction of the sizeable liquidity stock accumulated in 2016, equal
to approximately 0.7 percent of GDP, which will allow for issuing less debt; ii) the
revenue from privatisations, which should reach an amount equal to
approximately 0.3 percent of GDP in 2017, thus rising significantly over the
approximately 0.1 percent accrued in 2016; and iii) finally, the forecast of
nominal GDP in 2017 that is approximately 0.3 percent higher than that estimated
in the 2017 DBP.
A look at the debt determinants shows the start of the reduction of the debt-
to-GDP ratio in the first year in which the snow-ball effect is exceeded by the
46 Any discrepancies in the comparison between levels are due to rounding. 47 Decree-Law No. 237 of 23 December 2016, converted with Law No. 15 of 17 February 2017. 48 The reference here is to the Harmonised Index of Consumer Prices (HICP) for the Euro Area, used for the
indexing of the BTP€i, and to the ISTAT Consumer Price Index for Blue- and White-Collar Worker Households (FOI), used for the BTP Italia.
-8.0
-6.0
-4.0
-2.0
0.0
2.0
4.0
6.0
2015 2016 2017 2018 2019 2020
p.p
. o
f G
DP
Primary balance ( +=deficit) Interest expenditure Inflation effect
Real growth effect Stock-Flow Adjustment (SFA) Yearly change in debt-to-GDP

ECONOMIC AND FINANCIAL DOCUMENT - SECTION I STABILITY PROGRAMME
64 MINISTERO DELL’ECONOMIA E DELLE FINANZE
primary surplus. However, the reduction is minimal due to a stock-flow
component equal to almost one-half of the primary surplus.
The reduction of the debt-to-GDP ratio is estimated to continue into 2018,
when it should amount to 131.0 percent. The year-on-year improvement will be
mainly due to the substantial decline forecast for the Public Sector’s borrowing
requirement (a reduction of approximately 1.3 percentage points of GDP
compared with 2017) and nominal GDP growth of 2.7 percent. The new level of
the borrowing requirement, which is pegged at 2.1 percent of GDP, together with
the inflation-indexed component of the debt, are then more than offset by
revenue from privatisations (0.3 percent of GDP) and a further reduction in the
Treasury’s liquidity (approximately 0.1 percent of GDP). On the other hand,
although the stock-flow adjustment for 2018 should remain essentially in line with
that for 2017, the primary surplus is forecast to reach a level well above the snow-
ball effect, which instead contracts significantly due to the nominal GDP growth
and the virtual stabilisation of interest.
TABLE III.10: PUBLIC DEBT DETERMINANTS (% of GDP) (1)
2015 2016 2017 2018 2019 2020
Level (net of support) (2) 128.5 129.1 129.1 127.7 125.0 122.6
Impact of support (3) 3.5 3.5 3.4 3.3 3.2 3.1
Level (inclusive of support) (2) 132.1 132.6 132.5 131.0 128.2 125.7
Changes compared with the previous year 0.3 0.6 -0.2 -1.4 -2.9 -2.5
Factors determining changes in public debt
Primary surplus (accruals basis) -1.5 -1.5 -1.7 -2.5 -3.5 -3.8
Snow-ball effect 2.2 1.8 0.9 0.2 -0.1 0.3
Incl.: Interest (accruals basis) 4.1 4.0 3.9 3.7 3.7 3.8
Stock-flow adjustment -0.5 0.3 0.7 0.9 0.7 1.0
Incl.: Difference between cash and accruals 0.2 -0.2 0.4 0.3 0.5 0.7
Net accumulation of financial assets
(4) -0.1 0.4 0.7 0.3 0.1 0.0
Incl.: Privatisation proceeds -0.4 -0.1 -0.3 -0.3 -0.3 -0.3
Impact of debt valuation -0.1 -0.2 0.4 0.4 0.3 0.4
Other (5) -0.5 0.2 -0.7 -0.2 -0.2 -0.1
Memo item: Implicit interest rate on debt 3.2 3.1 3.0 2.9 2.9 3.0
1) Discrepancies, if any, are due to rounding.
2) Inclusive or net of Italy's portion of loans to Member States (bilateral or through the EFSF) and the ESM capital
contribution. As of 2016, the amount of such outflows was approximately €58.2 billion, inclusive of €43.9 billion
for bilateral loans and loans through the EFSF and €14.3 billion for the ESM programme (see Bank of Italy,
Supplement to the statistical bulletin: Public finance, borrowing and debt, 15 March 2017). The estimates include
proceeds from privatisations and additional financial income equal to 0.1 percent of GDP in 2016, and 0.3
percent of GDP per year during the 2017-2020 period. The estimates incorporate assumptions of a reduction of
the MEF’s liquidity stock for approximately 0.7 percent of GDP in 2017 and approximately 0.14 percent of GDP in
2018 and in 2019. The interest rate scenario used for the estimates is based on implicit forecasts derived from
the forward rates on Italian government securities with respect to the period for compiling this document.
3) Includes the effects of Italy’s contribution to support the Euro Area: contributions to the Greek Loan Facility
(GLF), EFSF and ESM.
4) Includes the effects of the contributions for the GLF and the ESM programme.
5) The other account, which is a residual account compared with the accounts above, includes: changes in the
MEF’s liquidity stock; statistical discrepancies; Eurostat reclassifications; contributions to support the Euro Area as
provided by the EFSF programme.
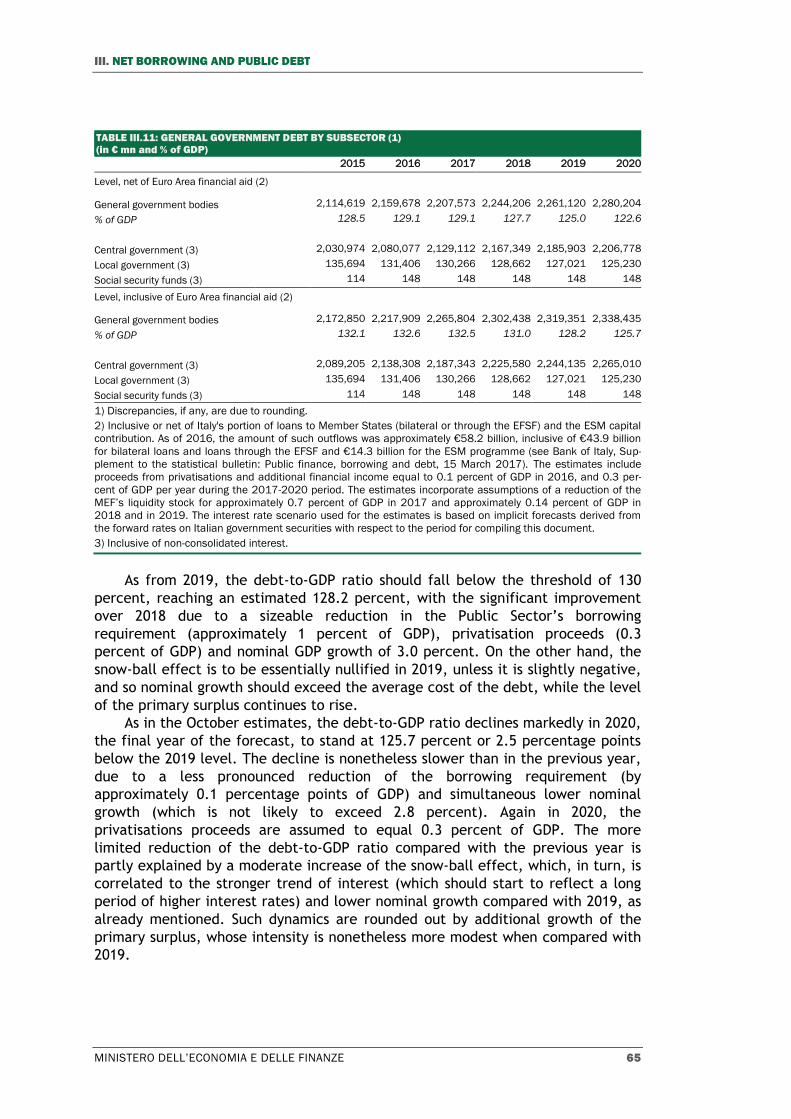
III. NET BORROWING AND PUBLIC DEBT
MINISTERO DELL’ECONOMIA E DELLE FINANZE 65
TABLE III.11: GENERAL GOVERNMENT DEBT BY SUBSECTOR (1)
(in € mn and % of GDP)
2015 2016 2017 2018 2019 2020
Level, net of Euro Area financial aid (2)
General government bodies 2,114,619 2,159,678 2,207,573 2,244,206 2,261,120 2,280,204
% of GDP 128.5 129.1 129.1 127.7 125.0 122.6
Central government (3) 2,030,974 2,080,077 2,129,112 2,167,349 2,185,903 2,206,778
Local government (3) 135,694 131,406 130,266 128,662 127,021 125,230
Social security funds (3) 114 148 148 148 148 148
Level, inclusive of Euro Area financial aid (2)
General government bodies 2,172,850 2,217,909 2,265,804 2,302,438 2,319,351 2,338,435
% of GDP 132.1 132.6 132.5 131.0 128.2 125.7
Central government (3) 2,089,205 2,138,308 2,187,343 2,225,580 2,244,135 2,265,010
Local government (3) 135,694 131,406 130,266 128,662 127,021 125,230
Social security funds (3) 114 148 148 148 148 148
1) Discrepancies, if any, are due to rounding.
2) Inclusive or net of Italy's portion of loans to Member States (bilateral or through the EFSF) and the ESM capital
contribution. As of 2016, the amount of such outflows was approximately €58.2 billion, inclusive of €43.9 billion
for bilateral loans and loans through the EFSF and €14.3 billion for the ESM programme (see Bank of Italy, Sup-
plement to the statistical bulletin: Public finance, borrowing and debt, 15 March 2017). The estimates include
proceeds from privatisations and additional financial income equal to 0.1 percent of GDP in 2016, and 0.3 per-
cent of GDP per year during the 2017-2020 period. The estimates incorporate assumptions of a reduction of the
MEF’s liquidity stock for approximately 0.7 percent of GDP in 2017 and approximately 0.14 percent of GDP in
2018 and in 2019. The interest rate scenario used for the estimates is based on implicit forecasts derived from
the forward rates on Italian government securities with respect to the period for compiling this document.
3) Inclusive of non-consolidated interest.
As from 2019, the debt-to-GDP ratio should fall below the threshold of 130
percent, reaching an estimated 128.2 percent, with the significant improvement
over 2018 due to a sizeable reduction in the Public Sector’s borrowing
requirement (approximately 1 percent of GDP), privatisation proceeds (0.3
percent of GDP) and nominal GDP growth of 3.0 percent. On the other hand, the
snow-ball effect is to be essentially nullified in 2019, unless it is slightly negative,
and so nominal growth should exceed the average cost of the debt, while the level
of the primary surplus continues to rise.
As in the October estimates, the debt-to-GDP ratio declines markedly in 2020,
the final year of the forecast, to stand at 125.7 percent or 2.5 percentage points
below the 2019 level. The decline is nonetheless slower than in the previous year,
due to a less pronounced reduction of the borrowing requirement (by
approximately 0.1 percentage points of GDP) and simultaneous lower nominal
growth (which is not likely to exceed 2.8 percent). Again in 2020, the
privatisations proceeds are assumed to equal 0.3 percent of GDP. The more
limited reduction of the debt-to-GDP ratio compared with the previous year is
partly explained by a moderate increase of the snow-ball effect, which, in turn, is
correlated to the stronger trend of interest (which should start to reflect a long
period of higher interest rates) and lower nominal growth compared with 2019, as
already mentioned. Such dynamics are rounded out by additional growth of the
primary surplus, whose intensity is nonetheless more modest when compared with
2019.

ECONOMIC AND FINANCIAL DOCUMENT - SECTION I STABILITY PROGRAMME
66 MINISTERO DELL’ECONOMIA E DELLE FINANZE
Net of the Italy’s share of the loans to Member States of the EMU (bilateral or
through the EFSF), and the capital contribution to the ESM, the final debt-to-GDP
ratio for 2016 is 129.1 percent of GDP, and it is estimated to fall to 122.6 percent
of GDP in 2020.
FIGURE III.5: TREND OF DEBT-TO-GDP RATIO (including and excluding loans to euro area countries)
III.6 THE DEBT RULE AND THE OTHER RELEVANT FACTORS
The debt rule was introduced as part of European economic governance with
the Six Pack, and was fully ratified at a national level with the law that provides
for including a balanced budget in the constitution (Law No. 243/2012). Based on
data reported for 2015, the debt rule became fully applicable for Italy in 2016,
thereby ending the three-year transition period following the closing of the
Excessive Deficit Procedure in 2012.
The rule provides that at least one of the following criteria is respected in
order to ensure that the debt-to-GDP ratio falls at an appropriate pace to the
threshold of 60 percent:
in the three years preceding the year of reference, the debt in excess of 60
percent of GDP is reduced by an average of one-twentieth (backward-looking
benchmark);
the excess of debt with respect to the first benchmark is attributable to the
economic cycle (using an indicator that shows the debt-to-GDP ratio that
would have been obtained if, for the preceding three years, the numerator
were to have been adjusted for the impact of the economic cycle and the
nominal GDP in the denominator were to have grown at the same pace as
potential GDP);
the correction occurs in the two years subsequent to the year of reference
(forward-looking benchmark).
95
100
105
110
115
120
125
130
135
2000 2002 2004 2006 2008 2010 2012 2014 2016 2018 2020
%
Debt-to-GDP ratio (gross)
Debt-to-GDP ratio (net)
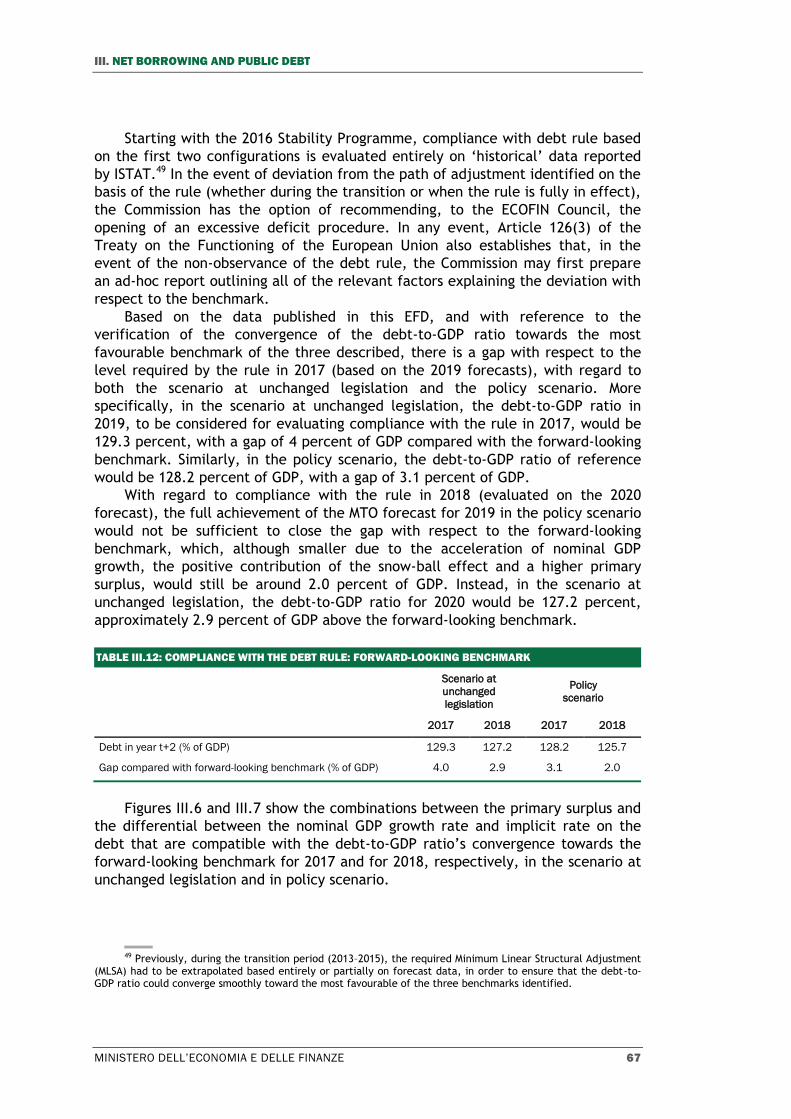
III. NET BORROWING AND PUBLIC DEBT
MINISTERO DELL’ECONOMIA E DELLE FINANZE 67
Starting with the 2016 Stability Programme, compliance with debt rule based
on the first two configurations is evaluated entirely on ‘historical’ data reported
by ISTAT.49 In the event of deviation from the path of adjustment identified on the
basis of the rule (whether during the transition or when the rule is fully in effect),
the Commission has the option of recommending, to the ECOFIN Council, the
opening of an excessive deficit procedure. In any event, Article 126(3) of the
Treaty on the Functioning of the European Union also establishes that, in the
event of the non-observance of the debt rule, the Commission may first prepare
an ad-hoc report outlining all of the relevant factors explaining the deviation with
respect to the benchmark.
Based on the data published in this EFD, and with reference to the
verification of the convergence of the debt-to-GDP ratio towards the most
favourable benchmark of the three described, there is a gap with respect to the
level required by the rule in 2017 (based on the 2019 forecasts), with regard to
both the scenario at unchanged legislation and the policy scenario. More
specifically, in the scenario at unchanged legislation, the debt-to-GDP ratio in
2019, to be considered for evaluating compliance with the rule in 2017, would be
129.3 percent, with a gap of 4 percent of GDP compared with the forward-looking
benchmark. Similarly, in the policy scenario, the debt-to-GDP ratio of reference
would be 128.2 percent of GDP, with a gap of 3.1 percent of GDP.
With regard to compliance with the rule in 2018 (evaluated on the 2020
forecast), the full achievement of the MTO forecast for 2019 in the policy scenario
would not be sufficient to close the gap with respect to the forward-looking
benchmark, which, although smaller due to the acceleration of nominal GDP
growth, the positive contribution of the snow-ball effect and a higher primary
surplus, would still be around 2.0 percent of GDP. Instead, in the scenario at
unchanged legislation, the debt-to-GDP ratio for 2020 would be 127.2 percent,
approximately 2.9 percent of GDP above the forward-looking benchmark.
TABLE III.12: COMPLIANCE WITH THE DEBT RULE: FORWARD-LOOKING BENCHMARK
Scenario at
unchanged
legislation
Policy
scenario
2017 2018 2017 2018
Debt in year t+2 (% of GDP) 129.3 127.2 128.2 125.7
Gap compared with forward-looking benchmark (% of GDP) 4.0 2.9 3.1 2.0
Figures III.6 and III.7 show the combinations between the primary surplus and
the differential between the nominal GDP growth rate and implicit rate on the
debt that are compatible with the debt-to-GDP ratio’s convergence towards the
forward-looking benchmark for 2017 and for 2018, respectively, in the scenario at
unchanged legislation and in policy scenario.
49 Previously, during the transition period (2013–2015), the required Minimum Linear Structural Adjustment
(MLSA) had to be extrapolated based entirely or partially on forecast data, in order to ensure that the debt-to-GDP ratio could converge smoothly toward the most favourable of the three benchmarks identified.

ECONOMIC AND FINANCIAL DOCUMENT - SECTION I STABILITY PROGRAMME
68 MINISTERO DELL’ECONOMIA E DELLE FINANZE
FIGURE III.6: MINIMUM LINEAR STRUCTURAL ADJUSTMENT AND DEBT RULE AT UNCHANGED LEGISLATION
Debt Rule in 2017
Debt Rule in 2018
Note: FLB = Forward-looking benchmark Source: MEF analyses with reference to 2017 Stability Programme data.
0.0
1.0
2.0
3.0
4.0
5.0
6.0
7.0
8.0
9.0
10.0
-2 -1.5 -1 -0.5 0 0.5
Pri
ma
ry b
ala
nce
(%
GD
P)
GDP growth - interest rate percentage values (y-i)
2019
2016
2018
Compliance with
benchmark
Non compliance
with benchmark
2017
0.0
1.0
2.0
3.0
4.0
5.0
6.0
7.0
8.0
9.0
-2 -1.5 -1 -0.5 0 0.5
Pri
ma
ry b
ala
nce
(%
GD
P)
GDP growth - interest rate percentage values (y-i)
2020
2016
2018
Compliance with
benchmark
Non compliance
with benchmark
2017
2019

III. NET BORROWING AND PUBLIC DEBT
MINISTERO DELL’ECONOMIA E DELLE FINANZE 69
FIGURE III.7: MINIMUM LINEAR STRUCTURAL ADJUSTMENT AND DEBT RULE IN POLICY SCENARIO
Debt Rule in 2017
Debt Rule in 2018
Note: FLB = Forward-looking benchmark Source: MEF analyses with reference to 2017 Stability Programme data.
The figures show that the debt-to-GDP ratio’s convergence towards the
benchmark is principally guided, in both scenarios, by the growing contribution of
the primary surplus, which, in the policy scenario, starts to grow as early as 2017
and then accelerates further and significantly in 2018, whereas the convergence
ensured by the contribution of the differential between nominal growth and the
1.0
2.0
3.0
4.0
5.0
6.0
7.0
8.0
9.0
10.0
-2 -1.5 -1 -0.5 0 0.5
Pri
ma
ry b
ala
nce
(%
GD
P)
GDP growth - interest rate percentage values (y-i)
2019
2016
2018
Compliance with
benchmark
Non compliance
with benchmark
2017
-3.0
-2.0
-1.0
0.0
1.0
2.0
3.0
4.0
5.0
6.0
7.0
8.0
-2 -1.5 -1 -0.5 0 0.5
Pri
ma
ry b
ala
nce
(%
GD
P)
GDP growth - interest rate percentage values (y-i)
2020
2016
2018
Compliance with
benchmark
Non compliance
with benchmark 2017
2019

ECONOMIC AND FINANCIAL DOCUMENT - SECTION I STABILITY PROGRAMME
70 MINISTERO DELL’ECONOMIA E DELLE FINANZE
implicit interest rate starts to decline gradually. In 2019-2020, the differential
between nominal GDP growth and the implicit interest rate seems to stabilise, no
longer contributing to convergence toward the benchmark, which is instead
ensured only by the contribution of the primary surplus.
In the event of deviation from the path of adjustment toward the 60 percent
threshold, European regulations provide that the European Commission may
evaluate the existence any relevant factors for the possible opening of an
excessive deficit procedure pursuant to Article 126(3) of the Treaty on the
Functioning of the European Union.
In February 2015, the European Commission detected an excessive deviation
with respect to the debt rule’s benchmark, and this would have required a
cumulative correction of the structural balance equal to 2.5 percentage points of
GDP for 2015. For this reason, a report50 was prepared in order to evaluate the
possible presence of relevant factors, and to decide on whether to open an
excessive deficit procedure. Following an accurate analysis, supported by several
technical considerations supplied by the Italian government,51 the Commission
concluded that it did not consider the gap with respect to the Italy’s MLSA
required by the debt rule as significant, and decided not to proceed with the
opening of an excessive deficit procedure. In particular, the following were
considered as mitigating factors: i) the respect of the preventive arm of the
Stability and Growth Pact; ii) adverse economic conditions (low growth and low
inflation), which, at the time, made it imprudent to implement a massive fiscal
effort that would have made it even more difficult to reduce the debt-to-GDP
ratio according to the stringent pace set by the debt rule, and, finally, iii) the
start-up of structural reforms capable of increasing potential growth and
therefore, the sustainability of the public debt in the medium term.
Again, in 2016, in light of the available data, the government deemed that
such relevant factors continued to exist and justified the deviation of the debt-to-
GDP ratio compared with the trend provided by the rule, publishing a new report
about relevant factors52 in May 2016. During the same month, the Commission
published its own assessment of compliance with the debt rule (Report 126.3),
confirming that the low inflation and the ambitious plan of structural reforms
continued to represent mitigating factors for the deviation with respect to the
benchmark, but also noting that the respect of the conditions for convergence
toward the MTO might be at risk. The opinion about the existence of relevant
50 In this regard, see the Report of the Commission pursuant to Article 126(3) of the Treaty, available at:
http://ec.europa.eu/economy_finance/economic_governance/sgp/pdf/30_edps/126-03_commission/2015-02-27_it_126-3_en.pdf.
51 In February 2015, the government produced an ad hoc report explaining the decision to deviate from the path of convergence toward the benchmark compatible with the debt rule, and cited numerous relevant factors, mainly regarding: the continuation of the effects of the economic crisis; the need to avoid the excessive fiscal consolidation (as required in order to observe the conditions established by the rule) that would further exacerbate the trend of the public debt in relation to GDP; the continuing risks of deflation that would have made the required reduction of the debt even more difficult and counterproductive; and, finally, the costs related to the implementation of an ambitious plan of structural reforms capable of favouring the recovery of potential growth and the sustainability of the debt in the medium term. For additional information, see the MEF’s report, 2015, ‘Relevant Factors influencing the debt dynamic in Italy’. (http://www.mef.gov.it/inevidenza/documenti/Note_on_relevant_factors_-_IT.pdf).
52http://www.tesoro.it/inevidenza/documenti/Relevant_Factor_Influencing_Debt_Developments_in_Italy.pdf

III. NET BORROWING AND PUBLIC DEBT
MINISTERO DELL’ECONOMIA E DELLE FINANZE 71
factors was therefore deferred to the fall, and namely, to the time when more
precise data on the budget measures were to be published. With the Opinion on
the Draft Budgetary Plan published in November 2016, the Commission concluded
that the fiscal effort planned by Italy did not appear sufficient to ensure the
respect of the debt rule in 2016 and 2017, announcing a new report about relevant
factors. In January 2017, the Italian government presented its own assessments
about the non-compliance with the debt rule,53 and reiterated, in particular, the
risks of deflation that make it difficult to reduce the debt-to-GDP ratio rapidly,
the uncertainty of the estimates of the output gap, and the growing costs of both
the structural reforms and the migrant crisis.
In the recent report about relevant factors published in February 2017,54 the
European Commission concluded that macroeconomic conditions, including low
inflation, continue to be unfavourable, but, at the same time, are gradually
improving. In addition, the report noted the pronounced slowdown in the pursuit
of the stimulus to economic growth through the adoption of structural reforms.
Finally, the report evidenced the risk that Italy’s public finances might not
conform in 2016 and 2017 with the adjustment required by the preventive arm of
the Stability and Growth Pact for converging towards the MTO. In view of such
evidence, the admission of the relevant factors for non-compliance with the debt
rule was conditioned upon the revival of the convergence toward the MTO through
the introduction of a package of corrective measures equivalent to at least 0.2
percent of GDP, which the government committed to presenting immediately
after this Document.
53 http://www.mef.gov.it/inevidenza/documenti/Italy_Relevant_Factors_February_2017.pdf. 54 https://ec.europa.eu/info/sites/info/files/com2017_106_en_act_part1_v6.pdf


MINISTERO DELL’ECONOMIA E DELLE FINANZE 73
IV. SENSITIVITY AND SUSTAINABILITY OF THE PUBLIC
FINANCES
IV.1 SHORT-TERM SCENARIOS
This section presents the sensitivity analysis of public-finance targets to
several macroeconomic shocks over the short-term horizon. The first part of this
section analyses the sensitivity of interest expenditure to shocks on the yield
curve. The next section shows how the debt-to-GDP ratio is affected by combined
shocks that simultaneously impact economic growth, the primary balance, and the
yield curve. This analysis is carried out through a stochastic simulation of the
debt-to-GDP ratio. Finally, the S0 indicator is defined to evaluate the overall risk
of fiscal stress for the public finances. Such indicator, which is constructed based
on the methodology introduced by the European Commission, supplies distinct
indications about the probability of a fiscal and/or macro-financial crisis in the
short term and, more precisely, during the year following the current one.
Sensitivity to interest rates
The effects of interest-rate changes on public finance mainly depend on the
current and future structure of the public debt. In particular, the mix by type of
instruments within the government securities stock in 2016 is a confirmation of
the trends of recent years, which, since 2013, have entailed a reduction of the
short-term components and an increase in the nominal components with a longer
residual life. In addition, compared with 2015, the variable-rate component
(CCTeu and CCT) essentially stabilised in 2016, with a further increase of
securities indexed to 6-month EURIBOR that more than offset the reduction of the
securities indexed to the 6-month BOT rate.1
The share of securities linked to the HICP,2 namely, European inflation,
remained stable compared with 2015, while weight of the BTP Italia, the
securities indexed to the FOI,3 net of tobacco, namely, Italian inflation, decreased
in 2016 compared with 2015, due to maturities of this instrument during the year,
which more than offset the volume of the two new issues. Finally, consistent with
the trends of recent years, the percentage of foreign securities kept declining
gradually, and this resulted from a volume of international private placements
that was less than the maturities in the segment.
During 2016, the issues of the medium-/long-term fixed-rate instruments
reinforced the already evident trend in 2015 of a reduction of 2-, 3- and 5-year
1 The final 6-month BOT came due in March 2016, and there are no new issues of this security planned. 2 Harmonised Index of Consumer Prices for the Euro Area. 3 Italian consumer price index for blue- and white-collar worker households

ECONOMIC AND FINANCIAL DOCUMENT - SECTION I STABILITY PROGRAMME
74 MINISTERO DELL’ECONOMIA E DELLE FINANZE
maturities and an increase in maturities of 7 years or more. With regard to
securities with a 10-year or longer maturity, the introduction of new maturities at
20 years and 50 years was particularly important, as it allowed for reducing
exposure to refinancing and interest-rate risks. The overall average life of all
government securities at 31 December 2016 was 6.76 years versus 6.52 years for
2015, while the average refixing period,4 the main indicator used for measuring
rate risk, went from 5.42 years at the end of 2015 to 5.66 years for 2016. The
financial duration of the entire stock of debt securities went from 5.48 years at
the end of 2015 to 5.54 years at the end of 2016.5
As far as refinancing risk is concerned, the 2016 issuance policy contributed
to achieving the objective of more uniform distribution of the maturities to be
refinanced in the next few years, thereby facilitating the future management of
the funding on the markets.
Instead, with reference to sensitivity of interest expenditures to changes in
the yield curve, in addition to the information stemming from the indicators
mentioned above, further results are presented simulating a shock to the
government securities yield curve and measuring its impact on interest
expenditures over the next four years.
The analysis is focused on the debt component represented by domestic
government securities, which accounted for approximately 97.44 percent of the
whole securities stock outstanding in December 2016. A shock of 100 basis points
was applied to such aggregate across the entire yield curve, taking into account
both its current mix and the future trend, as derived from issuance and
management decisions.
Against such assumptions, the ratio of interest expenditure-to-GDP rises by
0.13 percent in the first year, 0.28 percent in the second year, 0.40 percent in the
third year, and 0.50 percent in the fourth year. These results are in line with
those presented in the 2016 EFD, and they confirm that a significant, permanent
market shock has a very mild impact on the net borrowing despite the magnitude
(in absolute terms) of the government securities stock outstanding in 2016.
In 2016, general government interest expenditure, as calculated based on the
ESA 2010 accruals criterion, continued on the decline that started in 2013, and
ended the year at just under €66.3 billion, for a reduction of approximately €1.8
billion compared with 2015. In terms of GDP, the aggregate fell to 4 percent in
2016, declining by 0.1 percentage points compared with the previous year.
Such reduction mainly refers to central government: in particular, the portion
of interest expenditure referable to government securities decreased by
approximately €2.5 billion, while the component related to instruments other than
securities was higher, mainly due to the amounts held at the State Treasury by
entities that are not part of the public administration, with such expenditure
rising by approximately €800 million, partly due to a change in the criteria for
paying interest on such balances. As in 2015, the reduction in the interest
4 The average refixing period (ARP) measures the average timing with which the debt incorporates market
rates. For the zero-coupon securities or those with a fixed coupon, the ARP corresponds to the residual life. For securities with variable coupons, the ARP corresponds to the time remaining to the fixing of the next coupon.
5 More in-depth analysis of public debt management and the trend of the markets in 2016 will be provided in the Annual Report on the Public Debt that is to be published in next few months.

IV. SENSITIVITY AND SUSTAINABILITY OF THE PUBLIC FINANCES
MINISTERO DELL’ECONOMIA E DELLE FINANZE 75
expenditure on government securities in 2016 is mostly attributable to the
decrease in the rates realised on placement of the debt, at least through August,
but it is also due to low inflation, both in Italy and elsewhere in Europe, when
considering the impact on inflation-indexed securities (BTP€i and BTP Italia).
FIGURE IV.1: INTEREST EXPENDITURE AS PERCENTAGE OF GDP AND WEIGHTED AVERAGE COST AT ISSUANCE
The weighted average cost of the new issues also decreased in 2016, going
from 0.70 percent for 2015 to 0.55 percent. The decrease in the rates upon
issuance was such that it allowed the placement of almost all BOT and CTZ issues
at negative rates. On the remainder of the instruments, the rate reduction was
continuous from the start of the year until August, a period when a significant
portion of the annual issues was offered to the market. On the other hand, the
decrease of the average cost at issuance was achieved, even despite the sizeable
increase in longer term issues when compared with previous years: in 2016,
approximately 12 percent of the total placed on the market entailed instruments
with a maturity of more than 10 years, versus approximately 9 percent for 2015
and 6 percent on average for the 2013-2014 period. The commitment in offering
long-term instruments was mainly driven by the aim to capitalise on the rates at
issuance whose very low level has not been seen in the past for these maturities.
3.3
5
4.7
9
4.3
3
3.7
4
2.7
2
2.6
6
2.4
7
3.3
2
4.1
4
4.0
9
2.1
8
2.1
0
3.6
1
3.1
1
2.0
8
1.3
5
0.7
0
0.5
5
0
1
2
3
4
5
6
7
8
1999 2000 2001 2002 2003 2004 2005 2006 2007 2008 2009 2010 2011 2012 2013 2014 2015 2016

ECONOMIC AND FINANCIAL DOCUMENT - SECTION I STABILITY PROGRAMME
76 MINISTERO DELL’ECONOMIA E DELLE FINANZE
FIGURE IV.3: BTP-BUND YIELD DIFFERENTIAL: 10-YEAR BENCHMARK
The results of the issuance policy during 2016 were obtained in a market
environment that included phases of extreme volatility and turbulence. Looking at
i) the trend of market yields on the outstanding securities with medium-/long-
term maturities (Figure IV.2), and ii) the trend of the differential with German
securities (Figure IV.3), it is possible to note that the market environment was the
most difficult in the final quarter of the year, particularly for the effect of the
expectations on the Italian constitutional referendum in early December. In such
period, the rates at the midpoint and long end of the Italian yield curve
experienced a less-than-negligible increase in the months of October and
November (part of which was eventually reversed), accompanied by a
FIGURE IV.2: TREND OF GOVERNMENT SECURITIES YIELDS: 1-, 5- AND 10-YEAR MATURITIES
60
90
120
150
180
dic-14 gen-15 mar-15 mag-15 lug-15 set-15 ott-15 dic-15 feb-16
-0.4
0.1
0.6
1.1
1.6
2.1
2.6
dic
-15
ge
n-1
6
ma
r-1
6
ma
g-1
6
lug-1
6
se
t-1
6
ott
-16
dic
-16
feb
-17
10y 1y 5y

IV. SENSITIVITY AND SUSTAINABILITY OF THE PUBLIC FINANCES
MINISTERO DELL’ECONOMIA E DELLE FINANZE 77
simultaneous expansion of the spread against German government securities. Such
events did not, however, have any substantial impact on the conditions for the
overall cost of financing for the year, and this is due to i) the fact that the issues
planned for the final quarter of the year are normally less than in other quarters,
and ii) the existence of abundant liquidity, which allowed for reformulating the
offering programme in those months so as to minimise the impact of market
conditions that had become more onerous.
The policy-scenario estimates of interest expenditure (as calculated based on
the ESA 2010 accruals criterion) for the next four-year period were carried out on
the basis of an scenario developed by starting from the expected rates implied by
the Italian yield curve during the period preceeding the preparation of this
Document. Such scenario contemplates a gradual increase of rates across all
maturities, with a simultaneous flattening of the yield curve, due to more
pronounced increases in short-term rates vis-à-vis medium-/long-term rates. The
assumptions about inflation in Italy and in Europe, which are needed for
estimating the impact on interest expenditure stemming from real securities
(BTP€i and BTP Italia), are consistent with the policy-scenario macroeconomic
framework.
Aside from ensuring the refinancing of maturing securities, the planned issues
cover the State Sector’s cash requirement whose profile declines over the years,
going from 3.6 percent of GDP of 2017 to 1.1 percent of GDP of the 2020. The
interest expenditure-to-GDP ratio should amount to around 3.9 percent of GDP in
2017, decreasing from 4 percent in 2016, whereas the ratio should stabilise around
3.7 percent of GDP in 2018 and 2019, before rising to roughly 3.8 percent of GDP
during the final year of the forecast period. Therefore, despite a higher expected
cost of new issues, the trend of the interest expenditure in relation to GDP should
be rather limited, due to i) the expected improvement of the cash balances to be
financed, and ii) the current and future mix of the stock of securities outstanding,
which, as indicated above, tends to fully dilute over time the impact on public
finances due to an increase in the cost of financing on the market. Even though
the profile of the future issues used for preparing the estimates does not fully
reflect that of 2016 (which, as described, entailed a much higher-than-average
percentage of long-term placements), the profile of the issues for the next few
years was nonetheless assumed to be such as to ensure the consolidation of the
results obtained in terms of exposure to the main market risks.
Stochastic simulations of the trend of the debt
The projections of the debt-to-GDP ratio within the policy scenario were
subjected to several stochastic simulations in order to evaluate jointly i) the
uncertainty built into the forecasts in relation to the yield curve and economic
growth, and ii) the volatility with respect to primary balances. The simulations of
the trend of the debt-to-GDP ratio under the policy scenario have been carried
out using the Montecarlo method, by applying shocks to interest rates and nominal
growth based on the historical volatility of the short- and long-term yields and of
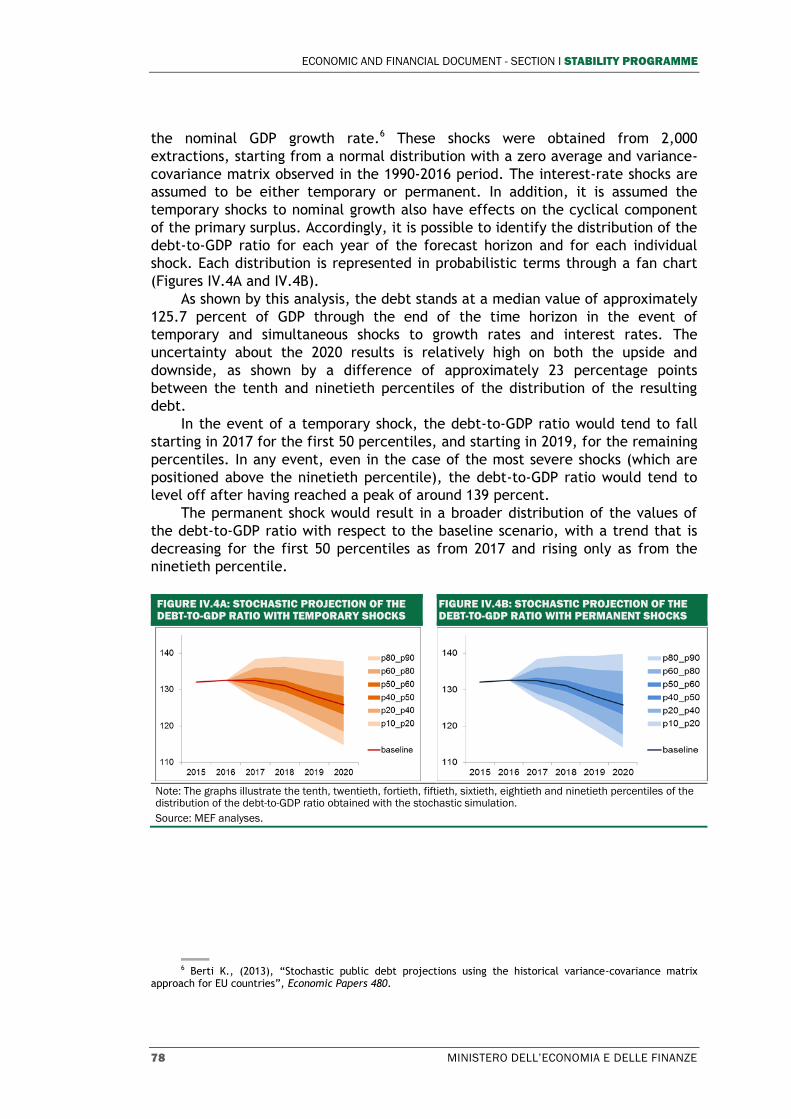
ECONOMIC AND FINANCIAL DOCUMENT - SECTION I STABILITY PROGRAMME
78 MINISTERO DELL’ECONOMIA E DELLE FINANZE
the nominal GDP growth rate.6 These shocks were obtained from 2,000
extractions, starting from a normal distribution with a zero average and variance-
covariance matrix observed in the 1990-2016 period. The interest-rate shocks are
assumed to be either temporary or permanent. In addition, it is assumed the
temporary shocks to nominal growth also have effects on the cyclical component
of the primary surplus. Accordingly, it is possible to identify the distribution of the
debt-to-GDP ratio for each year of the forecast horizon and for each individual
shock. Each distribution is represented in probabilistic terms through a fan chart
(Figures IV.4A and IV.4B).
As shown by this analysis, the debt stands at a median value of approximately
125.7 percent of GDP through the end of the time horizon in the event of
temporary and simultaneous shocks to growth rates and interest rates. The
uncertainty about the 2020 results is relatively high on both the upside and
downside, as shown by a difference of approximately 23 percentage points
between the tenth and ninetieth percentiles of the distribution of the resulting
debt.
In the event of a temporary shock, the debt-to-GDP ratio would tend to fall
starting in 2017 for the first 50 percentiles, and starting in 2019, for the remaining
percentiles. In any event, even in the case of the most severe shocks (which are
positioned above the ninetieth percentile), the debt-to-GDP ratio would tend to
level off after having reached a peak of around 139 percent.
The permanent shock would result in a broader distribution of the values of
the debt-to-GDP ratio with respect to the baseline scenario, with a trend that is
decreasing for the first 50 percentiles as from 2017 and rising only as from the
ninetieth percentile.
FIGURE IV.4A: STOCHASTIC PROJECTION OF THE DEBT-TO-GDP RATIO WITH TEMPORARY SHOCKS
FIGURE IV.4B: STOCHASTIC PROJECTION OF THE DEBT-TO-GDP RATIO WITH PERMANENT SHOCKS
Note: The graphs illustrate the tenth, twentieth, fortieth, fiftieth, sixtieth, eightieth and ninetieth percentiles of the distribution of the debt-to-GDP ratio obtained with the stochastic simulation.
Source: MEF analyses.
6 Berti K., (2013), “Stochastic public debt projections using the historical variance-covariance matrix
approach for EU countries”, Economic Papers 480.

IV. SENSITIVITY AND SUSTAINABILITY OF THE PUBLIC FINANCES
MINISTERO DELL’ECONOMIA E DELLE FINANZE 79
Overall analysis of fiscal risks in the short term
The S0 indicator was introduced by the European Commission in its
sustainability analysis, so as to identify the risks related to fiscal sustainability in
the short term, namely, in the year subsequent to the current one. The method
used for calculating S0 is different from that used for identifying risks in the
medium/long term, as described below; S0 does not actually measure any fiscal
gap, but it is instead a composite probability indicator constructed from a broad
range of fiscal and financial variables, which, in the past, proved to have
signalling power with respect to situations of fiscal stress (early warning).
In particular, the analysis is based on the signal-approach statistical
methodology applied to 25 variables, subdivided into two sub-groups: fiscal and
macro-financial variables. The method developed by the European Commission7
allows for endogenously determining the overall risk thresholds and the two sub-
indices (fiscal and macro-financial). The total value of the S0 indicator together
with that of the sub-indices, when compared with the respective thresholds, can
be used for measuring the probability of an imminent crisis. In particular, an S0
value above the threshold points to a potential risk in the short term, while sub-
indices values above the respective thresholds indicate a risk concentrated,
respectively, in the fiscal or macro-financial areas. If one of the sub-indices
indicates a risk, but the S0 indicator is kept above the threshold, it means that the
risk in the short term is not particularly high.
The methodology and database supporting the S0 indicator were updated with
the publication of the Debt Sustainability Monitor in January 2017, with the S0
used for this document being different from that for past planning documents. The
revision of S0 entailed the following: 1) the statistical sources used for some
variables were modified; 2) the series of events of fiscal stress used as the basis
for calculating the respective thresholds was extended to 2015;8 and 3) three
variables (two regarding population ageing in the fiscal sub-component and one
regarding the debt of the financial companies in the macro-financial sub-
component) previously included in the analysis were eliminated (since the
signalling power of such variables was deemed insufficiently robust for the
purpose of providing early warnings of stress events).
As shown by Figure IV.5, the overall fiscal risk in the short term is essentially
limited, as was the case for 2016. The overall index stands at 0.42, and it remains
below the threshold of 0.46 (with any value over the threshold indicating the
strong probability of the occurrence of a crisis in the year following that
analysed). The fiscal sub-component amounts to 0.44, which is above the
threshold of 0.36 and indicates a risk in the short term; the macro-financial
component does not give any critical indications, and is equal to 0.40 (below the
threshold of 0.49). The values for 2016 are not comparable with those for 2015
since the correction made to various threshold values and the elimination of three
variables previously employed have altered the trend of the indicator, and have
increased the relative weighting of the variables that, in the Italian case, already
7 Berti, K., Salto, M. and Lequien, M., (2012), “An early-detection index of fiscal stress for EU countries”,
European Economy Economic Papers No. 475. 8 The thresholds are therefore now calculated with reference to fiscal stress events from 1970 until 2015.
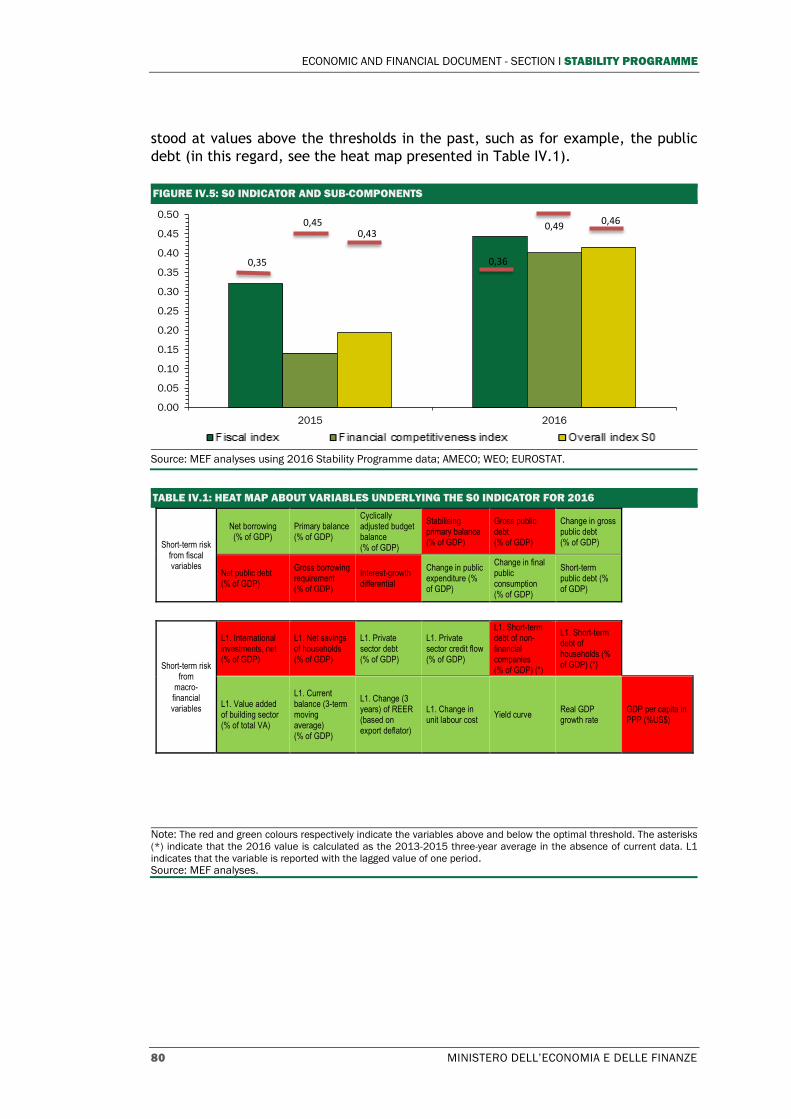
ECONOMIC AND FINANCIAL DOCUMENT - SECTION I STABILITY PROGRAMME
80 MINISTERO DELL’ECONOMIA E DELLE FINANZE
stood at values above the thresholds in the past, such as for example, the public
debt (in this regard, see the heat map presented in Table IV.1).
FIGURE IV.5: S0 INDICATOR AND SUB-COMPONENTS
Source: MEF analyses using 2016 Stability Programme data; AMECO; WEO; EUROSTAT.
TABLE IV.1: HEAT MAP ABOUT VARIABLES UNDERLYING THE S0 INDICATOR FOR 2016
Short-term risk from fiscal variables
Net borrowing (% of GDP)
Primary balance (% of GDP)
Cyclically adjusted budget balance (% of GDP)
Stabilising primary balance (% of GDP)
Gross public debt (% of GDP)
Change in gross public debt (% of GDP)
Net public debt (% of GDP)
Gross borrowing requirement (% of GDP)
Interest-growth differential
Change in public expenditure (% of GDP)
Change in final public consumption (% of GDP)
Short-term public debt (% of GDP)
1 1 0 0 1 1
Short-term risk from
macro-financial variables
L1. International investments, net (% of GDP)
L1. Net savings of households (% of GDP)
L1. Private sector debt (% of GDP)
L1. Private sector credit flow (% of GDP)
L1. Short-term debt of non-financial companies (% of GDP) (*)
L1. Short-term debt of households (% of GDP) (*)
L1. Value added of building sector (% of total VA)
L1. Current balance (3-term moving average) (% of GDP)
L1. Change (3 years) of REER (based on export deflator)
L1. Change in unit labour cost
Yield curve Real GDP growth rate
GDP per capita in PPP (%US$)
Note: The red and green colours respectively indicate the variables above and below the optimal threshold. The asterisks
(*) indicate that the 2016 value is calculated as the 2013-2015 three-year average in the absence of current data. L1
indicates that the variable is reported with the lagged value of one period. Source: MEF analyses.
0.00
0.05
0.10
0.15
0.20
0.25
0.30
0.35
0.40
0.45
0.50
2015 2016
Sotto Indicatore fiscale Indicatore di competitività finanziaria Indicatore complessivo S0
0,35
0,45 0,43
0,36
0,49 0,46

IV. SENSITIVITY AND SUSTAINABILITY OF THE PUBLIC FINANCES
MINISTERO DELL’ECONOMIA E DELLE FINANZE 81
IV.2 MEDIUM-TERM SCENARIOS
This section presents deterministic forecast scenarios for the debt-to-GDP
ratio in the medium term. The objective is to extrapolate, over a horizon
extending to 2028, the debt-to-GDP ratio under differing assumptions that
concurrently revise GDP growth, the yield curve, and the primary budget
balances.
The debt-to-GDP ratio is projected over the medium term using a
deterministic model, by assuming the mix and structure-by-maturity of the debt
stock used in this EFD as the starting point. In all of the scenarios, the projections
of the debt-to-GDP ratio are carried out by endogenous estimation of the implicit
interest rate, which, in turn, considers assumptions about nominal GDP growth,
the assumptions on the yield curve as well as the results on the primary surplus.
The alternative scenarios allow certain interactions between macroeconomic
variables so that, for example, lower growth rates are matched with lower
primary surpluses, and that the lower growth rates are associated with higher
borrowing costs.
These medium-term simulations include:
A baseline scenario that incorporates the GDP and potential GDP growth rates
of the 2017 EFD macroeconomic policy scenario for the years of 2017-2020.
For the years subsequent to 2020, consistent with the T+10 methodology used
by the European Commission and discussed by the Economic Policy
Committee-Output Gap Working Group (EPC-OGWG), the potential GDP
growth rate is projected on the basis of the production function model, by
extrapolating the variables related to individual productive factors with
simple statistical techniques or assuming that they converge toward
structural parameters, such as NAWRU anchor, which converges to 9.7
percent (Table IV.2).9 Starting from 2020, the output gap is closed in the
three years thereafter. Also, as from 2020, the yield curve is held constant
until the end of the projections horizon, while the growth rate of the GDP
deflator converges to 2.0 percent in 2023. In addition, on the basis of
unchanged policies, the structural primary balance in 2020 is held constant at
the reference level of 3.8 percent of GDP until 2028.
A lower growth scenario in which it is assumed that, over the period 2017-
2020, GDP growth is reduced by 0.5 percentage points each year vis-à-vis the
baseline.10 The potential GDP for 2017-2020 is obtained by applying the
method agreed at a European level.11 From 2020 to 2028, the NAWRU
converges to a value that is 1.5 percentage points higher than that the anchor
identified in the baseline scenario, while Total Factor Productivity (TFP)
converges toward a growth rate of near zero (0.05 percent). The output gap
9 For further details about the methods for convergence to the structural values, see the Methodological
Note provided as an exhibit to Section III.3 (Italian version only). 10 The lower growth scenario over the 2017-2020 horizon is obtained by starting from the macroeconomic
policy scenario in the 2017 EFD and assuming a slowdown of the global economy (both highly industrialised and emerging countries) with effects on international trade. The Italian economy would have less growth of exports and investments. The poorer prospects for the labour market would contribute to raising the unemployment rate.
11 In this regard, see the Methodological Note provided as an exhibit to Section III.3 (Italian version only).

ECONOMIC AND FINANCIAL DOCUMENT - SECTION I STABILITY PROGRAMME
82 MINISTERO DELL’ECONOMIA E DELLE FINANZE
is closed on a linear basis from 2020 in the next three years. Given
expectations of lower real growth of the Italian economy and concerns about
the sustainability of the public finances, the yield curve for 2017-2019
experiences a sudden increase of approximately 100 basis points over the
level of the curve in the baseline scenario. This increase is gradually
reabsorbed as of 2020, with the yields falling back to those in the baseline
scenario in 2021. For effect of the lower growth, the primary surplus12
experiences a corresponding decrease in 2017-2020, whereas it is held
constant at its structural level thereafter until the end of the forecast
horizon. The growth rate of the GDP deflator converges to 2.0 percent in
2023.
A higher growth scenario in which it is assumed that GDP growth increases by
0.5 percentage points with respect to the baseline scenario for the 2017-2020
period.13 The potential GDP for 2017-2020 is obtained by applying the
production function agreed at a European level. From 2020 and by the end of
2028, the NAWRU converges to a value that is 1.5 percentage points below
that in the baseline scenario, while Total Factor Productivity (TFP) converges
toward the average pre-crisis values (0.5 percent). The output gap is closed
on a linear basis as from 2020 to 2023. At the end of the ECB’s Quantitative
Easing Programme in 2018, thanks to higher real growth experienced by Italy,
the yield curve shifts downward by 50 points before converging to the curve
in the baseline scenario in 2021. For effect of the higher growth, the primary
surplus experiences a corresponding increase in 2017-2020, whereas it is held
constant at its structural level thereafter until the end of the forecast
horizon. The growth rate of the GDP deflator converges at 2.0 percent in
2023.
Table IV.2 illustrates more in detail the characteristics of the shocks applied
to the main macroeconomic and public-finance variables underlying the trend of the debt-to-GDP ratio.
12 For additional details about the methodology for deriving the alternative series of the primary surplus in
the high and low growth scenarios, see the Methodological Note provided as an exhibit to Section III.2 of the 2015 EFD (Italian version only).
13 Mirroring the low-growth scenario, the high-growth scenario assumes more robust growth of the global economy (both highly industrialised and emerging countries) and better performance of international trade. The Italian economy would enjoy higher growth of exports and investments. The better prospects for the labour market would contribute to reducing the unemployment rate.
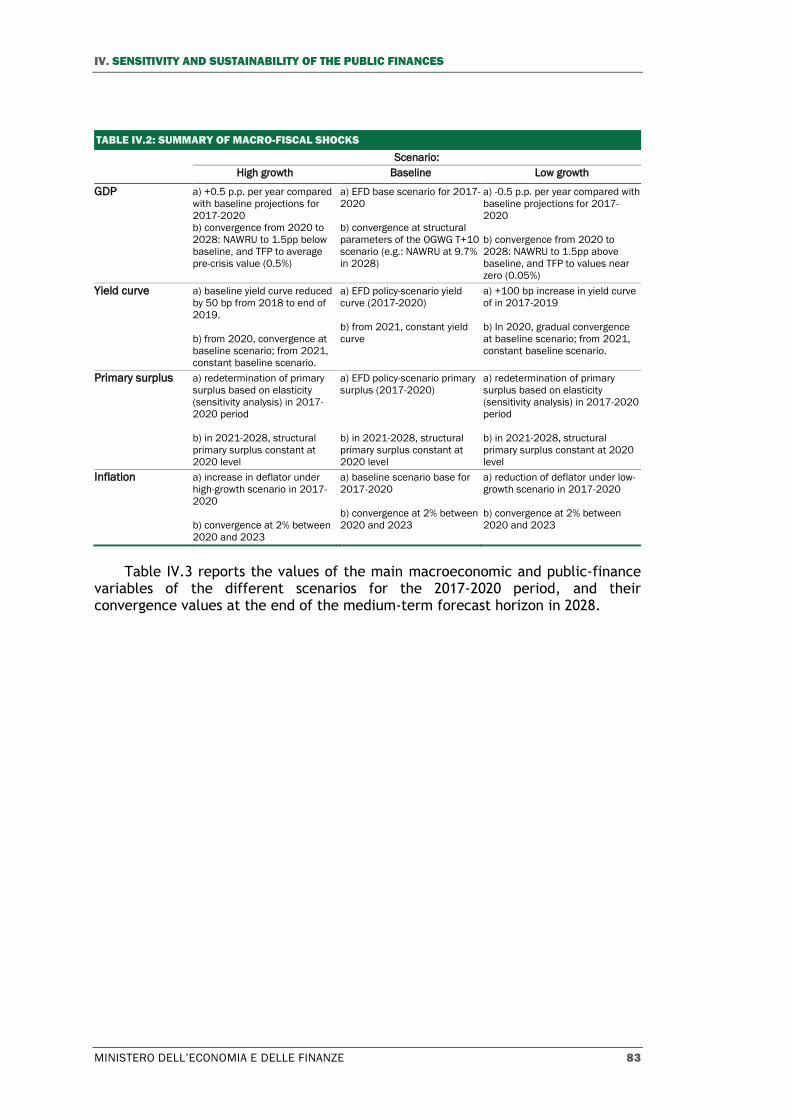
IV. SENSITIVITY AND SUSTAINABILITY OF THE PUBLIC FINANCES
MINISTERO DELL’ECONOMIA E DELLE FINANZE 83
TABLE IV.2: SUMMARY OF MACRO-FISCAL SHOCKS
Scenario:
High growth Baseline Low growth
GDP a) +0.5 p.p. per year compared
with baseline projections for
2017-2020
b) convergence from 2020 to
2028: NAWRU to 1.5pp below
baseline, and TFP to average
pre-crisis value (0.5%)
a) EFD base scenario for 2017-
2020
b) convergence at structural
parameters of the OGWG T+10
scenario (e.g.: NAWRU at 9.7%
in 2028)
a) -0.5 p.p. per year compared with
baseline projections for 2017-
2020
b) convergence from 2020 to
2028: NAWRU to 1.5pp above
baseline, and TFP to values near
zero (0.05%)
Yield curve a) baseline yield curve reduced
by 50 bp from 2018 to end of
2019.
b) from 2020, convergence at
baseline scenario; from 2021,
constant baseline scenario.
a) EFD policy-scenario yield
curve (2017-2020)
b) from 2021, constant yield
curve
a) +100 bp increase in yield curve
of in 2017-2019
b) In 2020, gradual convergence
at baseline scenario; from 2021,
constant baseline scenario.
Primary surplus a) redetermination of primary
surplus based on elasticity
(sensitivity analysis) in 2017-
2020 period
b) in 2021-2028, structural
primary surplus constant at
2020 level
a) EFD policy-scenario primary
surplus (2017-2020)
b) in 2021-2028, structural
primary surplus constant at
2020 level
a) redetermination of primary
surplus based on elasticity
(sensitivity analysis) in 2017-2020
period
b) in 2021-2028, structural
primary surplus constant at 2020
level
Inflation a) increase in deflator under
high-growth scenario in 2017-
2020
b) convergence at 2% between
2020 and 2023
a) baseline scenario base for
2017-2020
b) convergence at 2% between
2020 and 2023
a) reduction of deflator under low-
growth scenario in 2017-2020
b) convergence at 2% between
2020 and 2023
Table IV.3 reports the values of the main macroeconomic and public-finance
variables of the different scenarios for the 2017-2020 period, and their convergence values at the end of the medium-term forecast horizon in 2028.
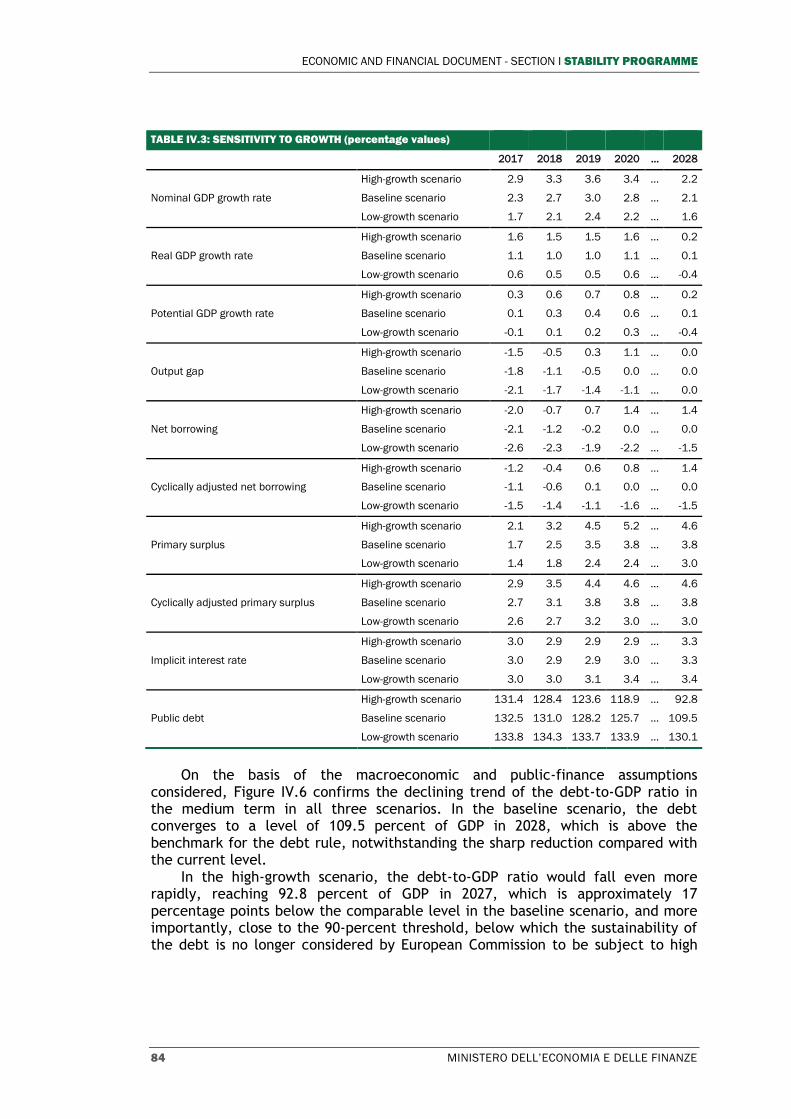
ECONOMIC AND FINANCIAL DOCUMENT - SECTION I STABILITY PROGRAMME
84 MINISTERO DELL’ECONOMIA E DELLE FINANZE
TABLE IV.3: SENSITIVITY TO GROWTH (percentage values)
2017 2018 2019 2020 … 2028
High-growth scenario 2.9 3.3 3.6 3.4 … 2.2
Nominal GDP growth rate Baseline scenario 2.3 2.7 3.0 2.8 … 2.1
Low-growth scenario 1.7 2.1 2.4 2.2 … 1.6
High-growth scenario 1.6 1.5 1.5 1.6 … 0.2
Real GDP growth rate Baseline scenario 1.1 1.0 1.0 1.1 … 0.1
Low-growth scenario 0.6 0.5 0.5 0.6 … -0.4
High-growth scenario 0.3 0.6 0.7 0.8 … 0.2
Potential GDP growth rate Baseline scenario 0.1 0.3 0.4 0.6 … 0.1
Low-growth scenario -0.1 0.1 0.2 0.3 … -0.4
High-growth scenario -1.5 -0.5 0.3 1.1 … 0.0
Output gap Baseline scenario -1.8 -1.1 -0.5 0.0 … 0.0
Low-growth scenario -2.1 -1.7 -1.4 -1.1 … 0.0
High-growth scenario -2.0 -0.7 0.7 1.4 … 1.4
Net borrowing Baseline scenario -2.1 -1.2 -0.2 0.0 … 0.0
Low-growth scenario -2.6 -2.3 -1.9 -2.2 … -1.5
High-growth scenario -1.2 -0.4 0.6 0.8 … 1.4
Cyclically adjusted net borrowing Baseline scenario -1.1 -0.6 0.1 0.0 … 0.0
Low-growth scenario -1.5 -1.4 -1.1 -1.6 … -1.5
High-growth scenario 2.1 3.2 4.5 5.2 … 4.6
Primary surplus Baseline scenario 1.7 2.5 3.5 3.8 … 3.8
Low-growth scenario 1.4 1.8 2.4 2.4 … 3.0
High-growth scenario 2.9 3.5 4.4 4.6 … 4.6
Cyclically adjusted primary surplus Baseline scenario 2.7 3.1 3.8 3.8 … 3.8
Low-growth scenario 2.6 2.7 3.2 3.0 … 3.0
High-growth scenario 3.0 2.9 2.9 2.9 … 3.3
Implicit interest rate Baseline scenario 3.0 2.9 2.9 3.0 … 3.3
Low-growth scenario 3.0 3.0 3.1 3.4 … 3.4
High-growth scenario 131.4 128.4 123.6 118.9 … 92.8
Public debt Baseline scenario 132.5 131.0 128.2 125.7 … 109.5
Low-growth scenario 133.8 134.3 133.7 133.9 … 130.1
On the basis of the macroeconomic and public-finance assumptions considered, Figure IV.6 confirms the declining trend of the debt-to-GDP ratio in the medium term in all three scenarios. In the baseline scenario, the debt converges to a level of 109.5 percent of GDP in 2028, which is above the benchmark for the debt rule, notwithstanding the sharp reduction compared with the current level.
In the high-growth scenario, the debt-to-GDP ratio would fall even more rapidly, reaching 92.8 percent of GDP in 2027, which is approximately 17 percentage points below the comparable level in the baseline scenario, and more importantly, close to the 90-percent threshold, below which the sustainability of the debt is no longer considered by European Commission to be subject to high

IV. SENSITIVITY AND SUSTAINABILITY OF THE PUBLIC FINANCES
MINISTERO DELL’ECONOMIA E DELLE FINANZE 85
risk in the medium term.14 In this case, Italy would comply with the forward-looking debt rule in both 2017 and 2018 (based on the 2019 and 2020 forecasts).
In the low-growth scenario, instead, the debt-to-GDP ratio would continue to fall, but at a much slower pace. The ratio would be equal to 130.1 percent in 2028, which is approximately 20 percentage points above the baseline scenario. With the lower growth scenario, the debt rule would never be complied with during the projection period.
FIGURE IV.6: MEDIUM-TERM FORECAST OF DEBT-TO-GDP RATIO IN HIGH AND LOW GROWTH SCENARIOS
Source: MEF analysis.
IV.3 LONG-TERM SCENARIOS
This section presents the results of the analysis of medium-/long-term debt
sustainability through the updating of the projections of age-related expenditure
and the traditional sustainability indicators. The timeline of reference is extended
out to 2060 on the basis of the methodology agreed within the Economic Policy
Committee – Working Group on Ageing (EPC-WGA), which benefits from Eurostat's
demographic projections (EUROPOP2013).
The impact of population ageing on fiscal sustainability
The medium-/long-term projections of public expenditure for pensions,15
healthcare, Long Term Care (LTC), social safety nets, and education have been
14 In this regard, see European Commission, 2016, Fiscal Sustainability Report 2015, Institutional Paper 018. 15The projections are based on the assumption that the early retirement loan program guaranteed by
future pension benefit streams (the so-called market APE) is qualified and classified in the national accounts as a
75
85
95
105
115
125
135
145
2017 2018 2019 2020 2021 2022 2023 2024 2025 2026 2027 2028
Debt/GDP Baseline scenario
Debt/GDP Optimistic scenario
Debt/GDP Pessimistic scenario

ECONOMIC AND FINANCIAL DOCUMENT - SECTION I STABILITY PROGRAMME
86 MINISTERO DELL’ECONOMIA E DELLE FINANZE
developed on a basis consistent with the methodological indications agreed at a
European level as part of the EPC-WGA. As in the case of past Stability
Programmes, the projections incorporate the demographic and macroeconomic
assumptions defined for the 2015 round of age-related expenditures projections
carried out for the corresponding Ageing Report16 (2015 EPC-WGA Scenario).17
Several specific adjustments were made in order to reconcile the data in the
short-term macroeconomic scenario with the medium-/long-term structural values
defined in the 2015 EPC-WGA baseline scenario.
The demographic assumptions are based on the Europop scenario developed
by Eurostat, with base year of 2013. For Italy, this scenario provides for: i) an
average net annual inflow of immigrants just under 310,000, with an increasing
profile for the first 15 years and a decreasing profile thereafter; ii) average life
expectancy of 85.5 years for men and 89.7 years for women as of 2060; and iii) a
total fertility rate of 1.61 as of 2060.
As to the macroeconomic variables, the projections incorporate the national
accounting data until 2016; for 2017-2020, the assumptions about GDP growth,
both at constant and current prices are consistent with the outlook of the 2017
EFD. For the long term, the structural assumptions of the 2015 EPC-WGA baseline
scenario were used, and appropriately reconciled, in the transitory phase, with
short-term trends.18
The long-term trends of the macroeconomic variables provide that the
average annual rate of change in real productivity will grow to reach 1.7 percent
in 2034 and remain constant for 15 years thereafter before dropping to around 1.5
percent toward the end of the forecast period. The employment rate for the 15-
to-64 age bracket is projected to rise from 56.3 percent in 2015 to 60.3 percent in
2060. The interaction of these assumptions and demographic trends will result in
an average real GDP growth rate of around 1.5 percent per year during the 2015-
2060 period. Starting from 2021, the GDP deflator and the inflation rate are
assumed to be equal to 2.0 percent.
The expenditures projections set out in this section have been updated based
on the prevailing regulatory framework. In addition to the regulatory changes
already incorporated in the previous Stability Programme, the projections reflect
the regulatory changes adopted with the 2017-2019 Budget Law.19 In particular,
with reference to pension expenditure, the forecasts for 2017 onwards consider
the recent changes directed toward: i) increasing pension payments for pensions
totalling two times’ or less the minimum through a so-called fourteenth-month
payment and ii) facilitating an early exit from the work force compared with the
general requisites for retirement.
loan and not as a direct monetary transfer to households. This accounting treatment was applied upon the preparation of the 2017 Budget Law, as reported in the technical notes thereon.
16 European Commission-Economic Policy Committee (2015), 2015-Ageing Report: Economic and Budgetary projections, European Economy, 3
(http://ec.europa.eu/economy_finance/publications/european_economy/2015/pdf/ee3_en.pdf). 17 European Commission-Economic Policy Committee (2014), 2015-Ageing Report: Underlying assumptions
and Projection Methodologies. 18 The employment differences shown in 2020, in the comparison between the EPC-WGA baseline scenario
and the short-term macroeconomic scenario in the 2017 EFD, are gradually zeroed out. In particular, the rates of activity have been gradually realigned in the subsequent 15 years, while the unemployment rates were realigned over a 5-year period. With reference to the trend of productivity, the assumptions of the EPC-WGA baseline scenario are confirmed as from 2025.
19 Law No. 232/2016.
IV. SENSITIVITY AND SUSTAINABILITY OF THE PUBLIC FINANCES
MINISTERO DELL’ECONOMIA E DELLE FINANZE 87
With reference to healthcare expenditure, the projections incorporate the
effects of the spending reductions provided by the 2017 Budget Law, amounting to
€63 million for 2017, €998 million for 2018 and €2.988 million per year as from
2019. In addition, the projections also consider the application of the provisions
set out in the 2017 Budget Law with respect to contract renewals.20 With
reference to social safety nets, the projections take into account the effects of
the tightening of the job protection legislation enacted by the Jobs Act.21 With
reference to the education system, the projections incorporate the appropriation
enacted by the 2016 Stability Law for the implementation of an extraordinary
hiring plan as well as the provisions of the 2017 Budget Law regarding contract
renewals.
Turning to the trend of the individual components of age-related
expenditure, it is noted that the ratio between pension expenditure and GDP
declines starting in 2016-2017 to a level of 15.4 percent of GDP in 2021, with such
decrease attributable to more favourable economic growth and the gradual
continuation of the process to tighten up the eligibility requirements for pension .
Later, the ratio starts to grow anew, hitting 16.0 percent of GDP around 2036. In
the final phase of the projections horizon, the ratio of pension expenditure to GDP
falls rapidly, to reach 13.8 percent of GDP in 2060
The healthcare expenditure projection is based on the methodology so-called
reference scenario which incorporates both the effects of population ageing, and
the effects of other factors capable of significantly affecting the trend of
healthcare expenditure.22 After initially falling due to the effect of measures to
contain spending, the projected ratio between healthcare expenditure and GDP
shows an increasing profile from 2021 onwards and amounts to around 7.4 percent
of GDP in the final decade of the forecast period.
20 See detailed analysis in the 2016 EFD, Section II for additional information. 21 Legislative decrees for the implementation of Law No. 183/2014. 22 The reference scenario applied from 2021 assumes that for the acute component of the healthcare
expenditure: i) a partial application of the dynamic equilibrium method, according to which, increases in life expectancy translate into a years spent in good health in 50 per cent of the cases; ii) a unit cost trend in line with per capita GDP; iii) unit cost elasticity with respect to per capita GDP in excess of 1.0 (the elasticity falls on a linear basis during the projection period, going from an initial level of 1.1 to 1.0 in 2060). With regard to the LTC component of healthcare expenditure, the reference scenario provides for: i) the partial application of the dynamic equilibrium method, ii) a unit cost trend linked to productivity, and iii) the elasticity of the unit cost to productivity equal to 1.0 for the entire projection period.

ECONOMIC AND FINANCIAL DOCUMENT - SECTION I STABILITY PROGRAMME
88 MINISTERO DELL’ECONOMIA E DELLE FINANZE
TABLE IV.4 PUBLIC EXPENDITURE FOR PENSIONS, HEALTHCARE, LONG-TERM CARE, EDUCATION AND UNEMPLOYMENT COMPENSATION (2010-2060)
2010 2015 2020 2025 2030 2035 2040 2045 2050 2055 2060
in % GDP
Total expenditure 49.9 50.5 49.2 50.0 50.6 50.5 50.5 50.3 49.6 48.6 47.7
incl:
Age-related expenditure 27.5 28.0 27.2 27.5 27.7 28.0 28.2 28.2 27.8 27.3 26.9
Pension expenditure 14.8 15.7 15.4 15.7 15.8 15.9 15.9 15.6 14.9 14.2 13.8
Healthcare expenditure 7.1 6.8 6.4 6.6 6.7 6.9 7.1 7.3 7.4 7.5 7.4
incl: LTC - healthcare 0.8 0.8 0.8 0.8 0.8 0.8 0.8 0.9 1.0 1.0 1.0
Socio/assistance LTC 1.0 1.0 1.1 1.1 1.1 1.1 1.2 1.3 1.4 1.5 1.5
Education expenditure 3.9 3.6 3.5 3.4 3.4 3.4 3.4 3.5 3.6 3.6 3.6
Unemployment benefits 0.7 0.9 0.8 0.7 0.7 0.6 0.6 0.6 0.6 0.6 0.6
Interest expenditure 4.3 4.1 4.0 4.5 4.8 4.5 4.2 4.0 3.7 3.3 2.7
Total revenue 45.6 50.5 50.4 50.3 50.3 50.3 50.3 50.3 50.2 50.2 50.2
incl: property income 0.6 0.7 0.6 0.5 0.5 0.5 0.5 0.5 0.5 0.5 0.5
ASSUMPTIONS %
Labour productivity growth rate 2.6 -0.2 0.4 0.6 1.2 1.7 1.7 1.7 1.7 1.6 1.5
Real GDP growth rate 1.7 0.8 1.1 1.3 1.4 1.6 1.5 1.5 1.6 1.6 1.5
Male participation rate (20-64) 78.4 79.5 78.5 78.9 78.8 78.2 77.9 77.8 77.8 77.7 77.8
Female participation rate (20-64) 54.6 57.8 59.0 60.4 61.7 62.3 62.7 62.9 63.0 63.2 63.1
Total participation rate (20-64) 66.3 68.6 68.7 69.7 70.3 70.3 70.4 70.5 70.5 70.6 70.6
Unemployment rate 8.4 11.9 10.2 8.8 8.2 7.5 7.1 7.1 7.1 7.1 7.0
Population of age 65 and over/total
population 20.4 21.7 22.3 23.4 25.1 27.1 28.8 29.7 29.9 29.9 30.0
Old age dependency ratio (65 + over /
[20-64]) 33.6 36.4 37.8 40.2 44.3 49.4 54.2 57.0 57.7 57.9 58.0
Note: The 2017-2020 four-year period incorporates growth assumptions in line with the indications provided in the short-
term macroeconomic scenario set out in the 2017 Stability Programme (scenario at unchanged legislation of 24 March
2017). For the years thereafter, the structural assumptions of 2015 EPC-WGA scenario, after having been reconciled with
the short-term scenario, have been adopted. The national accounting data have been used for expenditure on social
benefits through 2016. For the 2017-2020 period, the projected values are in line with those underlying the forecast of
the public finance outlook. The projections of long-term care have been carried out in line with the so-called reference
scenario methodology. The 2010 expenditure on education incorporates a different method for accounting for interest
expenditure, all of which was excluded from healthcare expenditure (annual amount of €250-300 million). The
expenditure for education includes the International Standard Classification of Education (ISCED) levels of education 1-6,
according to the OECD classification (ISCED 2011 level); it does not include expenditure for life-long learning and pre-
primary schools. The rounding to the first decimal point may cause the discrepancies with the values presented in the
table.
Source: MEF analyses using the State General Accounting Department long-term forecasting model.
The projection of the socio-assistance component of public expenditure for
long-term care (LTC) refers to both allowances paid to attendants to the disabled
(80 percent) and socio-assistance services provided at the local level (20
percent).23 After remaining initially stable, the total expenditure for LTC presents
a growing profile in terms of GDP that extends over the entire projection period,
amounting to 1.5 percent in 2060.
The projections of expenditure for social safety nets in relation to GDP goes
from 0.7 percent in 2010 to 0.9 percent in 2016, before gradually descending to a
value of approximately 0.6 percent which is maintained until the end of the
projections horizon.
23 For additional details, see: MEF-RGS (2015), Report No. 17, Chapter 4 (Italian version only).

IV. SENSITIVITY AND SUSTAINABILITY OF THE PUBLIC FINANCES
MINISTERO DELL’ECONOMIA E DELLE FINANZE 89
The ratio of expenditure education to GDP24 shows a gradually decreasing
trend, that extends out for approximately 15 years. As from 2021, this reduction is
essentially the result of a decrease in the student population caused by
demographic trends. The ratio then starts growing modestly in the final part of
the projections period, to hit around 3.6 percent of GDP in 2060.
Pension system reform
The new rules introduced by the reform adopted with Law No. 214/2011 significantly
changed the pension system, improving its medium-/long-term sustainability and ensuring
greater fairness among generations.
The reform foresees the extension of the notional defined contribution system to all workers
as of 2012, including, pro-rata, the workers who, on the basis of preceding legislation,
would have received a pension calculated according to the earnings-related system
(namely, all individuals who had accrued more than 18 years of contributions as of 31
December 1995). In line with the regulatory-institutional structures of most European
countries, the reform confirms two types of retirement: a) old-age retirement which requires
at least 20 years of contributions and an age requirement set by law; and b) early
retirement at an age below the statutory retirement age, but with a longer period of
contributions.25
Starting in 2013, all age requirements (including those for obtaining social allowances) and
the requirement for qualifying for early retirement on the basis of accrued contribution
regardless of age are indexed to changes in life expectancy as measured by ISTAT with
reference to the three previous years. The adjustment of the retirement eligibility
requirements to changes in life expectancy will occur every three years and, starting from
the adjustment subsequent to 2019, every two years, on the basis of an entirely
administrative procedure.26 In addition, starting from 2013, the calculation of the
transformation coefficients27 at the time of retirement is extended until age 70. Other
protection measures are likewise provided so as to guarantee more gradual application of
the reform, namely, to take into account specific factors in relation to proximity to
retirement and difficult situations related to staying in the labour market, cases that have
24 The definition of expenditure for education agreed within the EPC-WGA includes the International
Standard Classification of Education (ISCED) levels of education 1-6, thereby excluding pre-primary school (ISCED 0) and life-long learning (see European Commission, Special Report No. 1/2006). The expenditure aggregate has been constructed on data sourced from UNESCO/OECD/EUROSTAT (UOE) (see European Commission, The 2015-Ageing Report: Underlying Assumptions and Projecting Methodologies, 2014). The projections incorporates the updating of UOE data with respect to the 2013 financial year; for the two years thereafter, the expenditure data are estimated based on the rates of change in the components of public expenditure for education as reported in the Classification of the Functions of Government (COFOG) classification detailing functions and economic categories.
25 For detail about minimum age requisites and contributions for regular retirement, early retirement and
social allowances, see box on “Pension system reform” contained in the 2012 Stability Programme. 26 The adjustment of the requirements for pension eligibility as of 2013 was adopted with a decree of 6
December 2011, published in the Official Gazette of the Republic of Italy on 13 December 2011. The next adjustment, to take effect in 2016 (an additional four months), in accordance with the law (Article 12, Paragraph 12-bis of Decree-Law No. 78 of 31 May 2010, converted with amendments by Law No. 122 of 30 July 2010), had to be adopted at least 12 months before the adjustment's effective date, and was thus adopted with decree of 16 December 2014, published in the Official Gazette of the Republic of Italy on 30 December 2014. Prevailing law contains a safeguard clause on the basis of which the minimum age requirement for old-age pensions may be no less than 67 for anyone becoming eligible for retirement as from 2021. In any case, based on ISTAT’s demographic projections, the aforementioned objective could be assured as early as from 2019.
27 The transformation coefficient is also to be adjusted with the same calendar used for adjusting the eligibility requirements for retirement due to changes in life expectancy. The adjustment taking effect on 1 January 2016 was adopted by decree of 22 June 2013, published in the Official Gazette of the Republic of Italy No. 154 on 6 July 2015.
FO
CU
S

ECONOMIC AND FINANCIAL DOCUMENT - SECTION I STABILITY PROGRAMME
90 MINISTERO DELL’ECONOMIA E DELLE FINANZE
all been outlined at a regulatory level.28
The 2017-2019 Budget Law29 adopts measures30 aimed at i) increasing pension payments
for pensions totalling two times’ or less than the minimum treatment provided by
INPS(through the so-called fourteenth month payment) and ii) facilitating the early exit from
the work force compared with the general requisites for retirement. Such measures do not,
however, modify the structural framework of the pension system as designed on the basis
of the regulations introduced with Law No. 214/2011. As assumed in the technical notes to
the 2017 Budget Law, and in the valuations in this document, the early retirement loan
program guaranteed by future pension benefit streams (the so-called ‘market APE’) is
qualified and classified in the national accounts as a loan and not as a direct monetary
transfer to households. Given such assumption, the aforementioned measures have an
additional impact on pension expenditure to GDP amounting to 0.14 percentage points of
GDP in 2021,31 before moving back to around 0.1 percentage points of GDP per year during
the remainder of the projection period. Given the overall reform process that began in
2004, the average retirement age (considering both the statutory retirement age and the
age for early retirement) rises from 60-61 during the 2006-2010 period to approximately
64 in 2020, 67 in 2040 and then, approximately 68 in 2050. On a cumulative basis, the
lower ratio of pension expenditure to GDP resulting from the reform process began 2004
amounts to approximately 60 percentage points of GDP as of 2050. Approximately one-third
of this change is attributable to the reform introduced with Law No. 214/2011, whereas the
other two-thirds are attributable to the preceding reform measures.
The medium-/long-term demographic and macroeconomic scenarios adopted for these
forecasts are consistent with those adopted for the 2016 Stability Programme, net of the
28 The total number of workers entitled to such safeguard measures is approximately 170,000. The
safeguard is applied to workers entitled to a pension after 31 December 2011 (all people who have met the
requisites by such date are expressly exempt from the application of the new requisites for pension eligibility set
by the Law 214/2011) and who have had difficulty of remaining in the labour market. Such workers must also fall
within the categories expressly defined by the law. Pension access for such workers started in 2013, and will
continue in the next few years. 29 Law No. 232/2016. 30 Following is a summary of the pension measures contained in Law No. 232/2016 (2017-2019 Budget Law),
with effects on the aggregate pension expenditure:
a) Current retirees:
a1) an increase of the amount of the so-called fourteenth month payment (+30%) for retirees with income
up to 1.5 times the minimum pension (TM), which is equal to €753 per month in 2017, and the extension of the
fourteenth month payment, in its original amount, to retirees with income between 1.5 times and 2 times the
minimum pensions (pensions between €753 and €1,004 per month in 2017);
b) Future retirees:
b1) facilitation for accessing retirement for workers having met contributions requirements through various
retirement plans, providing for the accrual of the covered periods, without any additional charges ;
b2) facilitation for accessing retirement for workers doing ‘stressful’ works; the benefit is recognised
within the sphere of programmed resources;
b3) facilitations for accessing retirement for workers entering the work force at an early age (who worked
for at least one year before the age of 19), with a reduction of the contributions requirement, regardless of age,
of 1 year and 10 months for men, and 10 months for women (for women, the prevailing requisite for
contributions is already one year less than that for men). Such facilitation is limited to specific categories
(unemployed without social safety nets, workers with 74% or more disability, persons dedicated to assisting a
severely handicapped relative, workers performing stressful jobs and/or very burdensome jobs as defined by
specific provisions). The benefit is recognised within the sphere of programmed resources.
Finally, as part of the more rational use of already planned resources, the law provides for a further
extension of the pension safeguard mechanism (so-called ‘eighth safeguard’) so as to conclude the programme of
gradually tighten the eligibility requirements for accessing retirement. With further reference to concluding the
related experimentation, the law extends the possibility for retirement with the special requisites provided by
Article 1, Paragraph 9, Law No. 243/2004 (so-called “women’s option”) in the case of female workers born in the
final quarter of 1958 (if full-time workers) or in the final quarter of 1957 (if self-employed). 31 Such effect does not include the charges related to the so-called social APE indemnity, since such
indemnity is not a pension payment, but an assistance payments that is nonetheless booked within the sphere of overall expenditure for social benefits in cash (account D62).

IV. SENSITIVITY AND SUSTAINABILITY OF THE PUBLIC FINANCES
MINISTERO DELL’ECONOMIA E DELLE FINANZE 91
needed short-term updates. They do not take into account the new demographic projections
and the new economic scenarios that will be adopted by the EPC-WGA in the triennial
updating of the Ageing Report. Such revisions may significantly deteriorate the medium-
/long-term indicators of the sustainability of pension expenditure, to the extent to which the
population projections and total factor productivity might worsen.
PUBLIC EXPENDITURE FOR PENSIONS AS % OF GDP UNDER DIFFERENT REGULATORY ASSUMPTIONS
Note: The EPC-WGA Baseline scenario incorporates, for the short term, the indications of the scenario at unchanged legislation included in the 2017 Stability Programme Update. Source: State General Accounting Department long-term forecasting model.
Fiscal sustainability indicators
The indicators S1 and S2 provide an assessment of the impact of implicit age-
related liabilities on fiscal sustainability over, respectively, the medium and long
term.
The medium-term sustainability indicator (S1) shows the increase in the
structural primary balance to be achieved cumulatively in the five years
subsequent to the final year of the forecast for the 2017 EFD, so as i) to ensure, if
the increase is kept constant in later years, the achievement of a debt-to-GDP
ratio of 60 percent by 2031 and ii) to repay age-related costs. The long-term
sustainability indicator (S2) shows the fiscal adjustment in terms of structural
primary balance which, if immediately realized and maintained as from the final
year of the forecast of the 2017 EFD, allows for keeping intertemporal budget
equilibrium over an infinite time horizon.
Both indicators are based on the growth projections and fiscal targets of the
policy scenario set out in the 2017 EFD, and incorporate the medium-/long-term
projections of age-related expenditures described above. The higher and more
positive the values of the S1 and S2 sustainability indicators, the greater will be
the need for fiscal adjustment and thus, the greater the sustainability risk will be.
With other conditions being equal, the higher the level of the age-related
expenditures, the maintenance of the intertemporal budget constraint becomes
increasingly more difficult because the required primary surpluses become
increasingly more substantial.
12
13
14
15
16
17
18
19
Current legislationbefore L 232/2016before DL 201/11before DL 98/11before DL 78/10before L 243/04
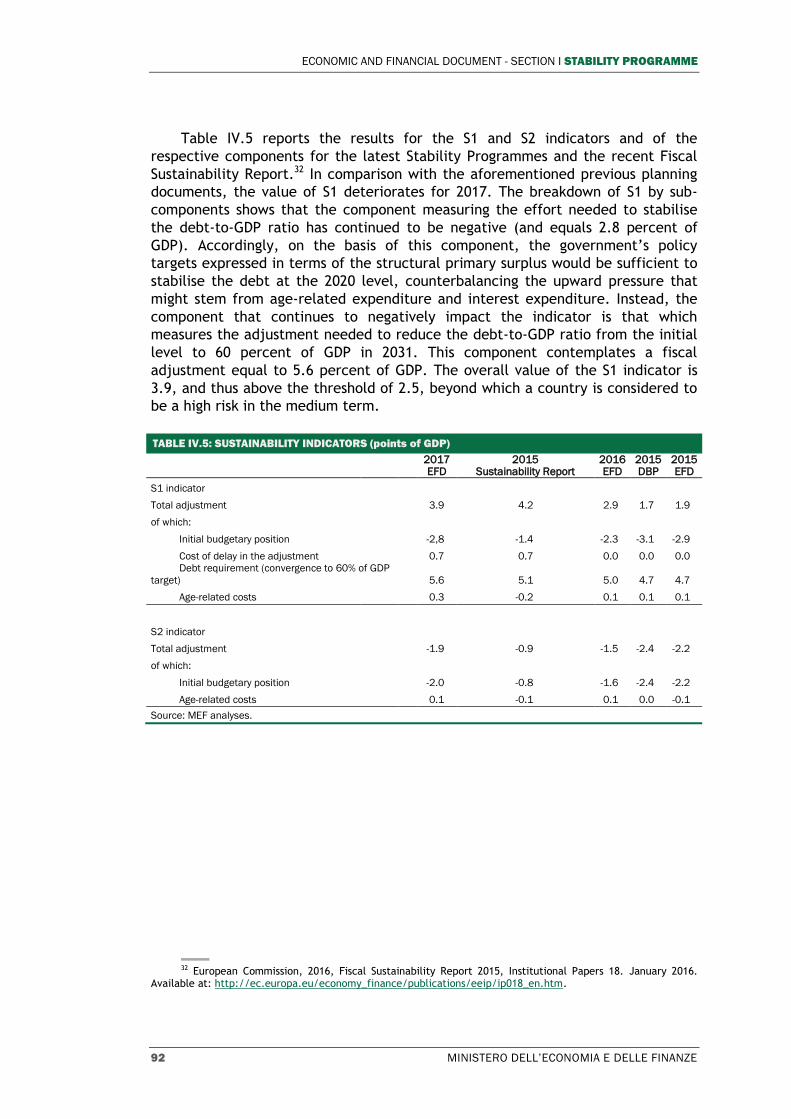
ECONOMIC AND FINANCIAL DOCUMENT - SECTION I STABILITY PROGRAMME
92 MINISTERO DELL’ECONOMIA E DELLE FINANZE
Table IV.5 reports the results for the S1 and S2 indicators and of the
respective components for the latest Stability Programmes and the recent Fiscal
Sustainability Report.32 In comparison with the aforementioned previous planning
documents, the value of S1 deteriorates for 2017. The breakdown of S1 by sub-
components shows that the component measuring the effort needed to stabilise
the debt-to-GDP ratio has continued to be negative (and equals 2.8 percent of
GDP). Accordingly, on the basis of this component, the government’s policy
targets expressed in terms of the structural primary surplus would be sufficient to
stabilise the debt at the 2020 level, counterbalancing the upward pressure that
might stem from age-related expenditure and interest expenditure. Instead, the
component that continues to negatively impact the indicator is that which
measures the adjustment needed to reduce the debt-to-GDP ratio from the initial
level to 60 percent of GDP in 2031. This component contemplates a fiscal
adjustment equal to 5.6 percent of GDP. The overall value of the S1 indicator is
3.9, and thus above the threshold of 2.5, beyond which a country is considered to
be a high risk in the medium term.
TABLE IV.5: SUSTAINABILITY INDICATORS (points of GDP)
2017 EFD
2015 Sustainability Report
2016 EFD
2015 DBP
2015 EFD
S1 indicator
Total adjustment
3.9 4.2 2.9 1.7 1.9
of which:
Initial budgetary position -2,8 -1.4 -2.3 -3.1 -2.9
Cost of delay in the adjustment
0.7 0.7 0.0 0.0 0.0
Debt requirement (convergence to 60% of GDP
target)
5.6 5.1 5.0 4.7 4.7
Age-related costs 0.3 -0.2 0.1 0.1 0.1
S2 indicator
Total adjustment
-1.9 -0.9 -1.5 -2.4 -2.2
of which:
Initial budgetary position -2.0 -0.8 -1.6 -2.4 -2.2
Age-related costs 0.1 -0.1 0.1 0.0 -0.1
Source: MEF analyses.
32 European Commission, 2016, Fiscal Sustainability Report 2015, Institutional Papers 18. January 2016.
Available at: http://ec.europa.eu/economy_finance/publications/eeip/ip018_en.htm.
IV. SENSITIVITY AND SUSTAINABILITY OF THE PUBLIC FINANCES
MINISTERO DELL’ECONOMIA E DELLE FINANZE 93
S1 indicator of medium-term fiscal sustainability
Calculated on the basis of the data underlying the 2017 EFD, the S1 indicator of medium-
term fiscal sustainability amounts to 3.9 percent for Italy, and thus places the country’s
public finances in a high-risk area according to the Commission’s definition. Compared with
the values published in the previous planning documents (2016 EFD), there is a
deterioration of approximately 1.0 percentage point, which, however, cannot be explained
solely based on the updating of the government’s budget objectives. In order to fully
understand the reasons for such deterioration, it is necessary to analyse the
methodological changes regarding the calculation of the S1 indicator since 2009, and to
break down the indicator into its basic components.
According to the methodology for calculating S1 as published in the 2009 Fiscal
Sustainability Report,33 the indicator’s objective was to measure the gap between the
current fiscal position expressed in structural terms and that required for reaching the debt
target of 60 percent of GDP in 2060, taking into consideration the impact of the age-related
expenditures. The aforementioned report affirmed that the decision to use the debt-to-GDP
ratio target for the S1 indicator was in line with the debt threshold reported in the Treaty,
and more importantly, that the target year had been chosen to be long enough away so as
to allow for significantly analysing the impact of ageing, though remaining within a horizon
within reach of current taxpayers and policymakers.34
In the 2012 Fiscal Sustainability Report,35 the definition of S1 was amended. According to
the European Commission, S1 had to be conceived as an indicator of debt sustainability in
the medium term when the fiscal effort to be achieved (when considering the impact of age-
related expenditure) needed to be such as to allow for hitting the debt target of 60 percent
of GDP not in 2060, but in 2030. According to the new definition of the S1 indicator, the
fiscal effort needed to be introduced in a linear and increasing manner, as from the final
year of the European Commission’s forecast (or national forecast) until 2020, and then
kept constant for the next ten years.
Even though the 2012 Sustainability Report continued to affirm (in line with the previous
report) that the choice of the time horizon to 2030 was such as to allow for a sufficiently
long interval, and such as to permit an analysis of the impact of the age-related
expenditure36, the shortening of the convergence horizon for the S1 indicator made it
more difficult to achieve the target of 60 percent of GDP, particularly for the countries with
sustainable public finances, but with a high initial debt levels.
In the 2015 Fiscal Sustainability Report37 published in January 2016, the methodology for
the derivation of S1 was again significantly changed. While this report also shifted the debt
target ahead so as to allow for adequate analysis of the impact of ageing, the calculation
period for S1 was held constant to 2030. Instead, the growing linear adjustment no longer
has to be concluded by 2020 (as in the methodology used in the 2012 Sustainability
Report), but it must last five years, starting from year after the final year of the forecasts.
So, in the case of the Commission’s forthcoming Spring Forecasts (which cover a time
33 European Commission, 2009, 2009 Sustainability Report, European Economy 9,
(http://ec.europa.eu/economy_finance/publications/publication15998_en.pdf) 34 See page 11 of the 2009 Fiscal Sustainability Report, according to which: “The choice of the debt target
for the S1 indicator is in line with the debt threshold in the Treaty. The timescale has been chosen to be long enough to allow the impact of ageing to be analysed in a meaningful way, while still remaining within the sights of current taxpayers and policy makers.”
35 European Commission, 2012, 2012 Fiscal Sustainability Report, European Economy 8 (http://ec.europa.eu/economy_finance/publications/european_economy/2012/pdf/ee-2012-8_en.pdf).
36 See page 4 of the 2012 Fiscal Sustainability Report, according to which: “The timescale has been chosen to be long enough to allow the impact of ageing to be analysed in a meaningful way, while still remaining within the sights of current taxpayers and policy makers.”
37 European Commission, 2016, 2015 Fiscal Sustainability Report, Institutional Paper 018. (http://ec.europa.eu/economy_finance/publications/eeip/pdf/ip018_en.pdf)
FO
CU
S

ECONOMIC AND FINANCIAL DOCUMENT - SECTION I STABILITY PROGRAMME
94 MINISTERO DELL’ECONOMIA E DELLE FINANZE
horizon until 2018), the period of the growing, linear fiscal adjustment needed for
calculating S1 is opened in 2019 and is closed in 2023.
The issues of the time horizon for convergence to the debt target of 60 percent and the
duration of the growing, linear fiscal effort are very significant for the purpose of the
comparability of the S1 indicator between different projections’ rounds, and for fiscal
recommendations produced by this indicator. Indeed, from the 2012 Report to date, the
year for the achievement of the debt target has remained unchanged (2030) while the
horizon for the application of the S1 calculation has essentially been shortened. All of this
has caused the S1 results to worsen significantly, and has increased the bias in using the
indicator, since the fiscal effort must: (1) be applied gradually for five years, increasing the
cost of the delay in the adjustment, and (2) be applied constantly for a smaller number of
years compared with the ten years provided in the 2012 Report. Given the unfavourable
mechanisms ingrained in the current definition and application of the S1 indicator, in the
2015 Report, the Commission further exacerbated the S1 indicator’s correction
mechanisms by discretionally lowering the threshold that indicates high risk for the public
finances, going from 3 percent in the previous reports to 2.5 percent.
In its recent report monitoring the sustainability of the debt, published in January 201738,
the European Commission started to recognise the problem of the time horizon for the
calculation of the S1 indicator and extended the target year to 2031. However, such a
measure is not sufficient to overcome the methodological limitations of the current
indicator, and its ingrained characteristic to aggravate the fiscal effort required.
Considering the frequent revisions to the indicator’s definition, and the progressive
tightening of the time horizon for its calculation, it is evident that the comparison between
S1 results over different years and in different documents can be very difficult and may
lead to inaccurate or improbable conclusions.
Consistent with the current methodology, the S1 results depend substantially on the
number of years assumed for the cost of delay in the adjustment (currently, five) and the
number of years remaining until convergence to the target debt-to-GDP ratio of 60 percent.
While the increase of the number of years remaining until the target decreases the annual
fiscal effort needed to allow for a permanent reduction in the debt-to-GDP ratio and
improves the S1 indicator result, a greater number of years of delay in the adjustment
worsens the value of the indicator since it presumes that, with the year of convergence to
the target being held equal, a greater fiscal effort is made in a (fewer) number of remaining
years.
In order to provide a detailed analysis of the indicator’s volatility and its sensitivity with
respect the years of adjustment and/or with respect to the target year for reaching the 60
percent debt-to-GDP ratio, the graph below highlights the values of the S1 indicator for Italy
when the number of years of delay for the fiscal adjustment (y axis) is changed and when
the target year for achieving a 60 percent debt-to-GDP ratio is also modified. The graph also
shows the thresholds that indicate a high risk for medium-term sustainability as published
in the 2012 Fiscal Sustainability Report (3 percent) and the 2015 Fiscal Sustainability
Report (2.5 percent).
It is evident that, coeteris paribus. , the number of years of delay for the fiscal adjustment is
an indicator directly proportional to the value of S1: if the fiscal adjustment does not
provide for a period of delay (the number of years of delay is 1), the indicator is
substantially lower than in the case when the period of delay is drawn out for five years.
38 European Commission, 2017, Debt Sustainability Monitor 2016
(https://ec.europa.eu/info/publications/economy-finance/debt-sustainability-monitor-2016_en)

IV. SENSITIVITY AND SUSTAINABILITY OF THE PUBLIC FINANCES
MINISTERO DELL’ECONOMIA E DELLE FINANZE 95
S1 INDICATOR SENSITIVITY
Source: MEF calculations.
The series calculated with the data underlying the EFD (DEF_S1_2031) is flanked by two
alternative series (S1_2033 and S1_2035) in which the same data are used, but with the
objective of bringing the debt to 60 percent of GDP in 2033 and 2035, respectively. As
shown by the graph, the lengthening of the projection horizon for the convergence to the
target produces a sizeable improvement of the indicator, when other conditions are held
equal. Moving the target year from 2031 to 2035 improves the indicator by 1.8 percentage
points if the period of delay for the fiscal adjustment is kept at 5 years, and by 1.3
percentage points if the period of delay for the fiscal adjustment were to be reduced to one
year.
When 2031 is the target year, the indicator is entirely above the high-risk threshold;
instead, when the target year is assumed to be 2035, the indicator is entirely below the
threshold of the 2.5 percent, namely, the high-risk threshold provided by the latest Fiscal
Sustainability Report. Instead, with a target year in 2033, the series is completely below the
threshold of the 3 percent provided by the 2012 Fiscal Sustainability Report, and only
slightly above the threshold of the 2.5 percent provided by the latest Fiscal Sustainability
Report. In conclusion, despite the tightening of the threshold after 2012, if the target year
for the debt were to be adapted to the methodology’s initial approach, which is that of
ensuring a sufficiently long time interval for adjustment and the calculation of the
components related to the costs of ageing, the S1 indicator for Italy would supply
indications of medium risk with reference to the sustainability of the public finances, and
not, as currently, of high risk.
Instead, the total value of the S2 indicator is -1.9 percent, which is above the
threshold of 2.0 percent, under which a country is considered to be a low risk in
the long term. With reference to the S2 sub-components, the value related to the
component that measures the effort needed to stabilise the debt-to-GDP ratio at
the 2020 level, coeteris paribus, remains negative (equal to -2.0 points of GDP),
thereby indicating the capacity of Italy's public finances, given the fiscal targets
projected for 2020 under the policy scenario, to cope with the accumulation of
interest expenditure/GDP expected over the long term. The other component of
1.5
2.0
2.5
3.0
3.5
4.0
1 2 3 4 5
S1
val
ue
years of gradual adjustment
S1 Sensitivity
DEF_S1_2031
S1_2033
S1_2035
high risk threshold
high risk threshold 2012

ECONOMIC AND FINANCIAL DOCUMENT - SECTION I STABILITY PROGRAMME
96 MINISTERO DELL’ECONOMIA E DELLE FINANZE
S2 (which is also common to S1) measures the additional adjustment needed to
cover the increase in age-related expenditures. In Italy's case, the value of such
component remains close to zero, pointing to the fact that the age-related
expenditures appear to be fully under control. In conclusion, the fiscal
consolidation planned by the government in the short term can be considered
adequate to ensure the sustainability of the public finances in the medium/long
term.
Analysis of the sensitivity of the public debt dynamics in the long term
The sensitivity analysis presented in this section illustrates several scenarios
containing demographic, macroeconomic, and fiscal shocks. The analysis is aimed
at (i) testing the robustness of the projections of the debt-to-GDP ratio in the long
term in the baseline scenario in view of the uncertainty affecting them, and (ii)
verifying under which reform assumptions and on the basis of which budget
conditions, the sustainability of the debt can either be guaranteed or is at risk.
The following scenarios therefore replicate the assumptions underlying the
sensitivity analyses presented in the 2015 European Commission Ageing Report. In
line with the European Commission's methodology, in projecting the debt-to-GDP
ratio through 2060, the baseline scenario assumes that fiscal revenue will be
constant as a percentage of GDP at the level planned for 2020 for the entire
projection period. Instead, public expenditure moves in line with the change in
the age-related expenditure described above. The GDP deflator converges at 2.0
percent as of 2023, the year when the output gap closes, and the real interest
rate starting at the 2020 level converges to 3.0 percent over 10 years39. On the
basis of these assumptions, the debt-to-GDP ratio under the EFD policy scenario is
projected out to 2060. As shown below, the long-term projections of the debt-to-
GDP ratio in the baseline scenario reflect a decreasing trend in which the ratio
falls below the 60 percent threshold as of 2052.
In addition to the baseline scenario being compared with alternative scenarios
that entail demographic, macroeconomic and fiscal shocks, results are presented
in relation to a risk scenario where the impact of non-demographic factors exerts
additional pressure on the expected trend of healthcare expenditure and LTC
expenditure for the elderly and disabled.
Simulations with respect to demographic variables
Population ageing represents one of the most critical aspects that Italy will
need to tackle in the coming decades. In this regard, it is particularly important to
evaluate properly the weight of migratory flows expected in coming decades,
measuring their impact on Italy's public finances. In line with the assumptions
agreed at the level of the EPC-AWG and based on an ad-hoc demographic scenario
developed by EUROSTAT, the simulation assumes two alternative scenarios for the
2020-2060 period: i) as from 2021, a 20 percent decrease in the average net flow
39 European Commission-Economic Policy Committee, 2015-Ageing Report: Underlying assumptions and
Projection Methodologies.

IV. SENSITIVITY AND SUSTAINABILITY OF THE PUBLIC FINANCES
MINISTERO DELL’ECONOMIA E DELLE FINANZE 97
per year of immigrants with respect to the base assumptions; and ii) as from 2021,
a 20 percent increase of the same.
The trend of the public debt in the two alternative scenarios is compared
with that of the baseline scenario in Figure IV.7. With the government's planned
2020 structural primary balance held equal, and considering the starting level of
the debt, a 20-percent increase in the migrant flow as of 2021 would allow for
significantly reducing the debt-to-GDP ratio in comparison with the baseline
scenario, with such ratio just over 18 percent at the end of the projection
horizon. Instead, a decrease of the migratory flow as from 2021 would have a
symmetrical effect. The debt-to-GDP ratio would continue to decrease, however
at a much slower pace, getting to a level of just over 60 percent of GDP in 2060.
FIGURE IV.7: PUBLIC DEBT SENSITIVITY TO INCREASE/DECREASE IN NET FLOW OF IMMIGRANTS (% of GDP)
Source: MEF analyses through State General Accounting Department long-term forecasting model.
Simulations with respect to macroeconomic variables
The sensitivity analysis with respect to macroeconomic variables aims at
testing the robustness of the projections of the debt-to-GDP ratio vis-à-vis
alternative scenarios that assume more favourable or less favourable trends for
labour productivity, the total employment rate, and the activity rate, with the
last variable examined in particular with reference to elderly workers.
With reference to productivity, the simulation exercise calls for two
alternative scenarios in which the labour productivity growth rate is permanently
increased or decreased by 0.25 percentage points with respect to the baseline
scenario, starting in 2025.
The impact on sustainability of a better (worse) trend of productivity is
somewhat limited in the short and medium term, but it becomes significant over
time, so much so that it considerably accelerates (slows) the reduction of the
debt-to-GDP ratio in the long term (Figure IV.8). In the lower productivity
scenario, the debt-to-GDP ratio would be approximately 65 percent in 2060, while
0
20
40
60
80
100
120
140
Baseline high imm +20% low imm -20%

ECONOMIC AND FINANCIAL DOCUMENT - SECTION I STABILITY PROGRAMME
98 MINISTERO DELL’ECONOMIA E DELLE FINANZE
in the case of higher productivity, the ratio would be approximately 15 percent of
GDP by that same year.
FIGURE IV.8: SENSITIVITY TO MACROECONOMIC ASSUMPTIONS. HIGHER / LOWER PRODUCTIVITY GROWTH (% of GDP)
Source: MEF analyses through State General Accounting Department long-term forecasting model.
Another assumption is a gradual increase/reduction, starting in 2021, in the
rate of change of total factor productivity (TFP) compared with the baseline,
which gets to 20 percent as of 2035. In the event of high TFP, the debt is
projected to fall quickly to just over 11 percent in 2060; instead, in the event of
low TFP, the debt presents a stable or slightly increasing profile, and is well above
the baseline, even though it starts to decrease slightly in the final years of the
forecast, to reach a value of just over 70 percent of GDP.
FIGURE IV.9: SENSITIVITY TO MACROECONOMIC ASSUMPTIONS: HIGHER/LOWER TFP GROWTH (% of GDP)
Source: MEF analyses through State General Accounting Department long-term forecasting model.
0
20
40
60
80
100
120
140baseline low prod -0,25 p.p. high prod +0,25 p.p.
0
20
40
60
80
100
120
140
Baseline Low TFP High TFP

IV. SENSITIVITY AND SUSTAINABILITY OF THE PUBLIC FINANCES
MINISTERO DELL’ECONOMIA E DELLE FINANZE 99
Another simulation assumes that the rate of employment (15-/64-year old
population) rises as from 2021, with a gradual increase of up to 2.0 percentage
points as of 2025. Under this scenario, the debt-to-GDP ratio would trend below
the baseline, improving slightly as from the first years of the simulation, and then
more significantly in the long term (Figure IV.10).
FIGURE IV.10: SENSITIVITY TO MACROECONOMIC ASSUMPTIONS. RATES OF EMPLOYMENT AND RATES OF ACTIVITY OF THE ELDERLY (% of GDP)
Source: MEF analyses through State General Accounting Department long-term forecasting model.
Considering, instead, a gradual increase as from 2021 in the rate of activity of
the population between the ages of 55 and 74 (to the point of being 10 percentage
points higher in 2030 than the rate assumed in the baseline scenario), the curve of
the debt-to-GDP ratio would shift significantly downward starting as of 2030
(Figure IV.10) and would continue decreasing until reaching negative values as of
2057 through the end of the forecast horizon.
Simulations with respect to a risk scenario for healthcare and Long-term care ex-
penditures
In borrowing the European Commission's risk scenario methodology, this
section evaluates the effects on the debt of the application of alternative
assumptions about healthcare expenditure and long-term care expenditure for the
elderly and disabled. Such scenario is different from the baseline scenario due to
several more stringent assumptions about non-demographic factors,40 applied as
from 2021. It follows that the medium-term risk scenario would cause the trend of
the debt-to-GDP ratio to deteriorate only slightly, since it would essentially mirror
40 More specifically, it is assumed that: i) in the case of acute care, the elasticity of the unit cost vis-à-vis
per capita GDP is equal to 1.3 (instead of 1.1 as in the reference scenario) at the start of the projection period and converges to 1.0 in 2060; and ii) in the case of long-term care, and excluding cash benefits, the cost per recipient by age is assumed to converge at the EU-27 average only when its starting point is lower.
-40
-20
0
20
40
60
80
100
120
140
Baseline TA older +10pp High EmplRate +2pp

ECONOMIC AND FINANCIAL DOCUMENT - SECTION I STABILITY PROGRAMME
100 MINISTERO DELL’ECONOMIA E DELLE FINANZE
the baseline scenario until 2045, and would be higher by about 6 points of GDP at
the end of the projection horizon.
FIGURE IV.11: SENSITIVITY OF PUBLIC DEBT TO ASSUMPTIONS OF HEALTHCARE EXPENDITURE IN RISK SCENARIO (% of GDP)
Source: MEF analyses through State General Accounting Department long-term forecasting model.
Simulations with respect to the primary surplus
With this simulation, the robustness of the results of sustainability of the
public finances is tested in view of a deterioration of the primary surplus as of
2020. For this purpose, the value of the nominal primary surplus in the baseline
scenario (equal to 3.8 percent of GDP in 2020) is reduced by 1.0 percentage point,
to 2.8 percent and 1.8 percent, respectively (Figure IV.12).
FIGURE IV.12: PUBLIC DEBT SENSITIVITY TO PRIMARY SURPLUS (% of GDP)
Source: MEF analyses through State General Accounting Department long-term forecasting model.
The trend of the public debt changes significantly following the deterioration
of the primary surplus as of 2020, and in particular for surplus levels below 3.0
0
20
40
60
80
100
120
140
20
19
20
21
20
23
20
25
20
27
20
29
20
31
20
33
20
35
20
37
20
39
20
41
20
43
20
45
20
47
20
49
20
51
20
53
20
55
20
57
20
59
baseline risk scenario
0
20
40
60
80
100
120
140
160
20
19
20
21
20
23
20
25
20
27
20
29
20
31
20
33
20
35
20
37
20
39
20
41
20
43
20
45
20
47
20
49
20
51
20
53
20
55
20
57
20
59
3.8% 2.8% 1.8%

IV. SENSITIVITY AND SUSTAINABILITY OF THE PUBLIC FINANCES
MINISTERO DELL’ECONOMIA E DELLE FINANZE 101
percent of GDP. More specifically, for an initial level of the primary surplus equal
to2.8 percent of GDP in 2020, the debt has an essentially flat profile above that in
the baseline scenario until 2050 and then decreases, standing at around 90
percent of GDP at the end of the projection horizon. Instead, a primary surplus
less than 2.0 percent of GDP would produce a significant increase in the debt-to-
GDP ratio over the long term vis-à-vis the starting level, reaching reach 143
percent in 2060. It is evident from these simulations that the sustainability of the
debt requires the maintenance of sizeable primary surpluses over time.
Simulations with respect to the pension reform
The sensitivity tests presented in the previous section demonstrate that,
barring very reduced primary surpluses with respect to the current projections and
despite the presence of forecasting risks, the government's planned fiscal targets
through 2020 should ensure the sustainability of Italy's public debt, even if
macroeconomic, demographic, or fiscal conditions were to be different from those
in the baseline scenario. It should be noted, however, that the conclusions about
the sustainability of Italy’s public finances cannot be made without considering a
series of important pension reforms over the past 20 years. These reforms have
significantly contributed to reducing age-related expenditure and keeping the
trend of the debt-to-GDP ratio under control.
Figure IV.13 illustrates the implications on the debt-to-GDP ratio of the
various measures adopted from 2004 to the most recent provisions approved with
the 2017 Budget Law,41 on the basis of a counterfactual analysis, which
recomputes the initial levels of the debt and the primary surplus assuming the
absence of the pension reforms considered.
FIGURE IV.13: IMPACT OF REFORMS ON DEBT-TO-GDP RATIO (% of GDP)
Source: MEF analyses through State General Accounting Department long-term forecasting model.
41 Law No. 232/2016
0
20
40
60
80
100
120
140
160
180
Current legislation (baseline)
before L 232/16
before DL 201/11
before L 243/04
before DL 78/10
before DL 98/11
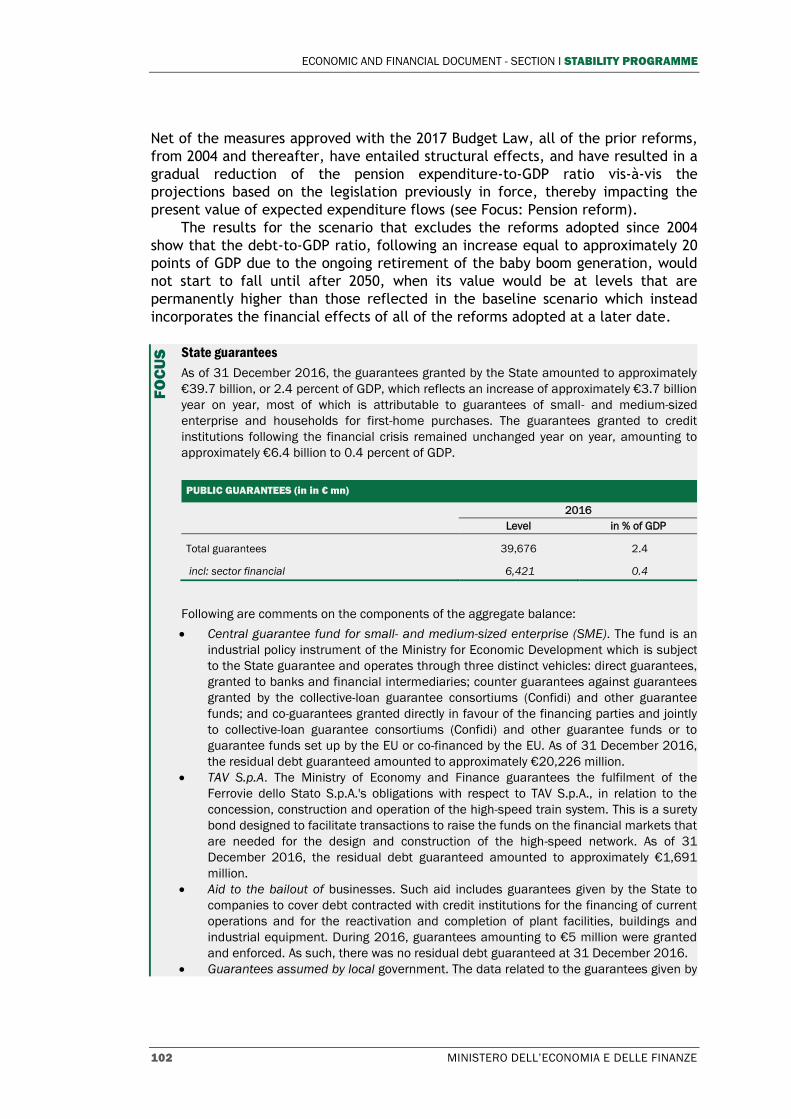
ECONOMIC AND FINANCIAL DOCUMENT - SECTION I STABILITY PROGRAMME
102 MINISTERO DELL’ECONOMIA E DELLE FINANZE
Net of the measures approved with the 2017 Budget Law, all of the prior reforms,
from 2004 and thereafter, have entailed structural effects, and have resulted in a
gradual reduction of the pension expenditure-to-GDP ratio vis-à-vis the
projections based on the legislation previously in force, thereby impacting the
present value of expected expenditure flows (see Focus: Pension reform).
The results for the scenario that excludes the reforms adopted since 2004
show that the debt-to-GDP ratio, following an increase equal to approximately 20
points of GDP due to the ongoing retirement of the baby boom generation, would
not start to fall until after 2050, when its value would be at levels that are
permanently higher than those reflected in the baseline scenario which instead
incorporates the financial effects of all of the reforms adopted at a later date.
State guarantees
As of 31 December 2016, the guarantees granted by the State amounted to approximately
€39.7 billion, or 2.4 percent of GDP, which reflects an increase of approximately €3.7 billion
year on year, most of which is attributable to guarantees of small- and medium-sized
enterprise and households for first-home purchases. The guarantees granted to credit
institutions following the financial crisis remained unchanged year on year, amounting to
approximately €6.4 billion to 0.4 percent of GDP.
PUBLIC GUARANTEES (in in € mn)
2016
Level in % of GDP
Total guarantees 39,676 2.4
incl: sector financial 6,421 0.4
Following are comments on the components of the aggregate balance:
Central guarantee fund for small- and medium-sized enterprise (SME). The fund is an
industrial policy instrument of the Ministry for Economic Development which is subject
to the State guarantee and operates through three distinct vehicles: direct guarantees,
granted to banks and financial intermediaries; counter guarantees against guarantees
granted by the collective-loan guarantee consortiums (Confidi) and other guarantee
funds; and co-guarantees granted directly in favour of the financing parties and jointly
to collective-loan guarantee consortiums (Confidi) and other guarantee funds or to
guarantee funds set up by the EU or co-financed by the EU. As of 31 December 2016,
the residual debt guaranteed amounted to approximately €20,226 million.
TAV S.p.A. The Ministry of Economy and Finance guarantees the fulfilment of the
Ferrovie dello Stato S.p.A.'s obligations with respect to TAV S.p.A., in relation to the
concession, construction and operation of the high-speed train system. This is a surety
bond designed to facilitate transactions to raise the funds on the financial markets that
are needed for the design and construction of the high-speed network. As of 31
December 2016, the residual debt guaranteed amounted to approximately €1,691
million.
Aid to the bailout of businesses. Such aid includes guarantees given by the State to
companies to cover debt contracted with credit institutions for the financing of current
operations and for the reactivation and completion of plant facilities, buildings and
industrial equipment. During 2016, guarantees amounting to €5 million were granted
and enforced. As such, there was no residual debt guaranteed at 31 December 2016.
Guarantees assumed by local government. The data related to the guarantees given by
FO
CU
S
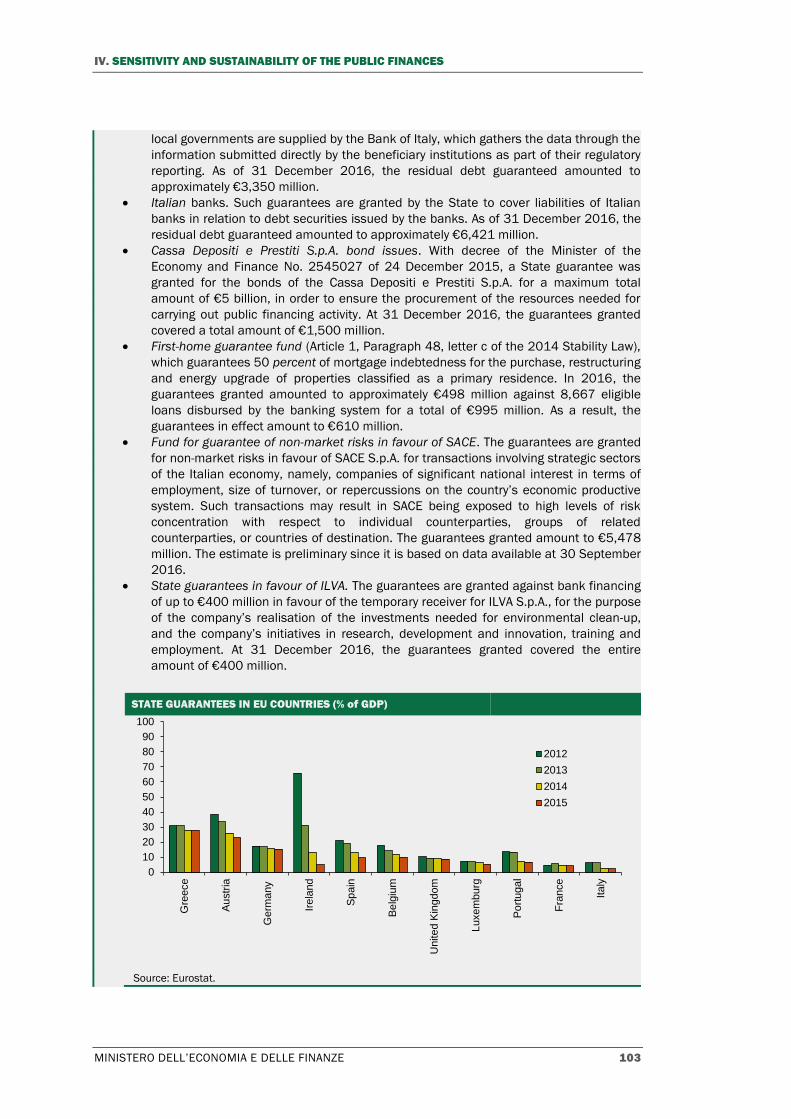
IV. SENSITIVITY AND SUSTAINABILITY OF THE PUBLIC FINANCES
MINISTERO DELL’ECONOMIA E DELLE FINANZE 103
local governments are supplied by the Bank of Italy, which gathers the data through the
information submitted directly by the beneficiary institutions as part of their regulatory
reporting. As of 31 December 2016, the residual debt guaranteed amounted to
approximately €3,350 million.
Italian banks. Such guarantees are granted by the State to cover liabilities of Italian
banks in relation to debt securities issued by the banks. As of 31 December 2016, the
residual debt guaranteed amounted to approximately €6,421 million.
Cassa Depositi e Prestiti S.p.A. bond issues. With decree of the Minister of the
Economy and Finance No. 2545027 of 24 December 2015, a State guarantee was
granted for the bonds of the Cassa Depositi e Prestiti S.p.A. for a maximum total
amount of €5 billion, in order to ensure the procurement of the resources needed for
carrying out public financing activity. At 31 December 2016, the guarantees granted
covered a total amount of €1,500 million.
First-home guarantee fund (Article 1, Paragraph 48, letter c of the 2014 Stability Law),
which guarantees 50 percent of mortgage indebtedness for the purchase, restructuring
and energy upgrade of properties classified as a primary residence. In 2016, the
guarantees granted amounted to approximately €498 million against 8,667 eligible
loans disbursed by the banking system for a total of €995 million. As a result, the
guarantees in effect amount to €610 million.
Fund for guarantee of non-market risks in favour of SACE. The guarantees are granted
for non-market risks in favour of SACE S.p.A. for transactions involving strategic sectors
of the Italian economy, namely, companies of significant national interest in terms of
employment, size of turnover, or repercussions on the country’s economic productive
system. Such transactions may result in SACE being exposed to high levels of risk
concentration with respect to individual counterparties, groups of related
counterparties, or countries of destination. The guarantees granted amount to €5,478
million. The estimate is preliminary since it is based on data available at 30 September
2016.
State guarantees in favour of ILVA. The guarantees are granted against bank financing
of up to €400 million in favour of the temporary receiver for ILVA S.p.A., for the purpose
of the company’s realisation of the investments needed for environmental clean-up,
and the company’s initiatives in research, development and innovation, training and
employment. At 31 December 2016, the guarantees granted covered the entire
amount of €400 million.
STATE GUARANTEES IN EU COUNTRIES (% of GDP)
Source: Eurostat.
0
10
20
30
40
50
60
70
80
90
100
Gre
ece
Au
str
ia
Germ
any
Irela
nd
Sp
ain
Be
lgiu
m
United K
ingdom
Luxem
burg
Po
rtuga
l
Fra
nce
Italy
2012
2013
2014
2015
ECONOMIC AND FINANCIAL DOCUMENT - SECTION I STABILITY PROGRAMME
104 MINISTERO DELL’ECONOMIA E DELLE FINANZE
In a comparison with main European partners, Italy has one of the lowest stocks of
guarantees. The decreasing trend, which has been common for most EU countries, reflects
the ongoing reduction of guarantees for the financial system, which were very high in the
countries whose financial systems were hardest hit by the crisis (Ireland, Austria, Greece
and Spain). Italy is among the countries that relied the least on guarantees for managing
the financial crisis, and as of 2016, only a minimal portion of the total stock of guarantees
is referred to the banking sector (approximately 0.4 percent of GDP compared with a total of
2.2 percent in 2015).
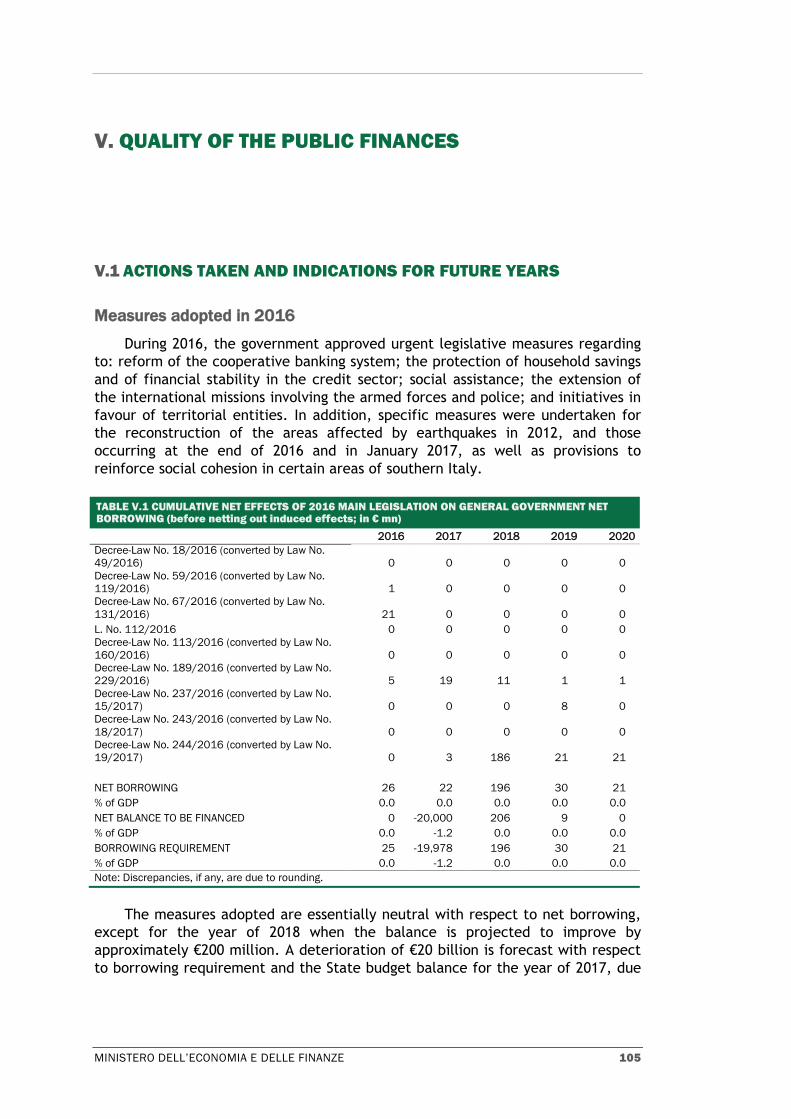
MINISTERO DELL’ECONOMIA E DELLE FINANZE 105
V. QUALITY OF THE PUBLIC FINANCES
V.1 ACTIONS TAKEN AND INDICATIONS FOR FUTURE YEARS
Measures adopted in 2016
During 2016, the government approved urgent legislative measures regarding
to: reform of the cooperative banking system; the protection of household savings
and of financial stability in the credit sector; social assistance; the extension of
the international missions involving the armed forces and police; and initiatives in
favour of territorial entities. In addition, specific measures were undertaken for
the reconstruction of the areas affected by earthquakes in 2012, and those
occurring at the end of 2016 and in January 2017, as well as provisions to
reinforce social cohesion in certain areas of southern Italy.
TABLE V.1 CUMULATIVE NET EFFECTS OF 2016 MAIN LEGISLATION ON GENERAL GOVERNMENT NET BORROWING (before netting out induced effects; in € mn)
2016 2017 2018 2019 2020
Decree-Law No. 18/2016 (converted by Law No.
49/2016) 0 0 0 0 0
Decree-Law No. 59/2016 (converted by Law No.
119/2016) 1 0 0 0 0
Decree-Law No. 67/2016 (converted by Law No.
131/2016) 21 0 0 0 0
L. No. 112/2016 0 0 0 0 0
Decree-Law No. 113/2016 (converted by Law No.
160/2016) 0 0 0 0 0
Decree-Law No. 189/2016 (converted by Law No.
229/2016) 5 19 11 1 1
Decree-Law No. 237/2016 (converted by Law No.
15/2017) 0 0 0 8 0
Decree-Law No. 243/2016 (converted by Law No.
18/2017) 0 0 0 0 0
Decree-Law No. 244/2016 (converted by Law No.
19/2017) 0 3 186 21 21
NET BORROWING 26 22 196 30 21
% of GDP 0.0 0.0 0.0 0.0 0.0
NET BALANCE TO BE FINANCED 0 -20,000 206 9 0
% of GDP 0.0 -1.2 0.0 0.0 0.0
BORROWING REQUIREMENT 25 -19,978 196 30 21
% of GDP 0.0 -1.2 0.0 0.0 0.0
Note: Discrepancies, if any, are due to rounding.
The measures adopted are essentially neutral with respect to net borrowing,
except for the year of 2018 when the balance is projected to improve by
approximately €200 million. A deterioration of €20 billion is forecast with respect
to borrowing requirement and the State budget balance for the year of 2017, due

ECONOMIC AND FINANCIAL DOCUMENT - SECTION I STABILITY PROGRAMME
106 MINISTERO DELL’ECONOMIA E DELLE FINANZE
to measures designed to protect the country’s economic and financial stability, to
reinforce the banking system, and to safeguard of household savings1 (Table V.1).
In particular, in compliance with European legislation on State aid and subject to
the approval of the European Commission, State guarantees have been
contemplated for newly issued liabilities of banks headquartered in Italy and for
financing discretionally made available by the Bank of Italy to credit institutions
for the purpose of dealing with severe liquidity crises.2 Another plan entails the
possibility of the Ministry of the Economy and Finance subscribing shares of Italian
banks that may or may not belong to a banking group, or of Italian parent
companies that hold banking groups (issuers) that need to reinforce their capital,
in relation to the outcomes of stress tests based on an adverse scenario, and
conducted at a national level, at the level of the European Union, or of the single
resolution mechanism.3
TABLE V.2. CUMULATIVE EFFECTS OF 2016 MAIN LEGISLATION ON GENERAL GOVERNMENT NET BORROWING (before netting out induced effects; in € mn)
2016 2017 2018 2019 2020
Incremental resources 3,585 1,613 1,316 671 593
Higher revenue 747 473 558 240 126
Lower expenditure 2,837 1,140 758 431 468
- current expenditure 2,280 801 654 380 438
- capital expenditure 557 339 105 51 29
Use of resources 3,559 1,591 1,119 641 572
Lower revenue 767 606 229 161 149
Higher expenditure 2,791 984 890 480 423
- current expenditure 2,577 792 799 444 387
- capital expenditure 214 192 91 36 36
Impact on net borrowing 26 22 196 30 21
Net change in revenue -20 -133 328 79 -23
Net change in expenditure -46 -155 132 49 -45
- current expenditure 297 -9 145 64 -52
- capital expenditure -343 -146 -14 -15 7
Note: Discrepancies, if any, are due to rounding.
The measures approved, in terms of the effects on net borrowing, determine
gross budget funding (total amount of resources derived through higher revenue
and lower expenditure) equal to €3.6 billion in 2016, €1.6 billion in 2017, €1.3
billion in 2018, €0.7 billion in 2019 and €0.6 billion in 2020 (Table V.2). In the
1 In the presence of exceptional events, the government presented a special report to Parliament on 19
December 2016, and requested, pursuant to Article 6, Paragraph 6 of Law No. 243/2012, the authorization to rely on borrowing in order to plan and execute transactions related to the financial accounts. The report was approved on 21 December 2016 by absolute majority in both chambers, with special resolutions: Senate of the Republic (Resolution No. 6-00218 Zanda, Bianconi and Zeller), Chamber of Deputies (Resolution No. 6-00276 Marchi, Tancredi, Librandi, Tabacci and Di Gioia).
2 Decree-Law No. 237/2016 converted by Law No. No. 15/2017. 3 The request for State intervention may be made by the issuer subject to the submission to the Bank of
Italy or the European Central Bank of a capital injection programme that indicates the magnitude of the necessary capital requirement, the measures to be undertaken to reinforce capital, and the term for the completion of the programme.

V. QUALITY OF THE PUBLIC FINANCES
MINISTERO DELL’ECONOMIA E DELLE FINANZE 107
period considered, approximately 70 percent of the resources are derived from
measures to cut expenditure, with a prevalence of current expenditure over
capital expenditure. The measures financed amount to approximately €3.6 billion
in 2016, €1.6 billion in 2017, €1.1 billion in 2018, €0.6 billion in 2019 and in 2020.
The effects of the measures considered in terms of general government
subsectors are outlined in Table V.3.
TABLE V.3. NET CUMULATIVE EFFECTS OF 2016 MAIN LEGISLATION ON GENERAL GOVERNMENT NET BORROWING BY SUBSECTOR (before netting out induced effects; in € mn)
2016 2017 2018 2019 2020
CENTRAL GOVERNMENT 315 525 51 97 140
- net change in revenue 181 253 22 45 19
- net change in expenditure -134 -272 -29 -52 -121
LOCAL GOVERNMENT -177 -124 -191 -130 -122
- net change in revenue -51 -45 -50 -48 -46
- net change in expenditure 126 78 141 82 76
SOCIAL SECURITY FUNDS -113 -379 336 63 4
- net change in revenue -150 -341 356 82 4
- net change in expenditure -37 38 19 19 0
TOTAL 26 22 196 30 21
Note: Discrepancies, if any, are due to rounding.
Key measures
In 2016, the legislative measures in relation to the banking sector include
provisions for the reform of cooperative credit banks4 that were enacted as part of
the overall reform of the banking system, which, in 2015, concerned the mutual
banks. The initiatives in 2016 were aimed at ensuring a better quality of
governance of cooperative credit banks, through streamlining of internal
organisations, the combination of the cooperative credit institutions in better
capitalised banking groups, and the reduction of the exposure of such entities to
local economic shocks, thereby allowing them also to access capital outside of the
cooperative sector in the event of non-performing loans. Subsequent provisions5
revised the regulations for the taxes paid in advance of credit institutions
(Deffered Taxes Assets DTA), clarifying, in line with the EU’s indications, the
proper application of previous provisions, and ensuring, in the case of cooperative
credit banks, the possibility to fully transform taxes paid in advance into tax
credits, following the elimination of the limit of recoverability of the losses
provided in the case of entities entitled to a profits exemption.
Furthermore, with Italy’s ratification of an agreement reached with the
European Commission regarding to the securitisation of non-performing credits,
the banking sector is poised to benefit from State guarantees to facilitate the
transfer of the deteriorated assets of individual institutions6.
4 Decree-Law No. 18/2016 converted by Law No. No. 49/2016. 5 Decree-Law No. 237/2016 converted by Law No. No. 15/2017. 6 Decree-Law No. 18/2016 converted by Law No. No. 49/2016.

ECONOMIC AND FINANCIAL DOCUMENT - SECTION I STABILITY PROGRAMME
108 MINISTERO DELL’ECONOMIA E DELLE FINANZE
Provisions have also been introduced in favour of retail investors who made
investments in banking institutions that were later subject to compulsory winding
up.7
In terms of social services, provisions have been undertaken to ensure
assistance, care, and full social inclusion of the seriously disabled who lack family
support: an increase was made in the maximum deductible expense for premiums
paid for life insurance policies covering severely disabled persons; tax benefits
have been made available for trusts set up in favour of the severely disabled8 and
the Fund for the Non-Independent Elderly has also been refinanced.9
During 2016, a special provision was approved for making available the
resources previously appropriated for the extension of the international peace-
keeping missions of the armed forces and police.10
The measures in favour of territorial entities include the assignment of
incremental resources for 2016 to the provinces in ordinary-statute regions for
extraordinary maintenance of the road network, and the establishment of special
funds in favour of municipalities. In the latter case, the funds will be used for
disputes related to executive rulings regarding natural disasters or structural
failures, and for allowing the payment of subsidies for early total or partial
extinction of mortgage loans and bonds.11
As a result of the earthquakes in August and October 2016 in the territories of
the Regions of Abruzzo, Latium, Marches and Umbria, resources needed to be
appropriated, run by an extraordinary government commissioner for financing the
repair and reconstruction of public and private buildings, supplying assistance to
the population, and initiating the recovery of economic activity.12 Through other
provisions, taxpayers resident in the municipalities affected by the natural
disasters have been allowed to suspend tax-compliance formalities and tax
payments (until 30 September 2017, with recovery of the collection of unpaid
taxes by 16 December 2017) and social contributions (until 30 September 2017,
with recovery by 30 October 2017, including through instalment payments). Such
taxpayers have also received an exemption from the payment of personal income
taxes (PIT), corporate income taxes (CIT), the single municipal tax (IMU), and the
tax on indivisible services (TASI) with respect to income derived from buildings
located in the areas hit by the earthquakes, which have either been destroyed or
declared condemned.13 In compliance with European State aid legislation, self-
employed persons working on a coordinated and continuous basis who had to
interrupt their work due to the earthquakes are eligible for a lump-sum payment
of €5,000, with such expenditure being limited to a total amount of €134.8
million. A total exemption has also been provided with respect to the payment of
the additional contribution on extraordinary wage supplements paid to employees
7 Decree-Law No. 59/2017 converted by Law No. No. 119/2016 8 Law No. 112/2016 9 Decree-Law No. 243/2016 converted by Law No. No. 18/2017 10 Decree-Law No. 67/2016 converted by Law No. No. 131/2016 11 Decree-Law No. 113/2016 converted by Law No. No. 160/2016 12 Decree-Law No. 189/2016 converted by Law No. No. 229/2016 13 In particular, the exemption from personal income tax and corporate income tax purposes applies up to
the reconstruction of the building, and in any case, until the tax year of 2017, whereas the exemption from the single municipal tax and the tax on indivisible services applies starting from the second instalment for 2016, and to and no later than 31 December 2020.

V. QUALITY OF THE PUBLIC FINANCES
MINISTERO DELL’ECONOMIA E DELLE FINANZE 109
of companies that operate in the areas affected by the earthquakes. Finally, the
National Fund for National Civil Service has received additional funding, with the
aim of i) promoting specific projects in favour of the population living in the areas
hit by the earthquakes and ii) increasing the number of volunteers for the national
civil service. Additional provisions14 call for: the extension to 2018 of the deadline
for payment, by municipalities damaged by earthquakes in 2012, of the
instalments on mortgage loans granted by the Cassa Depositi e Prestiti; the
extension to 2017 of the deadline for payment of the municipal tax on buildings
(homes not used as main dwellings and warehouses) damaged by the earthquakes
in May 2012; the suspension until 31 December 2017 of the payment of the
instalments on mortgage loans taken out by individuals for the reconstruction of
homes damaged by the earthquake in 2012; and a subsidy for the year of 2017 in
favour of the municipalities affected by the earthquakes from 2016 in order to
finance reconstruction.
With a focus on further building social cohesion in the areas of southern Italy,
additional resources have been made available for implementing the
environmental and healthcare protection plan initiatives in relation to the ILVA
steel plants in Taranto.15 More specifically, funds have been appropriated for
completing diagnostic and epidemiological testing of women and minors resident
in the municipalities of the Province of Taranto, and for technological upgrades of
equipment and medical devices supplied to healthcare units in the same
geographic area. Increases have also been made to the compensation of the
employees working at the ILVA Group production facilities whose participation in
extraordinary wage-supplementations schemes (CIGS) has been initiated or
extended during 2017.
With the aim of supporting employment and industrial reconversion of port
infrastructures, the Port System Authorities have been authorized to promote the
creation of an agency for temporary work at ports. The personnel registered on
the lists maintained by this agency will be paid an extraordinary wage supplement
for the days when the works are not initiated.16
Finally, with reference to pensions, the deadline for recovering sums from
retirees due to the deviation between the temporary equalisation rate (0.3%) and
the final equalisation rate (0.2%) has been moved from 2017 to 2018.17
14 Decree-Law No. 244/2016 converted by Law No. No. 19/2017 15 Decree-Law No. 243/2016 converted by Law No. No. 18/2017 16 Decree-Law No. 243/2016 converted by Law No. No. 18/2017 17 Decree-Law No. 244/2016 converted by Law No. No. 19/2017

ECONOMIC AND FINANCIAL DOCUMENT - SECTION I STABILITY PROGRAMME
110 MINISTERO DELL’ECONOMIA E DELLE FINANZE
TABLE V.4 - EFFECTS OF DECREE-LAW NO. 189/2016 ON GENERAL GOVERNMENT NET BORROWING (before netting out induced effects; in € mn)
2016 2017 2018 2019 2020
INCREMENTAL RESOURCES 740 586 388 86 66
Higher revenue 84 218 368 83 1
Recovery of tax payments and social contributions for residents in
municipalities affected by earthquakes 0 201 359 81 0
Use of anti-trust sanctions revenue 80 0 0 0 0
Other 4 17 10 2 1
Lower expenditure 657 368 19 3 65
Social Fund for Employment and Training 142 231 3 0 0
Transfer to revenue of financial resources for tax credit for acquisition of
capital goods for productive structures 231 0 0 0 0
Fund for Implementation of Delegations: Services Sector 139 0 0 0 0
Fund for Structural Economic-Policy Measures 0 32 0 2 23
Fund for Non-Deferrable Needs 0 14 0 0 41
National Emergencies Fund 30 20 0 0 0
Fund for School Operation 5 0 0 0 0
Other 109 71 16 1 1
USE OF RESOURCES 736 567 377 85 65
Lower revenue 335 406 64 52 50
Suspension of tax payments and social contributions for residents in the
municipalities affected by earthquakes 299 345 0 0 0
Exemption of income from buildings (PIT, CIT, IMU, TASI) 25 53 51 49 49
Total exemption for additional contribution on extraordinary wage
supplements 0 9 12 2 0
Other 11 0 1 1 1
Higher expenditure 401 161 313 33 15
Social Fund for Employment and Training 0 0 228 19 0
Fund for Reconstruction of Earthquake-Damaged Areas 90 55 55 0 0
Increase in Fund for National Civil Service 146 0 0 0 0
Lump-sum payment in 2017 to persons working on a coordinated and
continuous basis, earthquake 2017 135 0 0 0 0
Renewal of vehicle fleet for National Firefighters 5 45 0 0 0
Personnel at government commissioner structure 3 15 15 0 0
Urgent measures for the school year in the earthquake-damaged areas 5 15 0 0 0
Exception for local entities’ public finance targets for municipalities
affected by earthquake 11 0 0 0 0
Other 6 31 15 14 15
IMPACT ON NET BORROWING 5 19 11 1 1
Note: Discrepancies, if any, are due to rounding.

V. QUALITY OF THE PUBLIC FINANCES
MINISTERO DELL’ECONOMIA E DELLE FINANZE 111
TABLE V.5 - EFFECTS OF DECREE-LAW NO. 237/2016 ON GENERAL GOVERNMENT NET BORROWING (before netting out induced effects; in € mn)
2016 2017 2018 2019 2020
INCREMENTAL RESOURCES 0 64 195 194 222
Higher revenue 0 2 2 2 2
Other 0 2 2 2 2
Lower expenditure 0 62 193 192 221
Fund for Non-Deferrable Needs 0 30 100 100 129
Special Fund: Current portion 0 32 93 92 92
USE OF RESOURCES 0 64 195 185 222
Lower revenue 0 0 0 0 0
Higher expenditure 0 64 195 185 222
Interest expenditure for net issues of public
debt securities 0 46 181 161 190
Tax credit for deferred tax assets (DTA) of
banks 0 17 13 23 31
Other 0 1 1 1 1
IMPACT ON NET BORROWING 0 0 0 8 0
Note: Discrepancies, if any, are due to rounding.
TABLE V.6 - EFFECTS OF DECREE-LAW NO. 243/2016 ON GENERAL GOVERNMENT NET BORROWING (before netting out induced effects; in € mn)
2016 2017 2018 2019 2020
INCREMENTAL RESOURCES 0 161 51 25 6
Higher revenue 0 0 0 0 0
Lower expenditure 0 161 51 25 6
Fund for Multiannual Subsidies 0 78 30 10 0
Fund for Non-Deferrable Needs 0 50 0 0 0
Other 0 32 21 15 6
USE OF RESOURCES 0 161 51 25 6
Lower revenue 0 0 0 0 0
Higher expenditure 0 161 51 25 6
Fund for Non-Independent Elderly 0 50 0 0 0
Wage supplement for personnel registered
with agency for temporary work at ports 0 18 14 8 0
Healthcare project in municipalities of
Taranto and Statte 0 50 20 0 0
Assistance and social-integration plan for
minors in Taranto 0 10 10 10 0
Additional compensation (CIGS) for ILVA
employees 0 24 0 0 0
Intangible interports network 0 5 5 5 5
Other 0 3 2 2 1
IMPACT ON NET BORROWING 0 0 0 0 0
Note: Discrepancies, if any, are due to rounding.

ECONOMIC AND FINANCIAL DOCUMENT - SECTION I STABILITY PROGRAMME
112 MINISTERO DELL’ECONOMIA E DELLE FINANZE
TABLE V.7 - EFFECTS OF DECREE-LAW NO. 244/2016 ON GENERAL GOVERNMENT NET BORROWING (before netting out induced effects; in € mn)
2016 2017 2018 2019 2020
INCREMENTAL RESOURCES 0 385 292 69 54
Higher revenue 0 45 7 6 6
Pensions: recovery from retirees of deviation between temporary and
final equalisation rate – fiscal effects - 0 41 0 0 0
Other 0 4 7 6 6
Lower expenditure 0 340 285 63 48
Pensions: recovery from retirees of deviation between temporary and
final equalisation rate 0 0 206 0 0
Fund for Multiannual Subsidies 0 121 1 0 0
Fund for Structural Economic-Policy Measures 0 53 20 12 10
Reduction of tax credits for mortgage loan amortisation for
reconstruction in Emilia 0 49 21 13 9
Fund for Non-Deferrable Needs 0 76 0 0 0
Special Fund: Capital portion 0 0 15 15 15
Special Fund: Current portion 0 4 8 11 10
Other 0 37 15 11 3
USE OF RESOURCES 0 382 106 48 33
Lower revenue 0 43 61 12 10
Pensions: recovery from retirees of deviation between temporary and
final equalisation rate – fiscal effects - 0 0 41 0 0
Renewal of IRPEF deduction for VAT payments on purchase of Energy
Class A or B housing sold by construction companies 0 0 16 9 9
Change in corporate tax deductions for start-up and expansion costs for
IAS/IFRS adopters 0 18 4 3 1
Exemption from IMU on buildings damaged by earthquakes in May 2012 0 25 0 0 0
Higher expenditure 0 339 45 36 23
Pensions: recovery from retirees of deviation between temporary and
final equalisation rate 0 208 0 0 0
Subsidy to compensate municipalities damaged earthquakes for cuts to
Municipal Solidarity Fund 0 18 16 13 9
Hiring at Istituto Superiore di Sanità 0 6 12 12 12
Extraordinary subsidy to municipalities damaged by earthquakes in
2016 0 32 0 0 0
Extension of unemployment benefit payments to persons working on a
coordinated and continuous basis 0 19 0 0 0
Extension to 2018 of suspension on payment of instalments on loans
granted by CDP to municipalities affected by earthquakes in 2012 0 5 4 0 0
Other 0 50 13 11 2
IMPACT ON NET BORROWING 0 3 186 21 21
Note: Discrepancies, if any, are due to rounding.

V. QUALITY OF THE PUBLIC FINANCES
MINISTERO DELL’ECONOMIA E DELLE FINANZE 113
2017 Budget Law and initial measures in 2017: impact on balances
The public finance budget for the 2017-2019 three-year period consists of the
measures provided by the Budget Law18 and those in Decree-Law No. 193/2016,
the latter of which contains fiscal provisions and provisions for refinancing non-
deferrable needs, which have financial effects as from 2016. The measures
provided are consistent with the public finance targets set out under the policy
scenario in the 2016 EFD Update and the simultaneous Report to Parliament. The
budget and the initial budget measures provided in 2017 are project to increase
net borrowing by approximately €11.9 billion in 2017, €6.6 billion in 2018, and
€2.8 billion in 2019, with essentially neutral effects in 2020 (Table V.8).19
TABLE V.8 NET CUMULATIVE EFFECTS OF THE 2017-2019 BUDGET AND INITIAL MEASURES IN 2017 (before netting out induced effects; in € mn) (1)
2016 2017 2018 2019 2020
2017 Budget Law (Law No. 232/2016) 0 -11,996 -7,067 -3,267 -467
Decree-Law No. 193/2016 (converted by
Law No. 225/2016) 1 17 483 483 483
Decree-Law No. 8/2017 0 0 42 0 0
Decree-Law No. 13/2017 0 2 6 6 6
NET BORROWING 1 -11,976 -6,536 -2,778 23
% of GDP 0.0 -0.7 -0.4 -0.2 0.0
NET BALANCE TO BE FINANCED 25 -15,010 -10,634 -6,270 -3,691
% of GDP 0.0 -0.9 -0.6 -0.3 -0.2
BORROWING REQUIREMENT 896 -13,360 -8,243 -4,433 -1,640
% of GDP 0.1 -0.8 -0.5 -0.2 -0.1
(1) The different effect, compared with net borrowing, on the State budget balance and on the borrowing
requirement is due to the different accounting criteria with respect to transactions affecting such aggregates, and
also to the fact that the aggregates refer to different institutional units.
Taken altogether, the provisions considered entail additional gross funding of
approximately €22.6 billion in 2017, €25.7 billion in 2018, €27.7 billion in 2019 and
€31.2 billion in 2019 (Table V.9). The procurement of the resources for the entire
period considered is essentially through higher revenue and lower expenditure,
with the latter mainly referring to the current component. The measures financed
amount to approximately €34.6 billion in 2017, €32.3 billion in 2018, €30.4 billion
in 2019, and €31.2 billion in 2020. For the four-year period, approximately 65
percent of the measures is represented by higher expenditure, and in particular,
the increasing trend of capital expenditure, which goes from €2.7 billion in 2017
to €9.5 billion in 2020. In cumulative terms, in the 2017-2020 four-year period,
18 The reform of the Accounting and Public Finance Act has provided, inter alia, for the unification of all
measures in one legislative act, bringing together the Budget Law and the former Stability Law. As a result, the section of the budget referable to the Budget Law is the first while and in Section II contained the provisions related to the refinancing, defunding, and re-planning.
19 For 2016, the measures adopted with Decree-Law No. 193/2016 entail a change in the mix of expenditure accounts in the general government consolidated account and the State budget, with a substantially neutral effect on the respective balances. Instead, an improvement of the borrowing requirement of approximately €0.9 billion is projected due to the financing of the SME Guarantee Fund, which, according to the accounting rules, impacts such balance only after the enforcement of the guarantee.

ECONOMIC AND FINANCIAL DOCUMENT - SECTION I STABILITY PROGRAMME
114 MINISTERO DELL’ECONOMIA E DELLE FINANZE
the net change in capital expenditure is greater (€18.7 billion) than that in the
current expenditure (€13.8 billion).
TABLE V.9 CUMULATIVE EFFECTS OF THE 2017-2019 BUDGET AND INITIAL MEASURES IN 2017 (before netting out induced effects; in € mn)
2016 2017 2018 2019 2020
INCREMENTAL RESOURCES 2,647 22,591 25,746 27,650 31,238
Higher revenue 2 10,490 16,438 14,928 14,630
Lower expenditure 2,645 12,101 9,308 12,722 16,607
- current expenditure 2,467 9,370 9,025 8,995 16,327
- capital expenditure 178 2,731 284 3,727 280
USE OF RESOURCES 2,646 34,567 32,282 30,428 31,215
Lower revenue 10 16,782 10,441 9,466 8,603
Higher expenditure 2,636 17,785 21,841 20,962 22,612
- current expenditure 1,315 15,132 15,712 13,578 13,103
- capital expenditure 1,321 2,653 6,129 7,384 9,509
Impact on net borrowing 1 -11,976 -6,536 -2,778 23
Change in net revenue -7 -6,292 5,997 5,462 6,028
Change in net expenditure -8 5,685 12,532 8,240 6,005
- current expenditure -1,151 5,763 6,687 4,582 -3,224
- capital expenditure 1,143 -78 5,845 3,657 9,229
Note: Discrepancies, if any, are due to rounding.
TABLE V.10 NET CUMULATIVE EFFECTS OF THE 2017-2019 BUDGET AND INITIAL MEASURES IN 2017 ON GENERAL GOVERNMENT NET BORROWING BY SUBSECTOR (before netting out induced effects; in € mn)
2016 2017 2018 2019 2020
CENTRAL GOVERNMENT 97 -8,168 -1,686 1,783 -3,638
- change in net revenue -2 -6,976 5,591 5,293 5,762
- change in net expenditure -99 1,192 7,277 3,510 9,400
LOCAL GOVERNMENT -91 -2,840 -2,567 -1,839 6,337
- change in net revenue -1 18 15 -312 -203
- change in net expenditure 90 2,858 2,583 1,527 -6,539
SOCIAL SECURITY FUNDS -5 -969 -2,282 -2,722 -2,676
- change in net revenue -4 666 390 482 468
- change in net expenditure 1 1,635 2,673 3,204 3,144
TOTAL 1 -11,976 -6,536 -2,778 23
Note: Discrepancies, if any, are due to rounding.
With reference to the general government subsectors (Table V.10), the
central government deficit in 2017 is due mainly to the deactivation of the VAT
clause provided by previous legislation. In later years, the trend of the central
government balance reflects an increase in expenditure, whose amount goes from
approximately €7.3 billion in 2018 to €9.4 billion in 2020. In 2017-2019, the local
government deficit is due to measures to relaunch public investment of the
territorial entities, as also ensured through the granting of additional financial
leeway. Instead, in 2020 it is expected an improvement of this subsector’s balance

V. QUALITY OF THE PUBLIC FINANCES
MINISTERO DELL’ECONOMIA E DELLE FINANZE 115
attributable to the extension of measures that ask for a contribution to public
finance objectives to the ordinary-statute regions and the Autonomous Provinces
of Trento and Bolzano, which terminated in 2019 under previous legislation. The
budget balance for the social security institutions deteriorates in all years
considered for the effect of the Budget Law’s provisions for social security sector.
2017 Budget Law: key measures
The budget for the 2017-2019 three-year period provides measures for:
reducing fiscal pressure; relaunching investment; strengthening welfare; and
improvement of human capital. A major part of the resources is absorbed by the
deactivation of the safeguard clause provided by previous legislation (which would
have entailed a 3-percentage-point increase in the reduced 10 percent VAT rate,
and a 2-percentage-point increase in the standard 22 percent VAT rate during
2017) and the neutralisation of the increase in excise taxes on fuels for 2017 and
2018. The two fiscal measures have a total impact equal to €15.3 billion in 2017
and €0.2 billion in 2018.
The 2017 Budget Law has extended deductions and tax incentives for:
building restructuring; the energy requalification and earthquake-proofing of
buildings; the purchase of furnishings and certain household appliances; and the
restructuring of tourist hotel accommodation facilities (approximately €0.14
billion in 2017, €1.6 billion in 2018, €1.8 billion in 2019 and €1.7 billion in 2020,
corresponding, on a net basis, to €0.04 billion in 2017, €0.8 billion in 2018, and
€1.6 billion in 2019 and in 2020).
Sole proprietors and partnerships that use ordinary accounting rules will take
advantage of an optional new system through which the introduction of the tax on
business income (IRI) will replace the ordinary personal income tax (CIT) rates
(€5.3 billion in 2018, €3.1 billion in 2019 and in 2020, which, net of the revenue
derived from the new tax, translates into a fiscal incentive of approximately €2
billion in 2018, €1.2 billion in 2019 and €1.3 billion in 2020). Another initiative to
lessen the fiscal burden for businesses aimed at their reviving investment is the
extension of measures that allow for higher depreciation upon the purchase of
new capital goods, and the introduction of hyper-amortisation scheme amounting
to up to 150 percent of the expenditure incurred for the purchase of high-
technology capital goods (€1.1 billion in 2018, €1.9 billion in 2019, and €1.6 billion
in 2020). In order to promote research and development, the rate of the tax credit
for intra muros investments has been raised from 25 percent to 50 percent with a
simultaneous increase in the limit of the credit available (0.7 billion in each of the
years of the 2018-2020 three-year period). The SME Guarantee Fund was
increased by approximately €0.9 billion for 2016 in order to support SMEs’ access
to credit, and new resources have been appropriated for future years (€0.02
billion in 2017, €0.08 billion in 2018 and €0.11 billion in 2019 and 2020) under the
so-called new ‘Sabatini Law’, namely, the financing incentive for the purchase of
new capital goods.
Workers in the private sector will benefit from the renewal of the
preferential tax relief of productivity bonuses, and measures to easy corporate
welfare programmes (€0.2 billion in 2017 and €0.4 billion in each of the years
from 2018 to 2020). Numerous changes affect the pension system. A new pension

ECONOMIC AND FINANCIAL DOCUMENT - SECTION I STABILITY PROGRAMME
116 MINISTERO DELL’ECONOMIA E DELLE FINANZE
advance (so-called voluntary APE) has been instituted on an experimental basis to
facilitate voluntary early retirement for persons who are at least 63 years old and
who would be entitled to regular retirement within three years and seven months.
The advance is a loan backed by a State guarantee and is to be repaid in monthly
instalments starting as of the regular retirement date for a term of 20 years. In
specific cases of need (age requirement of 63 is still applicable), the pension
advance (social APE) will be financed directly by the State with a monetary
benefit that does not require any repayment (€0.3 billion in 2017, €0.6 billion in
2018 and 2019 and €0.5 billion in 2020). Specific measures have been adopted to
facilitate the early retirement of workers who paid at least 12 months of
contributions before turning 19 years old, and who, although not meeting the age
requirement for regular retirement, have met the contributions requirement and
are suffering specific conditions of hardship (€0.4 billion in 2017 and €0.6 billion
per each of the years from 2018 to 2020). Resources amounting to €0.8 billion per
year as from 2017 have been appropriated for the payment of the so-called
‘fourteenth month’ of the pension for those persons whose total income does not
exceed two times’ the minimum pension. In addition, the ‘No Tax Area’ has been
changed for retirees, with an extension to all retirees of the non-taxable-income
threshold that has to date been available only to persons over 75 years old (€0.2
billion per year from 2017 to 2020). The budget also assures another safeguard
(the so-called ‘eighth safeguard’) to facilitate access to retirement for persons not
meeting the pension requirements introduced by Law No. 241/2011 (€0.1 billion in
2017 and approximately €0.3 billion per year from 2018 to 2020).
The budget measures in favour of households include the appropriation of
resources (€0.6 billion in 2017 and approximately €0.7 billion per year from 2018
to 2020) to finance various initiatives, including a lump-sum allowance of €800 for
new-born and the distribution of the sum of €1,000 for the payment of fees at
public and private crèches, and for the support of young children under age 3 who
are affected by serious chronic illnesses. In addition, as part of the effort to
prevent situations of serious economic hardship, an increase was appropriated to
the Fund for the Fight against Poverty and Social Exclusion (€0.15 billion in 2017
and €0.65 billion from 2018). The Social Fund for Employment and Training was
also refinanced for 2016 (approximately €0.6 billion).
Turning to immigration and the management of the refugee emergency, the
budget appropriations for 2016 included €0.6 billion for first reception centres and
€0.1 billion for the municipalities accommodating applicants for international
protection; new resources (approximately €0.5 billion) have been allocated for
2017 for both: i) intake and integration of undocumented foreigners; ii) dialogue
with the most important African countries in terms of the migratory routes.
In healthcare, with regard to financing of the national healthcare funding
requirement, the allocation of €1 billion per year for the purchase of cancer drugs
and innovative medicines were provided. In addition, current plans call for
accelerating the implementation of the electronic health file, through the use of
the existing infrastructure within the health insurance card system.

V. QUALITY OF THE PUBLIC FINANCES
MINISTERO DELL’ECONOMIA E DELLE FINANZE 117
In education and research, new resources have been appropriated for: the
implementation of the enabling act on the ‘Buona scuola’20 Programme
(approximately €0.25 billion in 2017 and €0.3 billion from 2018); expansion of the
teaching staff at schools (approximately €0.14 billion in 2017 and 0.4 billion from
2018, which, net of fiscal and social-contributions effects, decrease to
approximately €0.07 billion in 2017 and €0.2 billion from 2018); increasing the
Ordinary Financing Fund for Universities and the Fund for Research Entities, and
providing new resources to university departments meeting standards of
excellence, and for the right to education (overall about €0.2 billion for 2017 and
€0.5 billion per year for 2018 to 2020).
New resources21 have been assigned to public employment to finance: the
renewal of public employment contracts entailing charges to the State budget;
the recruitment, in addition to ordinary hiring authority, of personnel with open-
ended contract at the State administrations; and the revision of career at the
police, the armed forces, and the National Firefighters Corps (in terms of net
borrowing, approximately €1.5 billion in 2017 and €1.9 billion from 2018, which,
net of fiscal and social-contributions effects, amount to €1 billion in 2017 and a
€1.2 billion from 2018).
A special fund has been set up to relaunch the country’s public investment,
and it will be allocated pursuant to subsequent decrees of the Prime Minister for
financing various diverse initiatives in the sector22 with effects, in terms of net
borrowing, equal to approximately €0.6 billion in 2017, €2 billion in 2018, €3.5
billion in 2019 and €3 billion in 2020 (with corresponding funding of budget
appropriations equal to a total of €47.5 billion from 2017 to 2032). For the same
purpose, the regions, local entities and the Autonomous Provinces of Trento and
Bolzano have been granted a certain degree of financial leeway, with the charges
in terms of net borrowing equal to approximately €0.8 billion in 2017, €1.1 billion
in 2018 and in 2019, and €1 billion in 2020. In order to allow for rebuilding and
restoring the areas hit by earthquakes in 2016, and assisting the local population,
a tax credit for private reconstruction initiatives has been provided in connection
with access to the subsidised loans that will be financed on the state of
completion of the works (€0.4 billion in 2017, €0.5 billion in 2018, €0.6 billion in
2019 and €0.3 billion in 2020); in addition, direct public subsidies have been made
available for public reconstruction efforts (€0.2 billion in 2017, €0.3 billion in
2018, €0.4 billion in 2018 and €0.2 billion in 2020). The resources booked to the
budget for such purpose amount to a total of €7.1 billion from 2017 to 2047.
A special fund with €970 million of annual resources has been set up in favour
of territorial entities (which is rounded out by another fund of €2 billion for 2017
20 The provisions for implementation of the enabling act were definitively approved by the Council of
Ministers on 7 April 2017. 21 The resources provided for public employment have been appropriated to a special fund in the State
budget; these resources whose distribution was made by decree of the Prime Minister dated 27 February 2017. 22 The use of the fund may regard the following issues: transportation, roads, sustainable mobility, road
safety, requalification and accessibility of railway stations, infrastructure related to the water network and to waste processing and purification, research, land and soil protection, hydro-geological instability, environmental restoration and remediation, public building (including schools), high-technology industrial activities, support to exports, computerisation of court administration, seismic risk prevention, investment in urban renewal for securing the peripheral areas of metropolitan cities and provincial capitals, and elimination of architectural barriers.

ECONOMIC AND FINANCIAL DOCUMENT - SECTION I STABILITY PROGRAMME
118 MINISTERO DELL’ECONOMIA E DELLE FINANZE
with no effects on net borrowing, which is financed with resources booked to the
carryover account for the payment of public administration liabilities unused by
the regions, and sums available through the special accounting created under
Decree-Law No. 66/2014, for debt restructuring of the regions, unused by the
regions as of 31 December 2016). The purposes and criteria for allocation of this
fund will be defined in a special decree.
Finally, new resources have been allocated for refinancing international
missions (€0.9 billion in 2017, which, net of fiscal and social-contributions effects,
amount to €0.65 billion) and the definition of a National Plan for Sustainable
Mobility (€0.05 billion in 2018, €0.25 billion in 2019, and €0.2 billion in 2020).
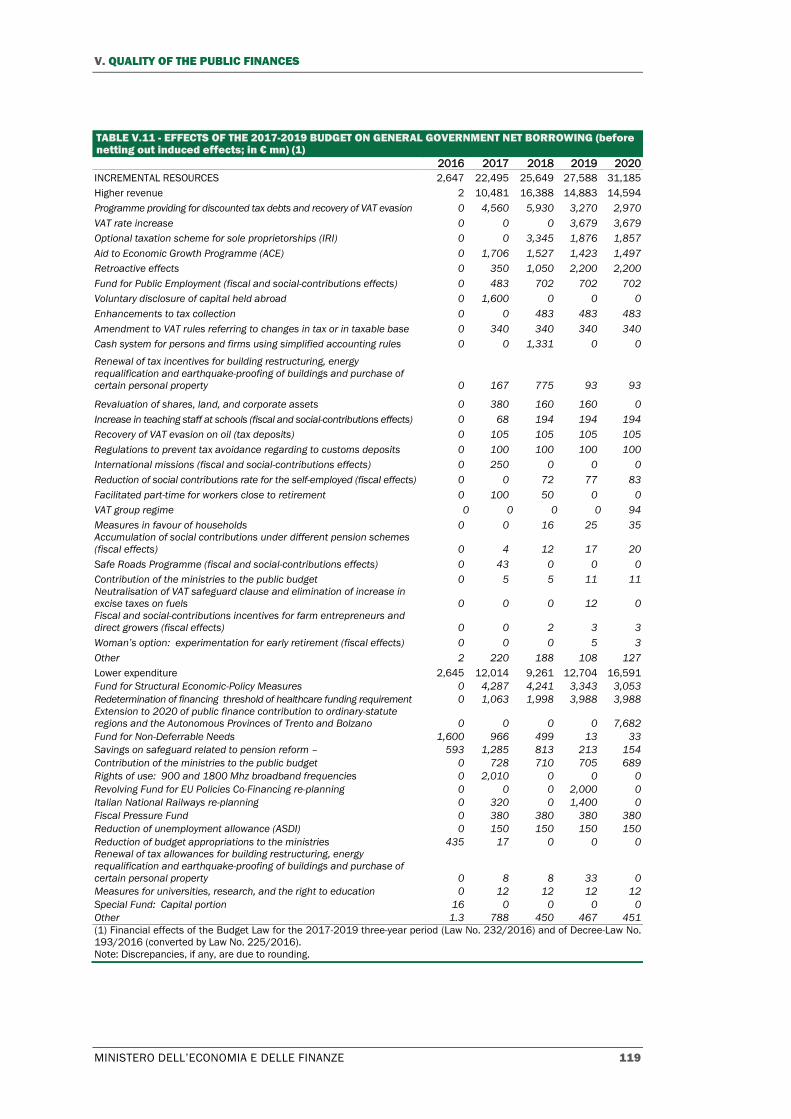
V. QUALITY OF THE PUBLIC FINANCES
MINISTERO DELL’ECONOMIA E DELLE FINANZE 119
TABLE V.11 - EFFECTS OF THE 2017-2019 BUDGET ON GENERAL GOVERNMENT NET BORROWING (before netting out induced effects; in € mn) (1)
2016 2017 2018 2019 2020
INCREMENTAL RESOURCES 2,647 22,495 25,649 27,588 31,185
Higher revenue 2 10,481 16,388 14,883 14,594
Programme providing for discounted tax debts and recovery of VAT evasion 0 4,560 5,930 3,270 2,970
VAT rate increase 0 0 0 3,679 3,679
Optional taxation scheme for sole proprietorships (IRI) 0 0 3,345 1,876 1,857
Aid to Economic Growth Programme (ACE) 0 1,706 1,527 1,423 1,497
Retroactive effects 0 350 1,050 2,200 2,200
Fund for Public Employment (fiscal and social-contributions effects) 0 483 702 702 702
Voluntary disclosure of capital held abroad 0 1,600 0 0 0
Enhancements to tax collection 0 0 483 483 483
Amendment to VAT rules referring to changes in tax or in taxable base 0 340 340 340 340
Cash system for persons and firms using simplified accounting rules 0 0 1,331 0 0
Renewal of tax incentives for building restructuring, energy
requalification and earthquake-proofing of buildings and purchase of
certain personal property 0 167 775 93 93
Revaluation of shares, land, and corporate assets 0 380 160 160 0
Increase in teaching staff at schools (fiscal and social-contributions effects) 0 68 194 194 194
Recovery of VAT evasion on oil (tax deposits) 0 105 105 105 105
Regulations to prevent tax avoidance regarding to customs deposits 0 100 100 100 100
International missions (fiscal and social-contributions effects) 0 250 0 0 0
Reduction of social contributions rate for the self-employed (fiscal effects) 0 0 72 77 83
Facilitated part-time for workers close to retirement 0 100 50 0 0
VAT group regime 0 0 0 0 94
Measures in favour of households 0 0 16 25 35
Accumulation of social contributions under different pension schemes
(fiscal effects) 0 4 12 17 20
Safe Roads Programme (fiscal and social-contributions effects) 0 43 0 0 0
Contribution of the ministries to the public budget 0 5 5 11 11
Neutralisation of VAT safeguard clause and elimination of increase in
excise taxes on fuels 0 0 0 12 0
Fiscal and social-contributions incentives for farm entrepreneurs and
direct growers (fiscal effects) 0 0 2 3 3
Woman’s option: experimentation for early retirement (fiscal effects) 0 0 0 5 3
Other 2 220 188 108 127
Lower expenditure 2,645 12,014 9,261 12,704 16,591
Fund for Structural Economic-Policy Measures 0 4,287 4,241 3,343 3,053
Redetermination of financing threshold of healthcare funding requirement 0 1,063 1,998 3,988 3,988
Extension to 2020 of public finance contribution to ordinary-statute
regions and the Autonomous Provinces of Trento and Bolzano 0 0 0 0 7,682
Fund for Non-Deferrable Needs 1,600 966 499 13 33
Savings on safeguard related to pension reform – 593 1,285 813 213 154
Contribution of the ministries to the public budget 0 728 710 705 689
Rights of use: 900 and 1800 Mhz broadband frequencies 0 2,010 0 0 0
Revolving Fund for EU Policies Co-Financing re-planning 0 0 0 2,000 0
Italian National Railways re-planning 0 320 0 1,400 0
Fiscal Pressure Fund 0 380 380 380 380
Reduction of unemployment allowance (ASDI) 0 150 150 150 150
Reduction of budget appropriations to the ministries 435 17 0 0 0
Renewal of tax allowances for building restructuring, energy
requalification and earthquake-proofing of buildings and purchase of
certain personal property 0 8 8 33 0
Measures for universities, research, and the right to education 0 12 12 12 12
Special Fund: Capital portion 16 0 0 0 0
Other 1.3 788 450 467 451
(1) Financial effects of the Budget Law for the 2017-2019 three-year period (Law No. 232/2016) and of Decree-Law No.
193/2016 (converted by Law No. 225/2016).
Note: Discrepancies, if any, are due to rounding.

ECONOMIC AND FINANCIAL DOCUMENT - SECTION I STABILITY PROGRAMME
120 MINISTERO DELL’ECONOMIA E DELLE FINANZE
TABLE V.11 (continued) - EFFECTS OF THE 2017-2019 BUDGET ON GENERAL GOVERNMENT NET BORROWING (before netting out induced effects; in € mn) (1)
2016 2017 2018 2019 2020
USE OF RESOURCES 2,646 34,474 32,233 30,372 31,169
Lower revenue 10 16,762 10,431 9,465 8,602
Neutralisation of VAT safeguard clause and elimination of increase
in excise taxes on fuels 0 15,353 199 0 0
Optional taxation scheme for sole proprietorships (IRI) 0 0 5,332 3,112 3,116
Renewal of tax allowances for building restructuring, energy
requalification and earthquake-proofing of buildings and purchase
of certain personal property 0 138 1,513 1,639 1,624
Accelerated depreciation – Hyper-depreciation 0 0 1,131 1,923 1,586
De-taxationof productivity bonuses and corporate welfare programmes 0 211 392 385 385
Reduction in rate of social contributions for self-employed 0 108 292 370 377
No Tax Area for retirees 0 213 247 246 246
Contribution to Solidarity Fund for Retraining and Requalification of
Credit Sector Personnel 0 174 224 139 87
Fiscal and social-contributions incentives for farm entrepreneurs
and direct growers 0 10 253 161 157
Cash system for persons and firms using simplified accounting
rules 0 0 0 553 0
Measures in favour of universities, research, and the right to education 0 55 105 105 105
Suspension of increase in additional municipal tax for air transport
embarkation fees 0 184 184 0 0
VAT group regime 0 0 0 158 158
Pension relief to injured military service personnel and surviving
orphans of military service personnel 0 43 48 48 48
Measures in favour of entrepreneurship by individuals and
innovative start-ups 0 0 39 62 84
Accumulation of social contributions under different pension
schemes 0 15 30 30 30
Revaluation of shareholdings, land, and corporate assets 0 0 0 3 64
Reduction of budget appropriations to the ministries (fiscal effects) 10 0 0 0 0
Contribution of the ministries to the public budget (fiscal and social-
contributions effects) 0 3 3 0 0
Other 0 254 440 532 535
Higher expenditure 2,636 17,712 21,801 20,907 22,567
Fund for Structural Economic-Policy Measures 0 4,340 4,286 3,270 2,970
Fund to be allocated to relaunching the nation’s development and
investments 0 629 1,968 3,500 3,000
Fund for Public Employment 0 1,481 1,933 1,933 1,933
Cancer drugs and innovative medicines (specific resources within
the healthcare funding requirement) 0 1,000 1,000 1,000 1,000
Fund for financing of measures in favour of territorial entities 0 970 970 970 970
Fourteenth month pension 0 800 800 800 800
Measures in favour of households 0 622 750 718 735
Renewal and enhancement of tax credit for research and
development 0 0 727 727 727
Italian National Railways re-planning 320 0 500 0 1,300
Fund for the Fight Against Poverty and Social Exclusion 0 150 650 650 650
Measures to facilitate pensions for workers entering the work force
before age 19 0 360 550 570 590
Social APE, pension advance 0 300 609 647 462
Revolving Fund for EU Policies Co-Financing re-planning 0 0 0 0 2,000
Private reconstruction following earthquake 0 400 500 600 300
Fund for Non-Deferrable Needs 0 364 1,192 105 114
Use of surplus restricted for investments for local entities 0 245 435 405 528
Measures in favour of universities, research, and the right to education 0 128 425 432 431
Increase in teaching staff at schools 0 140 400 400 400
(1) Financial effects of the Budget Law per the three-year period 2017-2019 (Law No. 232/2016) and of Decree-Law No.
193/2016 (converted by Law No. 225/2016).
Note: Discrepancies, if any, are due to rounding.

V. QUALITY OF THE PUBLIC FINANCES
MINISTERO DELL’ECONOMIA E DELLE FINANZE 121
TABLE V.11 (continued) - EFFECTS OF THE 2017-2019 BUDGET ON GENERAL GOVERNMENT NET BORROWING (before netting out induced effects; in € mn) (1)
2016 2017 2018 2019 2020
Fund for safeguarded workers 0 642 406 107 77
Use of surplus for regions’ investments 0 175 311 301 378
‘Buona scuola’ enabling act 0 250 300 300 300
Eighth safeguard 0 137 305 368 333
Public reconstruction following earthquakes 0 200 300 350 150
Use of the Multiannual Restricted Fund for Balanced Budget of Local
Government 0 304 296 302 0
International missions 0 900 0 0 0
Increase in SME Guarantee Fund 895 0 0 0 0
Accumulation of social contributions under different pension schemes 0 93 144 182 210
Migrant staying at intake centres: applicants for international protection 600 0 0 0 0
Social Fund for Employment and Training 593 0 0 0 0
Special Fund: Current portion 0 59 162 152 152
Measures for intake of migrants, and for dialogue with countries of
origin 0 520 0 0 0
Strategic National Plan for Sustainable Mobility 0 2 50 250 200
Special Fund: Capital portion 0 31 108 161 166
Relief for pension access for workers involved in stressful jobs 0 85 86 125 127
New Sabatini law 0 28 84 112 112
Rights of use: 900 and 1800 Mhz broadband frequencies 0 0 65 130 130
Financial leeway for investments by the Autonomous Provinces of
Trento and of Bolzano 0 50 73 98 103
Subsidy to the Valle d'Aosta Region 0 101 72 72 72
18-year-old card 0 290 0 0 0
Fund for enhancing police and firefighter vehicles and equipment 0 20 70 100 100
Tax credit for technological upgrade 0 0 245 0 0
Renewal of tax incentives for building restructuring, energy
Requalification and earthquake-proofing of buildings and purchase
of certain personal property 0 0 60 120 60
Woman’s option: experimentation for early retirement 0 18 47 88 69
Measures in favour of entrepreneurship by individuals and
innovative start-ups 0 95 95 0 0
School building repairs 0 128 0 0 0
Secure Roads Programme 0 123 0 0 0
Made-in-Italy promotion 0 62 52 2 0
Employment centres 0 110 0 0 0
Creation of fund for contribution to municipalities’ charges related to
intake of applicants for international protection 100 0 0 0 0
Voluntary APE, pension advance – 0 70 2 8 17
Italy’s equity investment in banks and funds 0 29 7 7 5
Programme providing for discounted payment of tax assessment and
recovery of VAT evasion 0 4 4 4 4
Optional taxation scheme for sole proprietorships (IRI) 0 0 1 2 4
Other 129 1,259 762 840 889
IMPACT ON NET BORROWING 1 -11,979 -6,584 -2,784 16
(1) Financial effects of the Budget Law per the three-year period 2017-2019 (Law No. 232/2016) and of Decree-Law No.
193/2016 (converted by Law No. 225/2016).
Note: Discrepancies, if any, are due to rounding.
Initial provisions adopted in 2017: measures for the reconstruction of the
areas damaged by earthquakes and immigration measures
A decree-law23 was issued in early 2017 that envisages new measures for the
communities damaged by earthquakes in 2016 and 2017. An income-support
measure provides for the payment of economic compensation related to the fight
against poverty (so-called support to active inclusion) in the case of households
23 Decree-Law No. 8/2017.

ECONOMIC AND FINANCIAL DOCUMENT - SECTION I STABILITY PROGRAMME
122 MINISTERO DELL’ECONOMIA E DELLE FINANZE
suffering economic hardship in the municipalities affected by the natural
disasters. At the same time, persons resident in the municipalities affected by the
earthquakes who earn income from business, self-employment and farming
activity have been granted the option of applying to credit institutions for
financing backed by State guarantees, for up to a total limit of €380 million for
2017; such persons will also get a suspension of pending tax payments until 30
November 2017 and a suspension for taxes due for the year of 2017. Interest in
relation to the financing funded will be covered by the State, and paid to the
credit institutions under the form of a tax credit. Finally, taxpayers in the areas
hit by earthquake in 2016 will get a one-year extension of the term for discounted
payments of amounts booked to the tax rolls for the 2000-2016 period.
Extraordinary measures have also been outlined regarding international
protection and the effort to fight illegal immigration.24 For such purposes, new
personnel have been hired for the Territorial Commissions for Recognition of
International Protection and the National Commission for the Right of Asylum, and
the network of repatriation centres has been expanded. In addition, legislative
provisions have mandated the creation, within certain ordinary courts, of sections
specialised in the subjects of immigration, international protection, and the
unrestricted movement of the citizens of the European Union.
TABLE V.12 - EFFECTS OF DECREE-LAW NO. 8/2017 ON GENERAL GOVERNMENT NET BORROWING
(before netting out induced effects; in € mn)
2016 2017 2018 2019 2020
INCREMENTAL RESOURCES 0 85 65 25 15
Higher revenue 0 1 21 10 1
1-year deferral of terms of payment for discounted payment of tax
assessment 0 0 20 9 0
Other 0 1 1 1 1
Lower expenditure 0 85 44 15 13
Fund for Structural Economic-Policy Measures 0 20 21 0 0
Fund for the Fight Against Poverty and Social Exclusion 0 41 0 0 0
Fund for Multi annual Subsidies 0 7 0 10 9
Special Fund: Current portion 0 0 21 2 2
Fund for Non-Deferrable Needs 0 15 0 0 0
Other 0 1 2 2 2
USE OF RESOURCES 0 85 23 24 14
Lower revenue 0 20 10 1 1
1-year deferral of terms of payment for, discounted payment of tax
assessment 0 20 9 0 0
Other 0 0 1 1 1
Higher expenditure 0 65 13 24 13
Income support to persons living in areas damaged by earthquake who are
experiencing economic hardship 0 41 0 0 0
Tax credit on interest for financing funded for tax payments 0 7 10 10 9
National Solidarity Fund 0 15 0 0 0
Fund for Structural Economic-Policy Measures 0 0 0 9 0
Other 0 2 3 5 5
IMPACT ON NET BORROWING 0 0 42 0 0
Note: Discrepancies, if any, are due to rounding.
24 Decree-law No. 13/2017.

V. QUALITY OF THE PUBLIC FINANCES
MINISTERO DELL’ECONOMIA E DELLE FINANZE 123
TABLE V.13 - EFFECTS OF DECREE-LAW NO. 13/2017 ON GENERAL GOVERNMENT NET BORROWING (before netting out induced effects; in € mn)
2016 2017 2018 2019 2020
INCREMENTAL RESOURCES 0 10 32 38 38
Higher revenue 0 8 29 35 35
Use of portion of the revenue derived from subsidy on insurance
premiums earned in State territory 0 6 23 28 28
Hiring of personnel at Territorial Commissions for Recognition of
International Protection and the National Commission for the Right of
Asylum – induced effects 0 1 5 5 5
Other 0 1 2 1 1
Lower expenditure 0 2 3 3 3
Special Fund: Current portion 0 2 3 3 3
Other 0 0 0 0 0
USE OF RESOURCES 0 8 26 31 31
Lower revenue 0 0 0 0 0
Higher expenditure 0 8 26 31 31
Operating costs from activation of the new positions in repatriation
centres 0 4 12 18 18
Hiring of personnel at Territorial Commissions for Recognition of
International Protection and the National Commission for the Right of
Asylum 0 3 10 10 10
Other 0 2 3 3 3
IMPACT ON NET BORROWING 0 2 6 6 6
Note: Discrepancies, if any, are due to rounding.
Measures to fight tax evasion
During 2016, the activity to recover taxes evaded resulted in a record collections of €19
billion. This extremely positive outcome reflects an increase of 28 percent over 2015, which,
in turn, represented a peak over a 10-year period. The trend of collections derived from
activity to fight tax evasion has shown record results in recent years: more than €48 billion
of higher tax revenue was collected in the 2014-2016 three-year period; approximately
€86.4 billion since 2011(see Figure R.1).
More specifically, the 2016 recovery of revenue lost through tax evasion is due to control
activity that produced receipts of €10.5 billion, with a 36-percent increase over 2015,
including €4.1 billion from voluntary disclosure; approximately €8 billion came from tax
settlement activity, with a 16-percent increase over 2015; and finally, approximately €500
million refers to spontaneous payments as a result of the promotion of taxpayer compliance,
with a 67-percent increase over 2015. In addition to the improvement in tax compliance,
the revenue coming from direct payments amounted to €13.7 billion (including the revenue
related to voluntary disclosure), and grew by 34 percent year on year. The payments from
forced collection came to €4.8 billion, rising by 9 percent year on year.
The government's action to fight tax evasion has been aimed not only at recovering tax
revenue through assessment and control activity (so-called ‘direct’ effect of the activity to
fight tax evasion), but also at improving taxpayers’ spontaneous compliance (so-called
‘indirect’ effect).
FO
CU
S

ECONOMIC AND FINANCIAL DOCUMENT - SECTION I STABILITY PROGRAMME
124 MINISTERO DELL’ECONOMIA E DELLE FINANZE
FIGURE R.1: RESULTS OF THE FIGHT AGAINST EVASION: TAX DUE TO THE TREASURY AND NON-TREASURY TAX REVENUE (in in € mn)
Source: Revenue Agency.
In line with this strategic approach, a key point of the implementation of the fiscal enabling
act for a transparent, equitable and growth-oriented taxation system is the monitoring and
official estimation of the evasion of taxes and social contributions25. In this regard, the
government is required: i) to present an annual report as part of the budgeting process to
outline the results achieved regarding to measures to prevent evasion of taxes and social
contributions; and ii) to make use, in the preparation of such report, of the results set out in
the ‘Report on the Underground Economy and on Evasion of Taxes and Social Contributions’
drawn up by an ad-hoc commission set up by decree of the Minister of the Economy and
Finance.26 The latter report is aimed at estimating the depth and breadth of the
phenomenon of evasion of taxes and social contributions, and producing an official
estimate of the amount of the revenue drained from the public budget as a result.
In coming up with the official estimate of the amount of tax revenue taken from the public
budget, the report considers the tax gap, which is calculated as the gap between taxes
actually paid and taxes that taxpayers should have paid within a system of perfect
compliance with tax obligations under existing legislation. The tax gap is thus a proxy of tax
evasion. On the basis of practices accepted at an international level, the Commission has
quantified the tax gap for the main taxes, making a distinction, where possible, between the
tax gap net of non-payments (assessment gap) and the tax gap due to non-payment
(collected gap).
Based on the most recent data available (2014), the evasion of taxes and social
contributions is estimated at €111,655 million, inclusive of tax evasion amounting to
€100,366 million (with an increase of tax evasion of €844 million compared with 2013); on
average, the evasion of taxes and social contributions amounted to €109,691 million for
the 2012-2014 period, with the amount referring to tax evasion only equal to €98,982
million. Compared with 2013, the tax gap referring to VAT rose by €1.1 billion in 2014, while
it fell by €245 million in relation to the regional tax on productive activity (IRAP). The
reduction related to corporate income taxes (CIT) (approximately €3.4 billion) was offset by
an increase of approximately €3.5 billion in relation to personal income taxes (PIT), which
25 Article 3, Law No. 23/2014 26 Article 10-bis.1, Law No. 196/2009, introduced by Legislative Decree No. 160/2015
0
2,000
4,000
6,000
8,000
10,000
12,000
14,000
16,000
18,000
20,000
2011 2012 2013 2014 2015 2016

V. QUALITY OF THE PUBLIC FINANCES
MINISTERO DELL’ECONOMIA E DELLE FINANZE 125
includes €1.2 billion referring to employees and €2.3 billion referring to the self-employed
and sole proprietorships. In the 2012-2014 three-year period, the propensity to evasion
rose from 23.6 percent to 24.8 percent. Compared with the 2013, the propensity to evade
PIT rose by a significant 1.8 percentage points for the self-employed and sole
proprietorships and 0.8 percentage points for employees who are not properly documented;
at the same time, the propensity to evade IRAP also rose, by 0.8 percentage points. Instead,
the propensity to evade CIT decreased by 1.5 percentage points. Modest changes were
seen for the other taxes.
The provisions to prevent tax evasion introduced by the 2015 Stability Law (such as the
split-payment mechanism and reverse charge) have allowed for a sizeable recovery of VAT
revenue, and this may generate a turnaround in the VAT gap. Ex-post assessments of the
VAT measures introduced have pointed to a recovery of total revenue of approximately
€3.77 billion, including approximately €2.1 billion attributable solely to the introduction of
the split-payment mechanism. Such recovery is far above the ex-ante quantification in the
technical report (€988 million coming from the introduction of the split payment and €900
million from the introduction of the reverse charge with reference to cleaning services,
green certificates, and the extension of the same to the specialised building sector).
These measures, aimed at countering the phenomenon of payment omission (particularly in
the case of the split payment) and the detection of undeclared taxable income, are part of a
strategy mainly based on a new, more collaborative relationship between the tax authorities
and taxpayers, driven by mutual trust, transparency and simplification. Since 2015, the
efforts to fight evasion have been mostly concentrated on a change in direction compared
with the traditional activity of auditing and ex-post assessment. The current focus is on
collaboration between the tax authorities, and businesses and individuals, so as to simplify
formalities, stimulate compliance with tax obligations, and facilitate the spontaneous
disclosure of the taxable base.
Two factors have been considered strategic in pursuing this objective: first, the
improvement of the services rendered to taxpayers from the standpoint of transparency and
administrative simplification; second, improvement in terms of efficiency and effectiveness
of the tax authorities, starting from enhancements to, and better use of, database. The
government’s objective is to step up the systematic and structured use of available
database, transaction-tracing systems, electronic invoicing, and electronic transmission of
transactions subject to VAT. Another step in this direction is the amendment of sector
studies, with the use of new reliability indices that can represent the basis for a more
selective award system for medium-/small-sized taxpayers.
New measures to prevent the evasion of taxes and social contributions approved in October
201627 include the abolition of certain fiscal formalities (including the ‘spesometro’) as from
1 January 2017, and the introduction of: i) a detailed quarterly report of data on invoices
issued and received; and ii) a quarterly report of data regarding periodic VAT payments.
The introduction of these measures should entail a revenue increase due to i) a stronger
incentive for compliance, through the deterrent actions put into effect by the Revenue
Agency, and ii) the acceleration of sums collected through automated controls. It is
estimated that the introduction of such measures will lead to a total revenue recovery of
€2.1 billion for the tax year of 2017.
Italy’s actions and strategies to prevent evasion will also take into account the key
recommendations contained in the recent IMF and OECD reports about the status of the
country’s fiscal administration. The activities to prevent evasion and avoidance of fiscal
obligations will also be strengthened through increasingly more effective administrative
cooperation at the international level. Stronger controls are expected with respect to those
27 Article 4, Decree-Law No. 193 of 22 October 2016.

ECONOMIC AND FINANCIAL DOCUMENT - SECTION I STABILITY PROGRAMME
126 MINISTERO DELL’ECONOMIA E DELLE FINANZE
taxpayers that structure sophisticated systems for evasion and/or avoidance, and they
should thus strengthen the fight against tax fraud, with particular reference to VAT and
excise taxes. A special emphasis will also be placed on operating synergies and the
exchange of information with other tax authorities in Europe and beyond, including
monitoring the objectives of the automated exchange of information for tax purposes
(Common Reporting Standard) and the Base Erosion Profit Shifting (BEPS) project. 28
Public Aid for Development (PDA)
According to preliminary estimates, PDA for 2016 amounted to 0.26 percent of Gross
National Income; this would represent an increase of 0.04 percentage points with respect to
the final figure for 2015, as certified by the OECD Development Aid Committee. If validated,
a similar increase would confirm the positive trend of PDA in recent years (0.17% in 2013,
0.19% in 2014 and 0.22% in 2015).
The figures confirm the government’s determination to meet the commitments taken at a
European and international level for cooperation in development. In pursuing these
commitments, Italy has undertaken to gradually realign the annual appropriations to the
OECD average, in line with the provisions of Article 30 of Law No. 125 of 2014 (Reform of
Italian cooperation in development).
Turning to the 2018-2020 three-year period, Italy has set the following intermediate
expenditure objectives: 0.27% of Gross National Income in 2018, 0.28% in 2019 and
0.30% in 2020. These objectives dovetail with the prospect of the European Union
achieving a 0.7% target as a whole by 2030, as provided by the Agenda for Sustainable
Development.
As part of such policy commitment, it is possible to confirm, during the period of reference,
the current increase of the resources of the Ministry of Foreign Affairs and International
Cooperation for cooperating in development, and to make immediately available the
resources for Italy’s prompt participation in the rebuilding of Multilateral Funds for the
Development.
V.2 SPENDING REVIEW
Measures adopted
In recent years, the spending review activity has represented a critical part of
budget strategy. This approach is aimed at improving control over public
expenditure, and allowing more efficient and effective allocation of public
resources, discarding the notion that public spending needs to be regularly
increased.
Overall, since 2014, the savings associated with measures to streamline
spending, in terms of net borrowing, amount to approximately €3.6 billion in 2014,
€18 billion in 2015, €25 billion in 2016, €29.9 billion in 2017, approximately €31.5
billion in 2018, and €26.8 billion in 2019, and they regard all tiers of government
(Table V.14).
28 In this regard, it is noted that Italian and Swiss authorities signed an agreement on 2 March about the
sharing of information for tax purposes, with respect to groups of taxpayers whose identification is based on specific profiles of behaviour patterns. The agreement is aimed at overcoming the issue of double taxation.
FO
CU
S

V. QUALITY OF THE PUBLIC FINANCES
MINISTERO DELL’ECONOMIA E DELLE FINANZE 127
TABLE V.14 - MEASURES TO STREAMLINE EXPENDITURE (contribution to net borrowing - in € mn)
2014 2015 2016 2017 2018 2019
Decree-Law No. 4/2014 (converted by Law No.
50/2014) 488 773 565 565 565 565
Decree-Law No. 66/2014 (converted by Law No.
89/2014) 3,120 2,972 2,800 2,727 503 503
Decree-Law No. 90/2014 (converted by Law No.
114/2014) 0 75 113 123 153 153
2015 Stability Law 0 12,159 13,001 14,154 15,814 8,995
Revision of 2015 Stability Law at unchanged policies 0 2,024 1,375 1,921 1,668 1,668
2016 Stability Law 0 0 7,176 8,155 9,976 10,240
2017 Budget Law 0 0 0 2,302 2,822 4,705
Total 3,608 18,003 25,030 29,947 31,500 26,828
Note: The savings are quantified net of the fiscal and social-contributions effects and, in the case of the regions,
provinces and local entities, are indicated prior to the usage allowed by easing the restrictions of the Domestic
Stability Pact or since the changeover to the new target budget balance (from 2016 onwards). It is noted that the
measures indicated have provided overall for spending cuts sometimes above those associated with the spending
review. The table refers only to measures for rationalisation and efficiency improvement. In addition, some of the
measures have been booked as part of revenue in the general government consolidated account.
Discrepancies, if any, are due to rounding. Source: State General Accounting Office analyses and estimates with
reference to data contained in the summaries of the financial effects of the measures, and technical reports in
relation thereto.
The 2017 Budget Law provides measures to streamline expenditure in an
amount equal to approximately €2.3 billion in 2017, €2.8 billion in 2018, and €4.7
billion in 2019.
These include: the redetermination of the financing of the standard national
healthcare funding requirement,29 a portion of the economies ascertained for the
pension safeguards not earmarked to finance measures within the welfare sector,
and measures to streamline the spending of the ministries. The measures to make
spending more efficient adopted by the ministries have been based on a procedure
already tested in prior years, and provided once the reform of the accounting and
public-finance law is complete. On this basis, each ministry is required to develop
its own proposals to amend existing legislation so as to achieve its targeted
savings. For this purpose, the Ministry of the Economy and Finance has shared the
valuation criteria underlying the proposals made by each administration, through
special exchanges that have served as the basis for each ministry to quantify its
contribution to the overall measures to be undertaken. The measures adopted
mainly regard current expenditure, and, among these, the budget appropriations
correlated to savings on expenditure already ascertained and the measures to hold
down spending on the purchase of goods and services. Other savings are
correlated to i) indemnities and interest for late payments to be paid to taxpayers
in the event of sums unduly collected by the revenue authorities, and ii) the
remuneration of Poste Italiane S.p.A. for management of postal current accounts.
Finally, there are lower operating costs for the Revenue Agency, and the Customs
and Monopoly Agency.
29 Such redetermination takes into account the appropriation of €1 billion per year for the purchase of
cancer drugs and innovative medicines.
ECONOMIC AND FINANCIAL DOCUMENT - SECTION I STABILITY PROGRAMME
128 MINISTERO DELL’ECONOMIA E DELLE FINANZE
A further contribution to making spending more efficient could come from
integrating the spending review into the economic-financial planning cycle, as
introduced with the reform of the accounting law.
The aim is to reinforce the top-down approach of economic-financial planning
and to anchor the ministries’ proposals of allocations to specific objectives
assigned in advance to each administration. In this way, there is an incentive
offered for an alternative valuation between the financing of ‘historical’ activities
and new spending needs, thereby favouring a mechanism to reallocate resources
among the various measures in relation to their effectiveness and/or the
government’s policy priorities.
MINISTERO DELL’ECONOMIA E DELLE FINANZE 129
VI. INSTITUTIONAL ASPECTS OF PUBLIC FINANCE
VI.1 STATE BUDGET REFORM: RECENT LEGISLATIVE DEVELOPMENTS
The process of reforming the State budget was completed with the approval
of Legislative Decrees No. 90/2016 and No. 93/2016, and Law No. 163/2016. Such
legislation provided for the implementation of an enabling act for the revision of
the State budget structure and another enabling act regarding the reorganisation
of rules governing the management of the budget and strengthening the function
of the budget on a cash basis. In addition, the rules about the content of the State
Budget Law have been revised in accordance with the Constitutional reform of
2012, which incorporated into Italy’s Constitution the balanced budget principle
provided at a supranational level, and the subsequent provisions for
implementation.1
With a coordinated approach, the three pieces of legislation provide for action with respect to the accounting framework, with the aim of ensuring more efficient planning and management of State expenditure. The new mechanisms introduced for such purpose include, inter alia, broader margins of flexibility for the ministries to allocate and manage resources, and the integration of the spending review in the budgeting cycle. The calendar for the economic-financial planning cycle was revised to allow for inclusion in the EFD Update of information about final data contained in the second ‘Notification of general government net borrowing and debt’, which is sent by 1 October by ISTAT to EUROSTAT. In order to reinforce the significance of the State budget and its role in resource allocation, the legislation provides for combining the bills for the Budget Law and the Stability Law into a single legislative act, and for the phasing out of special accounting operations by using the special accounts or Treasury current accounts. The reform has also enhanced the role of the cash budget, through the revision of the concept of assessment and commitment, the introduction of a specific payment plan, including in the planning stage (with the confirmation and enhancement of the plan during the budget management phase), and the revision of the regulations regarding expenditure carryovers. The transparency and the quality of the public finance data also improve, through the revision of the State budget structure, the introduction of the ‘actions’ (which provide a further functional definition of the budget programmes), the adoption of a chart of accounts, and the introduction, for informational purposes, of an accrual accounting alongside the commitment/cash accounting system.
Many of the changes provided have already been fully implemented. Among these, the Budget Law for the 2017-2019 three-year period was already drawn up according to the format for combining the previous Budget and Stability Bills into a single document, and it was structured to incorporate representation through
1 Constitutional Law No. 1/2012 and Article 15 of Law No. 243/2012.

ECONOMIC AND FINANCIAL DOCUMENT - SECTION I STABILITY PROGRAMME
130 MINISTERO DELL’ECONOMIA E DELLE FINANZE
‘actions’.2 In addition, a Decree of the Prime Minister has identified the Treasury accounting systems to be eliminated.
Other aspects of the reform need to be evaluated, in light of the actual impact on the ministries information systems and operating processes. Special testing periods have been provided for such cases: for example, the testing of the new concept of accounting commitment will be done from 1 October 2016 to 30 September 2017.3 Other analytical activities have been inaugurated, and should result in: i) the definition of a gender budgeting; ii) the application of an accrual accounting system; iii) the adoption of a chart of accounts; and the revision of the assessment concept.
A more detailed and comprehensive discussion of such aspects and of the
specific issues of State budget reform is included in Chapter III of the Report on
the Status of Implementation of the Reform of Public Finance and Accounting,
which is provided as an exhibit to this planning document.
VI.2 FISCAL RULES FOR LOCAL GOVERNMENT
Balanced budget rule
For roughly 16 years, the Domestic Stability Pact (DSP) defined the
contribution of regions, provinces and municipalities to the achievement of the
net borrowing target pursued at a national level in respect of the Stability and
Growth Pact. The DSP rules were significantly revised over time, and the Pact was
eventually replaced by the balanced budget rule adopted as from 2016. The
change is the direct consequence of Italy’s adoption at a national level of the
balanced budget principle and rules that will ensure rapid convergence toward
such target.
The process of substituting the DSP that began in 20124 was intensified with
the new regulations introduced in August 2016.5 The new regulations provide for a
single non-negative balance between final revenue and final expenditure (on
accruals basis), excluding the taking out or repayment of loans, both in the
forecast and in the statement phase. The elimination of numerous restrictions
initially provided in 2012 follows the enactment of the accounting reform for the
territorial entities,6 which, as from 1 January 2015, ensures: i) the respect of
current budget equilibrium for all territorial administrations; and ii) the
changeover to reporting with the enhanced financial accrual, which makes the
cash data less relevant for public finance analysis.
The regions, the Autonomous Provinces of Trento and Bolzano, the
metropolitan cities, the provinces, and all municipalities, regardless of the
number of inhabitants, are required to contribute to the achievement of national
2 Identified on an experimental basis with the decree of the President of the Council of Ministers dated 14
October 2016. 3 For the effect of the provisions set out in the decree of the Minister of the Economy and Finance dated 16
September 2016. 4 Law No. 243/2012. 5 Law No. 164/2016, which revised Title IV of Law No. 243/2012. 6 Legislative Decree No. 118/2011.

VI. INSTITUTIONAL ASPECTS OF PUBLIC FINANCE
MINISTERO DELL’ECONOMIA E DELLE FINANZE 131
public finance objectives. Such entities continue to have the obligation providing
certification to the MEF attesting to the fulfilment of their objectives, and the
MEF is responsible for monitoring respect of the rule.
The changes made in 2016 have not only simplified public finance
restrictions for the territorial entities, but they have also expanded the
possibilities for such entities to finance investment. Certain general principles
have remained in place in the interest of medium/long term sustainability and
with respect to the purposes for making use of debt; such principles include: i) the
territorial entities may borrow only for financing investment expenditure, within
the limits provided by State law;7 and ii) the borrowing must be accompanied by
amortisation plans with a term not exceeding the useful life of the investment,
and the plans must evidence the charges to be sustained and the funds to cover
for each individual fiscal year. These provisions are designed to ensure the
sustainability of the investment in the medium/long term. Instead, on the other
hand, the new rules allow for local public investments to be financed not only
through the use of debt, but also through the use of administration results in
previous years. As a result of amendments made to Article 10 of Law No.
243/2012, special regional agreements are to be used with respect to both
borrowing transactions in the respective territory, and the use of past surpluses
for investment transactions. The agreements must, at any rate, ensure the
respect of public finance objectives for the aggregate of all territorial entities of
the region involved, including the region itself.
Existing legislation provides for the inclusion of the Fondo Pluriennale
Vincolato (Restricted Long-Term Fund, RLTF) in the target balance, for both
revenue and expenditure. Such fund is made up of resources that are already
assessed in the current year, but earmarked for financing expenditure in later
years. The fund is thus a link between two or more fiscal years. The consideration
of the RLTF as part of income in the computation of the overall budget balance
will also likely entail further expansionist effects, particularly for the investment
expenditure of municipalities.
Finally, the regulatory framework provides for the possibility of a relationship
between the State and territorial entities that alternates depending on the
economic cycle: during downturns in the cycle or upon the manifestation of
exceptional events, the State will be expected to contribute, on a basis
compatible with public finance objectives, to the financing of the essential levels
of services concerning civil and social rights that must be ensured across the
entire country; during favourable phases of the economic cycle, the territorial
entities will be expected to contribute to reducing the debt of the general
government sector through payments to the State Securities Amortisation Fund.
The transition from the DSP to the new rules has bolstered the ongoing effort
since mid-2000 to hold down the net borrowing of local government and to
stabilise the debt of the same: in the past two years, local government has
produced a surplus, while its debt is falling, both in absolute terms and as a
percentage of GDP.
7 Such limits are set by Article 202 and the articles thereafter of Legislative Decree No. 267/2000 for local
entities, and by Article 62, Paragraph 6 of Legislative Decree No. 118/2011 for the regions and autonomous provinces.

ECONOMIC AND FINANCIAL DOCUMENT - SECTION I STABILITY PROGRAMME
132 MINISTERO DELL’ECONOMIA E DELLE FINANZE
FIGURE VI.1: LOCAL GOVERNMENT NET BORROWING AND DEBT (% of GDP)
Source: MEF calculations on data from ISTAT and Bank of Italy.
The reform of 2016 has been rounded out by the 2017 Budget Law, which has
revised the penalty-rewards system. The key change regards the distinction
between the lack of budget equilibrium due to an overrun that is less than, or
equal to or greater than, 3 percent of final revenue ascertained, which makes
gradual the impact of the penalty. While the sanctions provided in 2016 imposed a
total hiring freeze (for both full-time and term employment) in the event of lack
of a balanced budget, as from 2017, an overrun less than 3 percent of final
revenue only entails a hiring freeze for full-time employment, whereas it is still
possible to hire through term contracts, within the limits allowed by current
legislation.8 In the case of an overrun greater than or equal to 3 percent, a hiring
freeze goes into effect with respect to both full-time and term employment. The
gradual imposition of sanctions will also apply with reference to the limit on
current expenditure commitments and the payment of compensation and
attendance fees to regional president, mayor and local government council. In any
event, there are no changes to the provisions regarding the prohibition of
borrowing and the crime of fiscal avoidance with particular reference to pecuniary
sanctions to the public officials responsible. In addition, the economic sanction is
to be recovered over a three-year period.
In order to promote investments across the country, the 2017 Budget Law
grants financial leeway to local entities, as part of the national horizontal and
vertical pacts,9 for up to €700 million, including €300 million earmarked for school
construction works, and to the regions for up to €500 million.
8 The laws and regulations allow for the signing of contracts with a term ending no later than 31 December
2017, in order to ensure the exercise of the functions of civil protection, local police, public education, and social services, within the limits set on new hires in the public sector (turnover).
9 These tools for flexibility are aimed at reconciling the balanced budget objective with the need to get back to making public investments that are fundamental for the local and national economy. With the national horizontal and vertical pacts, the metropolitan cities, provinces and municipalities can benefit from greater financial leeway for investments transferred from the regions and from other local entities, respectively.
-1.0
0.5
2.0
3.5
5.0
6.5
8.0
9.5
11.0
-1.2
-1.0
-0.8
-0.6
-0.4
-0.2
0.0
0.2
0.4
0.6
1995 1998 2001 2004 2007 2010 2013 2016
Net borrowing Gross debt (RHS)

VI. INSTITUTIONAL ASPECTS OF PUBLIC FINANCE
MINISTERO DELL’ECONOMIA E DELLE FINANZE 133
The changeover from regional expenditure ceilings as provided by past
regulations to the new balanced budget rule was initiated in 2015 on the basis of a
phased-in approach. The application of the balanced budget rule was introduced
in advance for the ordinary-statute regions and the Region of Sardinia as from
2015. The rule was then extended to the Region of Sicily as of 2016.10 Starting in
2017, the balanced budget rule has also been applied to the Region of Valle
d'Aosta, whereas the DSP rules are still in effect for the Autonomous Region of
Friuli Venezia Giulia and the Autonomous Provinces of Trento and Bolzano.
Healthcare Pact and ceilings on pharmaceutical expenditure
The regions’ spending on healthcare is subject to the rules contained in the
Healthcare Pact, a three-year agreement negotiated between the State, the
regions and the Autonomous Provinces of Trento and Bolzano. Since 2000, such
counterparties have used the Pact for agreeing on the amount of resources to be
allocated to financing the National Healthcare Service (NHS) so as to i) ensure the
resources necessary for medium-term planning; ii) set the tools for the sector’s
governance, and the means for verifying the same.
Against the State financing of the NHS, the regions are required to ensure
equilibrium in the healthcare sector, through the full coverage of any deficits.
Automatic corrective measures are provided in the event of any deviation from
equilibrium, and these include, for example, an increase in the additional regional
personal income tax and the regional tax on productive activity, and the
prohibition against the substitution of any personnel going into retirement
(limitation on turnover). A key aspect of governance is the obligation for the
presentation of a deficit-reduction plan for any region incurring a deficit in the
healthcare sector above a threshold set by law.11 Such deficit-reduction plan must
set out the measures to be implemented to restore a balanced budget position
over a three-year period, and establish the tools for monitoring and verifying the
plan’s implementation. Finally, the Pact provides for compulsory administration
by a healthcare commissioner, if the deficit-reduction plan is not adequately
prepared, or it is not be implemented according to the pre-established terms and
conditions. As from 2016, the presentation of a deficit-reduction plan is also
obligatory for hospitals (including university hospitals), public care and recovery
institutes, and other entities that provide hospitalisation and health services,
which have significant cost-revenue imbalances12 or do not meet specific quality
and effectiveness parameters in providing their services.13
The most recent Healthcare Pact was signed on 10 July 2014, with reference
to the 2014-2016 three-year period. This Pact defined the level of State financing
of the NHS, and addressed issues related to the organisation and regulation of the
sector. The Pact was ratified by the 2015 Stability Law. For the years after 2016,
10 Such region must ensure a positive balance of no less than €577.5 million in 2017, and a non-negative
balance calculated with the balanced budget rule as from 2018. 11 The 5-percent threshold established is derived from the ratio between the regional nominal deficit and
the total amount of resources assigned by the State for financing the regional healthcare service. 12 Variance between costs and revenue in excess of 7 percent of revenue, or equal to at least €7 million in
absolute terms. 13 Article 1, Paragraphs 521-536, Law No. 208/2015 (2016 Stability Law).
ECONOMIC AND FINANCIAL DOCUMENT - SECTION I STABILITY PROGRAMME
134 MINISTERO DELL’ECONOMIA E DELLE FINANZE
more recent legislation has redefined the level of NHS financing, albeit in the
absence of a new pact. In particular, the 2017 Budget Law redefined the NHS
financing, setting it at €113 billion for 2017, €114 billion for 2018, and €115 billion
for 2019. Starting in 2017, a €1 billion portion of the financing of the standard
national healthcare requirement is earmarked for expenditure for the purchase of
specific types of medications.14
On 18 March, a Decree of the President of the Council of Ministers was
published regarding the update of Essential Levels of Care (ELC). The decree
defined the healthcare activities and services to be ensured to all citizens, and
also updated the list of pathologies for which an exemption is granted. The
previous ELC were outlined in 2001, and thus, the recent decree is fundamentally
important from the standpoint of ensuring healthcare services at efficient and
adequate conditions, and it also paved the way for an appropriation of €800
million of NHS financing that had been conditioned on the adoption of the decree.
In order to ensure regular updating of the ELC in the future, a special commission
established in 2016 has the responsibility of monitoring the proper delivery of the
ELC across the entire country, and annually proposing changes, if any, to the
Decree of the President of the Council of Ministers.
The ceilings on pharmaceutical expenditure were substantially modified by
the most recent Budget Law. Through 2016, the system for managing
pharmaceutical expenditure included two subsystems dedicated respectively to
territorial pharmaceutical expenditure15 and hospital pharmaceutical
expenditure.16 At a national level, such subsystems could not respectively exceed
an expenditure ceiling of 11.35 percent and 3.5 percent of the NHS financing. The
2017 Budget Law redefined the two subsystems, and changed the level of the
ceilings, though keeping the overall ceiling at 14.85 percent of NHS financing. The
ceiling on territorial pharmaceutical expenditure, which has been renamed ‘the
ceiling on pharmaceutical expenditure in relation to entities operating under
convention with the NHS’, has been cut from 11.35 percent to 7.96 percent, since
it is net of expenditure for essential medications and medications for chronic
illnesses that are distributed by healthcare facilities. Hospital pharmaceutical
expenditure refers to the ‘ceiling on pharmaceutical expenditure for direct
purchases’ and it is instead to be calculated inclusive of the expenditure for
pharmaceuticals distributed by healthcare facilities or through agreements with
territorial pharmacies, and it has thus been raised from 3.5 percent to 6.89
percent.17
The automatic correction mechanism (so-called payback) has been confirmed
for any instances when the ceilings are surpassed. Should ceiling on
14 Approximately €500 million for innovative drugs and €500 million for cancer drugs. 15 The territorial pharmaceutical expenditure indicates the expenditure referable to reimbursable drugs,
inclusive of the patients’ contribution to the expenditure, distributed through public and private pharmacies operating under agreement with the healthcare service, and directly (drugs provided to patients at healthcare facilities to be taken at the patients’ homes). Such distribution can also occur through specific agreements with territorial public and private pharmacies, which is known as distribution on account.
16 Hospital pharmaceutical expenditure indicates the expenditure referable to drugs used only in hospitals and not sold in public pharmacies and acquired from healthcare facilities directly managed by the NHS, with the exception of medicines distributed directly.
17 The expenditure of €1 billion earmarked for innovative medicines and cancer drugs as from 2017 is excluded from the computation of the ceilings.

VI. INSTITUTIONAL ASPECTS OF PUBLIC FINANCE
MINISTERO DELL’ECONOMIA E DELLE FINANZE 135
pharmaceutical expenditure in relation to entities operating under convention
with the NHS be surpassed, the overrun must be covered by the pharmaceutical
production-distribution chain (producers, wholesalers, and pharmacies); should
the ceiling on pharmaceutical expenditure for direct purchases be surpassed, the
overrun is charged to the regions (50 percent) and pharmaceutical companies (50
percent).

The ECONOMIC AND FINANCIAL DOCUMENT 2017
is available on-line at the internet address listed below:
www.mef.gov.it • www.dt.tesoro.it • www.rgs.mef.gov.it
ISSN 2239-5539