subpopulations of striatal interneurons can be distinguished on the basis of neurotrophic factor...
TRANSCRIPT

Subpopulations of Striatal InterneuronsCan Be Distinguished on the Basis of
Neurotrophic Factor Expression
JENNIFER L. BIZON,1 JULIE C. LAUTERBORN,2 AND CHRISTINE M. GALL1,2*1Department of Psychobiology, University of California, Irvine,
Irvine, California 92697–45502Department of Anatomy and Neurobiology, University of California, Irvine,
Irvine, California 92697–4292
ABSTRACTSubstantial evidence supports a role for trophic activities in the function and survival of
fully mature striatal neurons, but little is known regarding trophic factor expression in adultstriatum. In situ hybridization was used to identify the distribution and the neurotransmitterphenotypes (i.e., cholinergic and gamma-aminobutyric acid [GABA]-ergic) of cells expressingacidic fibroblast growth factor (aFGF), glial cell line–derived neurotrophic factor (GDNF), ornerve growth factor (NGF) mRNA in adult rat striatum. Each trophic factor mRNA waslocalized to large, sparsely scattered striatal cells that corresponded to interneurons.Double-labeling studies demonstrated that NGF mRNA was expressed by GABAergic andnever by cholinergic cells, whereas aFGF and GDNF mRNAs were expressed by both celltypes. Approximately 75% of aFGF1 and GDNF1 cells in dorsal striatum and 46% of aFGF1and 61% of GDNF1 cells in ventral striatum were cholinergic. Conversely, about 32% ofaFGF1 and 24% of GDNF1 cells in dorsal striatum and 55% of aFGF1 and 27% of GDNF1cells in ventral striatum were GABAergic. A portion of aFGF1 and NGF1 cells was of theparvalbumin GABAergic subtype. The colocalization of trophic factor expression was alsoexamined. Of aFGF1 cells, 20% and 41% were NGF1 and 67% and 83% were GDNF1 indorsal and ventral striata, respectively. These findings demonstrate that aFGF, GDNF, andNGF are synthesized by discrete but overlapping populations of striatal interneurons. Theexpression of these survival factors may contribute to the resistance of striatal interneurons tovarious insults including excitotoxicity. J. Comp. Neurol. 408:283–298, 1999.r 1999 Wiley-Liss, Inc.
Indexing terms: acidic fibroblast growth factor; glial cell line–derived neurotrophic factor; nerve
growth factor; striatum; cholinergic; parvalbumin
Striatal interneurons, particularly those of the choliner-gic phenotype, are resistant to various insults includingexcitotoxicity (Beal et al., 1989; Bazzett et al., 1993;Figueredo-Cardenas et al., 1994). Approximately 10% ofstriatal neurons have been identified as interneurons, andof these cells, several distinct neurochemical classes areknown (reviewed by Kawaguchi et al., 1995). Most simply,striatal interneurons can be divided into two major types:those that synthesize either acetylcholine or gamma-aminobutyric acid (GABA). The cholinergic neurons arelarge, aspiny cells that are sparsely but evenly distributedthroughout striatum and compose about 1% of all striatalneurons. The GABAergic interneurons are approximately10 times more abundant and have been further dividedinto several neurochemically distinct subpopulations(Kawaguchi et al., 1995). The largest of these (3–5% of all
striatal neurons) includes medium to large neurons thatexpress the calcium binding protein, parvalbumin (PARV).Beyond the interneurons, the majority of striatal cells instriatum (<90%) are medium spiny GABAergic projectionneurons, and it is this group that is the most vulnerable to
Grant sponsor: National Institute of Aging; Grant number: AG000538;Grant sponsor: NIH; Grant number: MH11142.
J.L. Bizon’s current address: Department of Psychology, Johns HopkinsUniversity, 3400 N Charles Street, Baltimore, MD 21218.
*Correspondence to: Christine M. Gall, Department of Anatomy andNeurobiology, University of California, Irvine, Irvine, CA 92697–4292.E-mail: [email protected]
Received 18 August 1998; Revised 23 December 1998; Accepted 29December 1998
THE JOURNAL OF COMPARATIVE NEUROLOGY 408:283–298 (1999)
r 1999 WILEY-LISS, INC.

excitotoxic insult and Huntington’s disease (Beal et al.,1986; Beal et al., 1991).
It is not known why specific populations of striatal cellsare relatively less vulnerable to insult, but locally synthe-sized trophic substances may contribute to this phenom-enon. Many trophic factors can reportedly protect striatalneurons, with different factors having some specificity fordifferent striatal cell types. In particular, cholinergic stria-tal interneurons can be rescued from quinolinic acid(QA)-mediated death by direct infusion of nerve growthfactor (NGF; Davies and Beardsall, 1992; Perez-Navarroet al., 1994; Venero et al., 1994) or implantation of NGF-producing, genetically modified neural stem cells or fibro-blasts (Frim et al., 1993a,b; Emerich et al., 1994; Kordoweret al., 1996; Martinez-Serrano and Bjorklund, 1996). Simi-larly, basic fibroblast growth factor (bFGF) can preservecholinergic indices after QA infusion (Frim et al., 1993b).Glial cell line–derived neurotrophic factor (GDNF), amember of the transforming growth factor-beta superfam-ily, enhances the number of calretinin-positive striatalinterneurons in embryonic cultures and can protect thesecells against glutamate toxicity (Farkas et al., 1997).These data demonstrate that striatal interneurons and inparticular the insult resistant cholinergic neurons areresponsive to several trophic factors and suggest thehypothesis that these cells are normally protected byendogenous trophic factors produced within striatum or bythe resistant cells themselves.
Recent in situ hybridization analyses have indicatedthat striatal interneurons may indeed express protectiveneurotrophic factors. We previously reported that acidicFGF (aFGF) mRNA is expressed by scattered striatalneurons and that a subpopulation of the aFGF mRNA-positive cells coexpress choline acetyltransferase (ChAT)mRNA (Bizon et al., 1996). Acidic and basic FGF havesimilar trophic activities in brain (Anderson et al., 1988;Walicke, 1988; Sasaki et al., 1992; Figueiredo et al., 1993;Nakata et al., 1993), and both bind to the FGF receptor,FGFR-1, expressed by basal forebrain cholinergic neurons(Asai et al., 1993; Yoshida et al., 1994). Thus, the striatalcholinergic interneurons themselves produce at least onetrophic factor, aFGF, that may confer autocrine trophicprotection (Bizon et al., 1996). In the previous study,noncholinergic aFGF mRNA1 striatal neurons also weredetected; the size and distribution of these cells wereconsistent with striatal interneurons, but the phenotypesof these neurons were not determined. Separate studieshave demonstrated that in adult rat scattered striatal cellsexpress GDNF mRNA (Trupp et al., 1997) and, followingexperimentally induced seizures, NGF mRNA (Lauterbornet al., 1994). Although the patterns of NGF mRNA andGDNF mRNA expressing cells correspond to the knowndistribution of striatal interneurons, the cell types express-ing these factors remain unknown.
In the present study, single- and double-labeling in situhybridization techniques were used (a) to test the predic-tion that striatal interneurons express one or more of theseneurotrophic factors and (b) to determine whether trophicphenotype further distinguishes classes of striatal interneu-rons. First, single in situ hybridization was used to eluci-date the distributions of aFGF, NGF, and GDNF in naiveadult rat striatum. Second, a double in situ hybridizationtechnique was used to identify the neurotransmitter phe-notypes (i.e., cholinergic or GABAergic) of striatal cellsexpressing these trophic factors. Third, the double-
labeling technique was used to determine the extent towhich aFGF, NGF, and GDNF mRNAs are coexpressed byindividual striatal neurons.
MATERIALS AND METHODS
Adult male Sprague-Dawley rats (n 5 17; SimonsenLaboratories, Gilroy, CA) were used. Rats were killed withan overdose of sodium pentobarbital (100 mg/kg) andintracardial perfusion with 4% paraformaldehyde in 0.1 Mphosphate buffer, pH 7.4 (PPB), either without priortreatment (n 5 12) or following an intracerebroventricular(ICV) injection of colchicine (n 5 4) or saline (n 5 1). ForICV injections, rats were anesthetized with ketamine (50mg/kg) and xylazine (10 mg/kg), and 5 µl of colchicine (10mg/ml in saline) or 0.9% saline were injected into the rightand left lateral ventricles (stereotaxic coordinates: 0.8 mmposterior, 1.3 mm lateral, and 4 mm ventral to Bregma)over a 5-minute period by using a 10-µl Hamilton syringe;these rats were killed either 24 (n 5 2 colchicine and 1saline) or 48 (n 5 2 colchicine) hours later. All animalprocedures were in accordance with approved institutionalanimal care procedures and NIH guidelines. After perfu-sion, the brains were removed from the cranium, postfixedin PPB (24 hours, 4°C), cryoprotected with 20% sucrose inPPB (24 hours, 4°C), and sectioned (25 µm, coronal) intocold PPB by using a freezing microtome. Adjacent series ofevery ninth tissue section through the striatum werecollected and stored at 4°C for either single- or double-label in situ hybridization analysis.
In situ hybridization
For single-labeling experiments, separate series of free-floating sections from naive rats (n 5 3) were processed forin situ hybridization by using 35S-labeled cRNAs for theisotopic detection of aFGF, NGF, or GDNF mRNAs. Fordouble-labeling experiments, sections were processed forin situ hybridization by using a cocktail of 35S-labeled anddigoxigenin (DIG)-labeled cRNA probes for the simulta-neous isotopic and colormetric detection of two distinctmRNAs. The specific combinations examined and therationale for each of these experiments are provided below.All riboprobes used in this study were transcribed from adigested cDNA construct by using the appropriate RNApolymerase in the presence of either 35S-uridine triphos-phate (UTP) or DIG-UTP (Table 1). Both single- anddouble-labeling in situ hybridization procedures have beendescribed elsewhere (Lauterborn et al., 1991; Bizon et al.,1996). Briefly, sections were pretreated with proteinase K(1 mg/ml in 0.1 M Tris buffer) for 30 minutes at 37°Cfollowed by 0.25% acetic anhydride in 0.1 M triethanol-
TABLE 1. Details of Riboprobes Used in Single-and Double-Labeling Experiments*
Riboprobe SpeciesLength
(bp) RS/poly1 Reference
aFGF Rat 510 Pvu II/T3 Bizon et al. (1996)NGF Rat 970 Pvu II/T3 Whittemore et al. (1988)GDNF Rat 633 Xba I/T3 Springer et al. (1994)GAD67 Cat 358 Bam HI/T7 Benson et al. (1992)ChAT Rat 431 Pvu II/T3 Lauterborn et al. (1993a)PARV Rat 240 Pvu II/T7 Berchtold and Means (1985)
*aFGF, acidic fibroblast growth factor; NGF, nerve growth factor; GDNF, glial cellline–derived neurotrophic factor; GAD67, glutamate decarboxylase 67; ChAT, cholineacetyltransferase; PARV, parvalbumin.1Restriction enzyme/RNA polymerase.
284 J.L. BIZON ET AL.

amine for 10 minutes and washed in 23 saline sodiumcitrate buffer (SSC; 13 SSC 5 0.15 M sodium chloride and0.015 M sodium citrate, pH 7.0). The tissue was thenhybridized at 60°C for 36–48 hours in buffer containing the35S-labeled cRNA at a final density of 1 3 106 cpm/100 µl.For the double-labeling experiments, the DIG-labeled cRNAalso was added to the hybridization solution at a finaldilution of 1:1,000. After hybridization, tissue was treatedwith ribonuclease A (20 mg/ml in 10 mM Tris saline buffer,pH 8.0, with 1 mM ethylene-diaminetetraacetic acid) for30 minutes at 45°C and washed in descending concentra-tions of SSC to a final rinse in 0.13 SSC at 60°C for 30minutes. For single in situ hybridization labeling, sectionswere then mounted onto gelatin-coated slides and pro-cessed for emulsion autoradiography by using KodakNTB2 emulsion (Kodak, Rochester, NY). For double in situhybridization labeling, the tissue was incubated for 15–20hours at room temperature in Tris-buffered saline (TBS)containing 2% normal sheep serum, 0.05% Triton-X 100,10 mM sodium thiosulfate, and alkaline phosphate conju-gated sheep anti-DIG antiserum (Boehringer Mannheim,Indianapolis, IN; final dilution 1:1,000). For colormetriclocalization, sections were rinsed in TBS and incubated innitroblue tetrazolium/5-bromo-4 chloro-3-indolyl phos-phate for 4–10 hours. Following the reaction, sections wererinsed, mounted onto gelatin-coated slides, and processedfor emulsion autoradiography by using Ilford K5.d emul-sion (Polysciences, Warrington, PA).
After 3–6 weeks, slides generated from both single anddouble in situ hybridization studies were developed withKodak D19 (diluted 1:1 with H2O) and fixed with Kodakregular fixer. For single-label studies, tissue was Nisslstained, dehydrated, and coverslipped with Permount. Fordouble-label studies, slides were quickly rinsed throughascending concentrations of alcohols and Americlear andcoverslipped with Permount diluted 2:1 with xylene. Emul-sion autoradiograms were photographed in darkfield byusing Plus X film (Kodak) and in brightfield using Ekta-chrome 100 color film (Kodak). Image Delux software(Adobe Systems Incorporated, Mountain View, CA) wasused to prepare photographic illustrations. Some imagecolor enhancement (color plates) and density adjustmentswere made to sharpen autoradiographic grains and bal-ance background levels among panels in a given plate.
Double-labeling experiments: Rationaleand description
The distributions and sizes of striatal neurons express-ing aFGF, GDNF, and NGF mRNAs suggested that thesemRNAs were localized within interneurons. Striatal inter-neurons are either cholinergic or GABAergic. ChAT andglutamate decarboxylase (GAD) are the enzymes respon-sible for acetylcholine and GABA synthesis, respectively,and serve as reliable markers for the distinct populations
of cholinergic and GABAergic cells (Kosaka et al., 1988).Thus, to identify the neurotransmitter phenotype of tro-phic factor–producing cells, experiments used double-labeling in situ hybridization to evaluate the colocalizationof aFGF, GDNF, or NGF mRNA with ChAT or glutamatedecarboxylase 67 (GAD67) mRNA. It is important to notethat there are two known isoforms of GAD in striatum: theGAD67 cRNA used in the present study is preferentiallyexpressed by the medium to large GABAergic interneu-rons as opposed to the more abundant, medium, spinyprojection neurons that are also GABAergic but preferen-tially express GAD65 mRNA (Mercugliano et al., 1992).
Given that PARV-expressing neurons comprise the larg-est GABAergic interneuronal subpopulation (reviewed inKawaguchi et al., 1995), in those instances in whichmRNAs of a trophic factor and GAD67 were highly colocal-ized, additional tissue sections were processed to evaluatecolocalization of mRNAs for the trophic factor and PARV.Parvalbumin-expressing neurons are distributed primar-ily in dorsolateral and ventral striata, with very fewlabeled neurons detected in dorsomedial regions (Kubotaand Kawaguchi, 1993). Therefore, quantification in themedial striatum was excluded from analyses involvingPARV cRNA labeling. Additional tissue sections werehybridized with a cocktail containing 35S-labeled aFGFcRNA, DIG-labeled ChAT cRNA, and DIG-labeled PARVcRNA to determine whether all striatal aFGF mRNAexpression was by interneurons. To determine whetherstriatal neurons express multiple trophic factors, tissuesections were cohybridized with DIG-labeled aFGF andeither 35S-labeled GDNF or 35S-labeled NGF cRNA. Thedouble-labeling combinations are summarized in Table 2.
Tissue sections from untreated rats were processed in allinstances, but because of the difficulty in detecting NGFcRNA-labeled cells in tissue from naive animals processedfor double in situ hybridization, additional sections fromcolchicine-treated rats were included in experiments involv-ing this factor (Table 2). Colchicine-treatment has beenreported to elevate NGF mRNA expression in basal fore-brain (Ceccatelli et al., 1991) and thus was chosen toincrease striatal NGF mRNA content to levels that couldbe reliably detected for double-labeling experiments. Sec-tions from rats given ICV saline were processed to assesspossible changes in NGF mRNA expression resulting fromsurgical procedures alone.
Analysis of colocalization
For cell plots and quantification, camera lucida draw-ings were constructed of rostral striatum (0.48–1.00 mmanterior to Bregma; Paxinos and Watson, 1986) by using acombination of brightfield and darkfield microscopy toevaluate single- and double-labeled cells. Cells were consid-ered labeled if the color reaction product (for DIG-labeledcRNA) or grain density (for 35S-labeled cRNA) appeared to
TABLE 2. Summary of Animals and Probes Used in Colocalization Experiments*
DIGChAT DIGGAD67 DIGPARV DIGaFGF DIGChAT 1 DIGPARV
35S-aFGF Naive (n 5 3) Naive (n 5 3) Naive (n 5 3) — Naive (n 5 3)35S-GDNF Naive (n 5 3) Naive (n 5 3) — Naive (n 5 5) —35S-NGF Naive (n 5 3) Naive (n 5 3) Naive (n 5 3) Naive (n 5 3) —
Saline (n 5 1) Saline (n 5 1) Saline (n 5 1) Saline (n 5 1)Colch1 (n 5 4) Colch1 (n 5 4) Colch1 (n 5 4) Colch1 (n 5 4)
1Colchicine (Colch)-treated rats killed 24 (n 5 2) and 48 (n 5 2) hours after intracerebroventricular infusion.*DIG, digoxigenin; ChAT, choline acetyltransferase; GAD67, glutamate decarboxylase 67; PARV, parvalbumin; aFGF, acidic fibroblast growth factor; GDNF, glial cell line–derivedneurotrophic factor; NGF, nerve growth factor.
STRIATAL INTERNEURONAL TROPHIC FACTORS 285

be at least twice that of background levels. Backgroundlevel, estimated from several fields (i.e., striatum, septum,surrounding cortices, and white matter), was generallyvery low (vide infra). Thus, cells with greater than twicethe density of labeling were easily distinguished andtermed labeled, although this criterion may have excludedextremely low-expressing cells from analysis, particularlyfor the color reaction product. For the presentation of cellplots, one section per probe combination was plotted in itsentirety (including dorsal and ventral striata and olfactorytubercle) by using Brain Maps, Version 1 (Swanson, 1992).For quantification, single- and double-labeled cells wereplotted from three defined striatal sectors (1.8 mm2 each)in three sections from each of two rats per probe combina-tion (see Fig. 1 for sector definition); for each probecombination, tissue from a third rat was qualitativelyevaluated to verify the general trends determined by thequantitative analysis. From the resultant plots, single-and double-labeled cells were counted and incidence ofcolocalization was determined for each sector. Percentagesof double-labeled cells within individual sections wereaveraged to generate a mean value per sector for each rat.Numbers reported reflect individual animal means and,unless otherwise noted, were within 15% of numbersobtained from the second animal quantified for the sameprobe combination.
Controls
Tissue processed for double in situ hybridization wasused to determine both the effects of colchicine treatmenton ChAT, PARV, and GAD67 cRNA-labeling and the rela-tive sensitivities of the 35S- and DIG-labeled cRNAs. For
the colchicine analysis, camera lucida drawings wereconstructed of two tissue sections each from naive andcolchicine-treated rats (2–3 animals per condition). Byusing brightfield microscopy, cells that were ChAT, PARV,or GAD67 cRNA positive (cRNA1) in dorsal striatum,ventral striatum, and olfactory tubercle were plotted,counted, and averaged to generate a mean value reflectingthe total number of labeled cells per section. Individualanimal means were averaged to yield a group mean 6standard deviation. Group means were compared by usingeither one-way analysis of variance (ANOVA; for threeitems) or Student’s t-test (for two items). In all instances,P , 0.05 was considered significant. Similar counting andstatistical techniques were used to evaluate the labelingsensitivity of the 35S- and DIG-labeled cRNAs. Numbers ofaFGF cRNA1 neurons counted in sections from naiveanimals processed for the localization of 35S-labeled aFGFand DIG-labeled ChAT cRNAs were compared with thoseobtained from sections processed for the localization of35S-labeled NGF and DIG-labeled aFGF cRNAs.
RESULTS
The following results describe the characterization oftrophic factor expressing cells in striatum when using bothsingle- and double-labeling techniques. The distribution ofaFGF, GDNF, and NGF mRNA expression in naive ratstriatum is described; following this section, results fromthree series of colocalization experiments are presented.First, the neurotransmitter phenotypes of each trophicfactor expressing cell type are characterized (e.g., theproportion of aFGF cRNA1 cells that was ChAT, GAD, orPARV cRNA1). Second, the trophic factor synthetic capac-ity of the major, phenotypically distinct subclasses ofstriatal interneurons is addressed (e.g., the proportion ofChAT cRNA1 cells that are aFGF cRNA1). Third, thedegree to which the trophic factors under analysis arecoexpressed by individual striatal cells is evaluated.
Single-label in situ hybridization
In untreated adult rat, aFGF and GDNF cRNAs labeledlarge cells that were evenly but sparsely distributedthroughout striatum and olfactory tubercle (Fig. 2A–B’).NGF cRNA also labeled scattered cells in these regions(Fig. 2C,C’), but the NGF cRNA1 cells appeared somewhatsmaller in size and more abundant (compare Fig. 2C’ with2A’,B’). Notably, NGF cRNA hybridization was variableand barely detectable in tissue from some naive rats.Overall, aFGF cRNA appeared to label striatal neuronsmost densely, followed by GDNF and NGF cRNAs, respec-tively.
Colocalization analyses
Sensitivity of DIG- and 35S-labeled cRNAs. A con-cern in double-labeling studies is that one marker may bemore sensitive than the other, a situation that could giverise to seemingly single-labeled cells that actually containboth cRNAs under analysis. To determine whether thereare disparities in the relative sensitivities of DIG- and35S-labeled cRNAs with the present double-labeling insitu hybridization technique, numbers of aFGF cRNA1cells were counted in tissue sections from naive animalshybridized with either 35S-aFGF/DIGChAT cRNAs orDIGaFGF/35S-NGF cRNAs. Although a greater degree ofvariability was observed in the number of cells detected
Fig. 1. Line drawing showing the three sectors within whichsingle- and double-labeled cells were plotted and counted. Each sectorcorresponds to a 1.2-mm 3 1.45-mm field of neostriatum and/orolfactory tubercle. ac, anterior commissure; cc, corpus callosum; DM,dorsomedial striatum; DL, dorsolateral striatum; Ventral, ventralstriatum and olfactory tubercle.
286 J.L. BIZON ET AL.

with the DIG-labeled cRNA, the total numbers of aFGFcRNA1 cells labeled with the two probes were not signifi-cantly different (P 5 0.2, unpaired Student’s t-test; Fig. 3).
Characterization of aFGF mRNA–containing cells.
Colocalization with ChAT mRNA. In agreement with aprevious report (Bizon et al., 1996), aFGF and ChATcRNA-labeled cells were similarly distributed throughoutrat striatum, and partial colocalization of these cRNAswas detected in each analysis sector (Fig. 4A,A’,D). Asshown in Figure 4A, ChAT cRNA-labeled cells were gener-ally large and contained a very intense purple reactionproduct. Moreover, both single- and double-labeled35S-aFGF cRNA1 cells in all combinations were large andeasily distinguished by a distinct clustering of autoradio-graphic grains (Fig. 4A–C’). Percentages of aFGF cRNA1neurons that were also labeled with ChAT cRNA differed
with region (Table 3). In dorsal striatum, the large major-ity (.70%) of aFGF cRNA1 neurons were double labeledwith ChAT cRNA, whereas in ventral striatum and olfac-tory tubercle, fewer than half of the aFGF cRNA1 cellswere double labeled (Table 3, Fig. 4D).
Colocalization of aFGF mRNA with GAD67 mRNA. Asubstantial number of aFGF cRNA1 neurons also weredouble labeled with GAD67 cRNA. Although the DIGGAD67cRNA lightly labeled many striatal cells, some large neu-rons (roughly three times greater in number than ChATcRNA1 neurons identified in adjacent sections) were veryintensely labeled (purple cells shown in Fig. 4B). Thelatter GAD67 cRNA1 cells were rather evenly distributedthroughout the striatum and olfactory tubercle, with theexception of a notable accumulation in the most medialaspect of dorsal striatum. Acidic FGF mRNA was localized
Fig. 2. Darkfield photomicrographs showing the autoradiographiclocalization of acidic fibroblast growth factor (A,A’), glial cell line–derived neurotrophic factor (GDNF; B,B’), and nerve growth factor(NGF; C,C’) in untreated adult rat striatum at a rostral plane ofsection. Bottom panels (A’–C’) show, at higher magnification, labelingin the dorsomedial portion of striatum excerpted from the correspond-
ing top panels (A–C). With each cRNA, labeled cells (solid arrows) arescattered throughout the caudate/putamen (CP) and olfactory tubercle(OT). GDNF cRNA also labels layers II and III of olfactory tubercle(open arrow in B) and NGF cRNA also labels piriform cortex (PIR inC). ac, anterior commissure. Scale bar 5 1 mm in A–C, 285 µm in A’–C’.
STRIATAL INTERNEURONAL TROPHIC FACTORS 287

in a small subset of the densely labeled GAD67 cRNA1neurons. Overall, numbers of aFGF cRNA1 cells doublelabeled with GAD67 cRNA differed with region and werecomplementary to the numbers of cells double labeled withaFGF and ChAT cRNAs; i.e., aFGF cRNA was most highlycolocalized with GAD67 cRNA in areas with the lowestincidence of aFGF and ChAT cRNA colocalization, andvice-versa (Table 3). Thus, levels of aFGF/GAD67 colocal-ization were highest in ventral striatum and olfactorytubercle and were much lower in dorsal regions.
Colocalization of aFGF mRNA with PARV mRNA. Inagreement with previous descriptions of the distributionsof striatal PARV1 neurons (Gerfen et al., 1985; Kita et al.,1990; Kubota and Kawaguchi, 1993; Augood et al., 1994),cells labeled with PARV cRNA were most numerous withindorsolateral and ventral striata, with only a few scatteredcells present in dorsomedial striatum (Fig. 4E). The purplereaction product in most DIGPARV cRNA1 neurons filledthe entire cytoplasm, although, in some cells, color label-ing was present only in the periphery of the somata andsurrounded an unlabeled nuclear region (Fig. 4C). Colocal-ization of aFGF and PARV cRNAs was observed in bothdorsolateral (Fig. 4C,C’) and ventral striata, but thedouble-labeled cells comprised a minority of the totalnumbers of striatal neurons labeled with either the aFGFor PARV cRNAs (Fig. 4E). The percentage of aFGF cRNA1neurons double labeled with PARV cRNA was very similarto the percentage of aFGF/GAD67 cRNA1 cells and withnumbers of single-labeled aFGF cRNA1 cells in the aFGF/ChAT colocalization analysis (Table 3). These values sug-gest that all of the aFGF cRNA1 cells in striatum andolfactory tubercle that are not labeled with ChAT cRNAare contained within the PARV mRNA1 subpopulation ofGABAergic interneurons. This hypothesis was tested byevaluating tissue sections simultaneously hybridized witha cocktail containing 35S-labeled aFGF cRNA, DIG-labeledChAT cRNA, and DIG-labeled PARV cRNA. Virtually allaFGF cRNA1 neurons in the dorsal striatum were double
labeled (Table 3), as would be predicted when aFGF-expressing cells are completely contained within the thesetwo phenotypes. There was, however, a significant popula-tion of single aFGF cRNA1 cells (25%) unaccounted for inventral striatum.
Characterization of GDNF mRNA–containing cells.
Colocalization with ChAT and mRNA. As shown inFigure 5A,F, GDNF and ChAT mRNAs were partly colocal-ized in striatum. Color-labeled ChAT cRNA1 cells weresimilar in size and distribution to those described above.Autoradiographically labeled GDNF cRNA1 cells werelarge and scattered throughout the striatum and olfactorytubercle. High numbers (.60%) of GDNF cRNA1 cellswere double labeled in all regions examined, with thegreatest numbers of GDNF mRNA1 cells double labeledwith ChAT cRNA in dorsolateral striatum (Table 4).
Colocalization with GAD67 mRNA. Two distinct sub-sets of DIGGAD67 cRNA1 cells were identified in tissueprocessed for GDNF/GAD mRNA colocalization, includinglarge, intensely purple cells described in previous materialand more abundant, more lightly stained cells (Fig. 5C).The GDNF and GAD67 mRNAs were partly colocalizedthroughout striatum and olfactory tubercle (Table 4). Insome instances, the GDNF cRNA localized to GAD67cRNA1 cells with a very intense color reaction product,although some double-labeled GDNF cRNA1 cells in thedorsomedial striatum had a lighter purple color and werenot among the darkest cells in the surrounding field(Fig. 5C). The complementary colocalization percentagesindicate that there are two distinct subpopulations ofGDNF mRNA1 cells, one ChAT mRNA1 and anotherGAD67 mRNA1 (Table 4), with virtually no additionalGDNF cRNA1 cells unaccounted for.
Characterization of NGF cRNA–labeled cells.
Single labeling following colchicine infusion. Due tolow levels of expression, NGF cRNA1 cells could not beidentified reliably and with confidence in tissue from naiverats processed for double labeling. Colchicine-treatmenthas been reported to increase NGF mRNA levels and the insitu hybridization detection of NGF mRNA1 cells (Cecca-telli et al., 1991). Therefore, animals treated with ICVcolchicine were used in the colocalization studies involvingNGF. In all instances, labeling in saline-infused controlrats was comparable to that observed in naive animals. Intissue from rats killed 24 or 48 hours following colchicineinfusion, the NGF cRNA labeled medium to large cellsscattered throughout striatum and olfactory tubercle(Fig. 5G). The number of NGF cRNA1 neurons detectedincreased with survival after colchicine treatment; num-bers of NGF cRNA1 neurons in 48-hour rats were 80%greater than the 24-hour values in dorsomedial and ven-tral sectors and 40% greater than the 24-hour values in thedorsolateral sector. Even in rats killed 48 hours aftercolchicine treatment, the NGF cRNA-labeled cells were ofsimilar size to those in naive rat striatum and comprisedonly a very small portion of the total number of striatalneurons. However, unlike the distribution of labeling innaive rats, NGF cRNA1 cells in colchicine-treated ratswere distributed with a decreasing medial-to-lateral gradi-ent in striatum (compare Fig. 2C with the plot in Fig. 5G).
The use of colchicine to show NGF mRNA1 cells raisedconcern that this treatment might influence the expres-sion and detection of other phenotypic markers. For thisreason, labeling properties and numbers of ChAT, GAD67,and PARV cRNA1 cells were evaluated in sections from
Fig. 3. Bar graph showing a comparison of the total number ofacidic fibroblast growth factor (aFGF) cRNA-positive neurons detectedin rat striatum when using either digoxigenin (DIG)-labeled or35S-labeled cRNA probes. Counts (6S.E.) were obtained from semi-adjacent tissue sections taken from two untreated rats and includedlabeled cells throughout the entire striatum (including both dorsal andventral striatum and the olfactory tubercle).
288 J.L. BIZON ET AL.

naive and colchicine-treated rats. Overall, colchicine treat-ment significantly affected ChAT and GAD67 cRNA label-ing but not PARV cRNA labeling (Fig. 6; ChAT, P , 0.05;GAD67, P , 0.05; PARV, P 5 0.71; one-way ANOVA).Whereas the DIGChAT cRNA1 cells appeared to be ofnormal size and labeling density in tissue from 24-hour
colchicine-treated rats, some ChAT cRNA1 cells weresmaller and had reduced levels of the color reactionproduct 48 hours after colchicine treatment. Cell countspresented in Figure 6 show that there were fewer ChATcRNA1 cells detected in 48-hour, but not 24-hour, rats ascompared with naive controls (P , 0.05, 48-hour vs. naive
Fig. 4. A–C’: Photomicrographs showing the cellular localization oflabeling with 35S-labeled acidic fibroblast growth factor (aFGF) cRNA(seen as black autoradiographic grains) and either digoxigenin-labeledcholine acetyltransferase (ChAT; A,A’), glutamate decarboxylase 67(GAD67; B), or parvalbumin (PARV; C,C’) cRNAs (seen as purplereaction product). In all cases, open arrows indicate single autoradio-graphically labeled aFGF cRNA1 neurons, broad closed arrowsindicate single color-labeled neurons, and narrow closed arrowsindicate double-labeled cells; a cell with background densities oflabeling is indicated with an asterisk in A. As shown, the 35S-labeled
aFGF cRNA double labeled subpopulations of ChAT, GAD67, andPARV cRNA1 neurons, although in each instance both single colorand autoradiographically labeled cells were also detected. A/A’ andC/C’ show pairs of photomicrographs taken from nearby fields.D,E: Schematic illustrations of the distribution of aFGF mRNA1 cellsthat were single labeled (green) or double labeled with either ChAT (D)or PARV (E) cRNAs (red) in rostral striatum. Each dot represents onecell. Purple dots indicate single-labeled ChAT cRNA1 neurons in D,and orange dots indicate single-labeled PARV cRNA1 neurons in E.Scale bar 5 25 µm in A–C’.
STRIATAL INTERNEURONAL TROPHIC FACTORS 289

control group). The GAD67 cRNA1 neurons also appearedsimilar in 24-hour colchicine and naive rats, in that asmall number of large dark purple cells and many moreweakly labeled cells were distributed across striatum;quantification showed no difference in the numbers oflabeled cells between these groups. However, by 48 hoursafter infusion, the number of densely labeled GAD67cRNA1 neurons was significantly increased as comparedwith control values (P , 0.05; Fig. 6B). Finally, PARVcRNA1 neurons had similar numbers, distribution, andlabeling properties in naive and all colchicine-infused rats(Fig. 6C). Based on these analyses, the quantitative datafor the NGF colocalization experiments from each colchi-cine time point are presented separately. The photographicplates show ChAT and GAD cRNA labeling in rats of the24-hour survival group. However, because PARV was notchanged at the later time point, 48-hour animals wereused to illustrate the optimal NGF cRNA labeling in theNGF/PARV combination.
Colocalization with ChAT, GAD67, and PARV mRNAs.In colchicine-treated rats, every NGF cRNA1 neuron wasdouble labeled with GAD67 cRNA (Table 5, Fig. 5D), andnone was double labeled with ChAT cRNA (Table 5, Fig.5B). Of the double-labeled NGF/GAD67 cells, most wererelatively large and contained a dark GAD67 cRNA colorreaction product. In semi-adjacent sections, a subpopula-tion of NGF cRNA1 neurons were PARV cRNA1 (Fig.5E,G, Table 5). The great majority of double-labeled NGFPARV cells were distributed within the dorsolateral andventral striata that contained the largest numbers ofPARV cRNA1 neurons (Table 5). The percentages of NGFcRNA1 neurons labeled with PARV cRNA were greater inthe 24-hour than in the 48-hour postcolchicine survivalgroup, most particularly in ventral striatum (Table 5).
Trophic characterization of ChAT1 and PARV1 inter-
neurons. In previous sections, the neurotransmitter phe-notypes of aFGF, GDNF, and NGF cRNA1 neurons instriatum were evaluated. Each of the trophic factor cRNAsstudied labeled ChAT cRNA1 and/or PARV cRNA1 cells.To determine the proportion of cells within these majorinterneuronal populations that synthesize the trophicfactors, all ChAT cRNA1 and PARV cRNA1 cells werecounted within the three analysis sectors (Fig. 1), andpercentages of cells labeled with either aFGF, GDNF, orNGF cRNA were determined.
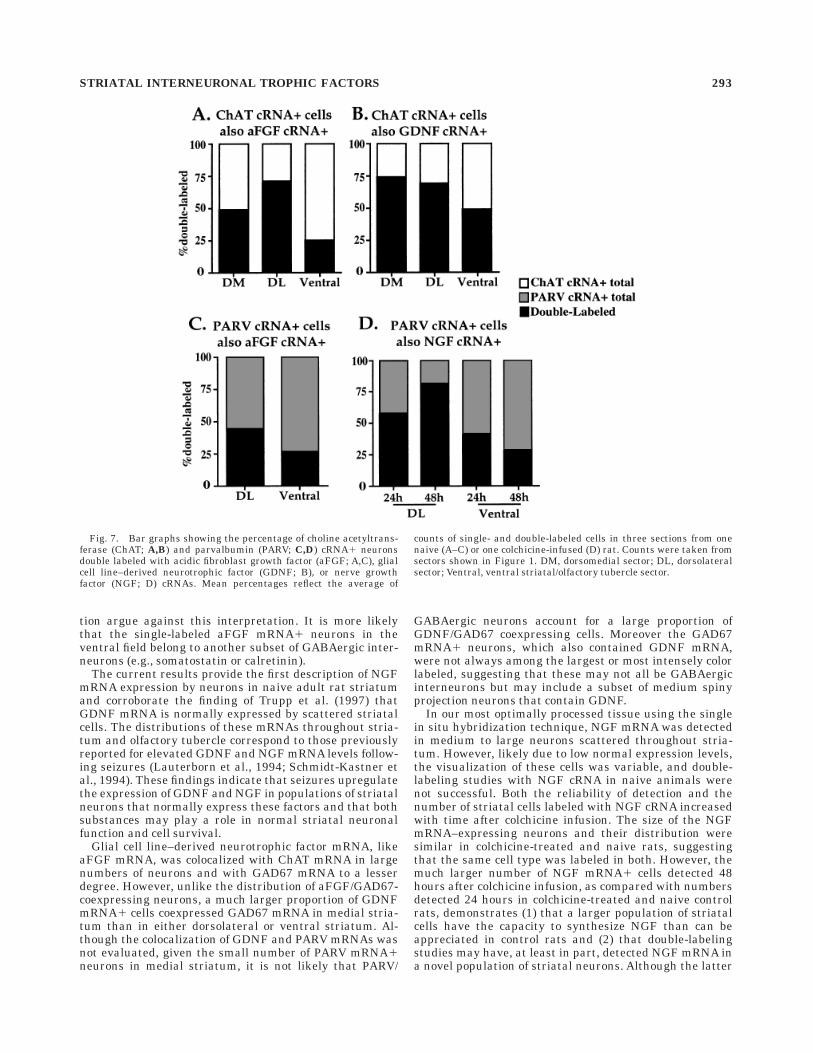
The results of these analyses are shown in Figure 7. Themajority of the ChAT cRNA1 neurons in dorsal striatum(50–75%) and a significant portion of those in ventralstriatum (25–50%) were also labeled with either aFGF(Fig. 7A) or GDNF (Fig. 7B) cRNA. However, single-labeled ChAT cRNA1 neurons were detected in eachsector in both trophic factor combinations. Overall, moreChAT cRNA1 neurons were labeled with GDNF cRNAthan with aFGF cRNA. The high levels of ChAT colocaliza-
tion with each of these factors in dorsal striatum (i.e.,.50%) strongly suggest that a subpopulation of the ChATcRNA1 cells expresses both aFGF and GDNF.
Similarly, subpopulations of PARV cRNA1 neuronswere labeled with either aFGF cRNA (Fig. 7C) or NGFcRNA (Fig. 7D). The highest percentages of PARV cRNA1neurons double labeled in these combinations were de-tected in dorsolateral striatum, whereas slightly morethan one-fourth of PARV cRNA1 cells in ventral striatumwere labeled with either aFGF or NGF cRNA (Fig. 7C,D).It is noteworthy that the number of PARV cRNA1 neuronslabeled with NGF cRNA in dorsolateral striatum increasedfrom 24 to 48 hours after colchicine treatment (58% vs.82%, respectively). This trend was not observed in ventralstriatum.
Neuronal labeling with multiple trophic factor cRNAs.
The similar distributions of aFGF, GDNF, and NGF cRNAsin striatum and the high degree of colocalization of thesefactors with cRNAs that discriminate subsets of striatalinterneurons (i.e., ChAT and GAD67) suggested that cer-tain trophic factors may be expressed by the same neu-rons. Evaluating tissue hybridized with DIG-labeled aFGFand 35S-labeled GDNF or NGF cRNA tested this hypoth-esis. As shown in Figure 8, double-labeled cells wereidentified with both combinations. Of the animals pro-cessed for aFGF/GDNF cRNA colocalization, only oneresulted in labeling with both cRNAs that was sufficientlydense for reliable detection and quantification of single-and double-labeled cells. In this one case (Fig. 8A), morethan 80% of striatal GDNF cRNA-labeled cells were aFGFcRNA1 (Fig. 8C). The percentage of aFGF cRNA-labeledcells that were GDNF cRNA1 was comparably high in thedorsomedial region only (Fig. 8B). These findings demon-strate that, although the majority of GDNF cRNA1 neu-rons label with aFGF cRNA, these double-labeled cellscomprise a subpopulation of striatal aFGF cRNA1 neu-rons.
Acidic FGF and NGF cRNA labeling also was colocalizedin each sector of analysis but to a much lesser degree thanaFGF and GDNF cRNAs (compare Fig. 8D with 8A). Incolchicine-infused animals with 24-hour and 48-hour sur-vival periods, the percentage of aFGF cRNA1 neuronslabeled with NGF cRNA was greatest in the ventral andless in dorsal striatum (Fig. 8E). In all sectors, higherpercentages of double-labeled aFGF cRNA1 neurons oc-curred in animals with a 48-hour versus 24-hour survivalfollowing colchicine infusion (Fig. 8E). Of the NGF cRNA1neurons, the highest percentages of cells colocalized withaFGF cRNA occurred in the dorsolateral and ventralstriata compared with the dorsomedial region. Percent-ages of NGF cRNA1 cells also labeled with aFGF cRNAwere lower in animals with 48-hour survival than in thosewith 24-hour survival following colchicine treatment (Fig.8F). These findings demonstrate that aFGF and NGFcRNA labeling is partly colocalized in striatum, althoughthe double-labeled cells comprise only portions of the NGFor aFGF cRNA1 neurons. Moreover, the increased num-bers of NGF cRNA1 neurons observed 48 hours aftercolchicine treatment were partly contained within theaFGF cRNA1 population, but, given the lower percentageof NGF cRNA1 cells labeled with aFGF cRNA at this timepoint, these double-labeled cells must account for a minor-ity of the newly detected NGF cRNA1 neurons (Fig. 8D).
TABLE 3. Percentages of aFGF cRNA1 Neurons Double Labeledin Three Analysis Sectors*
% ChATcRNA
% GAD67cRNA
% PARVcRNA
% ChAT 1 PARVcRNAs
Dorsomedial 79 18 — —Dorsolateral 73 31 24 100Ventral 46 62 55 75
*See Figure 1 for illustration of the sectors evaluated. aFGF, acidic fibroblast growthfactor; ChAT, choline acetyltransferase; GAD67, glutamate decarboxylase 67; PARV,parvalbumin.
290 J.L. BIZON ET AL.

Fig. 5. A–E: Photomicrographs illustrating the cellular localiza-tion of 35S-labeled glial cell line–derived neurotrophic factor (GDNF;A,A’,C) or nerve growth factor (NGF; B,D–E) cRNAs (seen as blackautoradiographic grains) with either digoxigenin-labeled choline acet-yltransferase (ChAT; A–B), glutamate decarboxylase 67 (GAD67;C–D), or parvalbumin (PARV; E) cRNAs (seen as purple reactionproduct). In all cases, open arrows indicate single autoradiographi-cally labeled neurons, broad closed arrows indicate single color-labeledneurons, and narrow closed arrows indicate double-labeled cells. The35S-labeled GDNF cRNA labeled a subpopulation of both ChATcRNA1 (A) and GAD67 cRNA1 (C) neurons. The 35S-labeled NGFcRNA never double labeled ChAT cRNA1 neurons (B) but was always
double labeled with GAD67 cRNA (D). NGF and PARV cRNA werepartly colocalized, with both single-color-labeled PARV1 cells andautoradiographically labeled NGF cRNA1 cells also detected (E). A/A’are taken from nearby fields. F,G: Schematic illustrations of thedistribution of single- and double-labeled GDNF and ChAT mRNA1cells (F) or NGF and PARV mRNA1 cells (G) in rostral striatum. Eachdot represents one cell. In F, black dots indicate cells labeled withGDNF cRNA only, and purple dots indicate cells labeled with ChATcRNA only. In G, dark blue dots indicate cells labeled with NGF cRNAonly, and orange dots indicate cells labeled with PARV cRNA only. In Fand G, red dots indicate double-labeled neurons. Scale bar 5 20 µm forA,A’,C, 25 µm for B,D,E.

DISCUSSION
ChAT, GAD67, and PARV mRNA localizationin striatal interneurons
The distributions of ChAT and GAD67 mRNAs in ratstriatum reported in the present study are in good agree-ment with previous in situ hybridization and immunohis-tochemical analyses. As in a previous study (Bizon et al.,1996), many large ChAT mRNA1 neurons were detectedin striatum and olfactory tubercle, and the size anddistribution of these cells corresponded with those oflocally projecting, aspiny interneurons (Woolf and Butcher,1981). Similarly, the distribution of GAD67 mRNA ob-served in the present study agrees with that of a previousreport in which the 67-kD GAD isoform was expressed atvery low levels by a large majority of striatal cells and atmuch higher levels by a subset of large neurons scatteredthroughout dorsal and ventral striata and olfactory tu-bercle (Mercugliano et al., 1992). The latter populationcorresponds to a subset of intrinsically projecting GABAer-gic neurons that comprise 10–12% of all striatal neurons(reviewed in Heimer et al., 1985; Kawaguchi et al., 1995).Because the majority of trophic factor mRNAs were local-ized to large cells containing high levels of GAD67 mRNA,it is likely that most of the trophic factor/GAD67 double-labeled cells were interneurons. However, because GAD67is also expressed by the majority of striatal projectionneurons, we cannot rule out the possibility that some of thetrophic factor–expressing neurons are this cell type. Thelatter point is of particular relevance to NGF mRNAexpression after colchicine infusion, as discussed below.
Further evidence that the striatal GAD67 mRNA1 cellsexpressing trophic factors are GABAergic interneurons isprovided by the localization of these same trophic factorswith PARV mRNA. Within striatum this calcium bindingprotein is expressed predominantly by aspiny GABAergic
neurons that make only local projections (Cowan et al.,1990; Kita et al., 1990; Kawaguchi et al., 1995).
Characterization of trophicfactor–expressing cells
The present results demonstrate that aFGF, GDNF, andNGF mRNAs are each expressed by phenotypically dis-tinct populations of striatal neurons. The distributions ofaFGF mRNA and partial coexpression with ChAT mRNAagree with previous results (Bizon et al., 1996). As shownin the present study, a substantial number of striatalaFGF mRNA1 neurons also coexpress high levels ofGAD67 mRNA. The complementary proportions of aFGFmRNA1 cells coexpressing either ChAT or GAD67 mRNAsand evidence that individual striatal neurons do notexpress both ChAT and GAD67 (Kosaka et al., 1988)suggest that these are distinct populations of aFGFmRNA1 neurons that together account for all aFGFexpressing cells in striatum and olfactory tubercle. Thehigh number of double-labeled aFGF mRNA1 cells cohy-bridized with DIG-labeled ChAT and DIG-labeled PARVcRNAs demonstrates that most neurons coexpressing aFGFand GAD67 mRNAs are among the PARV1 subtype ofGABAergic interneurons. The single-labeled aFGFmRNA1 neurons in this combination (i.e., in ventralstriatum) may reflect the limited sensitivity of the double-labeling technique, although the substantial and consis-tent numbers of single-labeled aFGF mRNA1 cells intissue hybridized with this cRNA cocktail (20–25%) andthe regional specificity of this lower incidence of colocaliza-
Fig. 6. Bar graphs showing total numbers of (A) choline acetyltrans-ferase (ChAT), (B) glutamate decarboxylase 67 (GAD67), and(C) parvalbumin (PARV) cRNA-positive striatal cells in naive rats andin rats killed 24 and 48 hours after intracerebroventricular colchicineinfusion. Counts include all labeled cells in dorsal striatum, ventralstriatum, and olfactory tubercle. There were significant group differ-
ences in numbers of ChAT and GAD67 cRNA1 but not in PARVcRNA1 neurons. At 48 hours, the number of ChAT cRNA1 cells wassmaller and the number of GAD67 cRNA1 neurons was greater thancontrol values (*P , 0.05; Student-Newman-Keuls post hoc analysis).No reliable differences were found between counts from naive and24-hour colchicine-infused rats for the cRNAs shown.
TABLE 4. Percentages of GDNF cRNA1 Double-Labeled Neurons*
% ChAT cRNA % GAD67 cRNA
Dorsomedial 63 42Dorsolateral 86 17Ventral 61 33
*GDNF, glial cell line–derived neurotrophic factor; ChAT, choline acetyltransferase;GAD67, glutamate decarboxylase 67.
TABLE 5. Percentages of NGF cRNA1 Double-Labeled Neurons*
% ChAT cRNA % GAD67 cRNA % PARV cRNA
Dorsomedial sector241 0 100 —482 0 100 —
Dorsolateral sector24 0 100 7248 0 100 67
Ventral sector24 0 100 5448 0 100 19
*NGF, nerve growth factor; ChAT, choline acetyltransferase; GAD67, glutamate decar-boxylase 67; PARV, parvalbumin.1Twenty-four hours after treatment with colchicine.2Forty-eight hours after treatment with colchicine.
292 J.L. BIZON ET AL.
tion argue against this interpretation. It is more likelythat the single-labeled aFGF mRNA1 neurons in theventral field belong to another subset of GABAergic inter-neurons (e.g., somatostatin or calretinin).
The current results provide the first description of NGFmRNA expression by neurons in naive adult rat striatumand corroborate the finding of Trupp et al. (1997) thatGDNF mRNA is normally expressed by scattered striatalcells. The distributions of these mRNAs throughout stria-tum and olfactory tubercle correspond to those previouslyreported for elevated GDNF and NGF mRNA levels follow-ing seizures (Lauterborn et al., 1994; Schmidt-Kastner etal., 1994). These findings indicate that seizures upregulatethe expression of GDNF and NGF in populations of striatalneurons that normally express these factors and that bothsubstances may play a role in normal striatal neuronalfunction and cell survival.
Glial cell line–derived neurotrophic factor mRNA, likeaFGF mRNA, was colocalized with ChAT mRNA in largenumbers of neurons and with GAD67 mRNA to a lesserdegree. However, unlike the distribution of aFGF/GAD67-coexpressing neurons, a much larger proportion of GDNFmRNA1 cells coexpressed GAD67 mRNA in medial stria-tum than in either dorsolateral or ventral striatum. Al-though the colocalization of GDNF and PARV mRNAs wasnot evaluated, given the small number of PARV mRNA1neurons in medial striatum, it is not likely that PARV/
GABAergic neurons account for a large proportion ofGDNF/GAD67 coexpressing cells. Moreover the GAD67mRNA1 neurons, which also contained GDNF mRNA,were not always among the largest or most intensely colorlabeled, suggesting that these may not all be GABAergicinterneurons but may include a subset of medium spinyprojection neurons that contain GDNF.
In our most optimally processed tissue using the singlein situ hybridization technique, NGF mRNA was detectedin medium to large neurons scattered throughout stria-tum. However, likely due to low normal expression levels,the visualization of these cells was variable, and double-labeling studies with NGF cRNA in naive animals werenot successful. Both the reliability of detection and thenumber of striatal cells labeled with NGF cRNA increasedwith time after colchicine infusion. The size of the NGFmRNA–expressing neurons and their distribution weresimilar in colchicine-treated and naive rats, suggestingthat the same cell type was labeled in both. However, themuch larger number of NGF mRNA1 cells detected 48hours after colchicine infusion, as compared with numbersdetected 24 hours in colchicine-treated and naive controlrats, demonstrates (1) that a larger population of striatalcells have the capacity to synthesize NGF than can beappreciated in control rats and (2) that double-labelingstudies may have, at least in part, detected NGF mRNA ina novel population of striatal neurons. Although the latter
Fig. 7. Bar graphs showing the percentage of choline acetyltrans-ferase (ChAT; A,B) and parvalbumin (PARV; C,D) cRNA1 neuronsdouble labeled with acidic fibroblast growth factor (aFGF; A,C), glialcell line–derived neurotrophic factor (GDNF; B), or nerve growthfactor (NGF; D) cRNAs. Mean percentages reflect the average of
counts of single- and double-labeled cells in three sections from onenaive (A–C) or one colchicine-infused (D) rat. Counts were taken fromsectors shown in Figure 1. DM, dorsomedial sector; DL, dorsolateralsector; Ventral, ventral striatal/olfactory tubercle sector.
STRIATAL INTERNEURONAL TROPHIC FACTORS 293

Fig. 8. A,D: Schematic illustrations of the distributions of acidicfibroblast growth factor (aFGF) cRNA1 cells single and double labeledwith either glial cell line–derived neurotrophic factor (GDNF; A) ornerve growth factor (NGF; D) cRNAs. Each dot represents one cell. InA and D, green and red dots represent single- and double-labeledaFGF cRNA1 neurons, respectively. In A, gray dots represent single-labeled GDNF cRNA1 neurons; in D, blue dots represent single-labeled NGF cRNA1 neurons. B–F: Corresponding bar graphs show-
ing the quantification of cells double labeled with the aFGF and GDNFcRNAs (B,C) in a naive animal and of cells double labeled with theaFGF and NGF cRNAs (E,F) in 24-hour and 48-hour colchicine-infused rats. In each case, 100% indicates the total number of labeledcells, and the red bar indicates the portion of that total that was doublelabeled. Counts were collected from three sections per animal andfrom sectors shown in Figure 1. DM, dorsomedial sector; DL, dorsolat-eral sector; Ventral, ventral striatal/olfactory tubercle sector.
294 J.L. BIZON ET AL.

possibility must be considered, it may be that NGF expres-sion waxes and wanes within individual cells under nor-mal conditions [e.g., in response to changing levels ofneuronal activity (Gall and Isackson, 1989; Perez-Navarroet al., 1994; Strauss et al., 1994) and hormonal state (Calzaet al., 1997; Colangelo et al., 1998)]. Therefore, colchicinetreatment may serve to increase expression so that thefuller population NGF-producing neurons are better appre-ciated at a single time point.
In agreement with previous studies of NGF expressionin basal forebrain (Lauterborn et al., 1995) and hippocam-pus (Lauterborn et al., 1993b; Kerner et al., 1997), all NGFmRNA1 cells in striatum, including all cells visualized in48-hour colchicine-treated rats, coexpressed GAD67 mRNA.The restriction of NGF cRNA labeling to large, intenselystained GAD67 mRNA1 neurons in 24-hour colchicine-treated rats indicates that the NGF mRNA1 cells areGABAergic interneurons. The localization of NGF mRNAto cells expressing PARV mRNA in semi-adjacent sections(at the 24-hour time point) further supports this interpre-tation. However, the finding that the cells double labeledwith PARV cRNA represented a very small portion of thetotal NGF mRNA1 cells indicates that additional classesof GABAergic cells express NGF. Although NGF mRNA
was always restricted to GAD67 mRNA1 cells, the in-creased numbers of intensely stained GAD67 mRNA1striatal neurons 48 hours postinfusion, possibly due tocolchicine-induced upregulation of GAD67 mRNA expres-sion by medium spiny projection neurons, makes it diffi-cult to conclude that all NGF mRNA1 cells at thistime point are interneurons. Nevertheless, these findingsdemonstrate that NGF expression remains within theGABAergic phenotype and that the local availability ofthis factor is increased during times of striatal insult.
The modest but significant decrease in numbers of ChATmRNA1 neurons 48 hours after colchicine treatmentleaves open the possibility that a portion of NGF mRNA1cells is of the cholinergic phenotype, but these cells werenot so identified due to reductions in this phenotypicmarker. However, other findings argue against this possi-bility. First, in basal forebrain of naive animals, ChAT andNGF mRNAs are distributed in similar regions but arenever coexpressed (Lauterborn et al., 1995). Second, virtu-ally no single-labeled NGF mRNA1 cells were identified inthe present tissue cohybridized with NGF and GAD67cRNAs as would be expected if a non-GABAergic popula-tion was expressing NGF mRNA. Further, no cells coex-pressed NGF/ChAT mRNAs 24 hours after colchicinetreatment, and numbers of striatal ChAT mRNA1 cellswere not significantly reduced at this time point.
Trophic factor expression distinguishesinterneuronal subpopulations
The current results indicate that, in addition to thedistinction of classes of striatal interneurons based ontheir neurotransmitter, neuropeptide, and calcium bind-ing protein composition, striatal interneurons neurons canbe further classified on the basis of trophic phenotype(Fig. 9). For example, both aFGF and GDNF mRNAs werehighly colocalized with ChAT mRNA and with each other.Therefore, we can state with certainty that a sizableportion (50–75%) of ChAT1 neurons in the dorsal striatumexpresses either aFGF or GDNF mRNA and that a subsetof these cholinergic cells is likely to contain mRNAs forboth factors. Similarly, aFGF and NGF mRNAs were bothcolocalized with PARV mRNA and were partly colocalizedwith each other. Given that NGF mRNA is only expressedby GABAergic neurons and that the vast majority of theGABAergic aFGF mRNA1 cells are PARV mRNA1, it islikely that the aFGF/NGF double-labeled cells are alsoPARV mRNA1. Therefore, there is definitive evidence thata portion of PARV mRNA1 striatal interneurons ex-presses either aFGF or NGF, and a strong suggestion thata portion of PARV mRNA1 cells expresses both factors. Atriple-labeling technique that would allow for the localiza-tion of two trophic factors and a neurotransmitter pheno-typic marker is needed to confirm these predictions.
Potential role of locally synthesized aFGF,NGF, and GDNF in striatal cell survival
The demonstration that within adult striatum aFGF,NGF, and GDNF mRNAs are normally expressed bycholinergic and PARV-expressing GABAergic interneuronssuggests a role for these substances in striatal cell sur-vival. Excitotoxic or metabolic insult to striatum results ina marked loss of medium spiny projection cells expressingeither enkephalin or substance P but destroys far fewerinterneurons and preferentially spares those immunoreac-tive for ChAT (Beal et al., 1989, 1991; Figueredo-Cardenas
Fig. 9. Diagram showing the trophic factor phenotypes of choliner-gic (positive for choline acetyltransferase; ChAT1) and GABAergic(positive for glutamate decarboxylase; GAD1) interneurons in dorsalstriatum. Percentages indicate the proportion of the larger class (e.g.,ChAT1 or GAD1) expressing a particular factor or factors as deter-mined from counts of labeled cells in dorsomedial and dorsolateralstriatal sectors (see Fig. 1). The percentage of ChAT1 and parvalbumin-positive (PARV1) cells illustrated as expressing two trophic sub-stances was deduced from the overlapping colocalization of trophicfactor mRNAs with each other and with ChAT or PARV markers inadjacent sections. For instance, approximately 75% of cholinergic cellsin dorsal striatum express either acidic fibroblast growth factor(aFGF) or glial cell line–derived neurotrophic factor (GDNF) mRNAsand in a separate series of sections, virtually all of the GDNF mRNA1cells also expressed aFGF mRNA and a large number of aFGFmRNA1 cells also expressed GDNF mRNA. Therefore, the majority ofcholinergic interneurons in dorsal striatum likely express both aFGFand GDNF mRNAs, whereas a small minority may express only aFGFmRNA or neither trophic factor. Question marks indicate the propor-tion of cholinergic or GABAergic neurons unaccounted for in thecurrent analyses.
STRIATAL INTERNEURONAL TROPHIC FACTORS 295
et al., 1994) and the PARV-expressing GABAergic subtype(Qin et al., 1992). The locally synthesized trophic factorsdescribed in the present study may play unique roles inprotecting the cholinergic interneurons. Of these factors,NGF has been best documented to preserve cholinergicindices in striatum after excitotoxic insult (Davies andBeardsall, 1992; Frim et al., 1993a,b; Emerich et al., 1994;Kordower et al., 1996). In addition, striatal cholinergicneurons do express the high affinity NGF receptor TrkA(Steininger et al., 1993), indicating that they are directlyresponsive to this factor. The restriction of striatal NGFexpression to GABAergic interneurons suggests that thisfactor protects the neighboring cholinergic cells via aparacrine mechanism. To this point, striatal cholinergicneurons form synapses with both the somata and den-drites of PARV-positive neurons (Chang and Kita, 1992),indicating a structural relationship specifically conduciveto a target-derived trophic factor mechanism for these twocell types.
Acidic FGF would more likely have an autocrine role incholinergic neuron survival within striatum. Evidencesuggesting that cholinergic neurons are a target for FGFactions include (1) the localization of FGFR-1 mRNA tosome basal forebrain cholinergic neurons (Yoshida et al.,1994), (2) the ability of exogenous aFGF (Figueiredo et al.,1993) or bFGF (Anderson et al., 1988; Otto et al., 1989) torescue basal forebrain cholinergic cells from death aftermechanical injury, and (3) in striatum, the ability of bFGFto fully preserve cholinergic indices and upregulate NGFwhen infused with QA (Perez-Navarro et al., 1994). To-gether, these data support a role for locally synthesizedFGFs in cholinergic cell survival, potentially throughsynergistic actions with NGF.
Little is known regarding potential local trophic actionsof GDNF in striatum. Although the mRNA for GDNFR-a,the receptor for GDNF, is barely detectable in adultstriatum (Trupp et al., 1996), GDNF can protect calbindin-and calretinin-expressing striatal neurons against excito-toxicity (Humpel et al., 1996; Perez-Navarro et al., 1996;Farkas et al., 1997). Recent evidence that GDNF canreduce cell loss in the septum/diagonal bands followingfimbria/fornix transection demonstrates that this factorcan support cholinergic cell survival (Williams et al.,1996), but it is not known whether GDNF is similarlyprotective for cholinergic cells in striatum or whetherGDNF expression by cholinergic neurons themselves is adeterminant of the survival of this cell type followingstriatal insult. However, it is worth noting that dopaminer-gic afferents to striatum are among those cells mostresponsive to GDNF (Lin et al., 1993; Beck et al., 1995;Tomac et al., 1995) and that dopaminergic neurons bothexpress high levels of GDNFR-a (Treanor et al., 1996;Trupp et al., 1996; Glazner et al., 1997) and can acquireand retrogradely transport GDNF from striatum (Tomacet al., 1995). Therefore, independent of local trophic signal-ing, the midbrain dopaminergic neurons may be a primarytarget for GDNF synthesized by striatal interneurons.
Relative to the cholinergic neurons, the PARV1 class ofGABAergic neurons is less resistant to intrastriatal QAinfusion (Figueredo-Cardenas et al., 1998). However, someGAD67-immunoreactive neurons, including those coex-pressing PARV, do survive this excitotoxic insult (Qin etal., 1992; Figueredo-Cardenas et al., 1998). These findingsdemonstrate that expression of the calcium binding pro-tein PARV is not sufficient in and of itself to protect striatal
neurons from N-methyl-D-aspartic acid–mediated celldeath. However, the colocalization of trophic factors tosubsets of GAD67- and PARV mRNA–expressing neuronssuggests that it may be the ability to synthesize, andrespond to, one or more trophic factors that confer insultresistance to certain GABAergic striatal interneurons.Most particularly, the PARV cells that survive excitotoxicinsult may be those expressing NGF and/or aFGF. Futurestudies that examine the responsiveness of GABAergicinterneurons to trophic factors, the localization of theappropriate trophic receptors, and the trophic factor com-position of GABAergic neurons surviving an excitotoxicinsult are needed to test this hypothesis.
In summary, the present results provide the first evi-dence that several neurotrophic factors are preferentiallyexpressed by fully mature striatal interneurons and thattrophic factor expression profile can be used, with neuro-transmitter and calcium binding protein markers, to fur-ther define neurochemically distinct interneuronal sub-populations. Additional trophic factors are known to beexpressed normally by striatal cells including epidermalgrowth factor (Lazar and Blum, 1992) and transforminggrowth factor-a (Seroogy et al., 1993). Moreover, theexpression of a number of other factors not normallydetected in striatum emerges in response to pathologicalconditions, including brain-derived neurotrophic factor(Schmidt-Kastner et al., 1996; Wong et al., 1997) andciliary neurotrophic factor (Asada et al., 1995), or elevatedglucocorticoids, as seen for bFGF (Mochetti et al., 1996). Ingenerating an overall scheme of trophic factor systemswithin the striatum, encompassing sites of production andpotential synergisms, it will be of interest to determine theneurochemical phenotype of these other trophic factorexpressing cells. Finally, studies have shown that certainsubtypes of striatal interneurons are relatively less vulner-able to insult. Together with evidence for the protectiveeffects of exogenous trophic factors, the current findingssuggest that cell-specific differences in trophic factor pro-duction and responsiveness contribute to the resistance ofselect striatal interneuronal groups to excitotoxic damage.
ACKNOWLEDGMENT
This research was supported by grant AG000538 fromthe National Institute on Aging to C.M.G. and NIHpredoctoral fellowship MH11142 to J.L.B.
LITERATURE CITED
Anderson KJ, Dam D, Lee S, Cotman CW. 1988. Basic fibroblast growthfactor prevents death of lesioned cholinergic neurons in vivo. Nature332:360–361.
Asada H, Ip NY, Pan L, Razack N, Parfitt MM, Plunkett RJ. 1995. Timecourse of ciliary neurotrophic factor mRNA expression is coincidentwith the presence of protoplasmic astrocytes in traumatized rat stria-tum. J Neurosci Res 40:22–30.
Asai TA, Kato H, Masana Y, Seo M, Tohyama M. 1993. Differentialexpression of two members of FGF receptor gene family, FGFR-1 andFGFR-2 mRNA, in the adult rat central nervous system. Mol Brain Res17:174–178.
Augood SJ, Herbison AE, Emson PC. 1994. Localization of GAT-1 GABAtransporter mRNA in rat striatum: cellular coexpression with GAD67mRNA, GAD67 immunoreactivity and parvalbumin mRNA. J Neurosci15:855–874.
Bazzett TJ, Becker JB, Kaatz KW, Albin RL. 1993. Chronic intrastriataldialytic administration of quinolinic acid produces selective neuraldegeneration. Exp Neurol 120:177–185.
296 J.L. BIZON ET AL.

Beal MF, Kowall NW, Swartz KJ, Ferrante RJ, Martin JB. 1986. Replica-tion of neurochemical characteristics of Huntington’s disease by quino-linic acid. Nature 321:168–171.
Beal MF, Kowall NW, Swartz KJ, Ferrante RJ, Martin JB. 1989. Differen-tial sparing of somatostatin–neuropeptide Y and cholinergic neuronsfollowing striatal excitotoxic lesions. Synapse 31:38–47.
Beal MF, Ferrante RJ, Swartz J, Kowall NW. 1991. Chronic quinolinic acidlesions in rats closely resemble Huntington’s disease. J Neurosci11:1649–1659.
Beck DB, Valverde J, Alexi T, Poulsen K, Moffat B, Vandlen RA, RosenthalA, Hefti F. 1995. Mesencephalic dopaminergic neurons protected byGDNF from axotomy-induced degeneration in the adult brain. Nature373:339–340.
Benson DL, Isackson PJ, Gall CM, Jones EG. 1992. Contrasting patterns inthe localization of glutamic acid decarboxylase and Ca21/calmodulinprotein kinase gene expression in the rat central nervous system.Neuroscience 46:825–849.
Berchtold MW, Means AR. 1985. The Ca21-binding protein parvalbumin:molecular cloning and developmental regulation of mRNA abundance.Proc Natl Acad Sci USA 82:1414–1418.
Bizon JL, Lauterborn JC, Isackson PJ, Gall CM. 1996. Acidic fibroblastgrowth factor mRNA is expressed by basal forebrain and striatalcholinergic neurons. J Comp Neurol 366:379–389.
Calza L, Giardino L, Aloe L. 1997. Thyroid hormone regulates NGF contentand p75LNGFR expression in the basal forebrain of adult rats. ExpNeurol 143:196–206.
Ceccatelli S, Ernfors P, Villar MJ, Persson H, Hokfelt T. 1991. Expandeddistribution of mRNA for nerve growth factor, brain derived neuro-trophic factor, and neurotrophin 3 in the rat brain after colchicinetreatment. Proc Natl Acad Sci USA 88:10352–10356.
Chang HT, Kita H. 1992. Interneurons in the rat striatum: relationshipsbetween parvalbumin neurons and cholinergic neurons. Brain Res574:307–311.
Colangelo AM, Follesa P, Mocchetti I. 1998. Differential induction of nervegrowth factor and basic fibroblast growth factor mRNA in neonatal andaged rat brain. Mol Brain Res 53:218–225.
Cowan RL, Wilson CJ, Emson PC, Heizmann CW. 1990. Parvalbumin-containing GABAergic interneurons in the rat neostriatum. J CompNeurol 302:197–205.
Davies SW, Beardsall K. 1992. Nerve growth factor selectively preventsexcitotoxin induced degeneration of striatal cholinergic neurones. Neu-rosci Lett 140:161–164.
Emerich DF, Hammang JP, Baetge EE, Winn SR. 1994. Implantation ofpolymer-encapsulated human nerve growth factor-secreting fibroblastsattenuates the behavioral and neuropathological consequences of quino-linic acid injections in the rodent striatum. Exp Neurol 130:141–150.
Farkas LM, Suter-Crazzolara C, Unsicker K. 1997. GDNF induces thecalretinin phenotype in cultures of embryonic striatal neurons. JNeurosci Res 50:361–372.
Figueiredo BC, Piccardo P, Maysinger D, Clarke PBS, Cuello AC. 1993.Effects of acidic fibroblast growth factor on cholinergic neurons ofnucleus basalis magnocellularis and in a spatial memory task followingcortical devascularization. Neuroscience 56:955–963.
Figueredo-Cardenas G, Anderson KD, Chen Q, Veenman CL, Reiner A.1994. Relative survival of striatal projection neurons and interneuronsafter intrastriatal injection of quinolinic acid. Exp Neurol 129:37–56.
Figueredo-Cardenas G, Harris CL, Anderson KD, Reiner A. 1998. Relativeresistance of striatal neurons containing calbindin or parvalbumin toquinolinic acid-mediated excitotoxicity compared to other striatal neu-ron types. Exp Neurol 149:356–372.
Frim DM, Short MP, Rosenberg WS, Simpson J, Breakefield XO, Isacson O.1993a. Local protective effects of nerve growth factor-secreting fibro-blasts against excitotoxic lesions in the rat striatum. J Neurosurg78:267–273.
Frim DM, Uhler TA, Short MP, Ezzedine ZD, Klagsbrun M, Breakefield XO,Isacson O. 1993b. Effects of biologically delivered NGF, BDNF, andbFGF on striatal excitotoxic lesion. NeuroReport 4:367–370.
Gall C, Isackson PJ. 1989. Limbic seizures increase neuronal production ofmRNA for nerve growth factor. Science 245:758–760.
Gerfen CR, Baimbridge KG, Miller J. 1985. The neostriatal mosaic:compartmental distribution of calcium-binding protein and parvalbu-min in the basal ganglia of the rat and monkey. Proc Natl Acad Sci USA82:8780–8784.
Glazner GW, Mu X, Springer JE. 1997. Localization of glial cell line-derivedneurotrophic factor (GDNF) receptor alpha and c-ret mRNA in the ratcentral nervous system. J Comp Neurol 391:42–49.
Heimer L, Alheid GF, Zaborszky L. 1985. Basal ganglia. In: Paxinos G,editor. The rat nervous system: forebrain and midbrain. Orlando:Academic Press. p 37–86.
Humpel C, Marksteiner J, Saria A. 1996. Glial cell line-derived neuro-trophic factor enhances biosynthesis of substance P in striatal neuronsin vitro. Cell Tissue Res 286:249–255.
Kawaguchi Y, Wilson CJ, Augood SJ, Emson PC. 1995. Stiatal interneu-rones: chemical, physiological and morphological characterization.Trends Neurosci 18:527–535.
Kerner JA, Standaert DG, Penney JB, Young AB, Landwehrmeyer GB.1997. Expression of group one metabotropic glutamate receptor subunitmRNAs in neurochemically identified neurons in the rat neostriatum,neocortex and hippocampus. Mol Brain Res 48:259–269.
Kita H, Kosaka T, Heizmann CW. 1990. Parvalbumin-immunoreactiveneurons in the rat neostriatum: a light and electron microscopic study.Brain Res 536:1–15.
Kordower JH, Chen EY, Mufson EJ, Winn SR, Emerich DF. 1996. Intrastria-tal implants of polymer encapsulated cells genetically modified tosecrete human nerve growth factor: trophic effects upon cholinergic andnoncholinergic striatal neurons. Neuroscience 72:63–77.
Kosaka T, Tauchi M, Dahl JL. 1988. Cholinergic neurons containingGABA-like and/or glutamic acid decarboxylase-like immunoreactivitesin various brain regions of the rat. Exp Brain Res 70:605–617.
Kubota Y, Kawaguchi Y. 1993. Spatial distributions of chemically identifiedintrinsic neurons in relation to patch and matrix compartments of ratneostriatum. J Comp Neurol 332:499–513.
Lauterborn JC, Isackson PJ, Gall CM. 1991. Nerve growth factor mRNA-containing cells are distributed within regions of cholinergic neurons inthe rat basal forebrain. J Comp Neurol 306:439–446.
Lauterborn JC, Isackson PJ, Montalvo R, Gall CM. 1993a. In situ hybridiza-tion localization of choline acetyltransferase mRNA in adult rat brainand spinal cord. Mol Brain Res 17:59-69.
Lauterborn JC, Tran T, Isackson P, Gall CM. 1993b. NGF mRNA isexpressed by GABAergic neurons in rat hippocampus. NeuroReport5:273–276.
Lauterborn JC, Isackson PJ, Gall CM. 1994. Seizure-induced increases inNGF mRNA exhibit different time courses across forebrain regions andare biphasic in hippocampus. Exp Neurol 125:22–40.
Lauterborn JC, Bizon JB, Tran TMD, Gall CM. 1995. NGF mRNA isexpressed by GABAergic but not cholinergic neurons in rat basalforebrain. J Comp Neurol 360:454–462.
Lazar LM, Blum M. 1992. Regional distribution and developmental expres-sion of epidermal growth factor and transforming growth factor-alphamRNA in mouse brain by a quantitative nuclease protection assay. JNeurosci 12:1688–1697.
Lin LH, Doherty DH, Lile JD, Baktesh S, Collins F. 1993. GDNF: a glial celllined-derived neurotrophic factor for midbrain dopaminergic neurons.Science 260:1130–1132.
Martinez-Serrano A, Bjorklund A. 1996. Protection of the neostriatumagainst excitotoxic damage by neurotrophin-producing, geneticallymodified neural stem cells. J Neurosci 16:4604–4616.
Mercugliano M, Soghomonian J, Qin Y, Nguyen HQ, Feldblum S, ErlanderMG, Tobin AJ, Chesselet M. 1992. Comparative distribution of messen-ger RNAs encoding glutamic acid decarboxylases (Mr 65,000 and Mr
67,000) in the basal ganglia of the rat. J Comp Neurol 318:245–254.Mocchetti I, Spiga G, Hayes VY, Isackson PJ, Colangelo A. 1996. Glucocorti-
coids differentially increase nerve growth factor and basic fibroblastgrowth factor expression in the rat brain. J Neurosci 16:2141–2148.
Nakata N, Kato H, Kogure K. 1993. Protective effects of basic fibroblastgrowth factor against hippocampal neuronal damage following cerebralischemia in the gerbil. Brain Res 605:354–356.
Otto D, Frotscher M, Unsicker K. 1989. Basic fibroblast growth factor andnerve growth factor administered in gel foam rescue medial septalneurons after fimbria fornix transection. J Neurosci Res 22:83–91.
Paxinos G, Watson C. 1986. The rat brain in stereotaxic coordinates. Secondedition. San Diego: Academic Press.
Perez-Navarro E, Alberch J, Arenas E, Calvo N, Marsal J. 1994. Nervegrowth factor and basic fibroblast growth factor protect cholinergicneurons against quinolinic acid excitotoxicity in rat neostriatum. Eur JNeurosci 6:706–711.
Perez-Navarro F, Arenas E, Reiriz J, Neveu I, Calvo N, Alberch J. 1996.Glial cell line-derived neurotrophic factor protects striatal calbindin-immunoreactive neurons from excitotoxic damage. Neuroscience 75:345–352.
STRIATAL INTERNEURONAL TROPHIC FACTORS 297

Qin Y, Soghomonian JJ, Chesselet MF. 1992. Effects of quinolinic acidmessenger mRNAs encoding somatostatin and glutamic acid decarbox-ylases in the striatum of adult rats. Exp Neurol 115:200–211.
Sasaki K, Oomura Y, Suzuki K, Kazumitsu H, Yagi H. 1992. Acidicfibroblast growth factor prevents death of hippocampal CA1 pyramidalcells following ischemia. Neurochem Int 21:397–402.
Schmidt-Kastner R, Tomac A, Hoffer B, Bektesh S, Rosenzwerg B, Olsen L.1994. Glial cell-lined derived neurotrophic factor (GDNF) mRNA upreg-ulation in striatum and cortical areas after pilocarpine-induced statusepilepticus in rats. Mol Brain Res 26:325–330.
Schmidt-Kastner R, Wetmore C, Olson L. 1996. Comparative study ofbrain-derived neurotrophic factor messenger RNA and protein at thecellular level suggests multiple roles in hippocampus, striatum andcortex. Neuroscience 74:161–183.
Seroogy KB, Lundgren KH, Lee DC, Guthrie KM, Gall CM. 1993. Cellularlocalization of transforming growth factor-a mRNA in rat forebrain. JNeurochem 60:1777–1782.
Springer JE, Mu X, Bergmann LW, Trojanowski JQ. 1994. Expression ofGDNF mRNA in rat and human nervous tissue. Exp Neurol 127:167–170.
Steininger TL, Wainer BH, Klein R, Barbacid M, Palfrey HC. 1993.High-affinity nerve growth factor (Trk) immunoreactivity is localized incholinergic neurons of the basal forebrain and striatum in the adult ratbrain. Brain Res 612:330–335.
Strauss S, Otten U, Joggerst B, Pluss K, Volk B. 1994. Increased of nervegrowth factor (NGF) protein and mRNA and reactive gliosis followingkainic acid injection into the rat striatum. Neurosci Lett 168:193–196.
Swanson L. 1992. Brain Maps: structure of the rat brain. Amsterdam:Elsevier.
Tomac A, Widenfalk J, Lin LH, Kohno T, Ebendal T, Hoffer BJ, Olson L.1995. Retrograde axonal transport of glial cell line-derived neuro-trophic factor in the adult nigrostratal system suggests a trophic role inthe adult. Proc Natl Acad Sci USA 92:8274–8278.
Treanor JJ, Goodman L, de Sauvage F, Stone DM, Poulsen KT, Beck CD,Gray C, Armanini MP, Pollock RA, Hefti F. 1996. Characterization of amulticomponent receptor for GDNF. Nature 382:80–83.
Trupp M, Arenas E, Fainzilber M, Nilsson AS, Sieber BA, Grigoriou M,Kilkenny C, Salazar-Grueso E, Pachnis V, Armae A, Sariola H, SaarmaM, Ibanez CF. 1996. Functional receptor for GDNF encoded by the c-retproto-oncogene. Nature 381:785–788.
Trupp M, Belluardo N, Funakoshi H, Ibanez CF. 1997. Complementary andoverlapping expression of glial cell line-derived neurotrophic factor(GDNF), c-ret proto-oncogene, and GDNF receptor-alpha indicatesmultiple mechanisms of trophic actions in the adult rat CNS. JNeurosci 17:3554–3567.
Venero JL, Beck KD, Hefti F. 1994. Intrastriatal infusion of nerve growthfactor after quinolinic acid prevents reduction of cellular expression ofcholine acetyltransferase messenger RNA and trkA messenger RNA,but not glutamate decarboxylase messenger RNA. Neuroscience 61:257–268.
Walicke PA. 1988. Basic and acidic fibroblast growth factors have trophiceffects on neurons from multiple CNS regions. J Neurosci 87:2618–2627.
Whittemore SR, Friedman PL, Larhammar D, Persson H, Gonzalez-Carvajal M, Holets VR. 1988. Rat beta-nerve growth factor sequenceand site of synthesis in the adult hippocampus. J Neurosci Res20:403–410.
Williams LR, Inouye G, Cummins V, Pelleymounter MA. 1996. Glial cellline-derived neurotrophic factor sustains axotomized basal forebraincholinergic neurons in vivo: dose–response comparison to nerve growthfactor and brain derived neurotrophic factor. J Pharmacol Exp Ther277:1140–1151.
Wong JY, Liberatore GT, Donnan GA, Howells DW. 1997. Expression ofbrain-derived neurotrophic factor and TrkB neurotrophin receptorsafter striatal injury in the mouse. Exp Neurol 148:83–91.
Woolf NJ, Butcher LL. 1981. Cholinergic neurons in the caudate-putamencomplex proper are intrinsically organized: a combined Evans blue andacetylcholinesterase analysis. Brain Res Bull 7:487–507.
Yoshida S, Lin LP, Chen ZL, Momota K, Kato K, Tanaka T, Wanaka A,Shiosaka S. 1994. Basal magnocellular and pontine cholinergic neuronscoexpress FGF receptor mRNA. Neurosci Res 20:35–42.
298 J.L. BIZON ET AL.