subsoil characterization for foundation stability using
TRANSCRIPT

Journal of Environment and Earth Science www.iiste.org
ISSN 2224-3216 (Paper) ISSN 2225-0948 (Online)
Vol.10, No.6, 2020
82
Subsoil Characterization for Foundation Stability Using
Geophysical and Geotechnical Methods
Sunday Bayode Adetayo Adebiyi Egbebi
Department of Applied Geophysics, The Federal University of Technology, PMB 704 Akure, Nigeria
Abstract
An Integrated geophysical and geotechnical subsoil characterization of parts of the new stadium complex, Akure,
southwestern Nigeria had been carried out with a view to characterize the subsoil materials for stability of proposed
engineering foundation. Five (5) magnetic and three (3) dipole-dipole profiling were carried out at station
separation of 10 m along the traverses. Twenty one (21) Vertical Electrical Sounding (VES) measurements were
made at selected locations along the traverses. A total of five (5) soil samples were collected from a dug pit at a
depth of 1.0 m for laboratory analysis. The magnetic profiles delineated characteristic one to two negative peak
amplitude anomalies that are typical of thin dipping dyke models (suspected to be fractures, shear zones, faults or
geological contacts) along Traverses 1-5. The 2-D geomagnetic section delineated overburden thicknesses ranging
from 5 – 15 m along the Traverses. The subsurface geologic units delineated by the geoelectric sections and the 2-
D resistivity images consisting of the topsoil, weathered layer, partly weathered/fractured basement and fresh
bedrock. Part of the topsoil and the weathered layer are characterized by low resistivity values suggestive of the
presence of clay and or weak geomaterials at a depth range of 1 – 4 m within which civil engineering foundation
are usually placed. These zones and the fractured/fault zones delineated by the magnetic methods constitute weak
geomaterials that are considered to be inimical to civil engineering structures within the study area. Results of
geotechnical analysis of soil samples adjudged plasticity indices of samples A, C and D to be of high index and
were characterized by high plasticity/compressibility and consequently of low engineering competence. Samples
B and E were classified as low-medium plasticity/compressibility, and are rated moderate–high engineering
competence. However, it was observed that soil with higher liquid limits or plasticity index have lower electrical
resistivity values and hence were adjudged low in engineering foundation competence. Based on the analysis of
the results obtained from this study, the engineering foundation suitability of the soil were generally classified as
good (B and E), fair (D) and poor (A and C). It can therefore be concluded that the subsoil in the investigated area
are generally of low to high civil engineering competence.
Keywords: Geophysical; Geotechnical; Subsoil; Competence; Characterization; Foundation, Stability.
DOI: 10.7176/JEES/10-6-08
Publication date:June 30th 2020
1. Introduction
In recent time, the statistics of failures of civil engineering infrastructures such as roads, buildings, bridges and
dams in Nigeria has increased geometrically (Coker, 2015). Building collapse has been experienced in both
Basement Complex and Sedimentary areas within the country. Field observation show that in March, 2019, Nigeria
experienced two building collapse within three days, one at Ita-Faji, Lagos Island and the other one at Idi-Arere,
Ibadan. Following this 149 building were marked for demolition in Lagos Island by the Lagos State Physical
Planning Department.
Other reported building collapse in the country includes: Elu Ohafia in Ohafia Local Government Area, Abia
State (The Nation News, 11th July, 2019); Jos, North Local Government Area, Plateau State, (16th July, 2019);
Agwana street, Abraka and Asaba both in Deta State, (20th July, 2019); 48 Arisha water front Otun Araromi street,
Magodo phase 1 Lagos, (12th October, 2019); Lagos Community Mosque at Olowora bus stop in Ikosi-Isheri,
Lagos state, (13th October, 2019), (LASEMA, 2019); Butcher Street, Terminus Market in Jos, North Local
Government Area, Plateau State, (16th July, 2019). All the reported building collapse above involved loss of lives
and many are injured with consequential economic loss which covered both Basement Complex and sedimentary
terrains of Nigeria.
Since building collapse has crept quietly into the Nigeria horizon in the early 1990’s. It has now become an
unabated major treat to life and huge means of economic waste. Poor supervision of projects, poor construction
materials, poor engineering design are probable reasons speculated to have been responsible for this ugly incidence
by the engineering community. Unfortunately, one major factor that has always not been given serious attention
in this part of the world is lack of adequate information on the nature of subsurface geologic conditions prior to
construction exercise. However, since every engineering structure is seated on geo-materials, it is imperative to
conduct pre-construction geological, geophysical and geotechnical investigations of such site.
Engineering structures are designed and constructed with long life expectancy (Olorunfemi, 2000). Apart
from loss of huge financial investment, other consequences of structural failure can be devastating, including loss
of lives and properties. All the civil engineering structures erected on the earth have their own substructures

Journal of Environment and Earth Science www.iiste.org
ISSN 2224-3216 (Paper) ISSN 2225-0948 (Online)
Vol.10, No.6, 2020
83
(foundation). A reliable foundation design depends on the characteristics of both the geological structures and the
near subsurface soil or rock. Therefore, the nature (i.e. competence, strength and load bearing capacity) of the soil
supporting the super structure becomes an extremely important issue of safety, structural integrity and durability
of the super structure. Hence, a detail investigation of the subsoil is required by non-destructive techniques such
as geophysical methods which respond to the heterogeneous nature of soil particles through some physical
parameters that govern the subsoil competency.
The choice of the geophysical method is usually determined by the geologic set up and the existence of
significant contrast in the physical properties of the subsurface layers. (Ako and Adepelumi, 2006). Geophysical
and geotechnical methods have enjoyed integrated approach to complement each other in engineering site
investigation for better assessment of geo-materials. Geotechnical investigation of geo-materials takes longer time,
discrete, invasive, more expensive and can impact on the environment while geophysical surveys have proven
useful as a rapid means of obtaining subsurface information on a continuous profiling basis, it is non-invasive and
cost-effective over large areas. Several authors have singly engaged geophysical approach or integrated
geophysical and geotechnical methods in site investigation (Akintorinwa and Adesoji, 2009, Osinowo, 2011,
Akinrimade et al., 2013, Folahan, et al., 2013, Oladunjoye, et al., 2014, Adejumo et al., 2015, Coker, 2015 and
Adedoyin, 2017).
In engineering and foundation studies, geophysics plays a significant role in the investigation of subsurface
material and geological structures which are likely to have significant engineering implications. Therefore, the
essence of this work is the need to characterize the subsoil using combined geophysical and geotechnical methods
to ascertain the engineering competence of the geo-materials beneath the study area.
2. Site Location and Description.
The site under investigation is the proposed 40,000 seats capacity Ondo State new stadium, located in Araromi
area, Akure, Southwestern Nigeria (Fig. 1). The site is located along Ilesa-Akure-Owo Road. It is situated between
the geographic coordinates of Easting’s 741704 and 742704 mE and Northings of 804011 and 805438 mN in the
Universal Transverse Mercator (UTM) scale Mina zone 34 (Fig. 1). The site occupies an area extent of about 1.4
km2. The study area is accessible through the Akure-Owo Road and Onyearugbulem Market-Oja Oba road Akure
(Fig. 1).
3. Geology and Engineering Competence
The study area is underlain by the Precambrian Basement Complex Rocks of southwester Nigeria (Rahaman,
1976). Field observation show that the lithologic unit identified in the study area includes the migmatite gneiss,
granite gneiss and granite (Fig. 2). The rock unit outcrops in few places within the study area. It is expected that
near surface fresh basement rock are highly competent as subgrade material for engineering foundation but when
subjected to weathering and structural deformation arising from previous tectonics, it may not be able to satisfy its
initial expected load bearing capacity. Therefore, basement rocks which have experienced weathering and
featuring are likely to have implication on the expected engineering infrastructure sited on it.
4. Methodology
Five Traverses, 200 m apart and about 250 m long, oriented in the E-W directions were established in the study
area. Stations were established at 10 m apart along each of the Traverses. The geophysical methods involved the
magnetic profiling and electrical resistivity methods. The geoelectric method adopted the Vertical Electrical
Sounding (VES) and combined horizontal profiling/Vertical Electrical Sounding (VES)/2-D imaging techniques
were used in this study (Fig. 1).
4.1 Magnetic Survey
Ground magnetic survey was carried out with the Proton Precession Magnetometer along five traverses (Fig. 1).
A base station was first established with the co-ordinates taken and ten (10) readings were taken at the base station.
Total field measurements were taken at regular intervals of 10 m along the traverses with two readings taken at
each station and then averaged. This is done in order to be able to calculate the diurnal variation for the area of
study with respect to the time the readings were taken. Ten (10) final readings were taken at the base station after
the survey was completed along the traverses. After taken measurements along each traverse, the base station
measurements were repeated. The raw field magnetic data were corrected for diurnal variation and offset by
subtracting the base station regional magnetic reading from the reading recorded along the traverse line at
corresponding time. The magnetic data were interpreted quantitatively using the 2-D Euler Deconvolution software.
The interpretation results are presented as profiles and map.

Journal of Environment and Earth Science www.iiste.org
ISSN 2224-3216 (Paper) ISSN 2225-0948 (Online)
Vol.10, No.6, 2020
84
Fig. 1: Location and Data Acquisition Map of the Study Area
4.2 Electrical Resistivity Survey
4.2.1 The Vertical Electrical Sounding (VES)
A total of twenty one (21) Vertical Electrical Soundings (VES) were conducted along the five traverses within the
study area using Ohmega resistivity meter (Fig. 1). Schlumberger array was employed with the minimum half
current electrode spread (AB/2) varied from 1 to a maximum of 225 m. The VES data were interpreted using the
Partial curve matching technique quantitatively to obtain the initial geoelectric parameters (layers’ resistivities and
thicknesses). The initial geoelectric parameters obtained were fed into the computer as a starting modeling
parameters using Win RESIST version 1.0 (Vander Velpen, 2004). The VES interpretation results (layers’
resistivities and thicknesses) were used to develop the geoelectric sections and maps.
4.2.2 Combined Horizontal Profiling/Vertical Electrical Sounding (VES)
The combined Horizontal Profiling/Vertical Electrical Sounding technique was carried out using Dipole – Dipole
array along Traverses 1, 3 and 5 (Fig. 1). This was done to delineate the subsurface geologic structures and to map
the continuous vertical and horizontal variation of resistivity within the subsurface. The inter-electrode spacing a
of 5 m was adopted. While inter-dipole separation factor (n) was varied from 1 to 5. The apparent resistivity values
obtained were plotted at the intersection of two lines drawn at 45o from the mid points of the potential and current
dipole. The 2-D inversion modelling of the dipole-dipole data was carried out using DIPPROTM software. This
gave the 2-D resistivity structure of the subsurface geologic units. The results of the magnetic and the 2-D
resistivity structures were used to select Vertical Electrical Sounding (VES) positions along the Traverses. Three
to six VES were conducted along each of the traverse lines for the subsurface correlation.
4.2.3 Geotechnical Soil Sampling
Soil sampling location were established and distributed to cover the perimeter and other important part of the
proposed building foundation within the investigated site. (Fig. 1). A total of five (5) disturbed soil samples were

Journal of Environment and Earth Science www.iiste.org
ISSN 2224-3216 (Paper) ISSN 2225-0948 (Online)
Vol.10, No.6, 2020
85
collected from a test dug pits at a depth of 1.0 m. The samples were collected in a polythene sac, labelled for
Fig 2: Geological Map of Akure Showing the Study Area (Modified After Owoyemi, 1996)
proper identification and taken to the laboratory for geotechnical analysis. The data were analyzed for; natural
moisture content, grain size analysis, Atterberg limit, linear shrinkage, and strength properties such as
consolidation and Unconfined Compressive Strength test. The tests were conducted in accordance with B. S. 1377
(BSI, 1990).
5. Results and Discussions
5.1 Magnetic Profiles
The residual total field magnetic profiles and the corresponding 2-D Euler deconvolution generated geomagnetic
sections along traverses 1–5 are shown in (Figs. 3 (a and b) – 7 (a and b)). The amplitude of the magnetic field
generally varies from -450 nT to 600 nT within the investigated area (Fig. 3 (a and b) – 7 (a and b)). Only one
major magnetic anomaly with characteristic negative peak amplitude was observed along traverse 1 (Fig. 3a and
b) while one or two anomalies with negative peak amplitudes were identified along traverses 2–5 (Figs. 4 (a and
b) – 7 (a and b)). These anomalies are typical of thick/thin dipping dyke models (suspected to be fractures, shear
zone, faults or geological boundaries) (Parasnis, 1986). The anomalies were identified between distances 0 – 180
m; 0 – 90 m and 100 – 200 m; 0 – 150 m and 150 – 190 m; 30 – 180 m; and 0 – 80 m and 80 – 190 m respectively
along traverses 1 – 5.
The 2-D geomagnetic sections delineated overburden thickness of materials lying above the basement along
the five magnetic profiles to vary from 5 – 15 m (Figs. 3 b – 7 b). The geomagnetic sections show that the basement
topography in the investigated area is gently undulating. A summary of the quantitative interpretation results of
the magnetic anomalies are presented in Table 1.
5.2 Geomagnetic Map
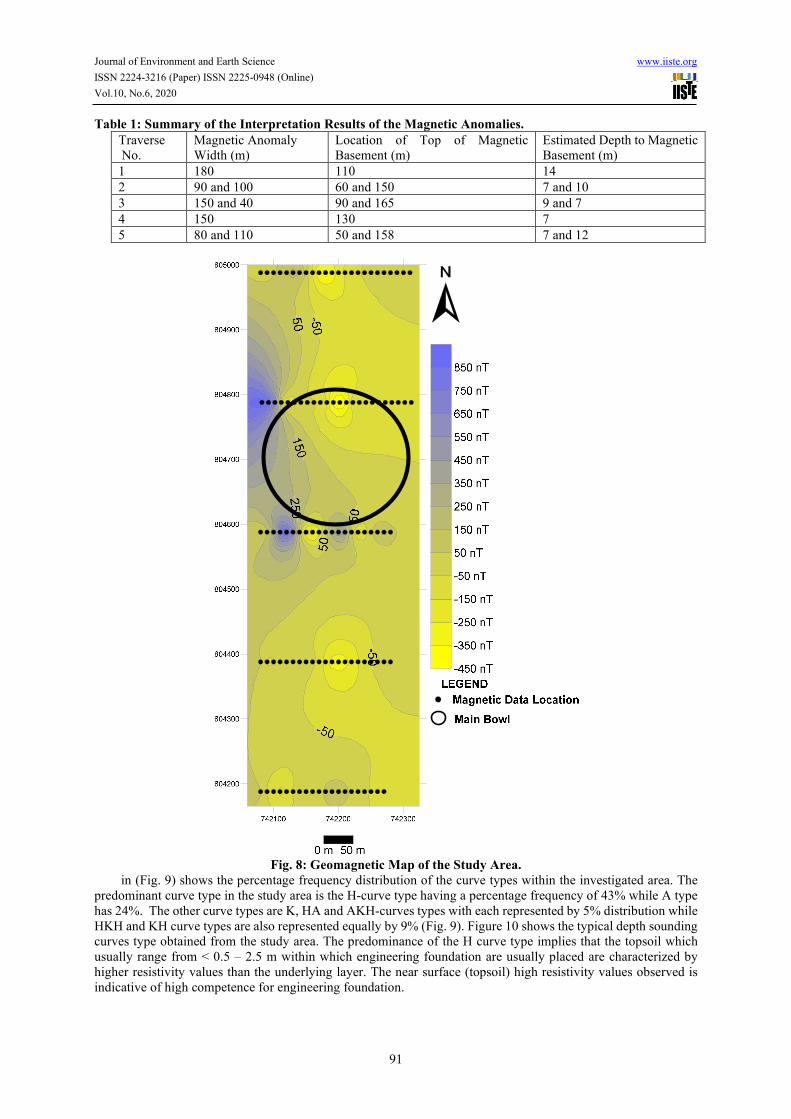
The distribution of the residual total field magnetic data obtained within the study area was contoured to produce
the geomagnetic map (Fig. 8). The map reveals regions of both magnetic lows and highs whose magnetic field
intensity ranges between -450 nT and 950 nT. Characteristic magnetic lows of -450 to -50 nT in the northeast and
southeastern part of the investigated area is suspected to be indicative of low magnetic signatures that are suspected
to be geologic structures (fractures, faults and shear zones).

Journal of Environment and Earth Science www.iiste.org
ISSN 2224-3216 (Paper) ISSN 2225-0948 (Online)
Vol.10, No.6, 2020
86
5.3 Electrical Resistivity Method
5.3.1 Depth Sounding Curves
Table 2 shows the summary of the interpreted results of the twenty one (21) VES curve obtained from the study
area. The curve types obtained in the study area are the A, H, K, KH, HA, AKH, HKH and KHKH. The pie chart
Fig. 3: Correlation of (a) Magnetic Profile, (b) Geomagnetic Section (c) Geoelectric Section and (d)
Dipole-dipole Pseudosection along Traverse 1

Journal of Environment and Earth Science www.iiste.org
ISSN 2224-3216 (Paper) ISSN 2225-0948 (Online)
Vol.10, No.6, 2020
87
Fig. 4: Correlation of (a) Magnetic Profile, (b) Geomagnetic Section (c) Geoelectric Section along Traverse
2

Journal of Environment and Earth Science www.iiste.org
ISSN 2224-3216 (Paper) ISSN 2225-0948 (Online)
Vol.10, No.6, 2020
88
Fig. 5: Correlation of (a) Magnetic Profile, (b) Geomagnetic Section (c) Geoelectric Section and (d)
Dipole-dipole Pseudosection along Traverse 3
Journal of Environment and Earth Science www.iiste.org
ISSN 2224-3216 (Paper) ISSN 2225-0948 (Online)
Vol.10, No.6, 2020
89
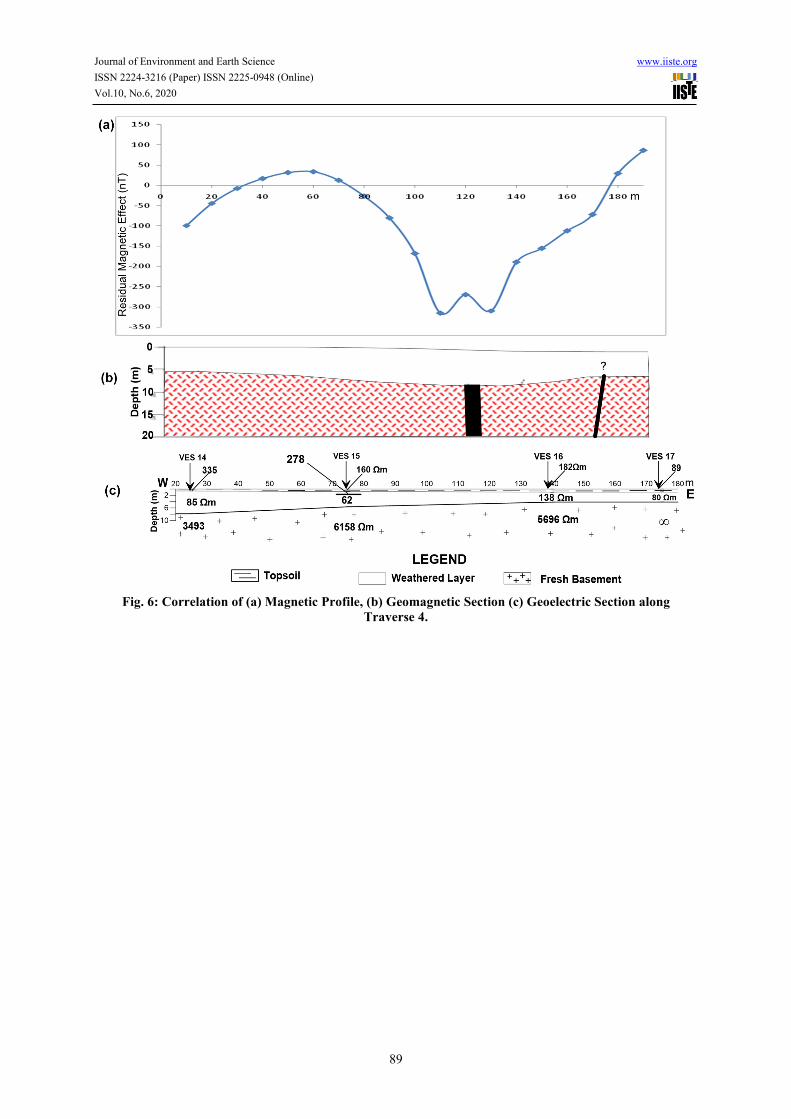
Fig. 6: Correlation of (a) Magnetic Profile, (b) Geomagnetic Section (c) Geoelectric Section along
Traverse 4.
Journal of Environment and Earth Science www.iiste.org
ISSN 2224-3216 (Paper) ISSN 2225-0948 (Online)
Vol.10, No.6, 2020
90
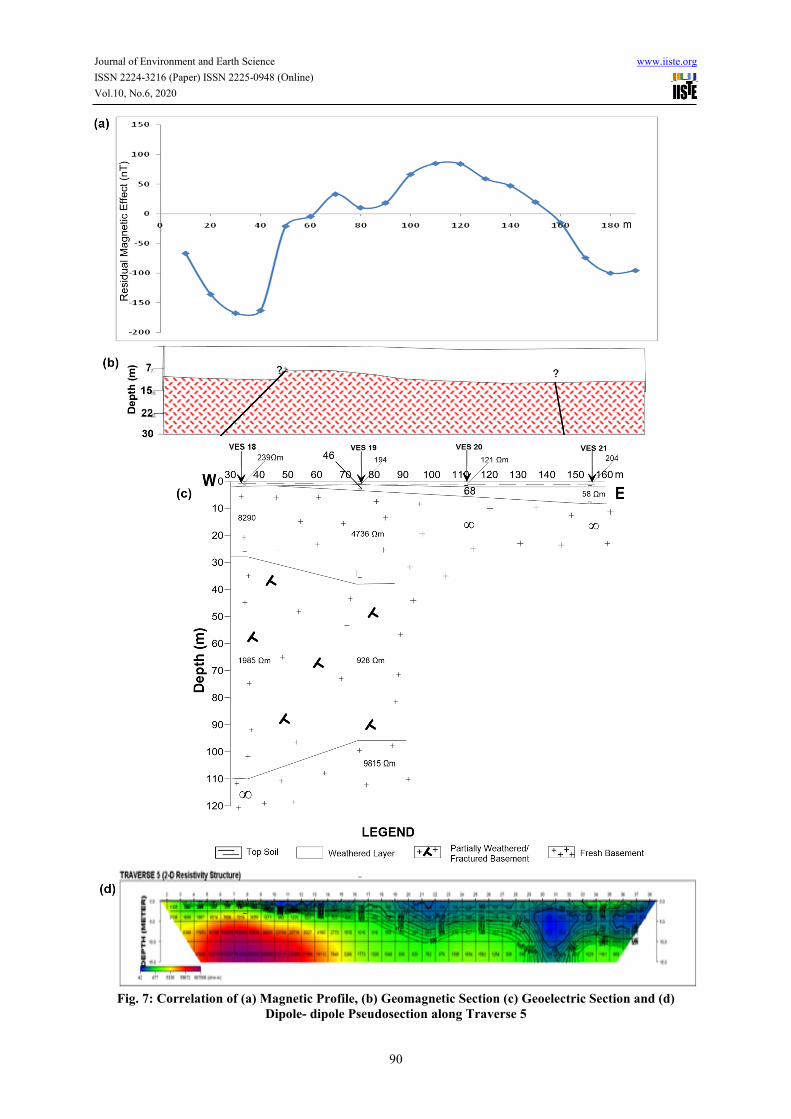
Fig. 7: Correlation of (a) Magnetic Profile, (b) Geomagnetic Section (c) Geoelectric Section and (d)
Dipole- dipole Pseudosection along Traverse 5
Journal of Environment and Earth Science www.iiste.org
ISSN 2224-3216 (Paper) ISSN 2225-0948 (Online)
Vol.10, No.6, 2020
91
Table 1: Summary of the Interpretation Results of the Magnetic Anomalies.
Traverse
No.
Magnetic Anomaly
Width (m)
Location of Top of Magnetic
Basement (m)
Estimated Depth to Magnetic
Basement (m)
1 180 110 14
2 90 and 100 60 and 150 7 and 10
3 150 and 40 90 and 165 9 and 7
4 150 130 7
5 80 and 110 50 and 158 7 and 12
Fig. 8: Geomagnetic Map of the Study Area.
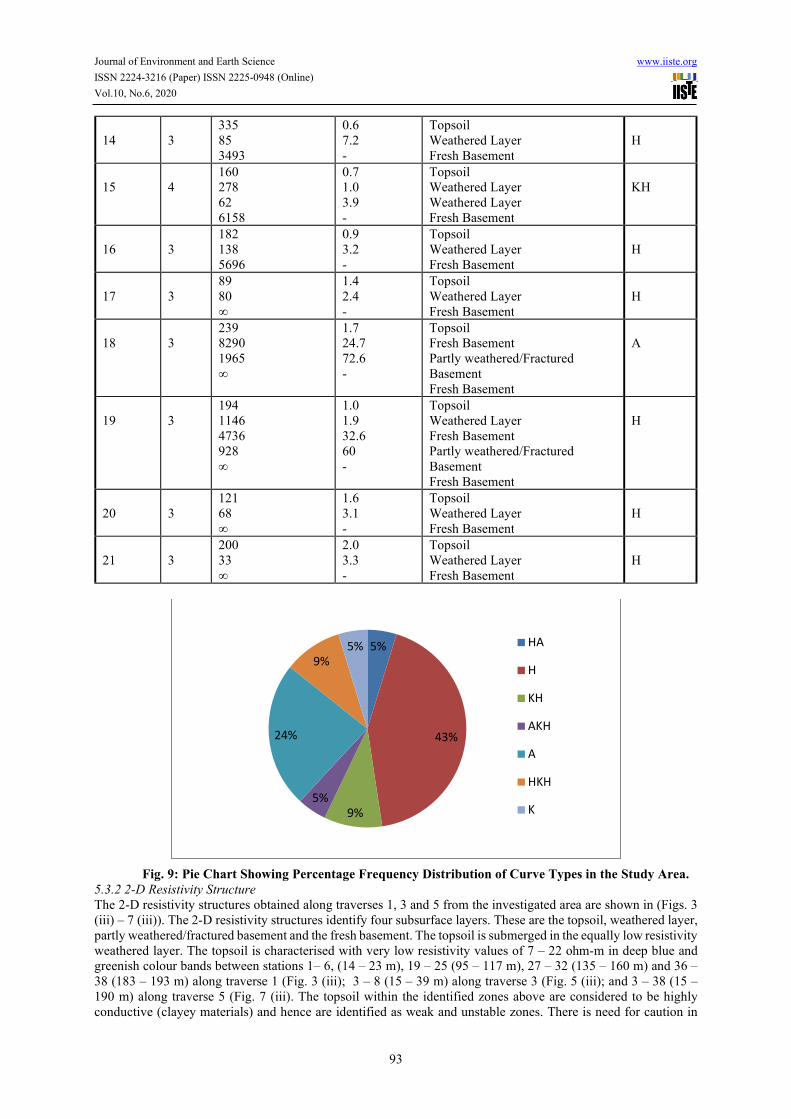
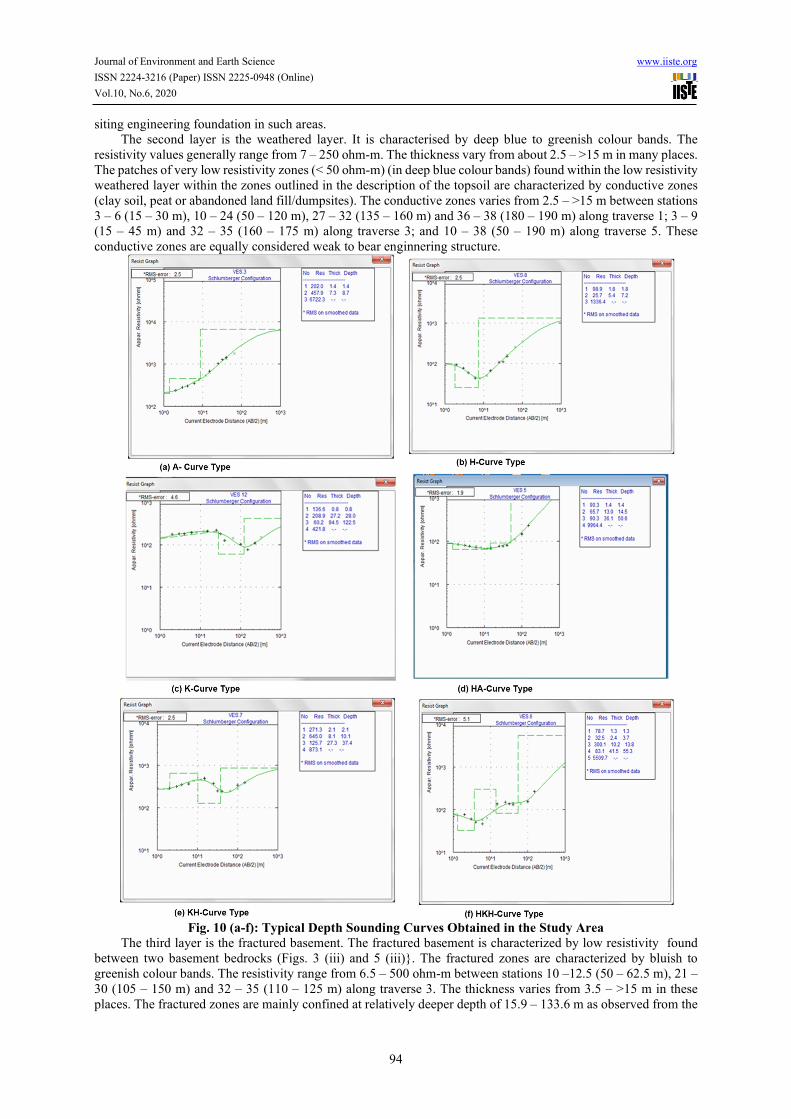
in (Fig. 9) shows the percentage frequency distribution of the curve types within the investigated area. The
predominant curve type in the study area is the H-curve type having a percentage frequency of 43% while A type
has 24%. The other curve types are K, HA and AKH-curves types with each represented by 5% distribution while
HKH and KH curve types are also represented equally by 9% (Fig. 9). Figure 10 shows the typical depth sounding
curves type obtained from the study area. The predominance of the H curve type implies that the topsoil which
usually range from < 0.5 – 2.5 m within which engineering foundation are usually placed are characterized by
higher resistivity values than the underlying layer. The near surface (topsoil) high resistivity values observed is
indicative of high competence for engineering foundation.

Journal of Environment and Earth Science www.iiste.org
ISSN 2224-3216 (Paper) ISSN 2225-0948 (Online)
Vol.10, No.6, 2020
92
Table 2: Summary of Interpretation Results of VES
VES
S/No
Layers Resistivity Value
Ωm)
Thickness
(m)
Lithological Characteristics Curve
Type
1
3
343
166
5027
1.4
4.7
-
Topsoil
Weathered Layer
Fresh Basement
H
2
5
537
324
2225
520
2988
1.0
6.0
26.3
46.0
-
Topsoil
Weathered Layer
Fresh Basement
Partly weathered/Fractured
Basement
Fresh Basement
HKH
3
3
202
458
6722
1.4
7.3
-
Topsoil
Weathered Layer
Fresh Basement
A
4
3
136
195
2733
1.0
6.5
-
Topsoil
Weathered Layer
Fresh Basement
A
5
4
90
66
90
∞
1.4
13.0
36.1
-
Topsoil
Weathered Layer
Partly Weathered/Fractured
Basement
Fresh Basement
HA
6
5
79
33
300
83
5510
1.3
2.4
10.2
32.5
-
Topsoil
Weathered Layer
Fresh Basement
Partly weathered/Fractured
Basement
Fresh Basement
HKH
7
4
271
645
126
873
2.1
8.1
27.3
-
Topsoil
Fresh Basement
Partly Weathered/Fractured
Basement
Fresh Basement
KH
8
3
99
26
1336
1.8
5.4
Topsoil
Weathered Layer
Fresh Basement
H
9
3
179
87
∞
0.9
3.6
-
Topsoil
Weathered Layer
Fresh Basement
H
10
3
85
298
2400
1.6
1.3
-
Topsoil
Weathered Layer
Fresh Basement
A
11
5
129
156
1151
187
∞
0.9
1.5
30.0
24.0
-
Topsoil
Weathered Layer
Fresh Basement
Partly weathered/Fractured
Basement
Fresh Basement
AKH
12
3
137
209
60
4218
0.8
27.2
56.5
-
Topsoil
Weathered Layer
Partly weathered/Fractured
Basement
Fresh Basement
K
13
3
70
119
∞
2.5
3.2
-
Topsoil
Weathered Layer
Fresh Basement
A
Journal of Environment and Earth Science www.iiste.org
ISSN 2224-3216 (Paper) ISSN 2225-0948 (Online)
Vol.10, No.6, 2020
93
Fig. 9: Pie Chart Showing Percentage Frequency Distribution of Curve Types in the Study Area.
5.3.2 2-D Resistivity Structure
The 2-D resistivity structures obtained along traverses 1, 3 and 5 from the investigated area are shown in (Figs. 3
(iii) – 7 (iii)). The 2-D resistivity structures identify four subsurface layers. These are the topsoil, weathered layer,
partly weathered/fractured basement and the fresh basement. The topsoil is submerged in the equally low resistivity
weathered layer. The topsoil is characterised with very low resistivity values of 7 – 22 ohm-m in deep blue and
greenish colour bands between stations 1– 6, (14 – 23 m), 19 – 25 (95 – 117 m), 27 – 32 (135 – 160 m) and 36 –
38 (183 – 193 m) along traverse 1 (Fig. 3 (iii); 3 – 8 (15 – 39 m) along traverse 3 (Fig. 5 (iii); and 3 – 38 (15 –
190 m) along traverse 5 (Fig. 7 (iii). The topsoil within the identified zones above are considered to be highly
conductive (clayey materials) and hence are identified as weak and unstable zones. There is need for caution in
5%
43%
9%5%
24%
9%5% HA
H
KH
AKH
A
HKH
K
14
3
335
85
3493
0.6
7.2
-
Topsoil
Weathered Layer
Fresh Basement
H
15
4
160
278
62
6158
0.7
1.0
3.9
-
Topsoil
Weathered Layer
Weathered Layer
Fresh Basement
KH
16
3
182
138
5696
0.9
3.2
-
Topsoil
Weathered Layer
Fresh Basement
H
17
3
89
80
∞
1.4
2.4
-
Topsoil
Weathered Layer
Fresh Basement
H
18
3
239
8290
1965
∞
1.7
24.7
72.6
-
Topsoil
Fresh Basement
Partly weathered/Fractured
Basement
Fresh Basement
A
19
3
194
1146
4736
928
∞
1.0
1.9
32.6
60
-
Topsoil
Weathered Layer
Fresh Basement
Partly weathered/Fractured
Basement
Fresh Basement
H
20
3
121
68
∞
1.6
3.1
-
Topsoil
Weathered Layer
Fresh Basement
H
21
3
200
33
∞
2.0
3.3
-
Topsoil
Weathered Layer
Fresh Basement
H
Journal of Environment and Earth Science www.iiste.org
ISSN 2224-3216 (Paper) ISSN 2225-0948 (Online)
Vol.10, No.6, 2020
94
siting engineering foundation in such areas.
The second layer is the weathered layer. It is characterised by deep blue to greenish colour bands. The
resistivity values generally range from 7 – 250 ohm-m. The thickness vary from about 2.5 – >15 m in many places.
The patches of very low resistivity zones (< 50 ohm-m) (in deep blue colour bands) found within the low resistivity
weathered layer within the zones outlined in the description of the topsoil are characterized by conductive zones
(clay soil, peat or abandoned land fill/dumpsites). The conductive zones varies from 2.5 – >15 m between stations
3 – 6 (15 – 30 m), 10 – 24 (50 – 120 m), 27 – 32 (135 – 160 m) and 36 – 38 (180 – 190 m) along traverse 1; 3 – 9
(15 – 45 m) and 32 – 35 (160 – 175 m) along traverse 3; and 10 – 38 (50 – 190 m) along traverse 5. These
conductive zones are equally considered weak to bear enginnering structure.
Fig. 10 (a-f): Typical Depth Sounding Curves Obtained in the Study Area
The third layer is the fractured basement. The fractured basement is characterized by low resistivity found
between two basement bedrocks (Figs. 3 (iii) and 5 (iii). The fractured zones are characterized by bluish to
greenish colour bands. The resistivity range from 6.5 – 500 ohm-m between stations 10 –12.5 (50 – 62.5 m), 21 –
30 (105 – 150 m) and 32 – 35 (110 – 125 m) along traverse 3. The thickness varies from 3.5 – >15 m in these
places. The fractured zones are mainly confined at relatively deeper depth of 15.9 – 133.6 m as observed from the
Journal of Environment and Earth Science www.iiste.org
ISSN 2224-3216 (Paper) ISSN 2225-0948 (Online)
Vol.10, No.6, 2020
95
2-D resistivity structure, may pose little or no threat to engineering foundation in the study area.
The last layer is the fresh basement bedrock. The resistivity is characterised by moderately high to very high
resistivity values of up to 2007 ohm-m (yellowish to red colour bands). Depths to the basement bedrock vary from
about <1 to >15 m. The basement topography is gently undulating (Figs. 3 (iii), 5 (iii) and 7 (iii)). These deductions
are corroborated by the geoelectric sections and the geomagnetic sections.
5.3.3 Geoelectric Sections
The VES interpretation results were used to generate geoelectric sections. The summary of the interpreted
geoelectric parameters obtained in the study area are presented in Table 3. The geoelectric sections delineate five
subsurface geologic layers (Table 3). These are the topsoil, weathered layer, fresh basement, fractured basement
and fresh basement bedrock (Figs. 3d – 7d).
Table 3: Summary of Geoelectric Characterization of the VES Interpretation Results.
Layering Resistivity Range
(ohm-m)
Thickness
(m)
Lithologic Description
Topsoil 70 – 537 0.6 – 2.5 Clay, Sandy clay, Clayey sand and Lateritic.
Weathered layer 33 – 458 1.3 – 13.0 Clay/Sandy Clay, Clayey sand and Lateritic.
Basemen rock 209 – 8290 8.1 – 32.6 Fresh basement
Fractured basement 60 – 1985 15.9 – 72.6 Partly weathered and Fractured basement
rock.
Basement Bedrock 422 – ∞ – Fresh basement.
*Depth to Bedrock varies from 2.1 to 13 m
5.4 Correlation of Geophysical Results
The correlation of the Magnetic, dipole-dipole 2-D resistivity structure profiles and the geoelectric sections are
presented in (Figs. 3 (a-d) - 7 (a-d)). Typical thick/thin dipping dyke suspected to be fractures, shear zones, faults
or geological boundaries were observed along the magnetic profiles and the 2-D geomagnetic sections (Figs. 3 (a-
e) - 7 (a-e)). This anomalies were identified between distances 0 – 180 m along traverse 1; between distances 0 –
90 m and 100 – 200 m along traverse 2; between distances 0 – 150 m and 150 – 190 m along traverse 3; between
distances 30 – 180 m along traverse 4; and between distances 0 – 80 m and 80 – 190 along traverse 5. The
geoelectric section delineated partly weathered/fractured zones beneath some VES along Traverses 1, 2, 3, and 5.
However, the 2-D resistivity structure did not delineate any subsurface structure along Traverse 1.
The identified conductive zones with moderately high conductivity/low resistivity zones (conductive soils)
which occur at relatively shallow depth are classified as weak zones within the subsurface geology which are
suspected to be inimical to the location of civil engineering infrastructures within the investigated area. However,
these results show that there is a good correlation from the results of all the geophysical methods used in this study.
5.5 Resistivity Maps
Figure 11a shows the distribution of the resistivities of the topsoil within the study area which generally range
from 70 – 540 Ωm (Fig. 10a). It is observed that the area within the main bowl of the stadium is characterized by
moderately low resistivity values of 70 – 150 Ωm suggesting clay/sandy clay, topsoil and by implication, it is
considered to be moderately geotechnically competent for sitting of some of the proposed structures in the stadium.
However, the northern and southern parts of the main bowl are dominated by relatively high resistivity values of
180 – 540 Ωm, indicating sandy clay, clayey sand, and lateritic material at shallow depth. Generally, the topsoil
in the area can be inferred to be relatively more stable and competent enough to host civil engineering foundation.
The weathered layer resistivity map (Fig. 11b) show resistivity values which generally rage from 21- 645 Ωm with
dominant resistivity values of > 100 Ωm characterizing major part of the study area, including the main bowl of
the stadium which indicates moderate – high resistive (competent geo-material) whose composition are sandy clay,
clayey sand and laterite are considered competent for engineering structures. However, pockets of low resistivity
zones exist within the main bowl, western and southeastern part of the study area. These areas that are characterized
by relatively low resistivity values (<50 Ωm) are composed of clay, and are considered to be geotechnically
incompetent for the proposed structure (Fig. 11b). The bearing capacity of this layer may need to be considered
while designing foundation for building in the identified area.
5.5.1 Isopach Maps
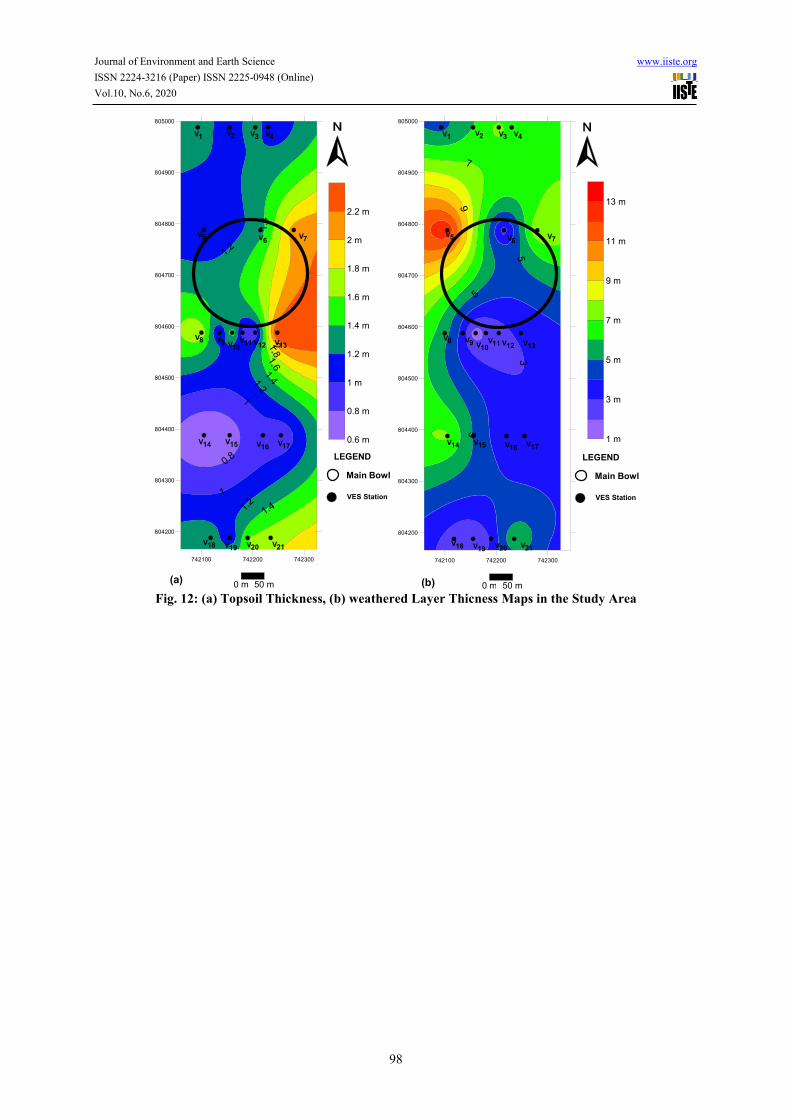
Figure 12a display the isopach map of the topsoil which shows the distribution of the topsoil thickness in the study
area. The topsoil thickness range from 0.6 – 2.4 m which revealed that the topsoil is generally thin (0.6 – 1.6 m)
in the north, central and southern part of the investigated area. The north eastern, southeastern and a small area in
the eastern part of the investigated area have thickness which range from 1.8 – 2.1 m in the study area.
The isopach of map of the weathered layer is shown in (Fig. 12b). It generally range from 1.3 – 13 m. The
weathered layer thickness is thin 1.0 – 7.0 m is observed in the northern, eastern, western and southern parts of the
study area. However, weathered layer thickness with higher value of 8.0 – 13.0 m is found in northwestern part

Journal of Environment and Earth Science www.iiste.org
ISSN 2224-3216 (Paper) ISSN 2225-0948 (Online)
Vol.10, No.6, 2020
96
close to the main bowl of the stadium. The large variation in the weathered layer thickness along Traverse 2 implies
uneven basement topography. When an engineering structure is placed to straddle between thin 2.0 – 4.0 m and
thick > 4.0 – 13.0 m thick weathered layer, this can initiate strain in the building foundation and may initialise
failure and its eventual collapse.
5.5.2 Bedrock Topography Map
The bedrock relief map of the study area is presented in (Fig. 13a). The map reveals gentle undulation in the relief
of the subsurface basement. The major part of the investigated area located in the north, central, eastern flank and
the southern part of the study area are characterized by thin (1 – 7 m) overburden materials. This is supported by
the thin overburden thickness observed from geomagnetic sections, 2-D resistivity structures and the geoelectric
sections generated for the study area. These areas are considered to be relatively stable for sitting engineering
structures.
5.5.3 Structural Map of the Study Area
The structural map of the study area developeded from the magnetic profiles is presented in (Fig. 13b). The map
show two major subsurface structural dicontinuities within the basement bedrock designated F1 and F2 is
delineated in the investigated area. This discontinuity is suspected to be a major fault/fracture zone in the study
area. The fault/fracture zones are observed to cut across the study area in a north – south direction. This suggests
that extreme care is needed by engineers working at the site in designing and location of engineering foudation in
the study area.
5.5.4 Subsoil Characterization of the Study Area
The subsurface geoelectric units delineated beneath the investigated area include the topsoil, weathered layer,
partly weathered/fractured basement and the fresh basement bedrock. The topsoil constitutes the layer within
which normal civil engineering foundation is founded at a depth range of 1-4 m. This layer is made up of clay,
sandy clay and clayey sand Table 4.
Fig. 11a shows the topsoil resistivity distribution map of the study area. The topsoil resistivity map shows
that the study area is underlain by resistivity values which range from 62-537 ohm-m. The topsoil resistivity values
were used for the rating of subsoil competence of the investigated area based on Idornigie et al., (2006). The rating
of the subsoil competence of the study area using resistivity values is presented in Table 4. It is observed that the
area within the main bowl of the study area is characterized with moderately low resistivity values of 70 – 150
Ωm suggesting sandy clay, topsoil and by implication, it is considered to be moderately geotechnically competent
for siting of some of the proposed structures in the stadium (Table 4). The peripheral of this low resistivity zone
occupying the central part is bordered and extends to the southern and northern parts by a moderately higher
resistivity values which range from 100-350 ohm-m. This zone is composed of sandy clay and hence, rated to be
moderately competent (Table 4). A small portion in the northwestern part of the investigated area is underlain by
subsoil characterized by resistivity values which fall in the range of 350-750 ohm-m. This range of resistivity
values is composed of clayey sand/laterite. It is rated to be competent for civil engineering structure (Table 4). To
avoid future catastrophy, extreme care is required in the are characterized by low resistivity zones by civil enginers
designing building foundation at the site.

Journal of Environment and Earth Science www.iiste.org
ISSN 2224-3216 (Paper) ISSN 2225-0948 (Online)
Vol.10, No.6, 2020
97
Fig. 11: (a) Topsoil Resistivity and (b) Weathered layer Resistivity Maps in the Study Area.
Journal of Environment and Earth Science www.iiste.org
ISSN 2224-3216 (Paper) ISSN 2225-0948 (Online)
Vol.10, No.6, 2020
98
Fig. 12: (a) Topsoil Thickness, (b) weathered Layer Thicness Maps in the Study Area
3
742100 742200 742300
804200
804300
804400
804500
804600
804700
804800
804900
805000
0 m 50 m
Main Bowl
VES Station
LEGEND
V1 V2 V3 V4
V5 V6V7
V8 V9 V10V11 V12 V13
V14 V15 V16 V17
V18 V19 V20 V21
1 m
3 m
5 m
7 m
9 m
11 m
13 m
742100 742200 742300
804200
804300
804400
804500
804600
804700
804800
804900
805000
0 m 50 m
Main Bowl
VES Station
LEGEND
V1 V2 V3 V4
V5 V6V7
V8 V9 V10V11 V12 V13
V14 V15 V16V17
V18 V19 V20 V21
0.6 m
0.8 m
1 m
1.2 m
1.4 m
1.6 m
1.8 m
2 m
2.2 m
(b)(a)

Journal of Environment and Earth Science www.iiste.org
ISSN 2224-3216 (Paper) ISSN 2225-0948 (Online)
Vol.10, No.6, 2020
99
Fig. 13: (a) Bedrock Releif Map, (b) Magnetic Structural Map of the Study Area.
Table 4: Rating of Subsoil Competence of the Topsoil in the Study Area using Resistivity Values.
Layering Resistivity Range
(ohm-m)
Thickness
(m)
Lithologic
Description
Competence Rating Soil Sample
Topsoil
≤ 100
100-350
350-750
0.8-1.8
0.6-2.1
1.0
Clay
Sandy clay
Clayey sand
Incompetent
Moderately competent
Competent
C and D
B and E
A
5.6 Geotechnical Results
Table 5 shows a summary of the geotechnical classification of the subsoil in the study area using plasticity index
based on Adeyemi and Oyediran, (2004). It is observed from Table 5 that samples B and E are characterized by
low-medium index classification and are characterized by low-medium plasticity/low-medium compressibility and
high-moderate civil engineering competence respectively. Samples A, C and D have high index classification and
are characterized by high plasticity/high compressibility and consequently, low engineering competence Tables 4
and 5 further confirmed that there is a good correlation between the geophysical results and the geotechnical results
as presented in this study.
Table 5: Engineering Classification of the Subsoil in the Study Area using Plasticity Index (after Adeyemi
and Oyediran, 2004).
Soil
Sample
Plasticity Index
Value
Plasticity
Index Range
Index
Classification
Cassangrade Plasticity Classification
B 4.5 >10 Low Low Plasticity/Low Compressibility,
High Competence
E 12.7 10-20 Medium Medium Plasticity/Medium
Compressibility, Moderate Competence
A, C and
D
21.3, 24.7 and
34.0 (21.3-34.0)
>20 High High Plasticity/High Compressibility,
Low Competence
5.6.1 Grain Size Distribution
A summary of the geotechnical results is presented in table 6. The percentage passing sieve 0.075 mm ranges from
26.7 – 73.3. Typical particle size distribution curves obtained from the study area is presented in (Fig. 14). The
TR2
TR3
TR4
TR5
TR1
F 1
F 2
Main Bowl
VES Station
LEGEND
Magnetic station
Suspected fracturezone
TR Geophysical traverse
(a) (b)

Journal of Environment and Earth Science www.iiste.org
ISSN 2224-3216 (Paper) ISSN 2225-0948 (Online)
Vol.10, No.6, 2020
100
soil distribution curves for the samples A-E show that the soil contained a good representation of the various grain
sizes (Cassagrande, 1982). Hence, the soil samples are classified to be well graded (non-uniform). Samples B and
E have values of 26.7% and 27.5% passing No. 200 sieve. The samples have < 50% passing No. 200 (0.075 mm)
sieve which indicate that they are more coarse grained soil than samples A, C and D with > 50% passing sieve
0.075 mm with percentage values of 73.3%, 64.6% and 54.7%. These soils are described as clay of high plasticity
(Tables 4). Samples B and E falls within the 30% maximum recommended by Federal Ministry of Works and
Housing (FMWH), 1972 while Samples A, C and D falls above the 30% maximum recommended value for a
foundation material. Samples B and E suggest low swelling potential with eventual rise in water table, low
compressibility, higher unconfined Compressive Strength and Shear Strength under loading conditions. Therefore,
based on the analysis presented in table 6, soil samples B and E are considered to be good and hence, more suitable
as foundation geo-material, sample C is considered to be fair while samples A and D are rated as poor.
5.6.2 Mineralogy
The casangrade chart (Fig. 15) is indicative of the possible existence of a variety of soil types in the study area.
Figure 15 shows that all the soil samples lie below the U-line. The U-line defines the possible upper limit of
plasticity of a given soil. The soil samples plot on the chart show that most of the soils plot between the A-line and
the U-line. The soil sample plot on the chart tends to indicate the presence of illite clay type. This implied that the
presence of illites clay type may impart be indicative of a fairly stable soil for siting engineering foundation. From
the Casangrade chart (Fig. 15) samples B and E plots on the low plasticity zone. Sample D plots on the intermediate
plasticity zone while soil samples A and C plots on the high plasticity zone (Fig. 15). This result indicates that soil
samples B and E is non-cohesive (sandy) and it is friable. Soil sample D is less cohesive and fairly friable while
soil samples A and C is actually cohesive (i.e. clayey) and non-friable. Hence, samples B and E may be considered
to be more stable and more competent sub-grade material than samples A, C and D. These results corroborated the
grain size distribution analysis result.
Table 6: Summary of the Geotechnical Results
Sample with ** Asterisks’ is Good Sample with * Asterisk’ is Fair Sample with
no Asterisk’ is Poor

Journal of Environment and Earth Science www.iiste.org
ISSN 2224-3216 (Paper) ISSN 2225-0948 (Online)
Vol.10, No.6, 2020
101
Fig.14. :Typical Particle Size Distribution Curve for Sample B
Fig. 15: Plasticity Chart for the Soil Samples in the Study Area
5.6.3 Atterberg Limits Test
Table 6 present a summary of the liquid and plasticity limits of the soil samples. The liquid limit (WL), plastic
limit (WP) and plastic index (PL) values for the five (5) soil samples obtained from the investigated area range
from 31.3-62.2%, 19.6-28.2% and 4.5-34.0% respectively. The FMWH (1974) recommended liquid limit of 40%
and plastic index of 12% for sub-grade material (Adejumo, et al. 2015). Samples B and E have lower liquid limit
values of 31.3 and 32.3% which is lower than the maximum 40% recommended while the values for samples A,
C, and D 62.2%, 54.7% and 44.4% respectively, are higher than the maximum 40% specified value table 6 and
(Fig. 15). Plasticity index of samples B and E are 4.5% and 12.7% fall within the maximum 12% recommended
while the values for samples A, C, and D are 34.0%, 30.0% and 23.1% respectively, are observed to be higher than
the maximum 12% specified value table 6.
Based on the ranges of plasticity index (PI%) as shown in (Fig. 15) and the swelling potential shown in Table
7 (Ola, 1982), the swelling potential of the soil samples from the study area can be categorized. Samples A and C
Journal of Environment and Earth Science www.iiste.org
ISSN 2224-3216 (Paper) ISSN 2225-0948 (Online)
Vol.10, No.6, 2020
102
have plasticity index (PI %) values of 34.0 and 30.0. These samples have a characteristic high swelling potential.
This implies the presence of clay soil which may be subject to alternate expansion and contraction with season and
with a consequent floor heaving and eventual foundation failure. Sample D has plasticity index (PI %) value of
23.1% with a swelling potential rating of medium range. This shows that sample D will be more competent sub-
soil material than sample A and C to host engineering foundation. Samples B and E have plasticity index (PI%)
values of 4.5% and 12.7% respectively (Fig. 15). The swelling potential is characterized to be of low level rating.
This implies that the samples contain more sand than samples A, C, and D. This signifies that samples B and E are
better foundation materials than soil samples A, C and D from the study area.
Table 7: Potential Expansiveness of the Soil (After Ola, 1982)
Plasticity Index (PI %) Swelling Potential
0 – 15 Low
15-25 Medium
25-35 High
Over 75 Very High
5.6.4 Linear Shrinkage
The linear shrinkage values of the soil samples generally range from 5.0% – 11.4% table 6. Brink et al., 1992
recommended that soils with linear shrinkage of 8% to be indicative of inactive, inexpansive and hence a good
foundation material. Soil samples B and E have shrinkage values of 5.0% and 5.7% which falls within the 8%
recommended. Samples A and C have11.4% each while sample D has 9.3%, which are higher than the 8%
minimum recommended value. This result suggests that samples B and E may not be susceptible to swelling with
seasonal changes in wetness that is characteristic of the tropical region. Jegede, 1999, observed that the lower the
linear shrinkage, the lower the tendency of the soil to shrink when subjected to desiccation.
5.6.5 Natural Moisture Content
The natural moisture content of the soil samples generally range from 7.1% – 18.8% table 6. It was observed that
soil samples B and E have the lowest moisture content values of 7.1% and 8.0% while samples A, C, and D has
higher values of 18.8%, 16.4% and 12.4% respectively. The observed values show that the lower the natural
moisture content of a soil, the more competent the soil. Therefore, samples B and E can be adjudged to be a better
foundation material than samples A, C and D at the investigated site.
5.6.6 Maximum Dry Density
The Maximum Dry Density (MDD) of the soil samples generally range from 1303.9 – 1973.59 Kg/m3 at Optimum
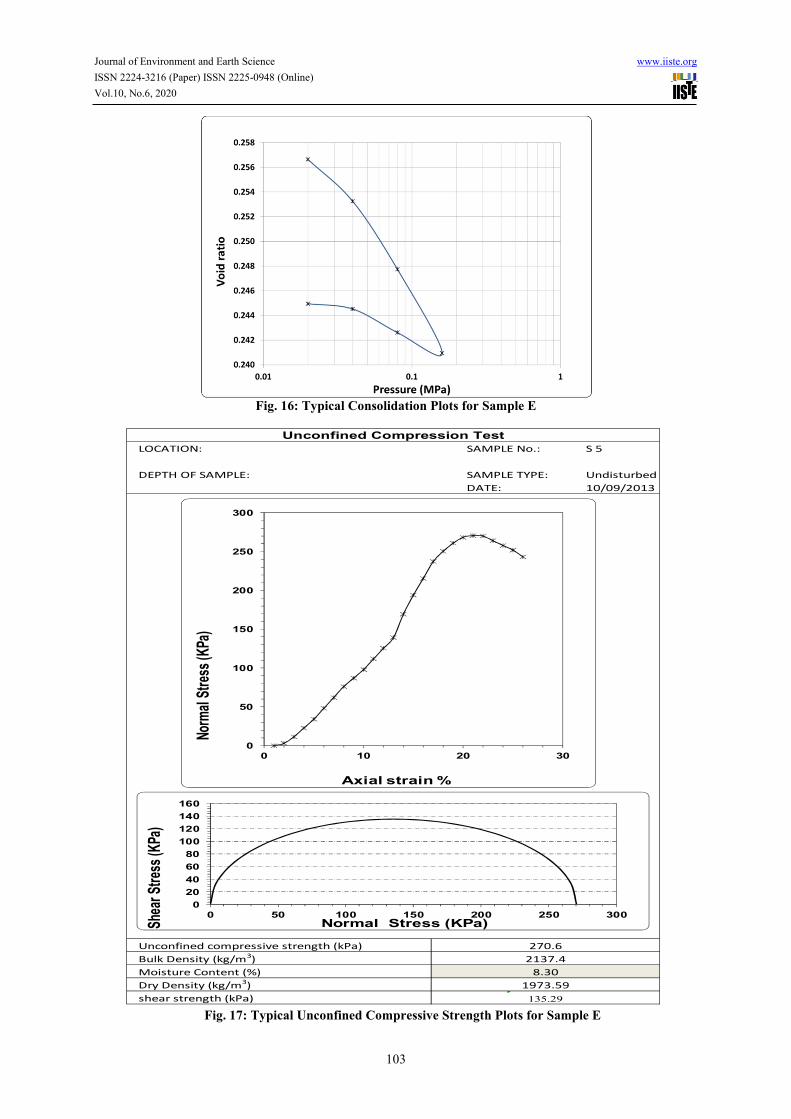
Moisture Content (OMC) of 8.3 – 22.3% table 6. Typical consolidation curve is shown in (Fig. 16). It is observed
that soil samples B and E have the highest MDD values of 1913.96 kg/m3 and 1973.59 kg/m3 at lower OMC values
of 9.4% and 8.3%. Samples A, C and D have lower MDD values of 1303.9 kg/m3, 1431.11 kg/m3 and 1594.81
kg/m3 at relatively higher OMC values of 22.3%, 20.1% and 16.4% than samples B and E. It can be inferred from
this study that soil with higher MDD at lower OMC is considered to be a better foundation material as earlier
observed by (Jegede, 1999).
5.6.7 Consolidation Test
5.6.7.1 Coefficient of Consolidation (Cv)
Deformation characteristics on the five (5) soil samples A-E obtained from the investigated area were determined
in accordance to the BS 1377 (British Standard Institution, 1990) as summarized in table 6. Typical curve of
coefficient of consolidation (Cv) for sample E is presented in (Fig. 17). The coefficient of consolidation (Cv) for
the soil samples A – E generally range from 0.309 – 0.339 (m2/yr). The observed values falls within those obtained
for other soil types elsewhere in the world Table 8. Table 9 contains typical values of coefficient of consolidation
(Cv) (Lambe and Whitman, 1979) and the corresponding rate of consolidation and typical material. The values of
coefficient of consolidation (Cv) m2/yr obtained for samples A – E in the study area which range from 0.31-0.34
m2/yr has a characteristic low rate of consolidation. This indicates that all the soil samples contained > 25% clay
(table 8).
5.6. 7.2 Coefficient of Volume Compressibility (Mv)
The Coefficient of Volume Compressibility (Mv) for samples A – E generally varies from 0.112 – 0.475 (m2/MN
or MPa-1) table 6. Table 10 show typical values of the coefficient of volume compressibility (Mv) (Head, 1982)
and the corresponding compression behaviour. Samples A, C, and D has values that range from 0.325 – 0.475
(m2/MN or MPa-1). This is an indicative of high compressibility table 10. Samples B and E has a compressibility
values which range from 0.112 – 0.118. These samples are characterized by medium compressibility and low
compression behaviour (table 10). This compression behaviour is indicative of sandy clay material. This suggests
that samples B and E are considered better foundation material and of higher strength than samples A, C and D.
Journal of Environment and Earth Science www.iiste.org
ISSN 2224-3216 (Paper) ISSN 2225-0948 (Online)
Vol.10, No.6, 2020
103
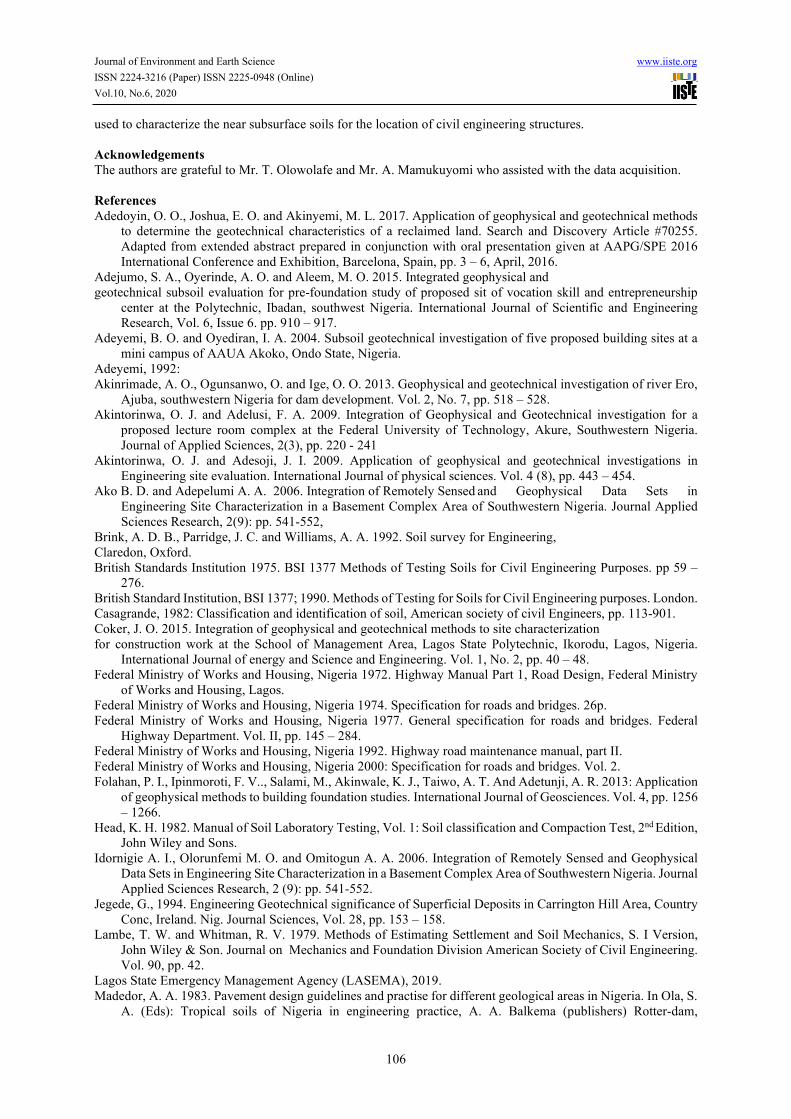
Fig. 16: Typical Consolidation Plots for Sample E
Fig. 17: Typical Unconfined Compressive Strength Plots for Sample E
LOCATION: S 5
DEPTH OF SAMPLE: Undisturbed
10/09/2013
135.29
Moisture Content (%) 8.30
Dry Density (kg/m3) 1973.59
shear strength (kPa)
Bulk Density (kg/m3) 2137.4
Unconfined Compression Test
SAMPLE No.:
SAMPLE TYPE:
DATE:
Unconfined compressive strength (kPa) 270.6
0
50
100
150
200
250
300
0 10 20 30
Norm
al S
tres
s (K
Pa)
Axial strain %
0
20
40
60
80
100
120
140
160
0 50 100 150 200 250 300
Shea
r Str
ess
(KPa
)
Normal Stress (KPa)

Journal of Environment and Earth Science www.iiste.org
ISSN 2224-3216 (Paper) ISSN 2225-0948 (Online)
Vol.10, No.6, 2020
104
Table 8: Engineering Suitability Ratings for Soil Samples from the Study Area Based Upon Unified Soil
Classification (USCS) Groups. Das (2002).
Unified Soil Classification Typical Names USC group
Symbol
Soil Sample
No.
Suitability for Building
Foundation
Inorganic Clays of high plasticity, fat clays, silty
clays, elastic soils
CH A and C Poor (Swelling)
Silty sands, poorly graded sand-silt mixtures. SM B Good (Density
important)
Inorganic clays of low to medium plasticity, gravelly
clays, sandy clays, silty clays, lean clays
CL D Poor (Swelling)
Clayey sands, poorly graded sand-clay mixtures. SC E Good (Density
Important)
Table 9: Typical Values of the Coefficient of Consolidation (Cv) after Lambe & Whitman (1979)
Coefficient of Consolidation, Cv (m2/year) Rate of Consolidation Typical Material
< 0.01 Very low
0.1-1.0 Low >25% clay
1-10 Medium 15-25% clay
10-100 High <15% silt
> 100 Very high
Table 10: Typical Values for the Coefficient of Volume Compressibility (Mv) after Head (1982).
Coefficient of Compressibility,
(MPa-1)
Compressibility Compression
Index, Cc
Compression
Behaviour
Clay Type
<0.05 Very low >3.0 Very high Soft clay
0.05-0.1 Low 0.3-0.15 High Clay
0.1-0.3 Medium 0.15-0.075 Low Sandy clay
0.3-1.5 High
>1.5 Very high
5.6. 8 Unconfined Compressive Strength
The Unconfined Compressive Strength (UCS) of soil samples observed in the study area generally range from
155.1 – 276.0 KN/m2 table 6. Figure 17 presents a typical Unconfined Compressive Strength (UCS) plot for the
study area. The results show that all the soil samples A – E have higher values than the acceptable minimum value
of 130 KN/m2 recommended by the FMWH, 1977. This shows that the subsoil within the investigated site can be
adjudged to be of high strength and hence, considered to be competent as foundation material.
5.6.9 Shear Strength
The Shear Strength of the soil samples A – E tested ranges from 77.55 – 138 KPa table 6. Samples B and E have
the highest shear strength of 138.02 and 135.29 KPa while samples A, C and D have relatively lower values of
77.56 Kpa, 87.8 KPa and 99.5 Kpa. It can be inferred from the observed values that soil samples B and E are more
competent geo-materials to support the proposed structures than samples A, C and D.
5.6.10 Cross Plot of the Coefficient of Consolidation (Cv) m2/yr and the Liquid Limit (LL%).
A cross plot of the coefficient of consolidation (Cv) m2/yr and the Liquid Limit (LL%) is presented in (Fig. 18).
Fig. 18 can be used to establish a relationship between the coefficient of consolidation (Cv) m2/yr and LL% for the
study area. The graph in (Fig. 18) shows that the value of the coefficient of consolidation (Cv) m2/year decreases
by -0.001 value as the value of LL% increases within the investigated area. There is a good correlation value of
0.98 existing between the coefficient of consolidation (Cv) m2/yr and the LL% (Fig. 18). The gradient of the graph
in (Fig. 18) is -0.001. This implies that for any increase in LL%, the coefficient of consolidation (Cv) m2/yr
decreases by -0.001 for the soil sample in the study area.

Journal of Environment and Earth Science www.iiste.org
ISSN 2224-3216 (Paper) ISSN 2225-0948 (Online)
Vol.10, No.6, 2020
105
Fig. 18: Plot of Coefficient of Consolidation (Cv) m2/yr against Liquid Limit (LL%)
6. Conclusions
Integrated geotechnical and geophysical methods have been used for subsoil characterization of parts of the new
stadium complex Akure, Southwestern Nigeria. This is with the aim to determine its geotechnical competency for
location of civil infrastructures. Five magnetic and three dipole-dipole profiles were undertaken at station
separation of 10 m along the traverses and a total of twenty-one (21) Vertical Electrical Sounding (VES) utilizing
the Schlumberger array were carried out within the investigated area. Geotechnical tests were carried out on five
(5) soil samples obtained from the study area. The magnetic profiles delineated characteristic one to two negative
peak amplitude anomalies that are typical of thin dipping dyke models (suspected to be fractures, shear zone, faults
or geological boundaries) along Traverses 1 – 5. The identified fractured/fault zones constitute weak geologic
zones that are inimical to civil engineering structures. The 2-D geomagnetic section was used to delineate
overburden thicknesses which vary from 5-15 m along the Traverses in the study area. The geoelectric section, 2-
D resistivity images and the resistivity maps show that both the topsoil and the weathered layer identified low
resistivity zones that are diagnostic of clay, sandy clay and partly weathered/fractured basement rock that are
characteristic of weak geo-materials which can constitute a major threat to the stability of proposed civil
engineering structures in the study area. These zones are areas where engineering foundation are not desired. The
fracture/fault zones delineated by the magnetic and geoelectric methods are potentially weak areas that may
precipitate failure of civil engineering foundation and an eventual collapse of the building sited on them in the
investigated area.
The geotechnical tests carried out on five (5) soil samples obtained from the study area includes: grain size
distribution, consolidation, atterberg limits, grain size analysis and unconfined compression tests. The particle size
distribution curved obtained for soil samples A-E in the investigated area show that the soil samples A-E are
classified to be well graded (non-uniform). It was observed that samples A and C have >50% passing sieve No.
200 and classified by AASHTO as clay soil of high plasticity and adjudged to be a poor foundation material.
Sample D has value of 54.7% passing sieve No. 200, and it is classified as fine-coarse grained soil. AASHTO
described the soil to be silty clay of intermediate plasticity and considered to be fairly suitable as foundation
material. Samples B and E have percentage values of 26.7% and 27.5% passing sieve No. 200. This indicates that
they are more coarse grained soils. AASHTO described the soil samples as silty clay of intermediate plasticity)
and it is classified to be fairly suitable as foundation material. Summary of the geotechnical classification of the
subsoil in the study area using plasticity index show that samples A, C and D have high index classification and
are characterized by high plasticity/high compressibility and consequently, are considered to be of low engineering
competence. Also, samples B and E are characterized by low-medium index classification and are characterized
by low-medium plasticity/low-medium compressibility and are rated to be of moderate-high civil engineering
competence. The results obtained from the particle size distribution show a good correlation with the plasticity
index classification obtained in the study area. However, soils with higher liquid limit or plasticity index have
lower electrical resistivity values and hence low competence. A summary of the soil analysis results show that soil
samples B and E are considered to be good and more suitable as foundation material, sample C is considered to be
fair while samples A and D are considered as poor foundation material. The other factor that can as well be used
in the assessment of soil/subsoil competence is the geologic structures and lineament density. This study shows
that there is good correlation between the geophysical and geotechnical results obtained from this study. It can
therefore be concluded that the subsoil in the investigated area is characterized by low, moderate and high
competence. The study concludes that integration of geophysical and geotechnical methods can be successfully
Cv = -0.001LL + 0.3695
R² = 0.9689
R = 0.98
0.305
0.31
0.315
0.32
0.325
0.33
0.335
0.34
0.345
0 20 40 60 80Co
eff
icie
nt
of
Co
nso
lid
ati
on
(C
v)
m2/y
r
Liquid Limit (LL) %
Journal of Environment and Earth Science www.iiste.org
ISSN 2224-3216 (Paper) ISSN 2225-0948 (Online)
Vol.10, No.6, 2020
106
used to characterize the near subsurface soils for the location of civil engineering structures.
Acknowledgements
The authors are grateful to Mr. T. Olowolafe and Mr. A. Mamukuyomi who assisted with the data acquisition.
References
Adedoyin, O. O., Joshua, E. O. and Akinyemi, M. L. 2017. Application of geophysical and geotechnical methods
to determine the geotechnical characteristics of a reclaimed land. Search and Discovery Article #70255.
Adapted from extended abstract prepared in conjunction with oral presentation given at AAPG/SPE 2016
International Conference and Exhibition, Barcelona, Spain, pp. 3 – 6, April, 2016.
Adejumo, S. A., Oyerinde, A. O. and Aleem, M. O. 2015. Integrated geophysical and
geotechnical subsoil evaluation for pre-foundation study of proposed sit of vocation skill and entrepreneurship
center at the Polytechnic, Ibadan, southwest Nigeria. International Journal of Scientific and Engineering
Research, Vol. 6, Issue 6. pp. 910 – 917.
Adeyemi, B. O. and Oyediran, I. A. 2004. Subsoil geotechnical investigation of five proposed building sites at a
mini campus of AAUA Akoko, Ondo State, Nigeria.
Adeyemi, 1992:
Akinrimade, A. O., Ogunsanwo, O. and Ige, O. O. 2013. Geophysical and geotechnical investigation of river Ero,
Ajuba, southwestern Nigeria for dam development. Vol. 2, No. 7, pp. 518 – 528.
Akintorinwa, O. J. and Adelusi, F. A. 2009. Integration of Geophysical and Geotechnical investigation for a
proposed lecture room complex at the Federal University of Technology, Akure, Southwestern Nigeria.
Journal of Applied Sciences, 2(3), pp. 220 - 241
Akintorinwa, O. J. and Adesoji, J. I. 2009. Application of geophysical and geotechnical investigations in
Engineering site evaluation. International Journal of physical sciences. Vol. 4 (8), pp. 443 – 454.
Ako B. D. and Adepelumi A. A. 2006. Integration of Remotely Sensed and Geophysical Data Sets in
Engineering Site Characterization in a Basement Complex Area of Southwestern Nigeria. Journal Applied
Sciences Research, 2(9): pp. 541-552,
Brink, A. D. B., Parridge, J. C. and Williams, A. A. 1992. Soil survey for Engineering,
Claredon, Oxford.
British Standards Institution 1975. BSI 1377 Methods of Testing Soils for Civil Engineering Purposes. pp 59 –
276.
British Standard Institution, BSI 1377; 1990. Methods of Testing for Soils for Civil Engineering purposes. London.
Casagrande, 1982: Classification and identification of soil, American society of civil Engineers, pp. 113-901.
Coker, J. O. 2015. Integration of geophysical and geotechnical methods to site characterization
for construction work at the School of Management Area, Lagos State Polytechnic, Ikorodu, Lagos, Nigeria.
International Journal of energy and Science and Engineering. Vol. 1, No. 2, pp. 40 – 48.
Federal Ministry of Works and Housing, Nigeria 1972. Highway Manual Part 1, Road Design, Federal Ministry
of Works and Housing, Lagos.
Federal Ministry of Works and Housing, Nigeria 1974. Specification for roads and bridges. 26p.
Federal Ministry of Works and Housing, Nigeria 1977. General specification for roads and bridges. Federal
Highway Department. Vol. II, pp. 145 – 284.
Federal Ministry of Works and Housing, Nigeria 1992. Highway road maintenance manual, part II.
Federal Ministry of Works and Housing, Nigeria 2000: Specification for roads and bridges. Vol. 2.
Folahan, P. I., Ipinmoroti, F. V.., Salami, M., Akinwale, K. J., Taiwo, A. T. And Adetunji, A. R. 2013: Application
of geophysical methods to building foundation studies. International Journal of Geosciences. Vol. 4, pp. 1256
– 1266.
Head, K. H. 1982. Manual of Soil Laboratory Testing, Vol. 1: Soil classification and Compaction Test, 2nd Edition,
John Wiley and Sons.
Idornigie A. I., Olorunfemi M. O. and Omitogun A. A. 2006. Integration of Remotely Sensed and Geophysical
Data Sets in Engineering Site Characterization in a Basement Complex Area of Southwestern Nigeria. Journal
Applied Sciences Research, 2 (9): pp. 541-552.
Jegede, G., 1994. Engineering Geotechnical significance of Superficial Deposits in Carrington Hill Area, Country
Conc, Ireland. Nig. Journal Sciences, Vol. 28, pp. 153 – 158.
Lambe, T. W. and Whitman, R. V. 1979. Methods of Estimating Settlement and Soil Mechanics, S. I Version,
John Wiley & Son. Journal on Mechanics and Foundation Division American Society of Civil Engineering.
Vol. 90, pp. 42.
Lagos State Emergency Management Agency (LASEMA), 2019.
Madedor, A. A. 1983. Pavement design guidelines and practise for different geological areas in Nigeria. In Ola, S.
A. (Eds): Tropical soils of Nigeria in engineering practice, A. A. Balkema (publishers) Rotter-dam,
Journal of Environment and Earth Science www.iiste.org
ISSN 2224-3216 (Paper) ISSN 2225-0948 (Online)
Vol.10, No.6, 2020
107
Netherland, pp. 291 – 298.
Ola, S. A., 1982. Settlement of two oil tanks on Kaduna lateritic soils in Nigeria. Q. J. Engineering Geology, Vol.
15, pp. 317 – 3245.
Oladunjoye, M. I., Babatunde, I. O. and Oshko, A. O. 2014. Integrated geophysical and geotechnical investigations
of a proposed dam site, southwestern Nigeria. RMZ – Materials and Geoenvironment. Vol. 61, pp. 257 – 267.
Olorunfemi M. O. 2000. Geoelectric and Electromagnetic investigation of failed Koza and Nasarawa Earth Dams
around Katsina, Northern Nigeria. Journal of Mining and Geology, Vol. 36(1), pp. 51-65
Osinowo, O. O., Akanji, A. O. and Akinmosin, A. 2011. Integrated geophysical and geotechnical investigation of
the failed portion of a road in basement Complex Terrain, southwest Nigeria. RMZ – Materials and
Geoenvironment. Vol. 58, No. 2, pp 143 – 162.
Owoyemi, F. B. 1996. A Geologic-Geophysical investigation of rain-induced erosional features in Akure
Metropolis. Unpubl. M. Tech. thesis, Federal University of Technology, Akure, pp. 11 – 18.
Parasnis, D. S. 1979. A numerical computation procedure for the direct interpretation of
geoelectrical soundings. Geophysical prospecting, 23: pp. 335 – 362.
Rahaman, M.A. 1988. Recent advances in the study of the basement complex of Nigeria. A publication of the
Geological Survey of Nigeria
Vander Velper, B. P. A. 2004. WinRESIST Version 1.0 Resistivity Depth Sounding Interpretation software. M.
Sc Research Project, ITC, Delft Netherland.