substance use in southern africa knowledge, attitudes ... · substance use in southern africa...
TRANSCRIPT

Substance Use in Southern Africa
Knowledge, Attitudes, Practices and Opportunities forIntervention
Summary of baseline assessments in the Republic of South Africa, theUnited Republic of Tanzania and the Republic of Zambia
WHO/UNDCP Global Initiative on Primary Prevention ofSubstance Abuse "Global Initiative"
World Health OrganizationMental Health: Evidence and ResearchDepartment of Mental Healthand Substance Dependence

WHO Library Cataloguing-in-Publication Data
WHO/UNDCP Global Initiative on Primary Prevention of Substance Abuse.Substance abuse in Southern Africa : knowledge, attitudes, practices and opportunities for intervention : summary ofbaseline assessments in South Africa, the United Republic of Tanzania and Zambia / WHO/UNDCP Global Initiativeon Primary Prevention of Substance Abuse.
1.Substance abuse - prevention and control 2.Substance-related disorders -prevention and control 3.Smoking - prevention and control 4.Alcohol drinking -prevention and control 5.Psychotropic drugs 6.Knowledge, attitudes,practice 7. Africa, Southern.
ISBN 92 4 159058 0 (NLM classification: WM 270)
© World Health Organization 2003
All rights reserved. Publications of the World Health Organization can be obtained from Marketing andDissemination, World Health Organization, 20 Avenue Appia, 1211 Geneva 27, Switzerland (tel: +41 22 791 2476;fax: +41 22 791 4857; email: [email protected]). Requests for permission to reproduce or translate WHOpublications – whether for sale or for non-commercial distribution – should be addressed to Publications, at the aboveaddress (fax: +41 22 791 4806; email: [email protected]).
The designations employed and the presentation of the material in this publication do not imply the expression of anyopinion whatsoever on the part of the World Health Organization concerning the legal status of any country, territory,city or area or of its authorities, or concerning the delimitation of its frontiers or boundaries. Dotted lines on mapsrepresent approximate border lines for which there may not yet be full agreement.
The mention of specific companies or of certain manufacturers’ products does not imply that they are endorsed orrecommended by the World Health Organization in preference to others of a similar nature that are not mentioned.Errors and omissions excepted, the names of proprietary products are distinguished by initial capital letters.
The World Health Organization does not warrant that the information contained in this publication is complete andcorrect and shall not be liable for any damages incurred as a result of its use.
Printed in Switzerland.

iii
FOREWORD
Due to the rapid pace of change in the economic and social sphere and prevailing political instability inmany African countries, alcohol and other psychoactive substance use and related problems are becomingmajor public health concerns. Research indicates that substance use begins in youth, that it can beprevented and that various prevention programmes exist. However, there are gaps in knowledge about theapplicability of these programmes to the African context.
The World Health Organization African Regional Office (WHO/AFRO) is pleased to have threecountries in Southern Africa involved in the WHO/UNDCP Global Initiative on Primary Prevention ofSubstance Abuse. The initiative aims at developing model community-based projects. As an evidence-based approach to the implementation of projects at local level is essential, we opted for situationassessments to create information for use in prevention efforts.
This document summarizes the baseline assessments in the three countries that are participating inthe project. A local research institution conducted the assessment of the pre-intervention conditions ineach country. This baseline assessment will be compared with the post-intervention assessment in order toevaluate the effects of the interventions.
This publication points to the need for a comprehensive approach to primary prevention of substanceuse. It is also an important step towards documenting activities of the initiative in the three countriesinvolved. In addition it provides a sound empirical basis for policy and programme development in theparticipating countries.
It is hoped that this document will assist in raising awareness about not only substance use amongyouth, but also the importance of multilevel assessments of the local situation before interventions aredeveloped and implemented.
Dr Mohamed BelhocineDirector, Division of Non-Communicable DiseasesWHO Regional Office for Africa

iv
PREFACE
In 1997, the World Health Organization (WHO) and United Nations International Drug ControlProgramme (UNDCP) jointly initiated a project on the primary prevention of substance abuse amongyoung people with a view to mobilizing communities for prevention work and developing model projectsfor adaptation or replication wherever feasible. Problems related to substance use among young peopleare linked to and often precipitated by adverse socioeconomic factors. Thus, in many developingcountries prevention services are limited, in particular at the point of first contact with health careproviders. The major constraints are lack of trained personnel, lack of information on effective strategiesfor prevention and lack of successful programmes that can be replicated. To date, most information onprimary prevention projects and their cost effectiveness comes from developed countries. However, asthey have been devised for different cultural conditions, the effective interventions cannot adequately bereplicated in developing countries.
Through the WHO/UNDCP Global Initiative local partners in the Republic of South Africa, theUnited Republic of Tanzania and the Republic of Zambia are receiving support on planning andimplementing evidence-based prevention strategies. The foundation of good primary preventioninitiatives depends on a well thought out strategic project plan with monitoring and evaluationcomponents. The baseline assessments carried out by local research institutions at two sites in eachparticipating country provide reference points for impact assessments.
To permit easier access to information for a broad reader audience, only summaries of the findingsare presented. However, detailed research information can be obtained at the project web-site cited in thisdocument. It is my sincere hope that the information presented in this document can contribute towardsgreater awareness and a more efficient response to the problem of substance use among young people inAfrica.
Finally, this project prides itself in sound collaborative efforts among all key players, namely theGovernment of Norway (the funding agent), the WHO and UNDCP headquarters and regional andcountry offices, local research institutions, non-governmental organizations (NGOs) and other UnitedNations (UN) agencies.
Dr Shekhar SaxenaCoordinator, Mental Health: Evidence and ResearchWHO, Geneva, Switzerland

v
TABLE OF CONTENTS
ACKNOWLEDGEMENTS.....................................................................................................................xi
Section 1: BACKGROUND .................................................................................................................... 1
1.1 Introduction .............................................................................................................................. 2
1.2 Methodology of baseline assessments ..................................................................................... 2
1.2.1 Site selection ............................................................................................................................ 2
1.2.2 Research participants and variables studied............................................................................. 3
Section 2: REPUBLIC OF SOUTH AFRICA ....................................................................................... 5
2.1 Site description......................................................................................................................... 6
2.2 Demographic findings .............................................................................................................. 6
2.3 Knowledge, attitudes and practices.......................................................................................... 7
2.3.1 Substance use among adults..................................................................................................... 7
2.3.2 Substance use among youth ................................................................................................... 12
2.3.2 Substance use among youth ................................................................................................... 13
2.4 Community Profile 1: Organizational and cultural context ................................................... 22
2.5 Community Profile 2: Societal structures and processes ....................................................... 24
2.6 Intervention development....................................................................................................... 27
2.6.1 Key concerns.......................................................................................................................... 27
2.6.2 Intervention priorities............................................................................................................. 28
vi
Section 3: UNITED REPUBLIC OF TANZANIA.............................................................................. 29
3.1 Site description....................................................................................................................... 30
3.2 Demographic findings ............................................................................................................ 30
3.3 Knowledge, attitudes and practices........................................................................................ 31
3.3.1 Substance use among adults................................................................................................... 31
3.3.2 Substance use among youth ................................................................................................... 33
3.4 Community Profile 1: Organizational and cultural context ................................................... 41
3.5 Community Profile 2: Societal structures and processes ....................................................... 41
3.6 Intervention development....................................................................................................... 46
3.6.1 Key concerns.......................................................................................................................... 46
3.6.2 Intervention priorities............................................................................................................. 47
Section 4: REPUBLIC OF ZAMBIA ................................................................................................... 49
4.1 Site description....................................................................................................................... 50
4.2 Demographic findings ............................................................................................................ 50
4.3 Knowledge, attitudes and practices........................................................................................ 52
4.3.1 Substance use among youth ................................................................................................... 52
4.3.2 Substance use among adults................................................................................................... 58
4.4 Community Profile 1: Organizational/institutional and cultural context............................... 64
4.5 Community Profile 2: Societal structures and processes ....................................................... 65
4.6 Intervention development....................................................................................................... 68
4.6.1 Key concerns.......................................................................................................................... 68
4.6.2 Intervention priorities............................................................................................................. 69
Section 5: DISCUSSION AND CONCLUSION................................................................................... 71
Discussion ................................................................................................................................................ 72
Conclusion ................................................................................................................................................ 73
Bibliography.............................................................................................................................................. 74

vii
LIST OF TABLES
Section 2 REPUBLIC OF SOUTH AFRICATable 1: Demographic profile of participating sites (1996 census) ....................................................... 6Table 2: Demographic profiles of adult and youth KAP study participants .......................................... 7Table 3: Intense cigarette and alcohol use in the Adult KAP Survey .................................................... 8Table 4: Place of drinking in the Adult KAP Survey ............................................................................ 9Table 5: Consequences of substance use in the Adult KAP Survey ................................................... 10Table 6: Lifetime substance use by gender and age in the Youth KAP Survey................................... 13Table 7: Intense cigarette and alcohol use in the Youth KAP Survey ................................................. 13Table 8: Consequences of substance use in the Youth KAP Survey ................................................... 15Table 9 (a-b):Context of first/past 12 months’ use of selected substances and reasons for first
use in the Youth KAP Survey ...........................................................................................17-18Table 10: Community resources for the prevention of substance use-related problems........................ 23Table 11: Organized social units’ understanding of substance use........................................................ 25Table 12: Status of trade in substances .................................................................................................. 26
Section 3 UNITED REPUBLIC OF TANZANIATable 1: Demographic profiles of adult and youth KAP survey participants ...................................... 30Table 2: Context of first/past 12 months’ use of alcohol and tobacco and reasons for onset in the
Youth KAP Survey (N=303).................................................................................................. 36Table 3: Place and company for first/past 12 months’ use of alcohol and tobacco and
reasons for onset in the Youth KAP Survey (N=303)—Old Stone Town ............................. 37Table 4: Context of first/past 12 months’ use of other substances and reasons for onset
in the Youth KAP Survey (N=303)—Old Stone Town ......................................................... 38Table 5: Place and company of first/past 12 months’ use of other substances and reasons for onset
in the Youth KAP Survey (N=303)—Old Stone Town ......................................................... 39Table 6: Organized social units’ understanding of substance use........................................................ 42Table 7: Community resources for the prevention of substance use-related problems........................ 43Table 8: Status of trade in substances .................................................................................................. 45

viii
Section 4 REPUBLIC OF ZAMBIATable 1: Demographic profiles of adult and youth KAP study participants ........................................ 50Table 2: Use of tobacco and alcohol in the Youth KAP Survey (N=398) ........................................... 52Table 3: Use of cannabis, inhalants and painkillers in the Youth KAP Survey (N=398) .................... 54Table 4: Context of first/past 12 months’ use of substances and reasons for use among the youth .... 55Table 5: Consequences of substance use in the Youth KAP Survey (N=398)..................................... 57Table 6: View that it is very easy to obtain selected substances in the Adult KAP
Survey (N=150)...................................................................................................................... 61Table 7: Regular/heavy licit substance use and dependent drinking in the Adult KAP
Survey (N=150)...................................................................................................................... 64Table 8: Organized social units’ understanding of substance use ....................................................... 65Table 9: Retail alcohol and tobacco outlets ......................................................................................... 66Table 10: Amount (kilogram) of substances seized by Zambian police (1995-1997) .......................... 66Table 11: Broader societal context of substance use prevention—Zambian sites ................................. 67

ix
LIST OF FIGURES
Section 2 REPUBLIC OF SOUTH AFRICAFigure 1: Lifetime substance use in the Adult KAP Survey.................................................................... 8Figure 2: (Strong) approval of “heavy” smoking/drinking in the Adult KAP Survey .......................... 10Figure 3: Substance use entails no or a slight risk in the Adult KAP Survey ....................................... 11Figure 4: View that substances are (very) easy to obtain in the Adult KAP Survey............................. 12Figure 5: Psychoactive substance use in the Youth KAP Survey (Bela-Bela: N=109;
Greater Pretoria: N=193)........................................................................................................ 14Figure 6: Substance use among significant others in the Youth KAP Survey—Greater
Pretoria (N=193) .................................................................................................................... 16Figure 7: Substance use among significant others in the Youth KAP Survey—Bela-Bela (N=109).... 16Figure 8: (Strong) approval of youth substance use in the Youth KAP Survey.................................... 19Figure 9: Youth substance use viewed as no or a slight risk in the Youth KAP Survey....................... 20Figure 10: (Very) easy to obtain substances in the Youth KAP Survey.................................................. 21
Section 3 UNITED REPUBLIC OF TANZANIAFigure 1: Past 30 days’ substance use in the Adult KAP Survey (N=100) ........................................... 31Figure 2: Lifetime substance use in Old Stone Town Youth KAP Survey (N=303) ............................ 33Figure 3: Use of selected substances in the Old Stone Town Youth KAP Survey (N=303)................. 34Figure 4: Knowledge of someone using substances in the Old Stone Town Youth KAP
Survey (N=303)...................................................................................................................... 35Figure 5: View that substances are fairly or very easy to obtain in the Old Stone Town
Youth KAP Survey (N=303).................................................................................................. 40

x
Section 4 REPUBLIC OF ZAMBIAFigure 1: Respondents in the Youth KAP Survey (N=398) .................................................................. 51Figure 2: Respondents in the Adult KAP Survey (N=150) ................................................................... 51Figure 3: Substance use in the Youth KAP Survey (N=398) ................................................................ 53Figure 4: Substance use among significant others in the Youth KAP Survey (N=398)........................ 56Figure 5: Approval of youth substance use in the Youth KAP Survey (N=398) .................................. 57Figure 6: View that it is very easy to obtain substances in the Youth KAP Survey (N=398)............... 58Figure 7: Substance use in the Adult KAP Survey (N=150) ................................................................. 59Figure 8: Occasions of alcohol and cannabis use in the Adult/Youth KAP Survey (N=150)............... 60Figure 9: (Strong) approval of substance use in the Adult KAP Survey (N=150) ................................ 62Figure 10: View that substance use is a moderate or great risk in the Adult KAP Survey (N=150) ...... 63

xi
ACKNOWLEDGEMENTS
We gratefully acknowledge the contributions of the following persons and agencies for their respectiveroles in the preparation and implementation of the UNDCP/WHO Global Initiative’s baseline assessmentsin Southern Africa:• The Norwegian Government for funding the project.• Dr Olav Helge Angell for developing the methodology and providing technical support in the
implementation of the baseline assessments and reporting of the findings.• The principal investigators at institutions that conducted the baseline assessments and reviewed
drafts of the present report, namely Ms Lee Rocha-Silva, Centre for Alcohol and Drug-relatedResearch, Ms Gina Weir-Smith, Human Sciences Research Council and Ms Tertia van der Walt,Markdata, Pretoria, South Africa; Dr Phillimon Ndubani, Institute of Social and EconomicResearch, University of Zambia; and Dr Joseph Mbatia, Mental Health Resource Centre, Ministryof Health, United Republic of Tanzania.
• Contributions from the WHO Regional Office for Africa: Dr Mohamed Belhocine, Ms Tecla Butauand Dr Custódia Mandlhate, Division of Non-Communicable Disease, who assisted with the reviewof the baseline assessment framework and instruments and provided comments on early versions ofthe summary.
• The young people and adults who participated in the study.• Mrs Rosemary Westermeyer who provided administrative support.
SecretariatMrs Mwansa Nkowane WHO, GenevaDr Shekhar Saxena WHO, GenevaMs Giovanna Campello UNDCP, ViennaMs Tecla Butau WHO, AFRO
Text Mrs Mwansa NkowaneLayout and design: Ms Annemarie BooyensCopy-editing Ms Ina Stahmer
Contact address: Mrs Mwansa Nkowane, Department of Mental Health and Substance Dependence, World HealthOrganization, Avenue Appia 20, CH-1211 Geneva 27, SwitzerlandTel: +41 22 791 4314; Fax: +41 22 791 4160Project website: http://www.who.int/substance_abuse/UNDCP_WHO_initiative


Section 1
BACKGROUND
Section 1
2
1.1 Introduction
The Global Initiative on Primary Prevention of Substance Abuse (Global Initiative) is a project jointlyexecuted by the United Nations International Drug Control Programme (UNDCP) and the World HealthOrganization (WHO). Implementation commenced in June 1997 and will be concluded at the end of2003. The Global Initiative aims to prevent the use of psychoactive substances by young people. Theproject is implemented in selected communities in eight countries in three regions of the world whererapid/dramatic social change is in progress. The regions are Southern Africa, Southeast Asia and Centraland Eastern Europe. Prevention activities of the project are based on the mobilization of localcommunities. The project comprises five sets of interrelated activities: (1) baseline assessment; (2)training of local partners; (3) public health interventions; (4) monitoring of activities; and (5) post-intervention assessment. Local partners are involved in these activities with a view to motivating them tomobilize their communities to respond to substance use among young people. The evaluation of theactivities will lead to the identification of best practices that can be adopted by other communities whowish to address the problem of substance use among the youth. The terms “psychoactive substance use”and “substance use” are used interchangeably in this report. The World Health Organization defines apsychoactive substance as any substance that, when taken by a person, modifies perception, mood,cognition, behaviour or motor functions and includes illicit and licit substances, whether or not their usebrings about dependence problems in the individual, and whether or not people consider them harmful.
This report provides a summary of the baseline research findings of 2001 extracted from the reportson South Africa, the United Republic of Tanzania and Zambia respectively and the integrated regionalreport compiled by Ms Lee Rocha-Silva. The report also presents interventions proposed by each of thecountries. This information provides a basis for determining the effectiveness of interventions adopted bylocal partners in participating sites at the conclusion of the Global Initiative.
1.2 Methodology of baseline assessments
1.2.1 Site selectionTwo sites were selected in each participating country. They had to be neither too small nor too big and ithad to be possible to define them in such a way that they would have formally demarcated geographicalboundaries and substance use problems, urban/rural location and viable community structures for carryingout primary prevention activities. Key issues investigated included extent of substance use among youngpeople, socioeconomic status, feasibility of primary prevention, ethnicity and population growth/change.Although only two intervention sites per country were selected for baseline assessments, primaryprevention activities are taking place in several other sites in each of the selected countries. The two sitesprovide a basis for a systematic comparison of the situation once prevention activities have beencompleted.
Background
3
1.2.2 Research participants and variables studied
The baseline assessments covered three main areas:
1) Community Profile 1 provided information on community commitment to the issue of substanceuse with special emphasis on young people. Variables studied included level of understanding,attitudes, norms, community situation assessment, ongoing intervention projects, programmes andnetworks.
2) Community Profile 2 provided information on aspects of the community and wider societal contextsthat are relevant to the intervention. Values included legal, economic, political, health, social anddemographic factors.
3) Youth (10-21 years) and adult knowledge, attitudes and practices (KAP) studies provided insight onsubstance use among the youth and adults at the community level.
Information was collected by means of a review of secondary data (bibliography-p74), focus groupdiscussions, key informant interviews and surveys that used an interview-administered structuredquestionnaire (the KAP studies). Basic descriptive analyses of data were performed using frequencydistributions. Key findings from focus group discussions were summarized and data from secondarysources was also collated and tabulated.

Section 1
4
Section 2
REPUBLIC OF SOUTH AFRICA

Section 2
6
2.1 Site description
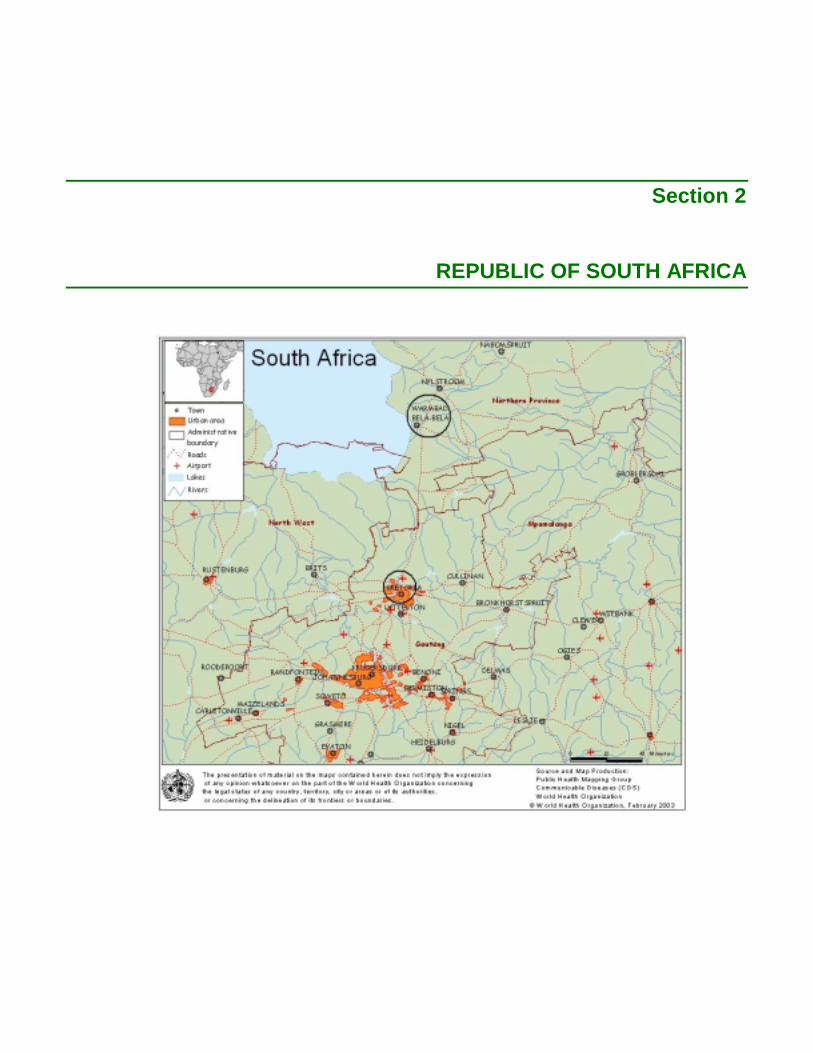
Greater Pretoria (urban) and Bela-Bela (rural) were the sites selected for the baseline assessment in SouthAfrica. Greater Pretoria is in the Gauteng Province, 60 km north of the provincial capital Johannesburg.Bela-Bela is in Warmbaths, a rural town in the Limpopo Province, and is about 100 km from GreaterPretoria. The demographic profiles of the two sites are presented in Table 1.
2.2 Demographic findings
Table 1: Demographic profile of participating sites (1996 census)
Variable Greater Pretoria Bela-Bela
Total population ................................................................ 1 243 590 ..................................................23 537Population density (persons per km2).......................................... 448 ....................................................5 768Sex distribution1. Male ....................................................................................50%.................................................. 48.0%2. Female ................................................................................50%.................................................. 52.0%Population distribution1. 0-9 years ..........................................................................18.0%.................................................. 24.8%2. 10-14 years ........................................................................8.0%.................................................. 12.2%3. 15-64 years ......................................................................69.0%.................................................. 59.0%4. 64+.....................................................................................5.0%.................................................... 4.0%Mean age ...........................................................................33.1 years ............................................ 29.2 years
Except for the high population density and a larger population under 15 years of age (37 % in Bela-Belacompared to 26% in Pretoria), the urban and the rural demographic profiles were similar.
The key demographic characteristics of the adult and youth KAP survey participants are presented inTable 2. Religion, religious affiliation, employment status among adults and school attendance by theyouth were similar for the urban and the rural sites, although the proportion of adults with more than eightyears of formal education was higher among the urban than the rural subjects (94% versus 85%). Themajority of the respondents in both samples lived in households with at least a female parent. Additionaladults household members were the exception in the rural sample but quite common in the urban sample.The occurrence of youth living on their own, though rare in both samples, was more common in the urbansample.

Republic of South Africa
7
Table 2: Demographic profiles of adult and youth KAP study participants
Variable Bela-Bela Greater PretoriaAdult (N=33) Youth (N=109) Adult (N=67) Youth (N=193)
Sex distribution1. Male ....................................................... 30.0%....................41.0%........................45.0 %.............. 51.0%2. Female ................................................... 70.0%....................59.0%.........................55.0%.............. 49.0%Religious affiliation ...................................... 97.0%....................98.0%.......................100.0%.............. 94.0%Religion considered important ...................... 85.0%....................86.0%.........................92.0%.............. 88.0%Employment/school attendanceFull time ........................................................ 42.0%....................86.0%.........................45.0%.............. 89.0%Part time ........................................................ 12.0%......................6.0%.........................19.0%................ 2.0%Unemployed/not a student............................. 46.0%......................8.0%.........................36.0%................ 9.0%Years of formal education0-7 years ........................................................ 15.0%....................43.0%...........................6.0%.............. 34.0%8+ years ......................................................... 85.0%....................57.0%.........................94.0%.............. 66.0%Mean age ................................................29.5 years..............14.9 years...................36.2 years………..15.6 years
2.3 Knowledge, attitudes and practices
2.3.1 Substance use among adults
(a) Lifetime use of substances
Figure 1 presents the lifetime use of substances among the adults in the survey. Apart from lifetime use ofcannabis and painkillers, which was similar for the urban and the rural adults, for all other substances, theurban subjects reported two to three times more lifetime use than their rural counterparts.
(b) Current use of substances among adult survey participants
The intensity of cigarette and alcohol use among the adult survey respondents is presented in Table 3. Ingeneral, current use (past 12 month’s use) was twice more common among the urban than the ruralsubjects for both cigarettes and alcohol. The proportion of smokers who used at least five cigarettes a daywas significantly higher among the urban respondents (12% versus 6%). Alcohol dependence wasexperienced more frequently by adult users. The places where alcohol was consumed were similar for theurban and rural areas (Table 4).

Section 2
8
Table 3: Intense cigarette and alcohol use in the Adult KAP Survey
Type of use Bela-Bela (%) Greater Pretoria (%)
CigarettesPast 12 months’ users............................................................... 15.0 ..............................................25.4Past 12 months’ (almost) daily use ............................................ 12.0 ..............................................16.0Past 12 months’ use of at least 5 cigarettes a day ........................ 6.0 ..............................................12.0AlcoholPast 12 months’ users............................................................... 33.0 ..............................................67.0Past 12 months’ (almost) daily use .............................................. 6.0 ................................................4.0Past two weeks’ intake of 5 or more drinks in a row ................ 18.0 ..............................................34.0Past 12 months’ experiences of dependence
Drinking-related neglect of responsibilities .......................... 3.0 ..............................................13.0Early morning drinking ........................................................... 3.0 ..............................................10.0Feelings of remorse/guilt after drinking.................................. 3.0 ..............................................10.0Memory lapse after drinking ................................................... 3.0 ..............................................10.0Inability to stop after first drink .............................................. 6.0 ................................................7.0
Total (N) ....................................................................................... 33 .................................................67
Figure 1: Lifetime substance use in the Adult KAP Survey (%)
21
27
24
9
12
18
9
12
12
7090
52
72
78
70
64
63
34
27
16
0 10 20 30 40 50 60 70 80 90 100
Cannabis
Sedatives
Tranquillizers
Homebrew
Cider
Hard liquor
Wine
Malt beer
Cigarettes
Painkillers
Bela-Bela Site (N=33) Greater Pretoria Site (N=67)

Republic of South Africa
9
Table 4: Place of drinking in the Adult KAP Survey
Place where alcohol is normally taken Bela-Bela Greater Pretoria% Total N % Total N
AdultsReligious festivals .........................................................................79.0 .............26 .................... 100.0............. 38Other public festivals...................................................................100.0 .............33 .................... 100.0............. 60Sport events .................................................................................100.0 .............33 ...................... 98.0............. 59Weddings.....................................................................................100.0 .............33 .................... 100.0............. 64Funerals .........................................................................................94.0 .............31 ...................... 98.0............. 41Weekends ....................................................................................100.0 .............33 .................... 100.0............. 63Parties ..........................................................................................100.0 .............33 .................... 100.0............. 65At work..........................................................................................93.0 .............30 ...................... 91.0............. 33With visitors ..................................................................................97.0 .............32 .................... 100.0............. 61YouthReligious festivals .........................................................................88.0 .............29 ...................... 94.0............. 38Public festivals ............................................................................100.0 .............33 .................... 100.0............. 60Sport events .................................................................................100.0 .............33 ...................... 98.0............. 57Weddings.....................................................................................100.0 .............33 ...................... 98.0............. 61Funerals .........................................................................................94.0 .............31 .................... 100.0............. 34Weekends ....................................................................................100.0 .............33 .................... 100.0............. 61Parties ..........................................................................................100.0 .............33 .................... 100.0............. 64At work..........................................................................................82.0 .............27 ...................... 96.0............. 26With visitors ..................................................................................91.0 .............30 .................... 100.0............. 50
(c) Attitudes towards substance use among adults
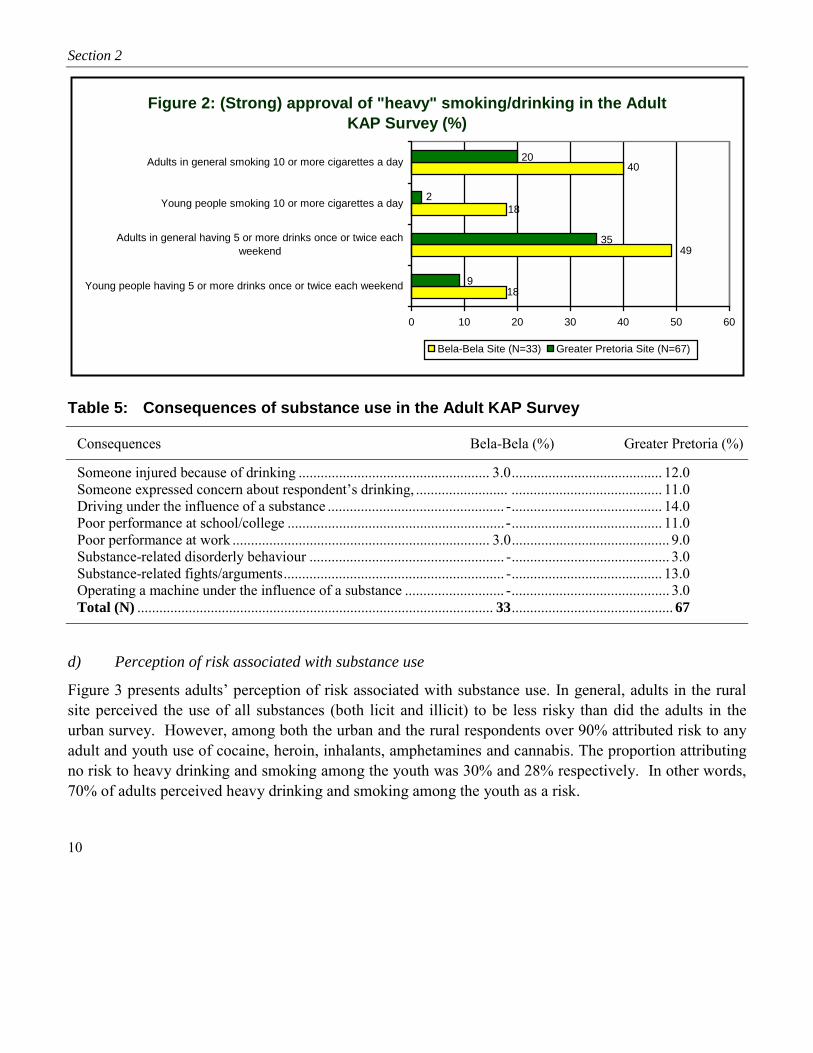
The attitudes towards substance use among the survey respondents are presented in Figure 2. Overall, therural adult respondents were more tolerant of heavy drinking and smoking than their urban counterparts.In addition, rural adults were more tolerant of young people smoking (18% versus 2%) and drinking (18%versus 9%) than their urban counterparts. The adverse consequences of substance use are presented inTable 5. These consequences occurred more among urban respondents.
Section 2
10
Table 5: Consequences of substance use in the Adult KAP Survey
Consequences Bela-Bela (%) Greater Pretoria (%)
Someone injured because of drinking .................................................... 3.0......................................... 12.0Someone expressed concern about respondent’s drinking, ......................... ......................................... 11.0Driving under the influence of a substance ................................................ -......................................... 14.0Poor performance at school/college ...........................................................-......................................... 11.0Poor performance at work ...................................................................... 3.0........................................... 9.0Substance-related disorderly behaviour ..................................................... -........................................... 3.0Substance-related fights/arguments............................................................ -......................................... 13.0Operating a machine under the influence of a substance ........................... -........................................... 3.0Total (N) ................................................................................................. 33............................................ 67
d) Perception of risk associated with substance use
Figure 3 presents adults’ perception of risk associated with substance use. In general, adults in the ruralsite perceived the use of all substances (both licit and illicit) to be less risky than did the adults in theurban survey. However, among both the urban and the rural respondents over 90% attributed risk to anyadult and youth use of cocaine, heroin, inhalants, amphetamines and cannabis. The proportion attributingno risk to heavy drinking and smoking among the youth was 30% and 28% respectively. In other words,70% of adults perceived heavy drinking and smoking among the youth as a risk.
Figure 2: (Strong) approval of "heavy" smoking/drinking in the Adult KAP Survey (%)
40
18
49
18
20
2
35
9
0 10 20 30 40 50 60
Young people having 5 or more drinks once or twice each weekend
Adults in general having 5 or more drinks once or twice eachweekend
Young people smoking 10 or more cigarettes a day
Adults in general smoking 10 or more cigarettes a day
Bela-Bela Site (N=33) Greater Pretoria Site (N=67)

Republic of South Africa
11
Figure 3: Substance use entails no or a slight risk in the Adult KAP Survey (%)
55
45
28
21
12
15
9
6
49
30
33
9
3
3
6
3
3
9
15
1
9
3
9
1
44
10
26
3
2
0 10 20 30 40 50 60
Adults taking mandrax once or twice
Adults taking inhalants once or twice
Adults taking heroin occasionally
Adults taking amphetamines occasionally
Youth taking amphetamines once or twice
Adults taking amphetamines once or twice
Youth taking 5 or more drinks each weekend
Adults taking 5 or more drinks each weekend
Youth taking 1-2 drinks several times a week
Adults taking 1-2 drinks several times a week
Adults taking cocaine occasionally
Youth taking cannabis regularly
Adults taking cannabis regularly
Youth taking cannabis occasionally
Adults taking cannabis occasionally
Youth smoking 10 or more cigarettes per day
Adults smoking 10 or more cigarettes per day
Bela-Bela (N=33) Greater Pretoria (N=67)
Section 2
12
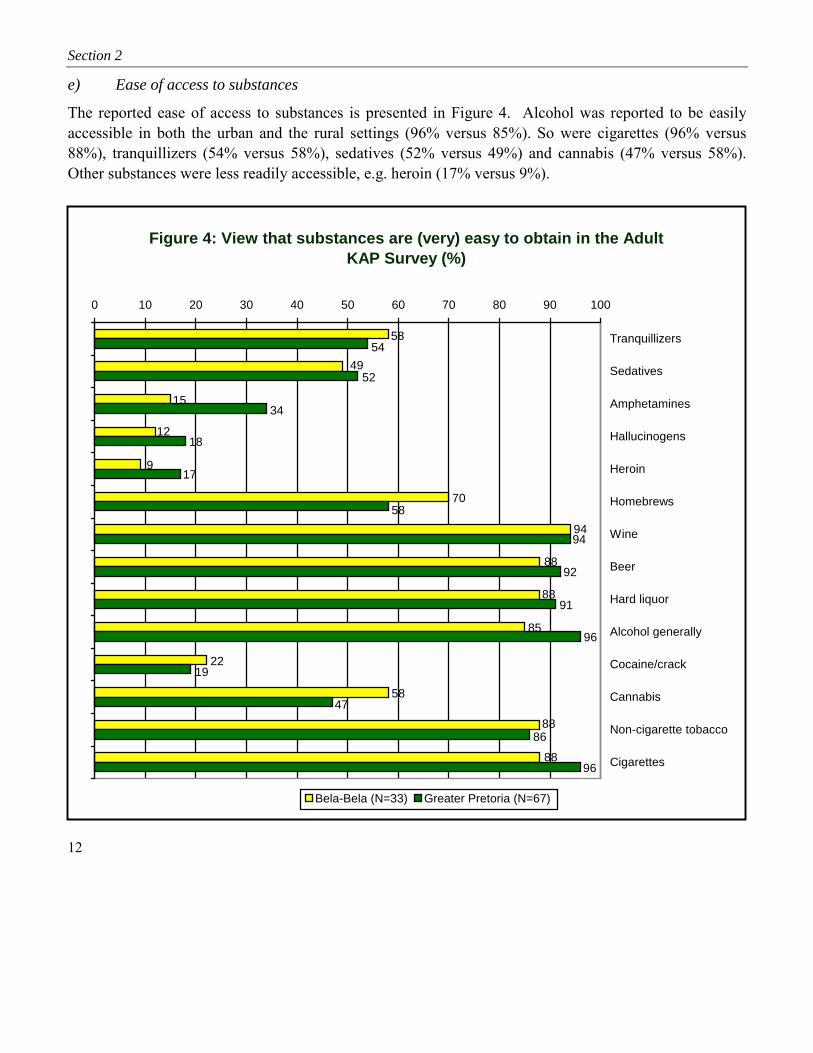
e) Ease of access to substances
The reported ease of access to substances is presented in Figure 4. Alcohol was reported to be easilyaccessible in both the urban and the rural settings (96% versus 85%). So were cigarettes (96% versus88%), tranquillizers (54% versus 58%), sedatives (52% versus 49%) and cannabis (47% versus 58%).Other substances were less readily accessible, e.g. heroin (17% versus 9%).
Figure 4: View that substances are (very) easy to obtain in the Adult KAP Survey (%)
88
88
88
58
22
85
88
94
70
9
49
12
15
58
94
96
86
47
19
96
91
92
58
17
18
34
52
54
0 10 20 30 40 50 60 70 80 90 100
Tranquillizers
Sedatives
Amphetamines
Hallucinogens
Heroin
Homebrews
Wine
Beer
Hard liquor
Alcohol generally
Cocaine/crack
Cannabis
Non-cigarette tobacco
Cigarettes
Bela-Bela (N=33) Greater Pretoria (N=67)

Republic of South Africa
13
2.3.2 Substance use among youth
(a) Lifetime and current use of substances
Table 6 shows lifetime use of substances among the youth. Reported lifetime use of cannabis andpainkillers was similar for the urban and rural youth. Use of snuff and homebrew was common amongrural female youth. For all other substances, prevalence of use was higher among the urban youth.However, for current use, daily use of cigarettes was 79% in the rural site compared to 13% in the urbansite, while weekly use was similar in the two sites (9% each) (Table 7). Use of sedatives was higheramong the urban youth (Figure 5).
Table 6: Lifetime substance use by gender and age in the Youth KAP SurveyBela-Bela Greater Pretoria
Substance Male(%)
Female(%)
10-14years(%)
15-19years(%)
20-21years(%)
TotalN
Male(%)
Female(%)
10-14years(%)
15-19years(%)
20-21years(%)
TotalN
Cigarettes .............71 .........29 .........29 ............57 .........14 .........14 .........63 ............37 .........18 .........63 .........19 ............62Snuff ....................20 .........80 .........20 ............60 .........20 .........10 .........43 ............57 .........26 .........48 .........26 ............23Hard liquor...........71 .........29 .........29 ............57 .........14 ...........7 .........62 ............38 .........16 .........57 .........27 ............60Beer......................60 .........40 .........20 ............40 .........40 ...........5 .........63 ............37 .........28 .........54 .........18 ............65Cider ....................37 .........63 .........21 ............58 .........21 .........19 .........51 ............49 .........27 .........51 .........22 ..........103Wine.....................43 .........57 .........29 ............57 .........14 ...........7 .........49 ............51 .........29 .........52 .........19 ............98Homebrew............20 .........80 .........40 ............40 .........20 ...........5 .........61 ............39 .........32 .........39 .........29 ............41Cannabis ..............82 .........18 .........18 ............64 .........18 .........11 .........71 ............29 .........10 .........57 .........33 ............21Cocaine .................. - ........... - ........... - .............. - ........... - ........... - .......100 .............. - ........... - .........33 .........67 ..............3Heroin .................... - ........... - ........... - .............. - ........... - ........... - .......100 .............. - ........... - .........50 .........50 ..............2Ecstasy ................... - ........... - ........... - ..........100 ........... - .........10 .........40 ............60 .........20 .........60 .........20 ..............5Tranquillizers .......67 .........33 .........33 ............67 ........... - ...........3 .........35 ............65 .........35 .........59 ...........6 ............17Sedatives ..............57 .........43 .........29 ............57 .........14 ...........7 .........55 ............45 .........18 .........41 .........41 ............22Painkillers ............37 .........63 .........43 ............43 .........14 .........76 .........47 ............53 .........38 .........45 .........17 ..........156
Table 7: Intense cigarette and alcohol use in the Youth KAP Survey
Type of use Bela-Bela Greater Pretoria% Total N % Total N
CigarettesPast 12 months’ (almost) daily use ...............................................79.0 ...........109 ...................... 13.0........... 193Past 12 months’ use of at least 5 cigarettes a day ...........................5.0 ...........109 ........................ 9.0........... 193AlcoholPast 12 months’ weekly use ...........................................................9.0 ...........108 ........................ 9.0........... 193Past two weeks’ intake of 5 or more drinks in a row .....................9.0 ...........109 ...................... 14.0........... 193

Section 2
14
Figure 5: Psychoactive substance use in the Youth KAP Survey (Bela-Bela: N=109; Greater Pretoria: N193)-(%)
0 10 20 30 40 50 60 70 80 90
Tobacco generally
Cigarettes
Snuff
Alcohol generally
Hard liquor
Beer
Cider
Wine
Homebrew
Cannabis
Heroin
Hallucinogens
Amphetamines
Cocaine
Ecstasy
Mandrax
Mandrax-cannabis mix
Injection use
Inhalants
Painkillers
Tranquillizers
Sedatives
Bela-Bela: Lifetime Bela-Bela: Past 12 months Bela-Bela: Past 30 daysGreater Pretoria: Lifetime Greater Pretoria: Past 12 months Greater Pretoria: Past 30 days

Republic of South Africa
15
b) Experiences, context and attitudes towards substance use among the youth
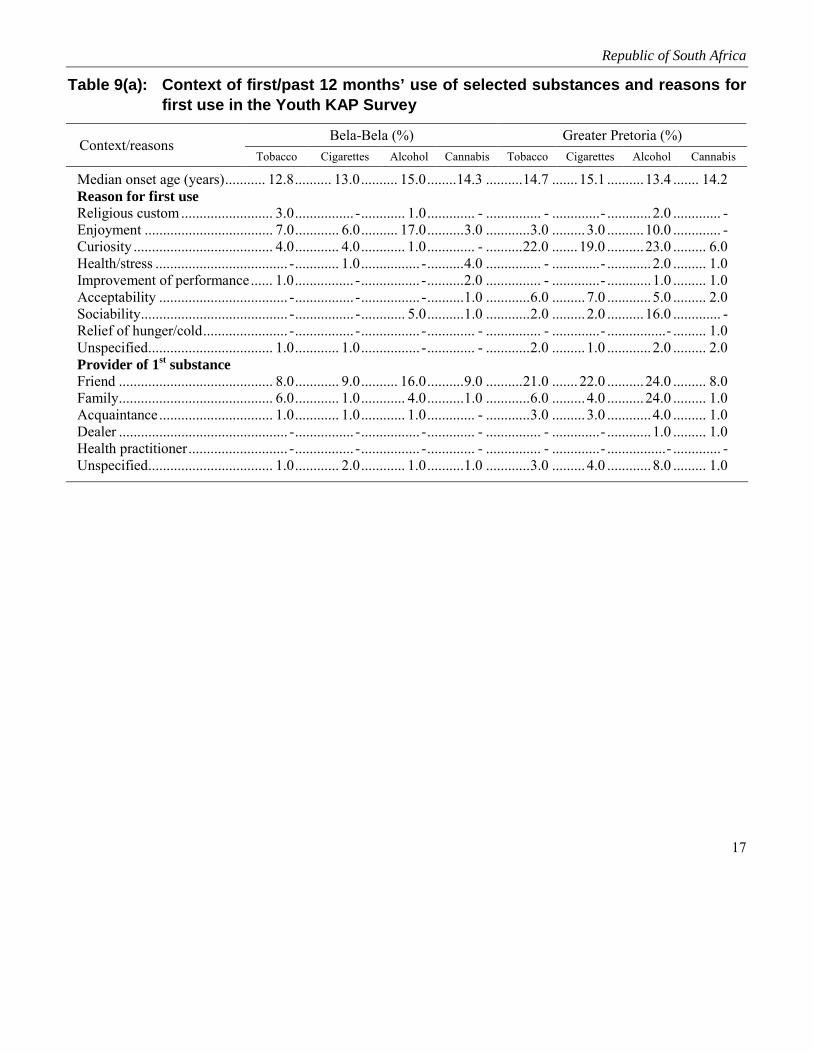
The urban youth reported a higher proportion of untoward experiences with substance use than their ruralcounterparts. In particular, 72% of the urban youth reported experiencing poor performance of workcompared to 1% among the rural subjects; resulting injury was four times higher among the urban youth(9% versus 2%) (Table 8). Figures 6 and 7 show that the use of substances was facilitated by significantothers, especially in the urban site. Tables 9a and 9b present the context of substance use. The onset oftobacco, alcohol and cannabis use tended to occur between 10 and 14 years, with first use often takingplace at home or a friend’s home. The median onset age was slightly lower in the rural setting.Enjoyment and stress relief tended to encourage first use in the rural site while in the urban site themotivators were sociability, enjoyment and acceptance.
Table 8: Consequences of substance use in the Youth KAP Survey
Consequences Bela-Bela Greater Pretoria% Total N % Total N
Past 12 months’ experiences of dependenceDrinking-related neglect of responsibilities ....................................6.0 ............. 109....................4.0 ............. 193Early morning drinking ...................................................................6.0 ............. 109....................4.0 ............. 193Feelings of remorse/guilt after drinking ..........................................5.0 ............. 109..................14.0 ............. 193Memory lapse after drinking ...........................................................5.0 ............. 109........................- .................. -Inability to stop after first drink ......................................................5.0 ............. 109....................7.0 ............. 193Someone injured because of drinking .............................................2.0 ............. 108....................9.0 ............. 193Someone expressed concern about respondent’s drinking,and/or suggested cutting down ........................................................4.0 ............. 108....................7.0 ............. 193Driving under the influence of a substance .....................................2.0 ............. 109....................3.0 ............. 193Poor performance at school/college ................................................3.0 ............. 109....................4.0 ............. 193Poor performance at work ...............................................................1.0 ............. 109..................72.0 ............. 193Substance-related disorderly behaviour ............................................. - ............. 109....................1.0 ............. 193Substance-related fights/arguments.................................................... - ............. 109....................3.0 ............. 193Operated a machine under the influence of a substance..................2.0 ............. 109....................1.0 ............. 193

Section 2
16
Figure 6: Substance use among significant others in the Youth KAP Survey—Greater Pretoria (N=193)-(%)
25
51
31222222
117
3627
64
211
8
50
6
47
361
5
149
28
11133
17
0
10
20
3040
50
60
70
Cigaret-tes
Non-cigarettetobacco
Canna-bis
Mandrax Hallu-cinogens
Ampheta-mines
SedativesTranquilli-zers
Cocaine Heroin Inhalants Alcohol Drunk atleast
once aweekClosest friend (Step) father (Step) mother Older siblings
Figure 7: Substance use among significant others in the Youth KAP Survey—Bela-Bela (N=109)-(%)
19
25
66
11
67
31
1516
431
8
21
67
33
12
6
16
24
224
9
21
0
10
20
30
40
Cigaret-tes Non-cigarettetobacco
Cannabis Mandrax Hallu-cinogens
Ampheta-mines
Sedatives Tranquilli-zers
Cocaine Heroin Inhalants Alcohol Drunk atleast once
a weekClosest friend (Step) father (Step) mother Older siblings
Republic of South Africa
17
Table 9(a): Context of first/past 12 months’ use of selected substances and reasons forfirst use in the Youth KAP Survey
Bela-Bela (%) Greater Pretoria (%)Context/reasons
Tobacco Cigarettes Alcohol Cannabis Tobacco Cigarettes Alcohol Cannabis
Median onset age (years)........... 12.8.......... 13.0.......... 15.0........14.3 ..........14.7 ....... 15.1 ..........13.4 ....... 14.2Reason for first useReligious custom......................... 3.0................ -............ 1.0............. - ............... - .............- ............2.0 ............. -Enjoyment ................................... 7.0............ 6.0.......... 17.0..........3.0 ............3.0 ......... 3.0 ..........10.0 ............. -Curiosity ...................................... 4.0............ 4.0............ 1.0............. - ..........22.0 ....... 19.0 ..........23.0 ......... 6.0Health/stress .................................... -............ 1.0................ -..........4.0 ............... - .............- ............2.0 ......... 1.0Improvement of performance...... 1.0................ -................ -..........2.0 ............... - .............- ............1.0 ......... 1.0Acceptability ................................... -................ -................ -..........1.0 ............6.0 ......... 7.0 ............5.0 ......... 2.0Sociability........................................ -................ -............ 5.0..........1.0 ............2.0 ......... 2.0 ..........16.0 ............. -Relief of hunger/cold....................... -................ -................ -............. - ............... - .............- ................- ......... 1.0Unspecified.................................. 1.0............ 1.0................ -............. - ............2.0 ......... 1.0 ............2.0 ......... 2.0Provider of 1st substanceFriend .......................................... 8.0............ 9.0.......... 16.0..........9.0 ..........21.0 ....... 22.0 ..........24.0 ......... 8.0Family.......................................... 6.0............ 1.0............ 4.0..........1.0 ............6.0 ......... 4.0 ..........24.0 ......... 1.0Acquaintance............................... 1.0............ 1.0............ 1.0............. - ............3.0 ......... 3.0 ............4.0 ......... 1.0Dealer .............................................. -................ -................ -............. - ............... - .............- ............1.0 ......... 1.0Health practitioner........................... -................ -................ -............. - ............... - .............- ................- ............. -Unspecified.................................. 1.0............ 2.0............ 1.0..........1.0 ............3.0 ......... 4.0 ............8.0 ......... 1.0

Section 2
18
Table 9(b): Context of first/past 12 months’ use of selected substances and reasons forfirst use in the Youth KAP Survey
Bela-Bela (%) Greater Pretoria (%)Context/reasons
Tobacco Cigarettes Alcohol Cannabis Tobacco Cigarettes Alcohol Cannabis
Place of 1st substance useFriend’s home.............................. 7.0..........6.0 ..........12.0 .......... …............ 8.0 ............ 7.0 ..........10.0 .......... …Family home................................ 5.0..........1.0 ............6.0 .......... …............ 8.0 ............ 6.0 ..........34.0 .......... …Public place ..................................... -............. - ............2.0 .......... …............ 3.0 ............ 3.0 ..........10.0 .......... …School/workplace ........................ 2.0..........4.0 ............2.0 .......... …............ 8.0 .......... 10.0 ............3.0 .......... …Open/street/bush/bridge............... 2.0..........2.0 ............2.0 .......... …............ 6.0 ............ 6.0 ............1.0 .......... …Other................................................ -............. - ............... - .......... …................- ................- ............2.0 .......... …Past 12 months: place of useFriend’s home.............................. 2.0..........4.0 ..........12.0 ......... 3.0 ............ 5.0 ............ 7.0 ............8.0 ............. -Family home................................ 3.0..........2.0 ............3.0 ......... 1.0 ............ 8.0 ............ 7.0 ..........19.0 ......... 1.0Public place ..................................... -............. - ............4.0 ......... 1.0 ................- ............ 2.0 ..........18.0 ......... 2.0School/work .................................... -..........1.0 ............... - .............- ............ 2.0 ............ 2.0 ............1.0 ............. -Open/street/bush/bridge............... 2.0..........1.0 ............... - ......... 2.0 ............ 4.0 ............ 3.0 ............2.0 ......... 3.0“Everywhere” .................................. -............. - ............... - .............- ................- ................- ................- ............. -Other places..................................... -............. - ............... - .............- ............ 1.0 ............ 1.0 ............2.0 ......... 2.0Past 12 months’ use: companyFriends......................................... 5.0..........6.0 ..........17.0 ......... 7.0 .......... 16.0 .......... 17.0 ..........31.0 ......... 5.0Acquaintances ................................. -............. - ............... - .............- ................- ................- ............2.0 ............. -Family.......................................... 1.0............. - ............2.0 .............- ............ 1.0 ............ 1.0 ..........15.0 ............. -Work/school mates .......................... -..........1.0 ............... - .............- ............ 1.0 ............ 1.0 ............2.0 ............. -Other................................................ -............. - ............... - .............- ............ 1.0 ................- ............1.0 ......... 1.0Alone ........................................... 1.0..........2.0 ............... - .............- ............ 3.0 ............ 3.0 ............1.0 ......... 1.0Total N ....................................... 109.........109 ...........109 ........ 109 ...........193 ...........193 ...........193 ........ 193
c) Attitudes towards substance use
Figure 8 presents the youth’s attitude towards substance use. Less than 5% approved the use of substancessuch as hallucinogens, heroin, mandrax and amphetamines. However, approval for weekend drinkingwas about the same (25% and 23%) among the urban and the rural youth; for regular drinking it washigher for the urban youth (33% versus 17%). The extent of approval for regular use of cannabis wasalso quite similar (8% and 9%) in the two sites, while occasional use of cannabis was more tolerated bythe rural youth than the urban youth (15% versus 8%). A similar pattern was observed for heavy smoking(23% versus 11%).

Republic of South Africa
19
Figure 8: (Strong) approval of youth substance use in the Youth KAP Survey (%)
4
23
15
8
1
2
17
23
1
1
1
2
1
1
2
11
8
9
1
33
25
3
2
1
0 5 10 15 20 25 30 35
Taking hallucinogens occasionally
Taking hallucinogens once or twice
Taking mandrax occasionally
Taking mandrax once or twice
Taking heroin occasionally
Taking heroin once or twice
Taking amphetamines occasionally
Taking amphetamines once or twice
Taking 5 or more drinks each weekend
Taking 1-2 drinks several times a week
Taking cocaine occasionally
Taking cocaine once or twice
Taking cannabis regularly
Taking cannabis occasionally
Taking 10 or more cigarettes a day
Bela-Bela (N=109) Greater Pretoria (N=193)
d) Perception of risk of substance use
Figure 9 presents the perception of risk of substance use. Among both the urban and the rural youth, over90% attributed risk to use of hallucinogens, mandrax, inhalants, heroin, cocaine and amphetamines.However, among the rural youth, occasional use and regular use of cannabis were perceived to be riskyby 20% and 15% of the respondents. Only 35% of the urban and 26% of the rural youth consideredalcohol use to be risky. Heavy cigarette use was considered risky more by the urban youth than the ruralyouth (30% versus 4%).

Section 2
20
Figure 9: Youth substance use viewed as no or a slight risk in the Youth KAP Survey (%)
3
15
20
30
4
5
26
34
5
3
3
4
3
3
2
3
3
1
4
7
2
3
1
35
21
4
1
1
4
1
1
5
1
0 5 10 15 20 25 30 35 40 45 50
Taking hallucinogens occasionally
Taking halucinogens once or twice
Taking mandrax occasionally
Taking mandrax once or twice
Taking inhalants occasionally
Taking inhalants once or twice
Taking heroin occasionally
Taking heroin once or twice
Taking amphetamines occasionally
Taking amphetamines once or twice
Taking 5 or more drinks each weekend
Taking 1-2 drinks several times a week
Taking cocaine occasioally
Taking cocaine once or twice
Taking cannabis regularly
Taking cannabis occasionally
Taking 10 or more cigarettes a day
Bela-Bela (N=109) Greater Pretoria (N=193)

Republic of South Africa
21
e) Ease of access to substances as perceived by the youth
The perceived ease of access to substances is presented in Figure 10. Among both the urban and the ruralyouth, painkillers were perceived to be the most easily accessible substance (94% and 87%), followed bysedatives (51% and 47%) and tranquillizers (39% and 45%). Alcohol and tobacco were perceived to beeasy to obtain by 70% to 90% of the respondents. However, a larger percentage of the urban than the ruralyouth perceived cocaine, hallucinogens, heroin and mandrax to be easy to obtain, but less than 10% of therural youth reported ease of access for the rural youth. Cannabis was reported to be easy to obtain by 37%of the urban and 38% of the rural youth. Sixty two percent (62%) of rural youth perceive homebrew easyto obtain compared to 14% of the urban youth.
Figure 10: (Very) easy to obtain substances in the Youth KAP Survey (%)
7
83
87
45
87
6
47
3
4
6
38
62
81
82
77
81
39
51
94
18
12
8
11
37
41
77
76
70
76
77
91
10
0 10 20 30 40 50 60 70 80 90 100
Tranquillizers
Sedatives
Painkillers
Amphetamines
Hallucinogens
Heroin
Cocaine
Mandrax
Cannabis
Homebrew
Wine
Beer
Hard liquor
Alcohol generally
Non-cigarette tobacco
Cigarettes
Bela-Bela (N=109) Greater Pretoria (N=193)

Section 2
22
2.4 Community Profile 1: Organizational and cultural context
Table 10 presents a summary of the organizational, cultural and institutional context and resources thatexist in the communities. The urban site was generally better served by educational and medicalinstitutions (detoxification facilities, counselling) and had subsidized rehabilitation facilities and otheramenities. Facilitation of networking among service providers, services and non-governmentalorganizations involved in substance use prevention was more evident in the urban site. The non-governmental organizations were involved in community mobilization through awareness campaigns andpeer counselling. A number of these organizations had comprehensive programmes that provided shelter,nutrition, education and employment in both the urban and the rural sites. Community strengths identifiedduring the focus group interviews included acceptance of youth-led prevention initiatives in both theurban and the rural sites, willingness of community leaders to mobilize efforts to prevent substance useand a number of committed community-level non-governmental agencies with outreach programmes.Inadequate funding, limited networks in the rural site, lack of manpower in the rural site and involvementof service providers in substance use and trade were the major identified constraints.

Table 10: Community resources for the prevention of substance use-related problems
Type of units Main services Primary prevention programmes/projects, objectives,targets, strategies, resources, level of commitment
Government• Historically disadvantaged areas in the urban site and the
rural site relied on basic health, safety and securityfacilities in neighbouring districts
• Only the urban site had specialized substance-relatedin/outpatient care, run or subsidized by the government
• Child Protection Unit and SA Narcotics Bureau of thepolice department
• Municipal councillors’ offices• Youth Commission• “Drug action committees” were to be established in terms
of the government’s National Drug Master PlanNon-government• Numerous registered non-profit, non-governmental
agencies in health care and welfare as well as churches,the media, businesses and labour groups in the urban siteattended to (the prevention of) substance-relatedproblems
• The rural site was dependent on the services inneighbouring districts
• Sectors of the formal organizational structures of politicalparties
• International bodies: WHO and UNDCP officesNetworks (particularly active in the urban site)• SAAPSA (SA Alliance for the Prevention of Substance
Abuse)• Gauteng Substance Abuse Forum• NETPRO (network of practitioners/researchers focussing
on substance/other issues)• SACENDU (SA Community Epidemiology Network on
Drug Use) with local, African and overseas agenciesparticipating
• Information sharing and technical support betweenexisting networks
• Youth-to-youth substance-related prevention networks• Various community forums attended to substance-related
harm
• Various entrepreneurial training forums in the urban site• Various formal collaborative agreements on substance
control between local and foreign governments• Periodic activism/advocacy in research communities
Government• Free/subsidized medical services (e.g.
detoxification) and schooling• Subsidized rehabilitation services in the urban
site• Free substance-related individual and group
therapy, community development services,awareness campaigns at schools and in themedia (e.g. talks, marches, pamphlets),especially in urban site
• Periodic substance control raids by the policeat schools and in residential areas
• Substance control legislation and agreementswith other countries and international bodies
• Life skills development programmes of theDept of Education and the Dept of Health atselected government schools in the urban site
• Facilitation of networking/coordination amongservice providers in both sites
Non-government• Mobilization of community members (e.g.
youth and parent groups) through marches,pamphlets, talks, youth forums and clubs,recreation centres, entrepreneurial groups
• Substance abuse awareness campaigns atschools (especially in the urban site) and in themedia
• Individual/group therapy and life skillstraining
• Peer counselling (e.g. youth-to-youth groups)• Specialized rehabilitation services in the urban
site• Comprehensive programmes (e.g. shelter,
nutrition, education, medical care,employment)
Overall objectives• Concerted community action against community problems
generally• Eradication of corruption (e.g. drug trade) within
legitimate/formal institutions (e.g. police service, teachingstaff at schools)
Main target groupSubstance usersMain strategiesDrug control coupled with community developmentSubstance-related prevention projects/programmesSee section on servicesProgramme/project resources, efficacy and sustainabilityConstraints• Limited (sustained) funding• Limited awareness of and willingness to discuss the actual
and potential wide-ranging negative consequences ofsubstance use in the rural site
• Limited (sustained) commitment to prevention among serviceproviders in the rural site
• Limited networking and referral resources among serviceproviders, especially in the rural site
• Shortage of manpower and especially skilled/specialistmanpower in the rural site
• Competition between service providers in the urban site• Some service providers (e.g. teachers, medical doctors,
police) participated in substance use and drug trade• Limited monitoring and evaluation of servicesStrengths• Agencies (e.g. mayoral office in the rural site, Dept of Health
and Welfare social workers in the rural site, police in theurban and the rural sites) were willing to expand/intensifysubstance-related preventive services
• Youth-led preventive initiatives were well accepted in bothsites
• Explicit efforts/commitment among particular (non-)governmental agencies in both sites to sustain, extend andimprove service outreach
• Government support for scientific monitoring and ongoingevaluation of the impact of policies/actions at all levels (e.g.central, provincial and local/district/community level), e.g. interms of cost-effectiveness, sustainability, scope of outcomes

Section 2
24
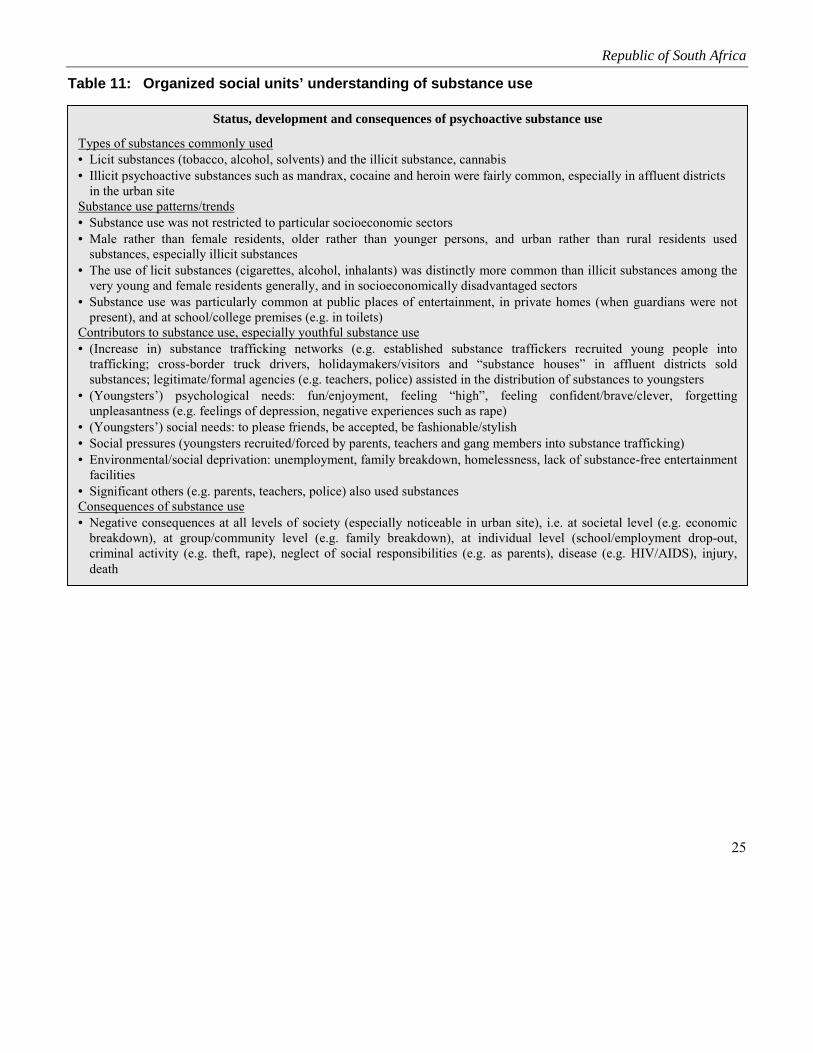
2.5 Community Profile 2: Societal structures and processes
The understanding of substance use among organized units is presented in Table 11. The types ofsubstances used, patterns and trends, contributing factors to youth substance use and the understanding ofthe consequences of substance use confirmed the findings of the adult and youth KAP studies. Inaddition, the findings pointed out important societal factors that led to substance use, such as traffickingin illicit substances, social and environmental pressures. Various broad societal burdens impacted on thebaseline assessment sites, including, for example, high rates of injuries, tuberculosis and HIV infection—in 1999 the proportion of female 15-24 year olds living with HIV/AIDS was estimated at 27%. Inaddition, the urban site had many organized crime networks as well as higher rates of crime overall,driving under the influence of substances, and arrests for possession of and trade in illicit substances.
Table 12 presents the status of trade in substances in the two sites. In general the marketing medium,the content and the intensity of the marketing of alcohol and tobacco encouraged trade in thesesubstances. In addition, illicit trade was promoted by means of various networks. A wide range of othersubstances was marketed and the range of target groups was expanding. Trafficking in illicit substanceswas on the increase even in the rural site—through cross-border truck drivers, holidaymakers and “drughouses”. The table also presents the main government and non-government policies and legislative andregulatory measures to counter trade, distribution and use of substances.
Republic of South Africa
25
Table 11: Organized social units’ understanding of substance use
Status, development and consequences of psychoactive substance use
Types of substances commonly used• Licit substances (tobacco, alcohol, solvents) and the illicit substance, cannabis• Illicit psychoactive substances such as mandrax, cocaine and heroin were fairly common, especially in affluent districts
in the urban siteSubstance use patterns/trends• Substance use was not restricted to particular socioeconomic sectors• Male rather than female residents, older rather than younger persons, and urban rather than rural residents used
substances, especially illicit substances• The use of licit substances (cigarettes, alcohol, inhalants) was distinctly more common than illicit substances among the
very young and female residents generally, and in socioeconomically disadvantaged sectors• Substance use was particularly common at public places of entertainment, in private homes (when guardians were not
present), and at school/college premises (e.g. in toilets)Contributors to substance use, especially youthful substance use• (Increase in) substance trafficking networks (e.g. established substance traffickers recruited young people into
trafficking; cross-border truck drivers, holidaymakers/visitors and “substance houses” in affluent districts soldsubstances; legitimate/formal agencies (e.g. teachers, police) assisted in the distribution of substances to youngsters
• (Youngsters’) psychological needs: fun/enjoyment, feeling “high”, feeling confident/brave/clever, forgettingunpleasantness (e.g. feelings of depression, negative experiences such as rape)
• (Youngsters’) social needs: to please friends, be accepted, be fashionable/stylish• Social pressures (youngsters recruited/forced by parents, teachers and gang members into substance trafficking)• Environmental/social deprivation: unemployment, family breakdown, homelessness, lack of substance-free entertainment
facilities• Significant others (e.g. parents, teachers, police) also used substancesConsequences of substance use• Negative consequences at all levels of society (especially noticeable in urban site), i.e. at societal level (e.g. economic
breakdown), at group/community level (e.g. family breakdown), at individual level (school/employment drop-out,criminal activity (e.g. theft, rape), neglect of social responsibilities (e.g. as parents), disease (e.g. HIV/AIDS), injury,death

Table 12: Status of trade in substances
Marketing medium Content and intensity of marketing National, provincial, local governmentand non-government policy Legislative and other regulatory measures
Tobacco• Sponsorships and
promotion, but advertise-ments prohibited
Alcohol• Television
(advertisements)• Radio (advertisements)• Newspapers, magazines
and billboards (advertise-ments)
• Cinema (advertisements)• Liquor industry sponsor-
ships of various events,e.g. sport, adventure andoutdoor activities, musicfestivals, live shows, raves
• Amount spent onsponsorship and promo-tional advertisementsbetween January andOctober 2000 about
200 000 US$• Licensed/unlicensed
production and a varietyof outlets, e.g. restaurants,retail stores, bottle stores,hotels, clubs (licensedliquor outlets per km2
more in the rural (2.75)than urban site (0.7))
Other substancesIllicit trading through licitand illicit networks
Tobacco• Advertisements prohibitedAlcoholTelevision advertisements• Anecdotal evidence of an increase in
the range and intensity of televisionalcohol advertisements
• Target groups: Anecdotal evidencethat a wide range of groups butespecially sport fans and the youthwere targeted in alcohol advertising
• Portrayed images focussed on“coolness”, fun, stylishness,problem-solving ability, romance,freedom, accomplishment, socialcohesion/bonding
Radio and cinema advertisements• Anecdotal evidence of an increase in
the range and intensity of radio andcinema advertisements
• Target groups: Anecdotal evidencethat a wide range of groups butespecially sport fans and youngpeople were targeted
Newspaper/magazine/billboardadvertisements• Anecdotal evidence that the range
and intensity of alcohol advertisingin the printed media were less thanin the case of television and radioand more common in the urban thanin the rural area
• Target groups: Anecdotal evidencethat a wide range of groups wastargeted in alcohol advertising
Other substancesAn increase in the range of illicitsubstances marketed and in groupstargeted
• Comprehensive and integrated plan tocounter substance problems amongespecially young people, i.e. theNational Drug Master Plan (NDMP),approved by the South AfricanParliament in 1999
• Single agency with various governmentand non-governmental agenciesrepresented, i.e. the Central DrugAuthority (CDA), established throughthe Prevention and Treatment of DrugDependency Amendment Act (Act 14 of1999)
• Draft Health Sector StrategicFramework: 1999-2004, tabled in 1999and aiming to decrease substance abuseby 10.0% by 2004, facilitates training ofhealth workers in the prevention ofsubstance abuse and substance-relatedtreatment within the health sector
• Department of Health’s Draft PolicyGuidelines for Adolescent and YouthHealth (1999)
• Department of Health’s Framework forthe Development of Substance AbusePolicy Guidelines (2000)
• White Paper of the Department ofWelfare and Population Development(1997)
• Policy documents of provincialdepartments of economic affairs onliquor outlet regulations, e.g. theWestern Cape Green Paper on liquoroutlet regulations
• Department of Finance’s policyregulations on excise tax on alcohol andtobacco products
• National Youth Policy 2000, identifyingyouth substance abuse as a secondpriority in its National Action Plan
Government measures• Measures prioritizing youth issues, e.g. the Youth Act
(Act 19 of 1996), in terms of which the National YouthCommission (based in the Office of the DeputyPresident) and the National Youth Council wereestablished in 1996
• Legislative measures to reduce availability of anddemand for substances: Liquor Bill (Act 28 of 1998)(e.g. stipulating bans on alcohol sales to persons youngerthan 18, and licensing of on/off-premises sale of liquor),the Drugs and Drug Trafficking Act (Act 140 of 1992),the Prevention and Treatment of Drug Dependency Act(Act 20 of 1992), the Medicines and Related SubstancesControl Act (Act 101 of 1965), the Institute for Drug-Free Sport Act (Act 14 of 1997), Road TransportationAct (Act 74 of 1977) (e.g. stipulating minimum bloodalcohol levels for drivers), the Criminal Procedure Act(Act 51 of 1977), Tobacco Products Control AmendmentAct (Act 12 of 1999) (e.g. prohibiting tobaccoadvertising, sponsorship and promotion, restrictingsmoking in enclosed public places to designated areas,restricting free distribution of tobacco products, settingmaximum limits on the nicotine and tar content ofcigarettes), International Co-operation in CriminalMatters Act (Act 75 of 1996), Prevention of OrganizedCrime Act (Act 121 of 1998)
• Agreements to collaborate with other countries (e.g. inthe Southern African Development Community (SADC)region) to reduce trafficking in illicit substances
• SA Government’s Integrated Sustainable RuralDevelopment and Urban Renewal Strategy, helping localcommunities to identify and meet needs cost-effectively
Non-government measuresSelf-regulation in liquor industry, e.g. Liquor Industry’sAdvertising, Packaging and Promotions Code of Practice

Republic of South Africa
27
2.6 Intervention development
2.6.1 Key concerns
The baseline findings suggest the key intervention concerns listed below.
Key concerns: Community Profile 1
• Widespread alcohol/cigarette use in the urban site and among males
• Cannabis as the most commonly used illicit substance
• The use of mandrax, cocaine and heroin in the urban site
• Regular (daily/weekly) smoking/drinking in both sites, and heavy smoking/drinking (e.g. at leastfive cigarettes a day, taking five drinks in a row) in the urban site
• Substance-related injuries, fights/arguments and poor work performance in the urban site
• Adult/parental approval of heavy/regular drinking/smoking, the belief that substance use entails noor a slight risk and that cannabis use should be legalized in the rural site
• A belief in the urban site that it is easy to obtain substances
• A lack of substance use-related preventive services in the rural site
Key concerns: Community Profile 2
• Heavy health burdens, such as HIV infection, tuberculosis and injuries
• Intense economic and infrastructural constraints in the rural site, such as extreme poverty, lack ofmedical and police facilities, and limited formal housing
• Trade in substances in the rural site
• Safety constraints in the urban site such as substance use-related offences
Key concerns: Youth KAP Survey
• Substance use among urban 15-19 year olds
• Early onset (10-14 years) of substance use for enjoyment/stress relief in the rural site
• Starting substance use out of curiosity in the urban site
• Pressure from peers and relatives towards substance use in the urban site

Section 2
28
• Youth approval of cigarette use in the rural site, and of drinking in the urban site
• Rural youths believe heavy smoking/drinking and cannabis use entail no or a slight risk
• The belief among rural young people that it is easy to obtain alcohol
2.6.2 Intervention priorities
The above concerns and preferences expressed by community leaders suggest a need for at least thefollowing interventions in which young people should participate:
In the rural site
1. Facilitating socioeconomic development, substance-related services, a reduction in the availabilityof substances, and non-approval of alcohol, tobacco and cannabis use
2. Motivating and teaching 10-14 year olds and 15-19 year olds in particular through awarenesscampaigns and peer education not to succumb to social enticement to use substances, and insistingon a reduction in youth substance use
3. Mobilizing community groups and holding educational campaigns, and insisting on outcomes suchas increased basic facilities and increased licit income generation
4. Reduction in the number of liquor outlets, increased deterrence of trafficking in illicit substances,and non-approval of youth substance use
In the urban site
1. Facilitating cooperation between substance-related agencies, long-term access to funding andexpansion of substance-related services
2. Disentangling drug-crime links, through strengthening existing service networks, and insisting onoutcomes such as increased servicing of disadvantaged districts and inter-agency agreements
3. Motivating and teaching 10-14 year olds and 15-19 year olds in particular through awarenesscampaigns and peer education not to succumb to social pressure to use substances, and insisting ona reduction in youth substance use
4. Increased non-approval of smoking/drinking and cannabis use, as well as increased awareness ofthe social and health consequences of substance use

Section 3
UNITED REPUBLIC OF TANZANIA

Section 3
30
3.1 Site description
The baseline assessment sites in the United Republic of Tanzania were two urban communities, namelyOld Stone Town in Zanzibar Municipality and Kinondoni Municipality in Dar es Salaam. Although thesetwo sites are both urban, the special location of Zanzibar (an island) as a transit point for drug traffickingfurther justifies the need for primary prevention of substance use. In general, the demographic features ofthe two sites were similar. The mean age (2000 census) was 25.4 years for Zanzibar and 26.0 years forDar es Salaam. The general population distribution was similar, with 48% of the population of Zanzibaraged under 15 years and 47% of the population of Dar es Salaam aged under 15 years.
3.2 Demographic findings
Apart from a much higher proportion of respondents being of Muslim faith in Zanzibar, all the otherdemographic findings were similar for the two sites (Table 1).
Table 1: Demographic profiles of adult and youth KAP survey participants
Variable Old Stone Town (Zanzibar) Kinondoni (Dar es Salaam)Adult (N=100) Youth (N=299) Adult (N=100) Youth (N=303)
Sex distribution1. Male .............................................60.8%.........................62.9%................... 59.0% ........................ 61.4%2. Female .........................................39.2%.........................37.1%................... 41.0% ........................ 38.6%Mean age (years) ......... ……………………..………….16.5 years…………………………………17.2 yearsReligious affiliation (Muslim)............93.6%.........................90.3%................... 69.0% ........................ 68.2%Religion considered important ............84.0%.........................92.7%................... 87.2% ........................ 90.3%Age distribution10-14 years ............................................. N/A.........................25.1%.......................N/A ........................ 24.4%15-19 years .................................................... .........................53.8%.............................. ........................ 48.8%20-21 years .................................................... .........................21.1%.............................. ........................ 26.7%Employment/school attendanceEmployed/full-time student.................30.2%.........................68.0%................... 17.0% ...................... 38.6%*Unemployed ........................................69.8%.........................24.7%................... 83.0% ...................... 11.7%*Years of formal education1. 0-7 years ............................................ ….........................64.5%................... 65.0% ........................ 76.0%2. 8+ years ............................................. ….........................35.5%................... 35.0% ........................ 24.0%
* The remaining 49.7% of the youth respondents were neither in school nor in employment
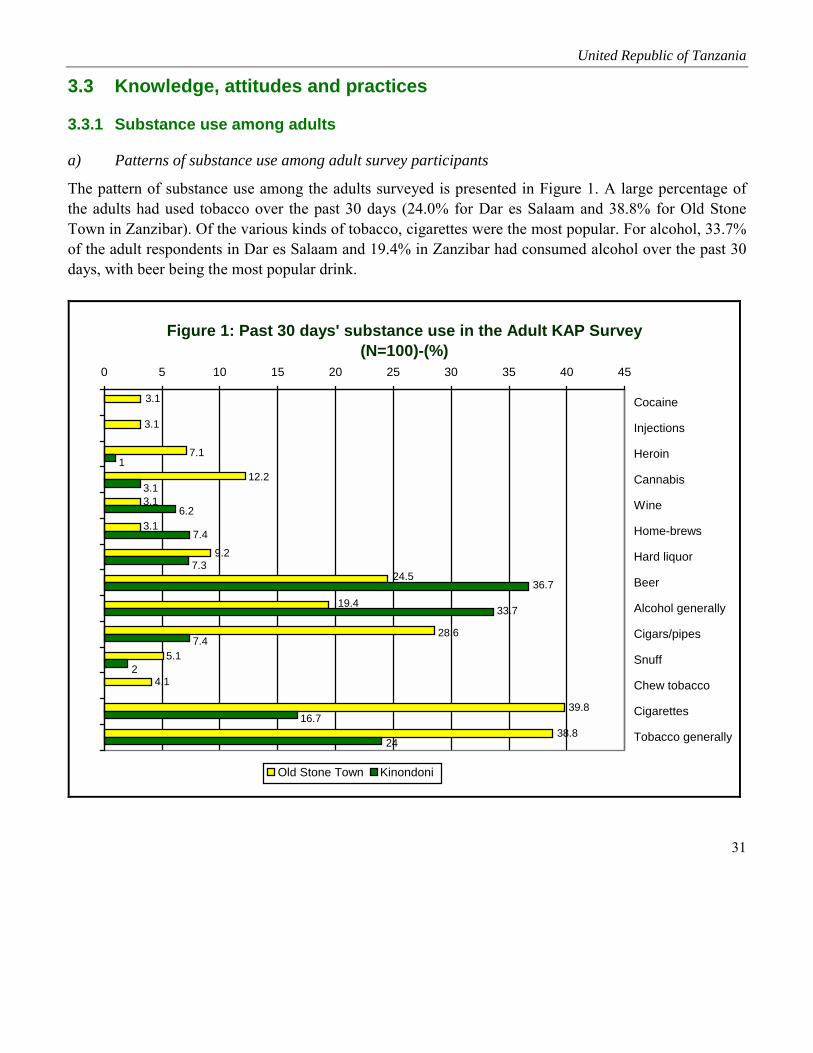
United Republic of Tanzania
31
3.3 Knowledge, attitudes and practices
3.3.1 Substance use among adults
a) Patterns of substance use among adult survey participants
The pattern of substance use among the adults surveyed is presented in Figure 1. A large percentage ofthe adults had used tobacco over the past 30 days (24.0% for Dar es Salaam and 38.8% for Old StoneTown in Zanzibar). Of the various kinds of tobacco, cigarettes were the most popular. For alcohol, 33.7%of the adult respondents in Dar es Salaam and 19.4% in Zanzibar had consumed alcohol over the past 30days, with beer being the most popular drink.
Figure 1: Past 30 days' substance use in the Adult KAP Survey (N=100)-(%)
39.8
38.8
4.1
5.1
19.4
24.5
9.2
3.1
3.1
12.2
7.1
3.1
3.1
28.6
24
16.7
2
7.4
33.7
36.7
7.3
7.4
6.2
3.1
1
0 5 10 15 20 25 30 35 40 45
Cocaine
Injections
Heroin
Cannabis
Wine
Home-brews
Hard liquor
Beer
Alcohol generally
Cigars/pipes
Snuff
Chew tobacco
Cigarettes
Tobacco generally
Old Stone Town Kinondoni
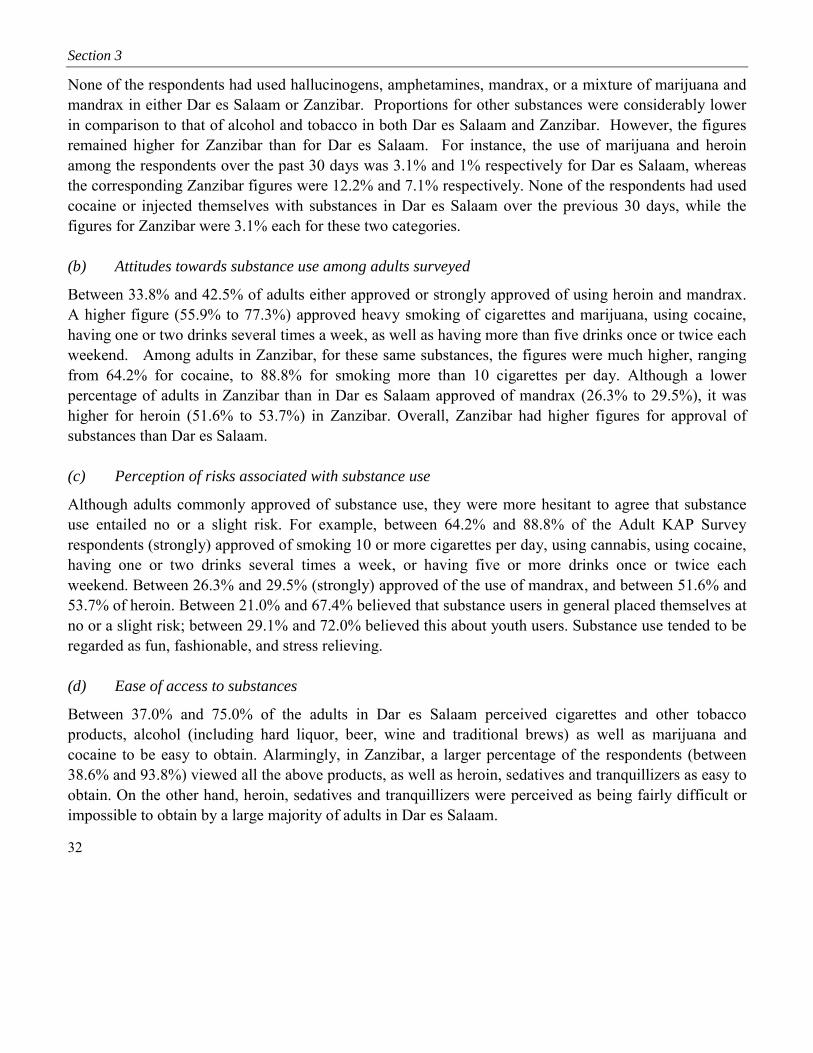
Section 3
32
None of the respondents had used hallucinogens, amphetamines, mandrax, or a mixture of marijuana andmandrax in either Dar es Salaam or Zanzibar. Proportions for other substances were considerably lowerin comparison to that of alcohol and tobacco in both Dar es Salaam and Zanzibar. However, the figuresremained higher for Zanzibar than for Dar es Salaam. For instance, the use of marijuana and heroinamong the respondents over the past 30 days was 3.1% and 1% respectively for Dar es Salaam, whereasthe corresponding Zanzibar figures were 12.2% and 7.1% respectively. None of the respondents had usedcocaine or injected themselves with substances in Dar es Salaam over the previous 30 days, while thefigures for Zanzibar were 3.1% each for these two categories.
(b) Attitudes towards substance use among adults surveyed
Between 33.8% and 42.5% of adults either approved or strongly approved of using heroin and mandrax.A higher figure (55.9% to 77.3%) approved heavy smoking of cigarettes and marijuana, using cocaine,having one or two drinks several times a week, as well as having more than five drinks once or twice eachweekend. Among adults in Zanzibar, for these same substances, the figures were much higher, rangingfrom 64.2% for cocaine, to 88.8% for smoking more than 10 cigarettes per day. Although a lowerpercentage of adults in Zanzibar than in Dar es Salaam approved of mandrax (26.3% to 29.5%), it washigher for heroin (51.6% to 53.7%) in Zanzibar. Overall, Zanzibar had higher figures for approval ofsubstances than Dar es Salaam.
(c) Perception of risks associated with substance use
Although adults commonly approved of substance use, they were more hesitant to agree that substanceuse entailed no or a slight risk. For example, between 64.2% and 88.8% of the Adult KAP Surveyrespondents (strongly) approved of smoking 10 or more cigarettes per day, using cannabis, using cocaine,having one or two drinks several times a week, or having five or more drinks once or twice eachweekend. Between 26.3% and 29.5% (strongly) approved of the use of mandrax, and between 51.6% and53.7% of heroin. Between 21.0% and 67.4% believed that substance users in general placed themselves atno or a slight risk; between 29.1% and 72.0% believed this about youth users. Substance use tended to beregarded as fun, fashionable, and stress relieving.
(d) Ease of access to substances
Between 37.0% and 75.0% of the adults in Dar es Salaam perceived cigarettes and other tobaccoproducts, alcohol (including hard liquor, beer, wine and traditional brews) as well as marijuana andcocaine to be easy to obtain. Alarmingly, in Zanzibar, a larger percentage of the respondents (between38.6% and 93.8%) viewed all the above products, as well as heroin, sedatives and tranquillizers as easy toobtain. On the other hand, heroin, sedatives and tranquillizers were perceived as being fairly difficult orimpossible to obtain by a large majority of adults in Dar es Salaam.
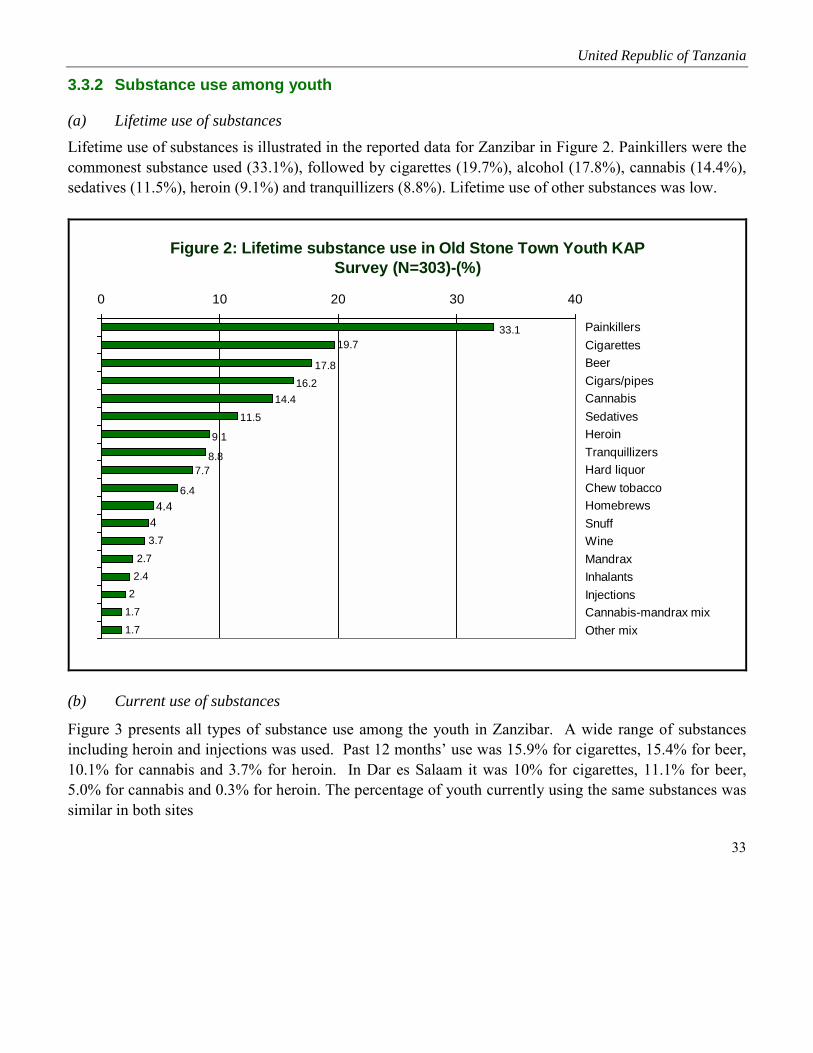
United Republic of Tanzania
33
3.3.2 Substance use among youth
(a) Lifetime use of substancesLifetime use of substances is illustrated in the reported data for Zanzibar in Figure 2. Painkillers were thecommonest substance used (33.1%), followed by cigarettes (19.7%), alcohol (17.8%), cannabis (14.4%),sedatives (11.5%), heroin (9.1%) and tranquillizers (8.8%). Lifetime use of other substances was low.
Figure 2: Lifetime substance use in Old Stone Town Youth KAP Survey (N=303)-(%)
3.72.7
2.42
1.71.7
44.4
6.4
7.78.8
9.1
11.514.4
16.217.8
19.733.1
0 10 20 30 40
PainkillersCigarettesBeerCigars/pipesCannabisSedativesHeroinTranquillizersHard liquorChew tobaccoHomebrewsSnuffWineMandraxInhalantsInjectionsCannabis-mandrax mixOther mix
(b) Current use of substances
Figure 3 presents all types of substance use among the youth in Zanzibar. A wide range of substancesincluding heroin and injections was used. Past 12 months’ use was 15.9% for cigarettes, 15.4% for beer,10.1% for cannabis and 3.7% for heroin. In Dar es Salaam it was 10% for cigarettes, 11.1% for beer,5.0% for cannabis and 0.3% for heroin. The percentage of youth currently using the same substances wassimilar in both sites

Figure 3: Use of selected substances in the Old Stone Town Youth KAP Survey (N=303)-(%)
0
5
10
15
20
25
Lifetime use 19.7 6.4 4 16.2 17.8 7.7 4.4 3.7 14.4 9.1 2
Past 12 months' use 15.9 5 3.4 12.8 15.4 7 3.7 3.4 10.1 3.7 2
Past 30 months' use 14.5 5 3 12.1 14.8 6.7 3.7 3.4 9.1 3 2
Cigarettes
Chew tobacco Snuff Cigars/
pipes Beer Hard liquor
Home-brews Wine Cannabis Heroin Injections

United Republic of Tanzania
35
(c) Experiences and context of substance use
Most of the youngsters knew a substance user, especially users of cigarettes, heroin, cigars/pipes, beerand cannabis (Figure 4). The context of first and past use of various substances is presented in Tables 2,3, 4 and 5. Onset of substance use tended to be in early adolescence (Table 2). Onset typically took placewithin friendship/family circles, and to a lesser extent through agencies such as health care services. Afteronset, substance use tended to proceed within family/friendship circles, to a lesser extent under a bush orbridge and among acquaintances. Positive attitudes underpinned substance use. For example, curiosityand personal “rewards” such as social acceptance (to be fashionable) and enjoyment were generally givenas reasons for the first use.
Figure 4: Knowledge of someone using substances in the Old Stone Town Youth KAP Survey (N=303)-(%)
10.1
13.5
13.9
26.5
59.1
68.5
78.5
82.9
86.5
87.5
89.6
93.9
0 10 20 30 40 50 60 70 80 90 100
Cigarettes
Heroin
Cigars/pipes
Beer
Cannabis
Chew tobacco
Snuff
Homebrews
Wine
Cannabis-mandrax mix
Mandrax
Inhalants
Table 2: Context of first/past 12 months’ use of alcohol and tobacco and reasons for onset in the Youth KAPSurvey (N=303)—Old Stone Town
Cigarettes Chew tobacco Cigars/pipes Snuff Hard liquor Beer Wine Homebrews(%) (%) (%) (%) (%) (%) (%) (%)
Age of 1st useMedian age.............................. 14.9 ............... 13.6..................13.7 ...............12.3 ..........15.6 ............... 17.2 ....... 12.1................12.7≤10-12 years.............................. 3.0 ................. 1.7....................5.4 .................2.0 ............1.7 ................. 2.0 ......... 1.7..................1.713-14 years................................ 4.7 ................. 1.0....................2.0 .................0.3 ............0.7 ................. 1.7 ............. -..................0.315-16 years................................ 3.1 .....................-....................3.7 .................0.3 ............2.0 ................. 3.0 ......... 0.3..................0.317-18 years................................ 4.1 ................. 0.7....................0.3 .....................- ............1.3 ................. 4.4 ......... 0.3..................0.3≥19 years .......................................- ................. 0.7........................- .................0.3 ............0.3 ................. 3.0 ............. -..................0.3Reasons for 1st useAcceptance................................ 1.4 ................. 0.3....................3.4 .................0.3 ................- ................. 1.0 ............. -..................... -Curiosity.................................... 4.7 ................. 0.7....................1.0 .................0.3 ............1.7 ................. 3.7 ......... 0.3..................0.3Enjoyment ................................. 2.7 .....................-....................1.7 .................0.3 ............1.3 ................. 4.4 ......... 0.3..................0.7Sociability ................................. 2.4 ................. 0.7....................0.3 .....................- ............0.7 ................. 1.7 ............. -..................... -Health............................................- ................. 0.7........................- .....................- ................- ................. 0.3 ............. -..................... -Stress relief....................................- .....................-........................- .....................- ................- ................. 0.3 ............. -..................0.3Cold/hunger/fatigue relief ......... 1.0 .....................-........................- .....................- ................- ................. 0.3 ............. -..................0.3Religious custom....................... 1.4 ................. 1.7....................2.0 .................1.7 ............1.3 ................. 1.7 ......... 1.7..................1.7Sex boosting.............................. 1.0 .....................-....................1.7 .....................- ............0.7 ................. 0.3 ............. -..................... -Other ......................................... 0.3 .....................-....................1.0 .....................- ................- ................. 0.3 ............. -..................... -Provider of 1st substanceFriends....................................... 2.4 .....................-....................0.3 .................0.3 ............1.7 ................. 3.4 ............. -..................0.3Family ....................................... 1.4 ................. 2.5....................4.0 .................1.7 ............1.7 ................. 1.3 ......... 2.0..................1.7Acquaintance............................. 0.7 ................. 0.7....................5.7 .....................- ............1.3 ................. 0.3 ............. -..................... -Dealer........................................ 1.4 .....................-........................- .....................- ............0.3 ................. 1.7 ............. -..................0.3Health practitioner .................... 6.1 ................. 0.6........................- .................0.7 ................- ................. 5.7 ............. -..................0.6Unknown person ....................... 2.0 .....................-....................1.6 .....................- ............1.0 ................. 1.7 ......... 0.7..................0.7

Table 3: Place and company for first/past 12 months’ use of alcohol and tobacco and reasons for onset in theYouth KAP Survey (N=303)—Old Stone Town
Cigarettes Chew tobacco Cigars/pipes Snuff Hard liquor Beer Wine Homebrews(%) (%) (%) (%) (%) (%) (%) (%)
Place of 1st substance useFriend’s home ........................... 3.1 ................. 0.7....................1.7 .................0.3 ............0.7 ................. 1.3 ............. -..................... -Family home ............................. 3.7 ................. 2.4....................3.7 .................1.7 ............2.7 ................. 3.4 ......... 2.7..................1.7Public place............................... 3.7 ................. 0.7....................0.7 .................0.3 ................- ................. 2.4 ............. -..................0.7School/work ............................. 3.1 .....................-....................1.7 .....................- ................- .....................- ............. -..................0.3Open/street/bush/bridge ............ 1.4 .....................-....................3.4 .....................- ............1.0 ................. 6.1 ............. -..................0.3Other .............................................- .....................-....................0.7 .....................- ............0.3 ................. 0.7 ............. -..................... -Past 12 months: place of useFriend’s home ........................... 2.4 ................. 1.3....................3.0 .................0.3 ................- ................. 1.3 ......... 0.3..................0.3Family home ............................. 3.4 ................. 2.0....................3.4 .................2.3 ............2.4 ................. 3.0 ......... 2.3..................1.7Public place............................... 3.4 ................. 0.3....................2.7 .....................- ............0.7 ................. 3.0 ............. -..................0.3School/work .............................. 2.4 ................. 0.3....................0.7 .....................- ................- .....................- ............. -..................... -Open/street/bush/bridge ............ 2.7 .....................-....................1.4 .....................- ............2.7 ................. 5.1 ............. -..................... -Other ......................................... 0.7 ................. 0.7....................0.7 .....................- ................- ................. 1.7 ............. -..................0.3Past 12 months’ use: companyFriends....................................... 2.7 ................. 1.3....................5.7 .....................- ............4.0 ................. 8.1 ............. -..................0.7Acquaintances ........................... 8.9 ................. 2.4....................5.1 .................2.0 ............2.0 ................. 5.1 ......... 1.7..................2.0Family ....................................... 0.7 ................. 0.7....................0.7 .................1.0 ................- ................. 1.0 ......... 0.3..................0.3Work/school mates.................... 1.7 .....................-....................0.3 .....................- ................- .....................- ......... 0.3..................... -Other/alone................................ 0.6 .....................-........................- .....................- ................- .....................- ............. -..................... -
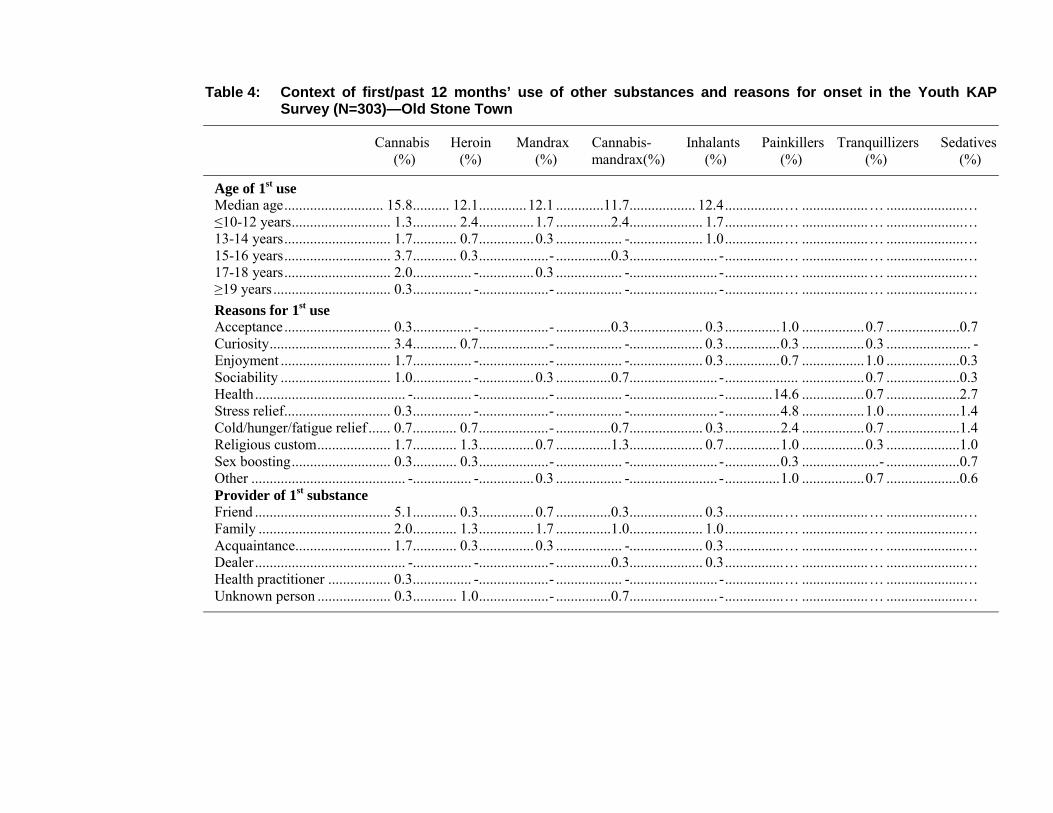
Table 4: Context of first/past 12 months’ use of other substances and reasons for onset in the Youth KAPSurvey (N=303)—Old Stone Town
Cannabis Heroin Mandrax Cannabis- Inhalants Painkillers Tranquillizers Sedatives(%) (%) (%) mandrax(%) (%) (%) (%) (%)
Age of 1st useMedian age........................... 15.8.......... 12.1.............12.1 .............11.7.................. 12.4................… ..................… .....................…≤10-12 years........................... 1.3............ 2.4...............1.7 ...............2.4.................... 1.7................… ..................… .....................…13-14 years............................. 1.7............ 0.7...............0.3 .................. -.................... 1.0................… ..................… .....................…15-16 years............................. 3.7............ 0.3...................- ...............0.3........................ -................… ..................… .....................…17-18 years............................. 2.0................ -...............0.3 .................. -........................ -................… ..................… .....................…≥19 years ................................ 0.3................ -...................- .................. -........................ -................… ..................… .....................…Reasons for 1st useAcceptance............................. 0.3................ -...................- ...............0.3.................... 0.3...............1.0 .................0.7 ....................0.7Curiosity................................. 3.4............ 0.7...................- .................. -.................... 0.3...............0.3 .................0.3 ....................... -Enjoyment .............................. 1.7................ -...................- .................. -.................... 0.3...............0.7 .................1.0 ....................0.3Sociability .............................. 1.0................ -...............0.3 ...............0.7........................ -.................... .................0.7 ....................0.3Health......................................... -................ -...................- .................. -........................ -.............14.6 .................0.7 ....................2.7Stress relief............................. 0.3................ -...................- .................. -........................ -...............4.8 .................1.0 ....................1.4Cold/hunger/fatigue relief ...... 0.7............ 0.7...................- ...............0.7.................... 0.3...............2.4 .................0.7 ....................1.4Religious custom.................... 1.7............ 1.3...............0.7 ...............1.3.................... 0.7...............1.0 .................0.3 ....................1.0Sex boosting........................... 0.3............ 0.3...................- .................. -........................ -...............0.3 .....................- ....................0.7Other .......................................... -................ -...............0.3 .................. -........................ -...............1.0 .................0.7 ....................0.6Provider of 1st substanceFriend ..................................... 5.1............ 0.3...............0.7 ...............0.3.................... 0.3................… ..................… .....................…Family .................................... 2.0............ 1.3...............1.7 ...............1.0.................... 1.0................… ..................… .....................…Acquaintance.......................... 1.7............ 0.3...............0.3 .................. -.................... 0.3................… ..................… .....................…Dealer......................................... -................ -...................- ...............0.3.................... 0.3................… ..................… .....................…Health practitioner ................. 0.3................ -...................- .................. -........................ -................… ..................… .....................…Unknown person .................... 0.3............ 1.0...................- ...............0.7........................ -................… ..................… .....................…
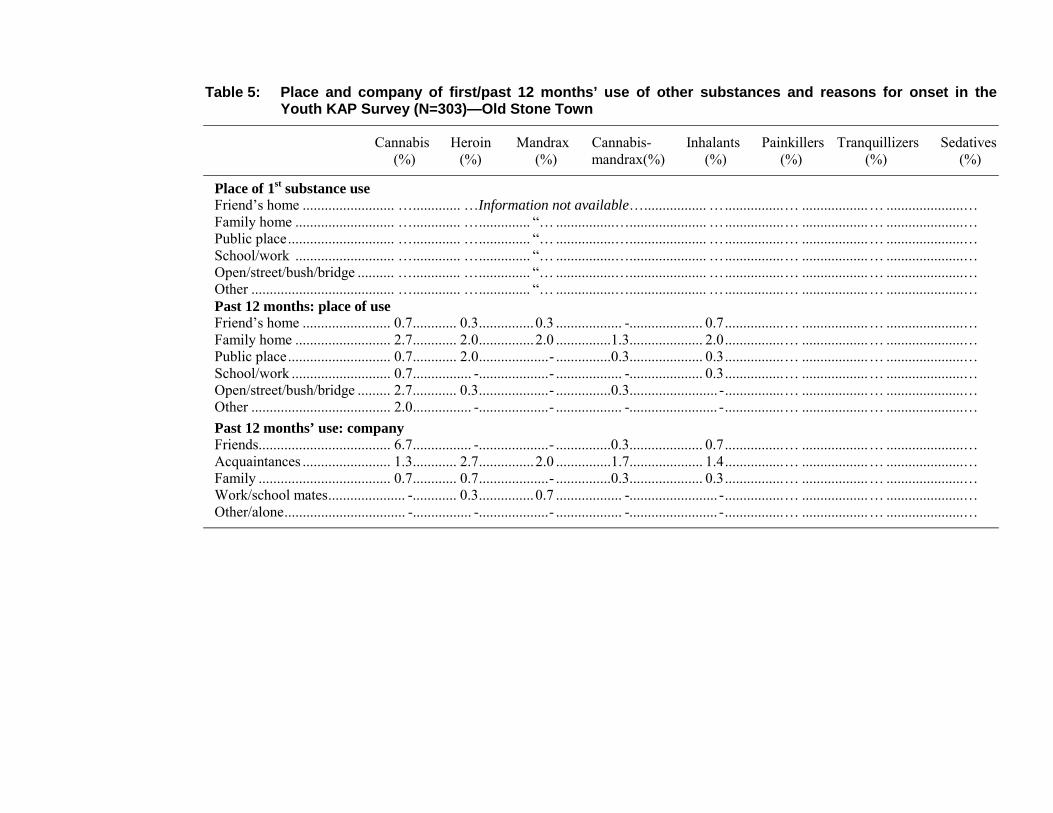
Table 5: Place and company of first/past 12 months’ use of other substances and reasons for onset in theYouth KAP Survey (N=303)—Old Stone Town
Cannabis Heroin Mandrax Cannabis- Inhalants Painkillers Tranquillizers Sedatives(%) (%) (%) mandrax(%) (%) (%) (%) (%)
Place of 1st substance useFriend’s home ......................... …............. …Information not available…................. …................… ..................… .....................…Family home ........................... …............. ….............. “… ................…..................... …................… ..................… .....................…Public place............................. …............. ….............. “… ................…..................... …................… ..................… .....................…School/work ........................... …............. ….............. “… ................…..................... …................… ..................… .....................…Open/street/bush/bridge .......... …............. ….............. “… ................…..................... …................… ..................… .....................…Other ....................................... …............. ….............. “… ................…..................... …................… ..................… .....................…Past 12 months: place of useFriend’s home ........................ 0.7............ 0.3...............0.3 .................. -.................... 0.7................… ..................… .....................…Family home .......................... 2.7............ 2.0...............2.0 ...............1.3.................... 2.0................… ..................… .....................…Public place............................ 0.7............ 2.0...................- ...............0.3.................... 0.3................… ..................… .....................…School/work ........................... 0.7................ -...................- .................. -.................... 0.3................… ..................… .....................…Open/street/bush/bridge ......... 2.7............ 0.3...................- ...............0.3........................ -................… ..................… .....................…Other ...................................... 2.0................ -...................- .................. -........................ -................… ..................… .....................…Past 12 months’ use: companyFriends.................................... 6.7................ -...................- ...............0.3.................... 0.7................… ..................… .....................…Acquaintances ........................ 1.3............ 2.7...............2.0 ...............1.7.................... 1.4................… ..................… .....................…Family .................................... 0.7............ 0.7...................- ...............0.3.................... 0.3................… ..................… .....................…Work/school mates..................... -............ 0.3...............0.7 .................. -........................ -................… ..................… .....................…Other/alone................................. -................ -...................- .................. -........................ -................… ..................… .....................…

Section 3
40
(d) Attitudes towards substance use among the youth
As regards attitudes towards substance use, over half of the respondents (ranging from 56.2% to 62.2% inDar es Salaam) either approved or strongly approved of using 10 or more cigarettes per day, of smokingmarijuana/hashish both occasionally and regularly, and of having one or two drinks several times a week.Between 40% and 48% of the Dar es Salaam youths approved or strongly approved of using cocaineeither once or twice or occasionally, and of having five or more drinks once or twice each weekend.Disapproval was high only for using heroin and mandrax.
(e) Ease of the youth’s access to substances
The perception of the availability of substances for Zanzibar is presented in Figure 5. Zanzibar youthsperceived cigarettes and other tobacco products, as well as alcohol, including homemade brew, easy toobtain, ranging from 48.2% for homemade brew to 90.3% for cigarettes. Furthermore, 41.1% to 49.5%perceived mandrax, marijuana and tranquillizers as being easy to obtain. Cocaine/crack, heroin,painkillers and sedatives were perceived by a large majority of the Zanzibar youths as being fairlydifficult, very difficult or impossible to obtain. Between 40% and 66% perceived cigarettes, tobacco andalcohol as easy to obtain. However, in Dar es Salaam all other substances including marijuana/hashish,mandrax, cocaine/crack and heroin, were perceived as being fairly difficult to impossible to obtain.
Figure 5: View that substances are fairly or very easy to obtain in the Old Stone Town Youth KAP Survey (N=303)-(%)
23.726.5
30.3
33.4
41.1
43.9
48.2
49.5
50
56.6
62.790.3
0 10 20 30 40 50 60 70 80 90 100
CigarettesBeerHard liquorWineCannabisHomebrewsTranquillizersMandraxSedativesPainkillersHeroinCocaine

United Republic of Tanzania
41
3.4 Community Profile 1: Organizational and cultural context
Tables 6 and 7 present organized social units’ understanding of substance use. Substance use among theyouth in both sites in the United Republic of Tanzania was not only common, but also started very earlyin life. Many children started using substances at 10 years of age or earlier. Conclusions from individualinterviews and focus group discussions indicated a sense of hopelessness in the community. The rapidincrease in substance use and the absence of effective control measures were alarming to leaders andparents. Parents were often unaware of their children’s substance use because they did not know thesymptoms of such use. Most respondents were frustrated by the lack of reliable treatment options. Thelocal government administrative structure was well segmented from district to ward to street level. Localleaders facilitated or coordinated most of the community-based initiatives. The strongest communityinstitution that influenced use of substances was the Muslim religion (in Zanzibar). Schools were alsostrict about the use of substances. However, tobacco was tolerated among adults because it did notadversely affect people’s behaviour. The mass media gave conflicting messages to the public. While itgave educational information against substance use, it also featured substance use and foreign culturalhabits that encouraged substance use among the youth. Television Zanzibar had a weekly 45-minuteyouth talk show that discussed youth issues including substance use. Some NGOs provided informationand counselling but they lacked the necessary resources. Their educational activities were sporadic,without regular follow-up.
3.5 Community Profile 2: Societal structures and processes
Table 8 presents the wider societal context of substance use. The two sites participating in the study hadfast-growing populations. However, the infrastructure, health status, safety/security, educationalattendance/enrolment and economic conditions were deteriorating. Female-headed households wereincreasing. For example, in Zanzibar the infant mortality rate was high (120 per 1 000 live births in2000); malaria was the leading cause of morbidity and mortality; and HIV/AIDS rates were increasing.The percentage of female 15-24 year olds living with HIV/AIDS at the end of 1999 was estimated to be9.27% in the United Republic of Tanzania. In addition, between January and October 1999 the mentalhospital in Zanzibar admitted 47 new substance users—27 were admitted in 1996 and 17 in 1994.Zanzibar had many informal dwellings (37.4%). Water trucks provided water to 40.0% of households anddid so irregularly; only 27.3% of the inhabitants had electricity inside their dwellings; most had pitlatrines; 40.0% had no kitchen; and waste removal was inconsistent. Roads were defective. Between20.0% and 25.0% of the households in Zanzibar were unable to provide for their food, health, educationand social service needs. Almost all school leavers (90.0%) in Zanzibar were without gainfulemployment. National figures suggested that the total number of reported crime per 100 000 of the

Section 3
42
population in Zanzibar rose from 1 692 in 1996 to 1 714 in 1999. Possession of or dealing in illicitsubstances rose from 12.9 per 100 000 of the population in 1996 to 14.1 in 1999.
Table 6: Organized social units’ understanding of substance use
Status, development and consequences of psychoactive substance useTypes of substances commonly used• Tobacco, alcohol, homebrews (e.g. “gongo”), sleeping pills (e.g. Valium), petrol (for sniffing), cannabis, khat, heroin
and to a lesser extent cocaine, mandrax and ephedrineSubstance use patterns/trends• Indications that licit substance use as well as the use of cannabis and khat remained more or less stable, but an upsurge
occurred in the use of other substances (e.g. heroin and especially injection heroin)• Substance use was overwhelmingly a male phenomenon• Female substance use mainly occurred among socially excluded women (e.g. commercial sex workers)• Substance use was mainly a youth phenomenon• The onset age tended to be early (10 years or younger) for substance use• The use of tobacco tended to precede the use of illicit substances• Commonly used substances were alcohol, tobacco, petrol, sleeping pills, local homebrew (“gongo”), cannabis, heroin• Substance use among young people tended to occur at youth-only recreation activities, celebrations, sport gatherings,
cemeteries, and especially at street corners where illicit substances were exchanged and jobless persons gathered• Heavy and dependent use occurred (for example, an estimated one-third of Tanzanians aged 12 years and above
regularly used tobacco)Contributors to substance use, especially youth substance use• The mass media marketed substances (especially licit drugs) (in)directly (e.g. through advertisements and lifestyles
projected in programmes)• Liberation of trade increased the availability of substances, especially licit substances, as well as promoted foreign
lifestyles/cultures• Socioeconomic pressures, especially high unemployment among the youth, poverty, lack of constructive recreational
activities• Participation in risky occupations, e.g. commercial sex (especially relevant in the case of women), bus driving,
porterage, manual labour, criminal activities• Peer pressure (friends), substance use among significant others (e.g. relatives, lovers)• Psychosocial needs: fun, friendship, curiosity, stress• Ineffective preventive efforts on the part of government and civil society• Poor parentingConsequences of substance use• Disintegration of social fabric (e.g. traditional values, norms, customs)Increased burden of already overtaxed health care, welfare, safety and security structures, and thus declining economicdevelopment

Table 7: Community resources for the prevention of substance use-related problems
Type of units Main servicesPrimary prevention programmes/projects,
objectives, targets, strategies, resources, level ofcommitment
Government• Ministry of Health (e.g. substance control section,
and a mental hospital); substance-related care atpsychiatric sections of medical facilities; generalmedical services at primary health care centres,dispensaries, hospitals
• Ministries of Education, Immigration, Legal Affairs,Home Affairs, Youth Development and Labour,Foreign Affairs, International Cooperation, Finance,Community Development, Tourism; ministers ofState and State Planning
• Inter-Ministerial Commission for the NationalCoordination of Drug Abuse Control
• Police service (Anti-Drug Unit, Marine Anti-DrugUnit)
Non-government• Tanzanian Federation of Trade Unions (substance
problem awareness campaigns)• Zanzibar Stone Town Youth Centre (primary
prevention of substance use)• Zanzibar Association of Information Against Drug
Abuse and Alcohol• Zanzibar Association for Children’s Advancement• Zanzibar Women Muslim Association (substance-
related education)• Zanzibar Youth Muslim Centre (youth development,
prevention/treatment of substance-related problems)• Zanzibar Anglican Church as well as other churches
(education, responsible citizenship)• Zanzibar Mental Health Association (SWAZA)
(mental health care)• Zanzibar local government leaders/councillors• Zanzibar parent groups• Private health care facilities (general medical care)• Political parties (e.g. youth development agendas
attended to substance problems)• YMCA (youth development, residential care)• DON BOSCO (family education/care)• EMAU (responsible parenthood training)• Save the Children Fund (youth development)• UMATI (reproductive health care)
Government• Control, e.g. anti-drug trafficking
and policy formulation initiatives(including a national drug controlmaster plan)
• Contribution to education onsubstance use-related consequences(e.g. through talks, pamphlets, lifeskills training and training inschools)
• Limited specialized substance use-related treatment services in mentalhospitals and psychiatric units
• Free/subsidized medical care inhealth centres, hospitals,dispensaries
• Strong youth developmentprogrammes
Non-government• Educational and awareness
programmes on substance use-related consequences, e.g. by healthand welfare agencies, religiousorganizations, the media, politicalparties
• Youth/community developmentprogrammes
• Limited free substance use-relatedtreatment, e.g. by church bodies
Overall objectives• Awareness raising of substance use-related consequences• Mainstream substance-related harm prevention initiatives,
e.g. initiating the latter as part of socioeconomicdevelopment efforts
• Coordination of substance use-related preventioninitiatives
• Reduction of substance supply and demandMain target groupGeneral public, with special attention to young people (in as
well as out of school)Main strategies• Combination of demand and supply reduction• Demand reduction mainly comprised awareness
programmes on substance use consequences• Initiatives to reduce broader socioeconomic “pressures”Substance prevention projects and programmes(See section on services.)Programme resources, efficacy and sustainabilityConstraints• Limited institutional/funding capacity for quality health
and educational care• Limited funding for sustained educational and awareness
programmes on substance use-related consequences• Limited quality treatment facilities, notwithstanding a
general increase in treatment demand• Low level of coordination of existing initiatives
within/across communities• Conflicting media messages (pro/anti-substance use)• Introduction of foreign practices into community via
business and tourism• Community does not expect success in countering
substance use-related problemsStrengths• Cohesive communities, with low income-inequality and
strong relations between community leaders andcommunity members
• Religious agencies are against substance use• Older generation/leaders are against substance use• Comprehensive government policy

Type of units Main servicesPrimary prevention programmes/projects,
objectives, targets, strategies, resources, level ofcommitment
• Public Health Association (TPHA)• MEHATA (mental health care)• AMREF (community-based health interventions)• International bodies: WHO and UNDCP officesNetworks• Inter-Ministerial Commission for the Coordination of
Drug Abuse Control• Limited formal and sustained collaboration among
agencies concerned with substance-relatedprevention, an exception being agreements betweenthe government and other African/overseasgovernments and international (drug control) bodies
• Periodic activism/advocacy in communities,frequently led by local community leaders engagedin drives for providing in basic needs (e.g. safewater, security, labour)
Viable preventive efforts• Concerted and sustained preventive efforts at all levels of
government and community life, (a) harnessing theexisting strong relations between local government leadersand community members as well as central governmentconcern about substance use-related problems, and (b)giving attention to substance-related control as well as toeducation, i.e. to reducing supply and demand
• Comprehensive programmes directed at the prevention ofsubstance use-related problems and embedded in broadersocioeconomic development programmes
• Preventive programmes that give special attention to thevery young

Table 8: Status of trade in substances
Marketing medium Content and intensity of marketing National, provincial, local government and non-government policy
Alcohol/tobacco• Radio, television, newspapers,
billboards, magazines, cinema• Sport and drama sponsorships• Progressively more vigorous
marketing of alcohol andtobacco since the introductionof a free market system in thebeginning of the 1990s
• Broad-based promotion oftobacco and alcohol on plasticbags, calendars, umbrellas, T-shirts
• (Un)licensed production andoutlets, a variety of outlets, andan increase in outlets sellingtraditional cheaper brews
Substances other than alcohol andtobaccoNo information available
Alcohol/tobacco• The mass media encouraged and, to a lesser
extent, discouraged alcohol/tobacco use• Government television and radio advertised
tobacco but not alcohol, except atinternational football matches and in cinemas
• Comedy/cartoon magazines (WASAA, Bantufilm, SANI) promoted use
• All newspapers (except those run by religiousagencies) advertised
• Advertisements in the public media werecommon, having increased over the past 10years with the introduction of more liberaltrade legislation/policy
• Men and the youth, but also women, weretargeted in tobacco advertisements
• Advertisements portrayed achievement,toughness, attractiveness/glamour
Substances other than alcohol and tobaccoNo information available, except the note that (a)Tanzania is a transit country in international illicittrafficking in substances (especially Zanzibar),and (b) the tourist trade facilitates illicit substancetrafficking
• Inter-Ministerial Commission for the Coordinationof Drug Abuse Control defined, promoted andcoordinated especially illicit drug control policy
• Various departments had drug control policyframeworks (eradication or reduction of illicitpsychoactive substance trafficking, control of tradein and use of licit illicit substances, cooperationwith international drug control agencies), e.g. Anti-Drugs Section in the Department of Health, theAnti-Narcotic Unit in the police, the Marine PoliceUnit, the Customs Department, ImmigrationDepartment, Pharmacy Board, Medical StoresDepartment
• Agendas/policy related to youth substance usePolitical parties had agendas for youth development,attending to the countering of substance use-relatedproblemsInter-Sectoral Trade Unions Policy GuidelinesNational Youth Development Policy (1977)National Employment Policy (1977)Education and Training Policy (1995)Community Development Policy (1996)Sport Development Policy (1995)Cultural Development Policy (1997)Child Development Policy (1996)

Section 3
46
3.6 Intervention development
3.6.1 Key concerns
The baseline findings suggest the key intervention concerns listed below.
Key concerns: Community Profile 1
• The use of a wide range of substances
• Substance use among 21-30 year old males; cocaine, heroin and mandrax use among the affluent;multiple substance use among commercial sex workers and street children
• Substance use among spouses/cohabitants
• Beliefs that substance use is no or a slight risk; approval of usage; and the view that substances areeasy to obtain
• Inadequate institutional resources for preventing substance use and related problems
Key concerns: Community Profile 2
• A growing youthful labour force (15-34 year olds) and few employment opportunities
• Female-headed households
• Malaria infection/deaths, HIV/AIDS and substance use-related health care demands
• Severe housing, sanitation, cooking, water, electricity and communication constraints
• Rising crime, e.g. dealing in or being in possession of illicit substances
• Weak law enforcement in respect of substances, bold media marketing of licit substances, and illicittrading through tourists, street vendors and pharmacies
Key concerns: Youth KAP Survey
• All substances, but particularly tobacco, alcohol, cannabis and heroin
• “Heavy” (five cigarettes or more per day), “regular” (daily/weekly) and dependent substance use, aswell as substance use-related injury and fights/arguments
• Early onset (10-14 years) of substance use, especially for illicit substances (e.g. cannabis-mandraxmixture, mandrax, heroin), inhalants, alcohol (e.g. wine, homebrews) and tobacco (e.g. snuff)

United Republic of Tanzania
47
• Starting to use substances by accepting them from family, friends or health care workers, andbecause of curiosity, a need to be socially accepted (to be in/fashionable, to appear modern oraffluent) and have fun
• The typical places where substances are used, e.g. private homes, bushes/bridges
3.6.2 Intervention priorities
The listed concerns and the preferences expressed by community leaders suggest the followingintervention priorities in which young people should participate:
• Programmes that facilitate socioeconomic development and especially employment and substance-free recreation for young people, strengthen substance-related prevention services, reduce substanceavailability, and increase non-approval of use,
• through mobilizing coordinated community groups within existing structures, educationalcampaigns and motivational peer education, and
• insist on outcomes such as
� improved infrastructure,
� improved and integrated/coordinated substance-related services with adequate funding,
� increased licit income generation activities and participation in substance-free recreation amongyoung people,
� increased deterrence of illicit substance trading,
� reduced trade in licit substances,
� consistent anti-substance media messages, non-approval of substance use, and reduced youthsubstance use among especially 10-14 year olds and males.

Section 3
48

Section 4
REPUBLIC OF ZAMBIA

Section 4
50
4.1 Site description
The two adjacent townships of Kanyama and Chinika, in the capital city of Lusaka, were selected for thebaseline assessment in Zambia. At the time of the study, the population of Kanyama totalled 200 000 andthat of Chinika 700. The findings for the two sites are discussed jointly.
4.2 Demographic findings
Table 1 and Figures 1 and 2 present the key demographic findings of the adult and youth survey. Of the 398youths who participated in the survey, 147 were aged 10-15 years and 251 were aged 16-21 years. Sixty-fourpercent (64%) had 1 to 7 years of schooling; 31.9% had 8 to 12 years; 1.0% had 13 to 14 years; and 2.8%had not attended school. Nearly all the young people interviewed regarded themselves as Christians (92.2%).Although the respondents were of school-going age (10-21 years), the majority (60.8%) did not attendschool. Of those who attended school, only 36.7% reported themselves as being full-time students. Inaddition, 81.9% had not worked on a paid job during the previous 12 months. This shows the high level ofunemployment -“non-engagement in constructive activity” among the young people.
Table 1: Demographic profiles of adult and youth KAP study participants
Variable Kanyama and ChinikaAdult (N=150) Youth (N=398)
Sex distribution1. Male ................................................................................... 44.7% .............................................50.3%2. Female ............................................................................... 55.3% .............................................49.7%Religion1. Christian............................................................................. 90.0% .............................................92.2%2. Other and none................................................................... 10.0% ...............................................7.1%Religion considered important .................................................. 66.0% .............................................97.0%Employment/school attendanceFull time ...................................................................................... 0.0% .............................................36.7%Part time .................................................................................... 39.0% ...............................................2.0%Unemployed/not a student......................................................... 61.0% .............................................60.8%Non-response............................................................................... 0.0% ...............................................0.5%Years of formal education1. None..................................................................................... 0.0% ...............................................2.8%2. 1-7 years ............................................................................ 48.0% .............................................64.3%3. 8+ years ............................................................................. 52.0% .............................................32.9%

Republic of Zambia
51
Figure 1: Respondents in Youth KAP Survey (N=398)-(%)
3.5
2
4.432.9
36.7
49.7
50.360.8
60.867.1
76.981.9
9192.2
0 10 20 30 40 50 60 70 80 90 100
Christian faithNo voluntary or unpaid work in last 12 monthsNo paid work in last 12 monthsAttending religious meetings at least once a monthSeven years or less schoolingNot attending schoolNot a studentMaleFemaleFull-time studentEight years or more schoolingNon-Christian faithNo religionPart-time student
Figure 2: Respondents in Adult KAP Survey (N=150)-(%)
10
39
44.7
48
52
55.3
61
63
66
90
0 10 20 30 40 50 60 70 80 90 100
Christian faith
Religion very/pretty important
Attend religious meetings at least once a week
Unemployed in past 12 months
Female
Eight years or more schooling
Seven years or less schooling
Male
Part-time employed in past 12 months
Non-Christian faith; no religion; no response
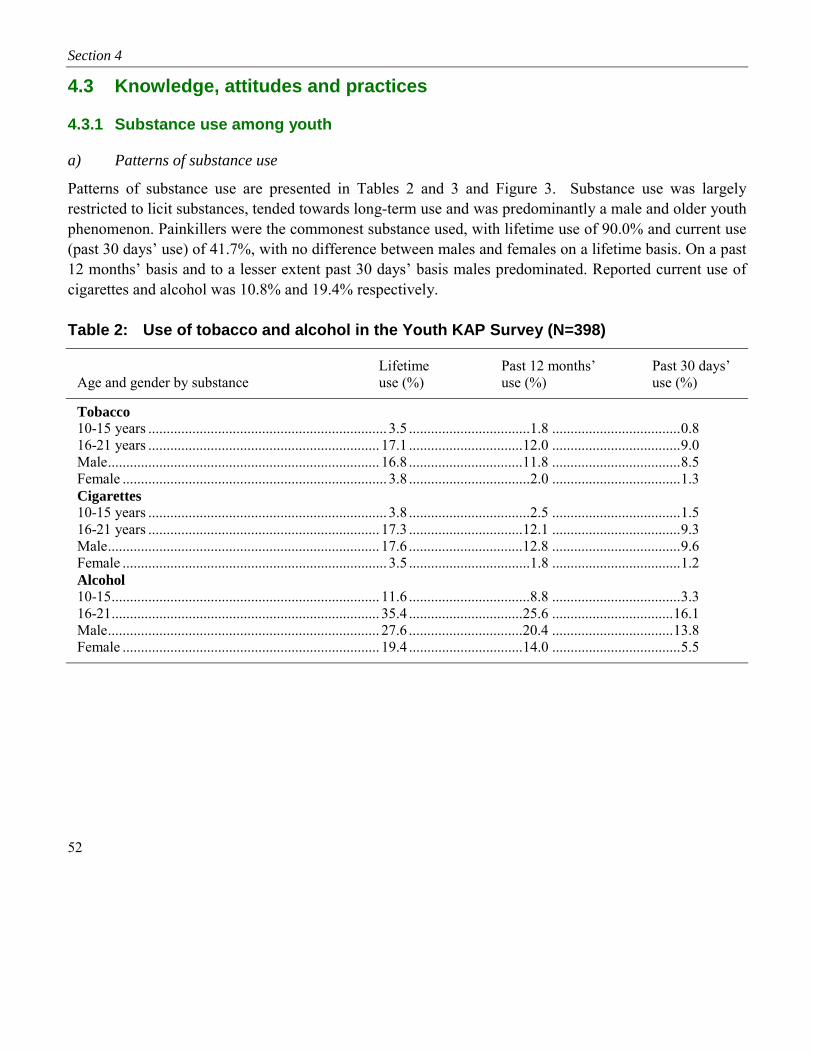
Section 4
52
4.3 Knowledge, attitudes and practices
4.3.1 Substance use among youth
a) Patterns of substance use
Patterns of substance use are presented in Tables 2 and 3 and Figure 3. Substance use was largelyrestricted to licit substances, tended towards long-term use and was predominantly a male and older youthphenomenon. Painkillers were the commonest substance used, with lifetime use of 90.0% and current use(past 30 days’ use) of 41.7%, with no difference between males and females on a lifetime basis. On a past12 months’ basis and to a lesser extent past 30 days’ basis males predominated. Reported current use ofcigarettes and alcohol was 10.8% and 19.4% respectively.
Table 2: Use of tobacco and alcohol in the Youth KAP Survey (N=398)
Lifetime Past 12 months’ Past 30 days’Age and gender by substance use (%) use (%) use (%)
Tobacco10-15 years ................................................................. 3.5 .................................1.8 ...................................0.816-21 years ............................................................... 17.1 ...............................12.0 ...................................9.0Male.......................................................................... 16.8 ...............................11.8 ...................................8.5Female ........................................................................ 3.8 .................................2.0 ...................................1.3Cigarettes10-15 years ................................................................. 3.8 .................................2.5 ...................................1.516-21 years ............................................................... 17.3 ...............................12.1 ...................................9.3Male.......................................................................... 17.6 ...............................12.8 ...................................9.6Female ........................................................................ 3.5 .................................1.8 ...................................1.2Alcohol10-15......................................................................... 11.6 .................................8.8 ...................................3.316-21......................................................................... 35.4 ...............................25.6 .................................16.1Male.......................................................................... 27.6 ...............................20.4 .................................13.8Female ...................................................................... 19.4 ...............................14.0 ...................................5.5
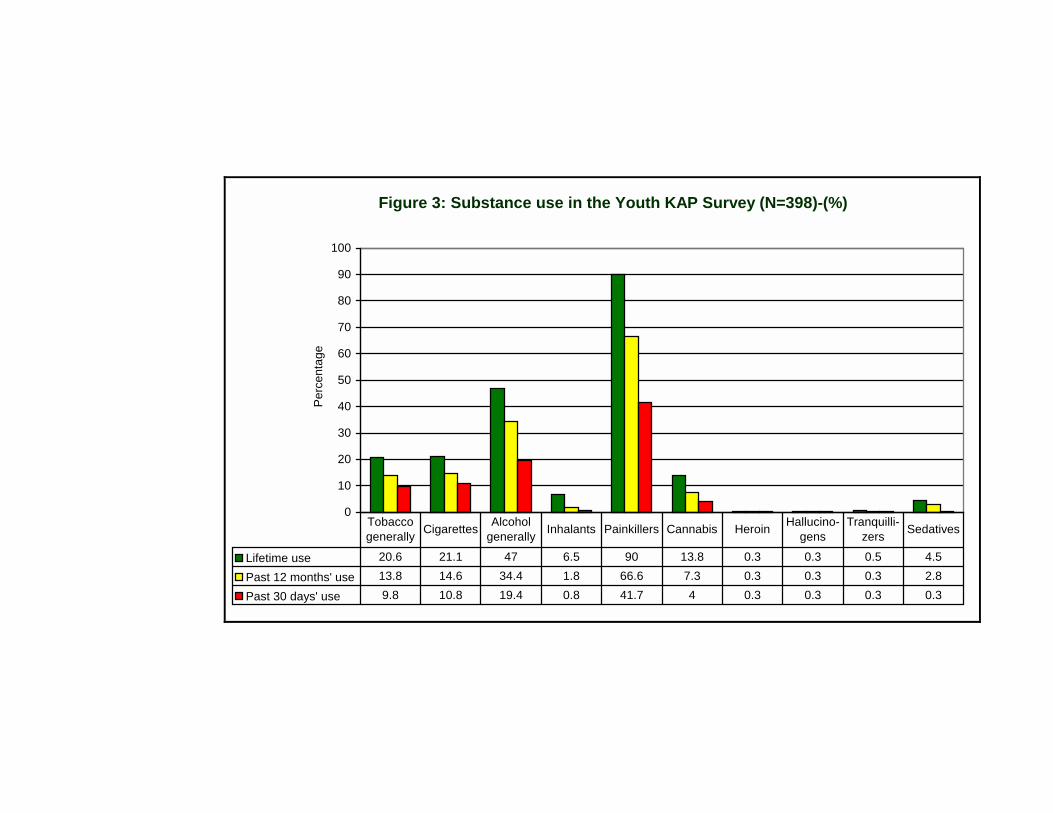
Figure 3: Substance use in the Youth KAP Survey (N=398)-(%)
0
10
20
30
40
50
60
70
80
90
100
Perc
enta
ge
Lifetime use 20.6 21.1 47 6.5 90 13.8 0.3 0.3 0.5 4.5
Past 12 months' use 13.8 14.6 34.4 1.8 66.6 7.3 0.3 0.3 0.3 2.8
Past 30 days' use 9.8 10.8 19.4 0.8 41.7 4 0.3 0.3 0.3 0.3
Tobacco generally Cigarettes Alcohol
generally Inhalants Painkillers Cannabis Heroin Hallucino-gens
Tranquilli-zers Sedatives

Section 4
54
Table 3: Use of cannabis, inhalants and painkillers in the Youth KAP Survey (N=398)
Lifetime Past 12 months’ Past 30 days’Age and gender by substance use (%) use (%) use (%)
Cannabis10-15........................................................................... 1.8 .................................1.0 ...................................0.316-21......................................................................... 12.0 .................................6.3 ...................................3.7Male.......................................................................... 10.6 .................................5.8 ...................................3.5Female ........................................................................ 3.2 .................................1.5 ...................................0.5Inhalants10-15........................................................................... 1.5 .................................0.3 ...................................0.316-21........................................................................... 5.0 .................................1.5 ...................................0.5Male............................................................................ 5.5 .................................1.5 ...................................0.8Female ........................................................................ 1.0 .................................0.3 ...................................... -Painkillers10-15......................................................................... 31.9 ...............................23.9 .................................14.616-21......................................................................... 58.1 ...............................42.7 .................................27.1Male.......................................................................... 45.3 ...............................30.9 .................................20.1Female ...................................................................... 44.7 ...............................35.7 .................................21.6
b) Context of substance use
The context of substance use is presented in Table 4 and Figure 4. Onset of substance use tended to be inmid-adolescence, with male youngsters starting earlier than female youngsters (except in the case oftobacco). Social acceptance, enjoyment and curiosity were the typical reasons for first use. Group use anddrinking at public places of entertainment were the norm among past 12 months’ users of alcohol andtobacco, with groups mostly comprising friends. Among past 12 months’ users of tobacco, smoking atsecluded places (e.g. open spaces or under a bridge/bush) was particularly common. Significant others inthe youngsters’ lives set an example of substance use, even “heavy” use, (step) fathers with regard todrinking and smoking (cigarettes/other tobacco) and closest friends in respect of cannabis use (Figure 4).
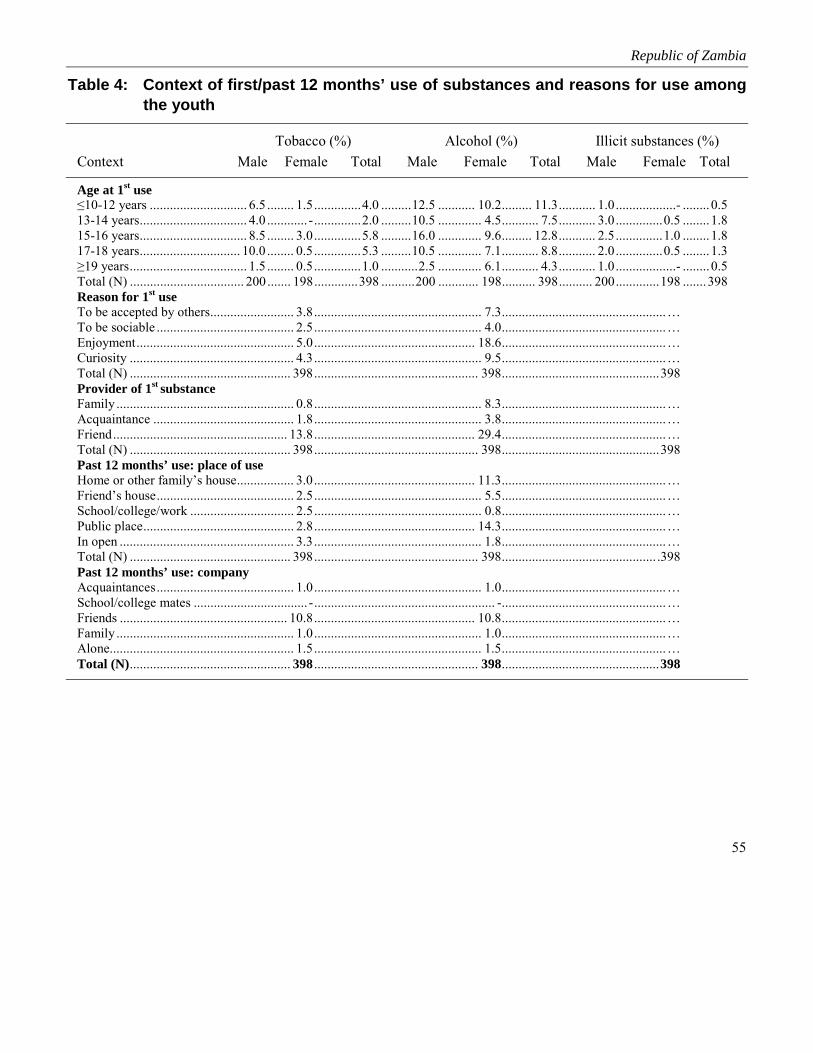
Republic of Zambia
55
Table 4: Context of first/past 12 months’ use of substances and reasons for use amongthe youth
Tobacco (%) Alcohol (%) Illicit substances (%)Context Male Female Total Male Female Total Male Female Total
Age at 1st use≤10-12 years ............................. 6.5 ........ 1.5..............4.0 .........12.5 ........... 10.2......... 11.3........... 1.0..................- ........0.513-14 years................................ 4.0 ............ -..............2.0 .........10.5 ............. 4.5........... 7.5........... 3.0..............0.5 ........1.815-16 years................................ 8.5 ........ 3.0..............5.8 .........16.0 ............. 9.6......... 12.8........... 2.5..............1.0 ........1.817-18 years.............................. 10.0 ........ 0.5..............5.3 .........10.5 ............. 7.1........... 8.8........... 2.0..............0.5 ........1.3≥19 years................................... 1.5 ........ 0.5..............1.0 ...........2.5 ............. 6.1........... 4.3........... 1.0..................- ........0.5Total (N) .................................. 200 ....... 198.............398 ..........200 ............ 198.......... 398.......... 200.............198 .......398Reason for 1st useTo be accepted by others......................... 3.8.................................................. 7.3.................................................…To be sociable ......................................... 2.5.................................................. 4.0.................................................…Enjoyment............................................... 5.0................................................ 18.6.................................................…Curiosity ................................................. 4.3.................................................. 9.5.................................................…Total (N) ................................................ 398................................................. 398...............................................398Provider of 1st substanceFamily ..................................................... 0.8.................................................. 8.3.................................................…Acquaintance .......................................... 1.8.................................................. 3.8.................................................…Friend.................................................... 13.8................................................ 29.4.................................................…Total (N) ................................................ 398................................................. 398...............................................398Past 12 months’ use: place of useHome or other family’s house................. 3.0................................................ 11.3.................................................…Friend’s house......................................... 2.5.................................................. 5.5.................................................…School/college/work ............................... 2.5.................................................. 0.8.................................................…Public place............................................. 2.8................................................ 14.3.................................................…In open .................................................... 3.3.................................................. 1.8.................................................…Total (N) ................................................ 398................................................. 398.............................................. .398Past 12 months’ use: companyAcquaintances......................................... 1.0.................................................. 1.0.................................................…School/college mates .................................. -...................................................... -.................................................…Friends .................................................. 10.8................................................ 10.8.................................................…Family ..................................................... 1.0.................................................. 1.0.................................................…Alone....................................................... 1.5.................................................. 1.5.................................................…Total (N)................................................ 398 ................................................. 398...............................................398

Section 4
56
Figure 4: Substance use among significant others in the Youth KAP Survey (N=398)-(%)
25.4
6.5
7.3
0.3
0.30.3
6.3
6.3
0.8
0.5
0.5
0.5
0.5
0.3
0.3
1.3
28.1
24.1
0.3
0.3
0.3
12.8
27.4
37.2
0.8
0.5
9.5
38.2
46
28.6
0.5
11.1
17.6
0.3
3
2.322.4
0 5 10 15 20 25 30 35 40 45 50
Cigarettes
Non-cigarette tobacco
Cannabis
Mandrax
Hallucinogens
Amphetamines
Sedatives
Tranquillizers
Cocaine
Heroin
Inhalants
Alcohol
Get drunk at least once aweek
Closest friend (Step) father (Step) mother Older siblings
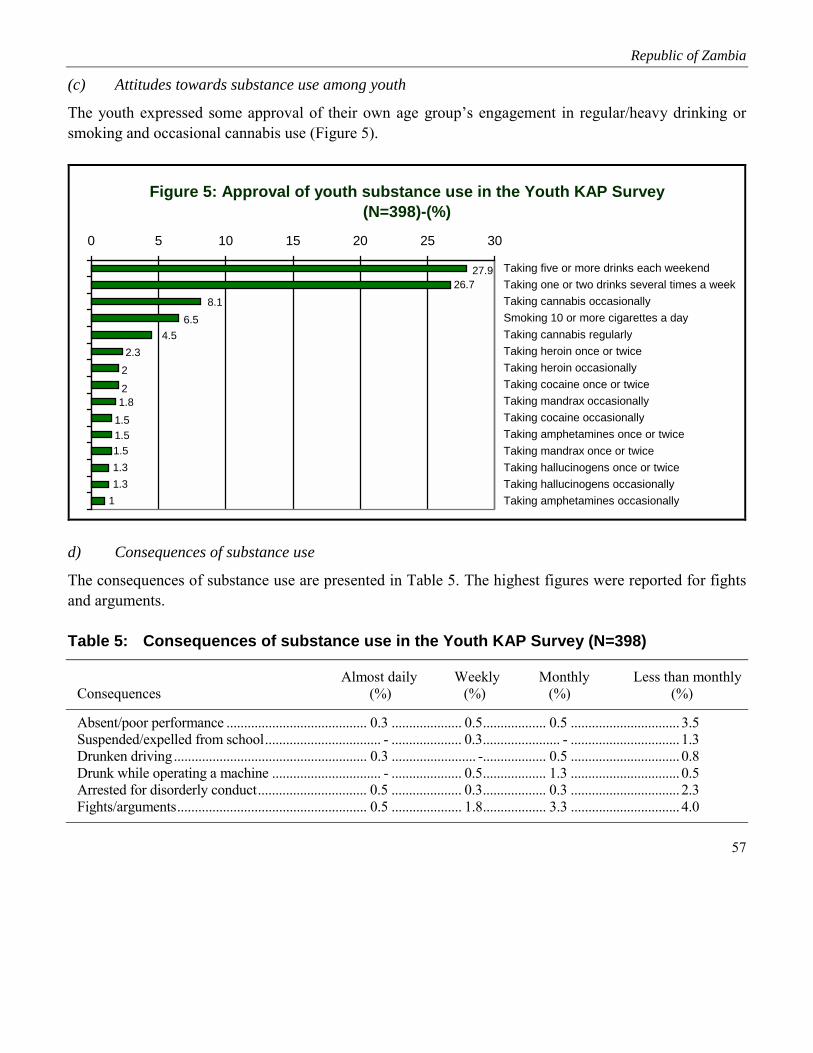
Republic of Zambia
57
(c) Attitudes towards substance use among youth
The youth expressed some approval of their own age group’s engagement in regular/heavy drinking orsmoking and occasional cannabis use (Figure 5).
Figure 5: Approval of youth substance use in the Youth KAP Survey (N=398)-(%)
1.31.3
1
1.51.51.51.82
22.3
4.56.5
8.126.7
27.9
0 5 10 15 20 25 30
Taking five or more drinks each weekendTaking one or two drinks several times a weekTaking cannabis occasionallySmoking 10 or more cigarettes a dayTaking cannabis regularlyTaking heroin once or twiceTaking heroin occasionallyTaking cocaine once or twiceTaking mandrax occasionallyTaking cocaine occasionallyTaking amphetamines once or twiceTaking mandrax once or twiceTaking hallucinogens once or twiceTaking hallucinogens occasionallyTaking amphetamines occasionally
d) Consequences of substance use
The consequences of substance use are presented in Table 5. The highest figures were reported for fightsand arguments.
Table 5: Consequences of substance use in the Youth KAP Survey (N=398)
Almost daily Weekly Monthly Less than monthlyConsequences (%) (%) (%) (%)
Absent/poor performance ........................................ 0.3 .................... 0.5.................. 0.5 ............................... 3.5Suspended/expelled from school................................. - .................... 0.3...................... - ............................... 1.3Drunken driving....................................................... 0.3 ........................ -.................. 0.5 ............................... 0.8Drunk while operating a machine ............................... - .................... 0.5.................. 1.3 ............................... 0.5Arrested for disorderly conduct............................... 0.5 .................... 0.3.................. 0.3 ............................... 2.3Fights/arguments...................................................... 0.5 .................... 1.8.................. 3.3 ............................... 4.0

Section 4
58
(e) Ease of access to substances
Many youngsters believed that it was easy to obtain cigarettes, alcohol (especially beer), painkillers, andto a lesser extent cannabis and sedatives (Figure 6).
Figure 6: View that it is very easy to obtain substances in the Youth KAP Survey (N=398)-(%)
1.51.51.31.3
1.82
8.526.6
47.252.5
65.165.6
80.286.286.9
89.7
0 10 20 30 40 50 60 70 80 90 100
Alcohol generallyCigarettesBeerPainkillersHard liquorHomebrewNon-cigarette tobaccoWineCannabisSedativesTranquillizersMandraxCocaineAmphetaminesHeroinHallucinogens
4.3.2 Substance use among adults
(a) Patterns of substance use
The patterns of substance use among the adults in the KAP survey are presented in Figure 7. Painkillerswere the most common reported substance of lifetime use (93%). Alcohol use was next at 61% andcigarettes at 31%. In the previous 30 days 52%, 39% and 15% of the respondents used respectivelypainkillers, alcohol and cigarettes.
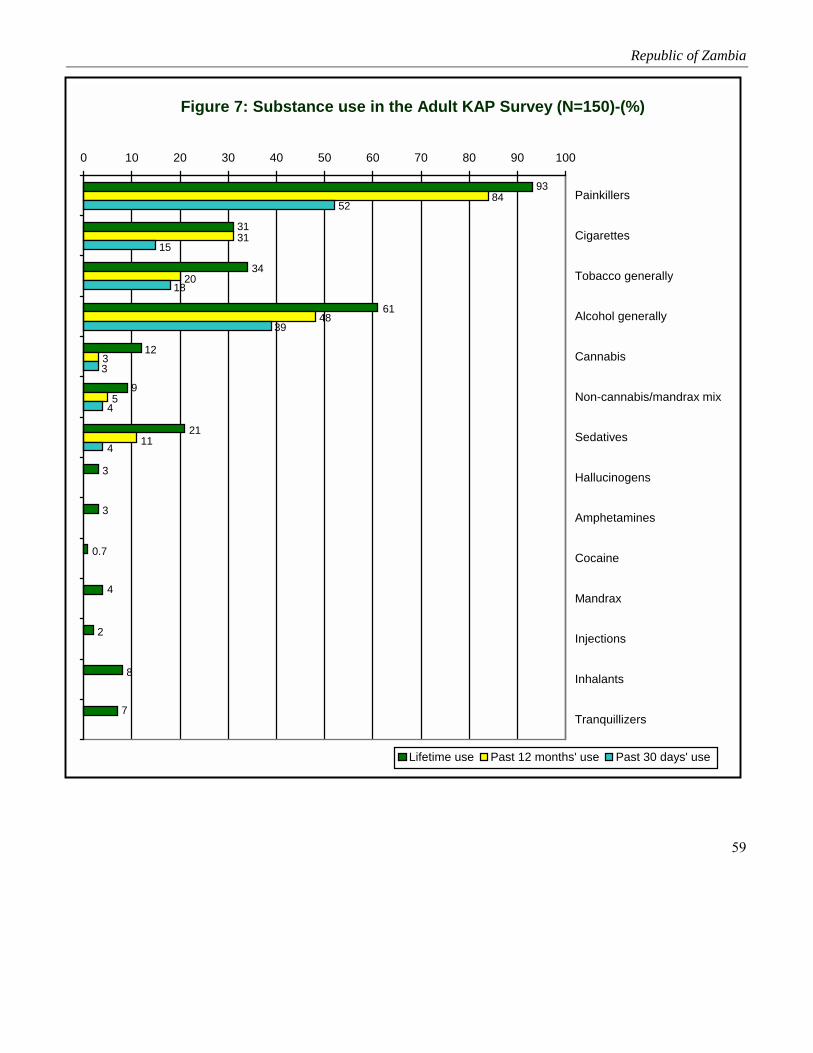
Republic of Zambia
59
Figure 7: Substance use in the Adult KAP Survey (N=150)-(%)
93
31
9
4
7
0.7
3
3
61
34
8
2
21
12
31
11
5
3
48
84
20
4
52
15
4
3
39
18
0 10 20 30 40 50 60 70 80 90 100
Painkillers
Cigarettes
Tobacco generally
Alcohol generally
Cannabis
Non-cannabis/mandrax mix
Sedatives
Hallucinogens
Amphetamines
Cocaine
Mandrax
Injections
Inhalants
Tranquillizers
Lifetime use Past 12 months' use Past 30 days' use

Section 4
60
(b) Context of substance use
The context of alcohol and cannabis use among adults and youth is presented in Figure 8. Social eventssuch as public festivals, weddings, parties and weekends were the commonest occasions for alcohol useamong over 79% of both the youth and the adults. Youth cannabis use was commonest at public festivals(39%), over weekends (36%) and at sport events (33%); the patterns were similar for the adults, thoughthe reported use was lower.
Figure 8: Occasions of alcohol and cannabis use in the Adult/Youth KAP Survey (N=150)-(%)
71
34
94
94
85
91
83
92
45
46
27
85
79
71
79
75
79
4411
33
27
16
21
32
25
15
12
7
39
33
19
17
36
26
7
10
0 10 20 30 40 50 60 70 80 90 100
Religious occasions
Public festivals
Sport events
Weddings
Funerals
Weekends
Parties
At work
With visitors
Adult alcohol use Youth alcohol use Adult cannabis use Youth cannabis use
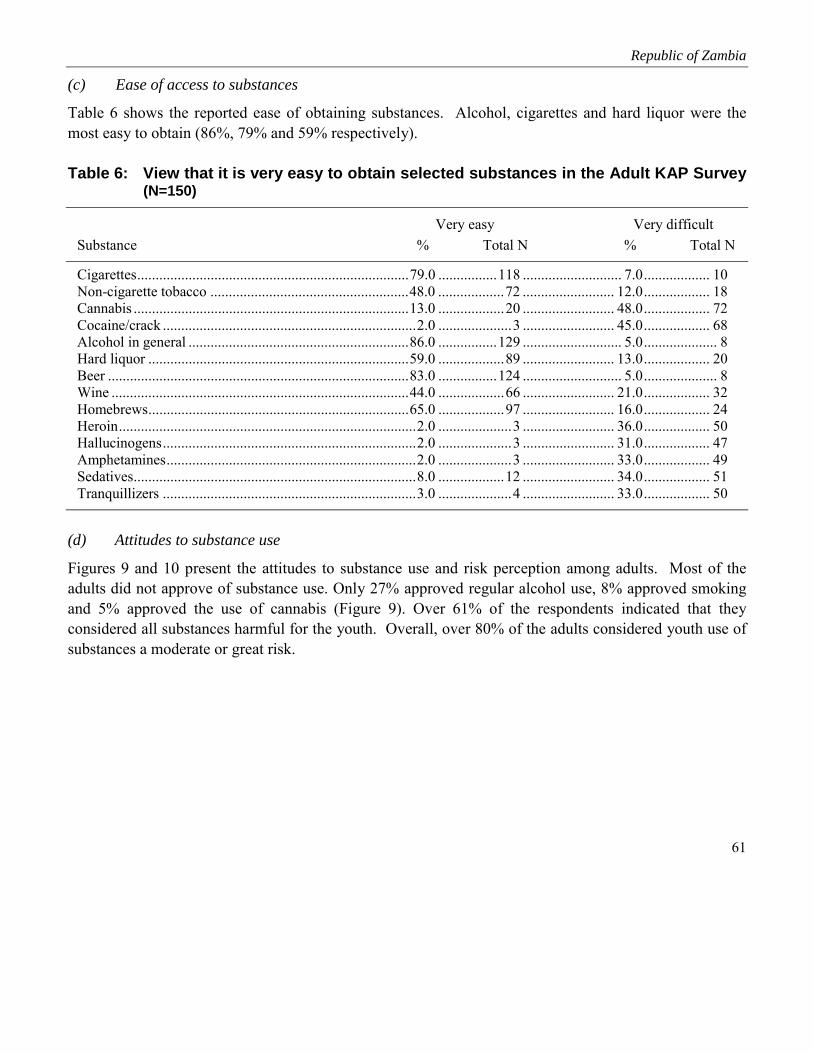
Republic of Zambia
61
(c) Ease of access to substances
Table 6 shows the reported ease of obtaining substances. Alcohol, cigarettes and hard liquor were themost easy to obtain (86%, 79% and 59% respectively).
Table 6: View that it is very easy to obtain selected substances in the Adult KAP Survey(N=150)
Very easy Very difficultSubstance % Total N % Total N
Cigarettes..........................................................................79.0 ................118 ........................... 7.0.................. 10Non-cigarette tobacco ......................................................48.0 ..................72 ......................... 12.0.................. 18Cannabis ...........................................................................13.0 ..................20 ......................... 48.0.................. 72Cocaine/crack .....................................................................2.0 ....................3 ......................... 45.0.................. 68Alcohol in general ............................................................86.0 ................129 ........................... 5.0.................... 8Hard liquor .......................................................................59.0 ..................89 ......................... 13.0.................. 20Beer ..................................................................................83.0 ................124 ........................... 5.0.................... 8Wine .................................................................................44.0 ..................66 ......................... 21.0.................. 32Homebrews.......................................................................65.0 ..................97 ......................... 16.0.................. 24Heroin.................................................................................2.0 ....................3 ......................... 36.0.................. 50Hallucinogens.....................................................................2.0 ....................3 ......................... 31.0.................. 47Amphetamines....................................................................2.0 ....................3 ......................... 33.0.................. 49Sedatives.............................................................................8.0 ..................12 ......................... 34.0.................. 51Tranquillizers .....................................................................3.0 ....................4 ......................... 33.0.................. 50
(d) Attitudes to substance use
Figures 9 and 10 present the attitudes to substance use and risk perception among adults. Most of theadults did not approve of substance use. Only 27% approved regular alcohol use, 8% approved smokingand 5% approved the use of cannabis (Figure 9). Over 61% of the respondents indicated that theyconsidered all substances harmful for the youth. Overall, over 80% of the adults considered youth use ofsubstances a moderate or great risk.

Section 4
62
Figure 9: (Strong) approval of substance use in the Adult KAP Survey (N=150)-(%)
8
5
27
0.7
0.7
3
4
1.3
1.3
31
1.3
0.7
1.3
1.3
1.3
0.7
0 5 10 15 20 25 30 35 40
Smoke 10 cigarettes or moreper day
Take cannabis occasionally
Take cannabis regularly
Take cocaine once or twice
Take cocaine occasionally
Take one or two drinksseveral times a week
Take five or more drinks onceor twice each weekend
Take amphetamines once ortwice
Take amphetaminesoccasionally
Take heroin once or twice
Take heroin occasionally
Use by adults in general Youth use
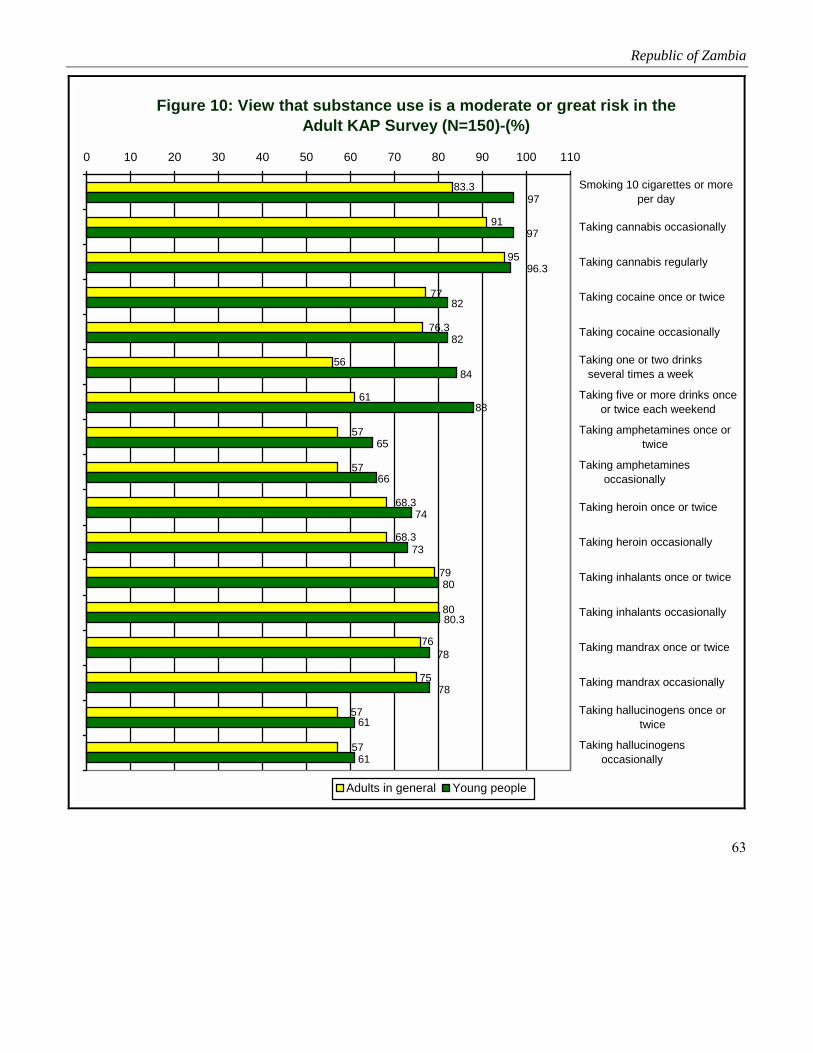
Republic of Zambia
63
Figure 10: View that substance use is a moderate or great risk in the Adult KAP Survey (N=150)-(%)
91
57
76
68.3
56
83.3
68.3
57
57
77
95
57
75
80
79
61
76.3
73
74
97
61
61
78
78
80.3
80
66
65
88
84
82
82
97
96.3
0 10 20 30 40 50 60 70 80 90 100 110
Smoking 10 cigarettes or moreper day
Taking cannabis occasionally
Taking cannabis regularly
Taking cocaine once or twice
Taking cocaine occasionally
Taking one or two drinksseveral times a week
Taking five or more drinks onceor twice each weekend
Taking amphetamines once ortwice
Taking amphetaminesoccasionally
Taking heroin once or twice
Taking heroin occasionally
Taking inhalants once or twice
Taking inhalants occasionally
Taking mandrax once or twice
Taking mandrax occasionally
Taking hallucinogens once ortwice
Taking hallucinogensoccasionally
Adults in general Young people

Section 4
64
e) Substance use dependency and consequences
The consequences of substance use and alcohol dependence are presented in Table 7. Twelve percent(12%) of the adult respondents reported using tobacco daily and 16% reported once- or twice-weekly useof alcohol. Thirteen percent (13%) reported having had adverse consequences such as failure to fulfillresponsibilities, 15% reported drinking-related injuries and 20% reported that community members hadexpressed concern about their alcohol use.
Table 7: Regular/heavy licit substance use and dependent drinking in the Adult KAPSurvey (N=150)
Type of substance use %
Taking painkillers at least once a week in the 12 months before the Adult KAP Survey................................. 8.0Taking tobacco daily in the 12 months before the Adult KAP Survey ........................................................... 12.0Taking alcohol at least once a week in the 12 months before the Adult KAP Survey.................................... 16.0Taking five or more drinks in a row in the two weeks before the Adult KAP Survey.................................... 11.0Inability to stop drinking ................................................................................................................................. 11.0Failure to fulfil responsibilities because of drinking....................................................................................... 13.0(Almost) daily early morning drinking.............................................................................................................. 5.0Guilt/remorse after drinking............................................................................................................................ 23.0Drinking-related injuries ................................................................................................................................ 15.0Expressions of concern from community members about respondents’ drinking ......................................... 20.0
4.4 Community Profile 1: Organizational/institutional and cultural context
The social and organized units’ understanding of substance use is presented in Figure 11. A wide rangeof substances was available, including inhalants, which were frequently used by the youth. Theavailability of alcohol and indiscriminate dispensing of prescription drugs promoted use. Communityleaders were aware that substance use among the youth had reached alarming proportions. As regardscommunity commitment to addressing substance use problems, there was only one community-basedNGO that was involved in youth-related work. There were no specific programmes related to substanceuse. However, community leaders were willing to support any programmes for tackling substance useamong the youth.

Republic of Zambia
65
Table 8: Organized social units’ understanding of substance use
4.5 Community Profile 2: Societal structures and processes
The wider societal picture was drawn from a review of secondary data and a survey of the structures inthe community (Tables 7, 8, 9). The majority of residents lived below the national poverty line (anestimated 86.0% between 1987 and 1997). Employment opportunities were few in the assessment sites.Basic amenities were limited. Water was not necessarily close by or safe, and not free; no formal sewageand waste removal existed; roads were defective; and health care was only available in neighbouringdistricts. Diseases such as tuberculosis, HIV infection and AIDS, and malaria were common. (Theprevalence for tuberculosis was 488 per 100 000 and for malaria 37 500 per 100,000, and the HIV sero-prevalence rates among 15-24 year olds were estimated at 17% for males and 8% for females.) Crime wascommon and on the rise. The 1994 reported arrest rates per 100 000 of the population were 141.8 forburglary, 35.7 for robbery, 15.2 for homicide and 3.7 for rape. Substance use-related offences were rising.Alcohol and tobacco trade outlets were widespread, with the government participating in the productionand distribution of alcoholic beverages. Indiscriminate dispensing of prescription medicine was
Types of substances commonly used
• Alcohol (e.g. illicit homebrews with a high absolute alcohol content such as “kachasu”)• Cigarettes, cannabis, inhalants (e.g. Bolstick (glue), petrol)
Substance use patterns/trends
• Men and young people, especially orphans and youngsters from broken homes
Contributors to substance use
• Broader socioeconomic conditions: poverty, high unemployment, limited recreational facilities/diversion;availability of alcohol and tobacco; small-group conditions: family/peer support of drug use, limited parentalguidance/care; indiscriminate dispensing of prescription medicine at pharmacies
Consequences of substance use
• Lawlessness/criminal activity (e.g. theft)
Community resources• Community leaders aware of importance of addressing substance use among the youth• Existing community structures: Kanyama Youth Programme Trust, Kanyama Health Centre, ward political
leaders (ward councillors)• Residents willing to support initiatives shown to be to their benefit

Section 4
66
customary at pharmacies. The Drug Enforcement and Control Agency was the main institution involvedin substance use counter activities. However, except for enforcing legal statutes it was not involved inprevention initiatives.
Table 9: Retail alcohol and tobacco outlets
Residential area “Kachasu” (illicit homebrew) Other alcohol Tobacco
Chinika .....................................................................8 ..............................................4 ................................. 14Old Kanyama............................................................3 ..............................................8 ................................. 21Section A..................................................................5 ..............................................7 ................................. 19Section B ................................................................10 ............................................13 ................................. 24Section C ................................................................11 ..............................................7 ................................. 14Section D..................................................................3 ..............................................4 ................................. 17Section E ................................................................13 ..............................................6 ................................. 33Section F...................................................................6 ..............................................5 ................................. 10Section G..................................................................5 ..............................................8 ................................. 24Section H..................................................................7 ..............................................8 ................................. 16
Table 10: Amount (kilogram) of substances seized by Zambian police (1995-1997)
Amount (kilogram) seizedType of drug seized 1995 1996 1997
Cannabis herb.....................................................................................4,291.0 ............... 7,794.0............. 11,176.0Cocaine (base & salts) ...............................................................................1.8 ...................... 4.4...................... 6.5Heroin....................................................................................................152.6 .................. 0.940............No reportMorphine ...................................................................................................0.5 ............No report ............No reportOpium (raw and prepared) ........................................................................0.2 ...................... 2.3...................... 0.1Synthetic narcotics ......................................................................... No report ............No report ...................... 0.9Psychotropic substances (depressants excluding methaqualone)..............0.5 ...................... 0.8............No reportMethaqualone (mandarx) ................................................................19,550.0 ...................... 2.8................. ….0.0Stimulants..............................................................................................282.3 ...................... 0.1...................... 0.1Khat ..................................................................................................39,888.8 ............No report .................... 40.1

Republic of Zambia
67
Table 11: Broader societal context of substance use prevention—Zambian sites
Type of units Main servicesPrimary prevention programmes/projects,
objectives, targets, strategies, resources,level of commitment
Government• Dept of Health, Dept of Education (e.g. basic
schools), Police
Non-government• Kanyama Youth Programme Trust• Political parties’ offices/ward
councillors/chairpersons• Churches, neighbourhood (health) committees• Residents’ development committees• Mother support groups, peer education groups
Networks• The government body, Drug Enforcement
Commission, operates as the main/overarchingagency for the prevention/control of psychoactivesubstance use
• Community activism is rare, although residentsoccasionally mobilize concerted action, e.g. tosupport orphaned children, and the provision of waterand housing to residents
Government• Health-related services
through community healthworkers and healthpromotion services
• Substance educationprogrammes
• Drug EnforcementCommission(control/prevention ofpsychoactive substance useand related harm)
Non-government• Substance-related
awareness/ educationprogrammes
Overall objectives: No information availableon programme priorities for prevention ofsubstance use; strategies are non-specific andpart of general health promotion/education;peer counselling and supply reduction –noinformation available
Programme/project resources, efficacy andsustainability
Constraints• Limited advocacy/organized protest• Limited psychoactive substance-related
prevention• Lax law enforcement with regard to
prescription medicine• Limited community support of government
initiatives to reduce/regulate trade inhomebrews, as the latter is a means ofeconomic survival

Section 4
68
4.6 Intervention development
4.6.1 Key concerns
The baseline findings suggest the key intervention concerns listed below.
Key concerns: Community Profile 1
• Use and approval of alcohol, cigarettes and to a lesser extent cannabis, especially among men
• Dependent drinking
• Adult belief that it is very easy to obtain licit substances and to some extent cannabis
• Constraints in mobilizing and sustaining substance-related prevention services
Key concerns: Community Profile 2
• Few employment opportunities for young people
• Illnesses such as tuberculosis and HIV/AIDS, and difficulty to obtain health care
• Few basic amenities
• Extreme poverty
• Crime such as robbery/burglary and rising substance-related offences
• Many liquor/tobacco trade outlets
• Indiscriminate pharmacy dispensing of prescription medicine
Key concerns: Youth KAP Survey
• Male use of alcohol, tobacco and to some extent cannabis, and female use of painkillers, especiallyamong 15-16 year olds
• Long-term use of licit substances
• Initiating substance use for social acceptance, enjoyment and curiosity
• Group use/pressure to use substances, especially at public places of entertainment in the case ofdrinking and in secluded places in the case of tobacco
Republic of Zambia
69
• Substance use among close associates, i.e. drinking/smoking among (step) fathers, and cannabis useamong close friends
• Substance-related incidents, especially fights/arguments
• Approval of heavy drinking/smoking and occasional cannabis use
• Belief that it is easy to obtain licit substances and to some extent cannabis and sedatives
4.6.2 Intervention priorities
The listed concerns and the preferences expressed by community leaders suggest the followingintervention priorities in which young people should participate:
• Programmes that facilitate socioeconomic development and especially employment opportunitiesfor young people, strengthen substance-related prevention services, reduce the availability ofespecially licit substances, and increase non-approval of use,
• through mobilizing coordinated community groups within existing structures, educationalcampaigns (e.g. via theatre/drama) and motivational peer education, and
• insist on outcomes such as
� improved infrastructure,
� increased youth educational, employment and substance-free recreational opportunities
� increase in and integration of substance-related services
� reduced number of liquor/tobacco trade outlets, reduced youth access to liquor/tobacco tradeoutlets, and increased deterrence of trade in illicit substances and of illicit trade in prescriptionmedicine
� increased opposition to substance use, and reduced youth substance use, especially among maleyouths and 15-16 year olds.

Section 4
70
Section 5
DISCUSSION AND CONCLUSION
72
Discussion
The objective of the Global Initiative is to prevent and reduce the use of psychoactive substances amongyoung people through involvement of the communities they live in. The results of the baselineassessment in the participating sites in Southern Africa confirm that young people are vulnerable on manyfronts. The living conditions, especially in Zambia and to a lesser extent in the urban South African siteswere such that they typically had limited access to basic amenities; were at risk of being affected byHIV/AIDS; and had limited employment prospects. Additional factors that increased vulnerabilityincluded their living in single-parent or guardian households and the general decline of socioeconomicstatus of the communities. The surveys in the participating sites showed that both adult and youthsubstance use was common, especially among males, and age of first use was as low as 10 years. Ingeneral, even among the youth in all sites, there was widespread use of alcohol and tobacco and agenerally high level of adult tolerance of alcohol and tobacco use among the youth. Significant othersand social groups also played an important role in the initiation of all types of substance use, in particularalcohol and tobacco. The range of other psychoactive substances was wide and included injectablesubstances, although they were not used in significant amounts. Cannabis and painkillers were apparentlyused very commonly among both urban and rural youth. A large number of youths reported that their firstcontact with psychoactive substances was actually through supplies provided by health workers. Thecommonest substances used were easy to obtain and youngsters commonly used substances at placeswhere there was little or no censure. Zanzibar had the widest range of substances used by youngsters.These included mandrax, heroin and cocaine. In Zambia indiscriminate distribution of prescriptionmedication such as painkillers and sedatives was widespread. Dependence and other adverse alcoholeffects were only reported among adults and was a cause of concern. As regards resources for preventionin the communities surveyed, the rural/high-density areas in Zambia had limited resources and servicesfor prevention. In the urban settings, only South Africa showed a significant level of commitment to thefight against substance use, with specific programmes targeting the youth. In the other sites, very feworganizations or networks worked directly on substance use prevention. In all sites, community factorsconducive for intervention included the recognition by adults and key opinion leaders of the importanceof prevention and the willingness to support such efforts. Some of the sites also had strong religiousprescriptions against substance use and grassroots organizations that provide social services focusing onthe youth.
73
Conclusion
The baseline findings on the participating sites call for broad-based interventions that give equal weight tosupply and demand reduction; target young people as well as their associates; improve young people’sliving conditions; and ensure that community agencies and young people mobilize towards preventiveaction. The broad categories of interventions tailored to each site should include strategies to reduce theavailability of substances; mobilize communities against substance use; provide peer education to preventtaking up substance use; enhance behaviour change; strengthen existing networks of organizations thatsupport youth-related activities and engage in substance use prevention activities; and provide communityresources including funding for programmes on substance use prevention.

74
Bibliography
This report represents a summary of the baseline assessments conducted in the three African countries.The more detailed information will be made available on the WHO website. The bigger baseline reportcontains other studies. The research institutions participating in the studies carried out literature reviewsbefore the primary data were collected. The bibliography below is a compilation of some key documentsand articles used in the literature review and referenced in the bigger baseline report.
GeneralAguirre-Molina M & Gorman DM (1995). The Perth Amboy community partnership for youth: Assessing its effects
at the environmental and individual levels of analysis. International Quarterly of Community Health Education,15(4):363-378.
Bukoski WJ (1991). A framework for drug abuse research. Rockville: National Institute on Drug Abuse.
Edwards G et al. (1994). Alcohol policy and the public good. Oxford: Oxford University Press.
Flay BR & Petraitis J (1991). Methodological issues in drug use prevention research: Theoretical foundations.Rockville: National Institute of Drug Abuse.
Frischer M & Heatlie H (2001). Modelling drug misuse in Europe using geographic information systems. In: EuropeanMonitoring Centre for Drugs and Drug Addiction, Modelling drug use: Methods to quantify and understandhidden processes. Luxembourg: Office for Official Publications of the European Communities.
Harrison L & Luck H (1996). Drinking and homelessness in the UK. In: Harrison L, Alcohol problems in thecommunity. London: Routledge.
Jessor R Graves et al. (1968). Society, personality and deviant behavior. New York: Holt, Rinehart and Winston.
Kerlinger FN (1973). Foundations of behavioral research. 2nd ed. New York: Holt, Rinehart and Winston.
Kuna MJ & Bande TM (1993). Capitalism and drugs: A critique of conventional theories of substance abuse. In: ObotIS (ed.), Epidemiology and control of substance abuse in Nigeria. University of Jos, Jos, Nigeria: Centre forResearch and Information on Substance Abuse (CRISA).
Neuman WL (1997). Social research methods. Qualitative and quantitative approaches. Toronto: Allyn & Bacon.
Plant M & Plant M (1992). Risk-takers. Alcohol, drugs, sex and youth. London: Routledge.
World Health Organization (2000). Primary prevention of substance abuse. A workbook for project operators.Geneva: World Health Organization.
United Nations Development Programme (1995). World Summit forSocial Development. New York: United Nations.
United Nations Development Programme (1997). World Drug Report. 1997. Oxford: Oxford University Press.
Bibiography
75
United Nations Office for Drug Control and Crime Prevention (2000). World Drug Report 2000. Oxford: OxfordUniversity Press.
World Health Organization (1999). Global Status Report on Alcohol 1999. Geneva: World Health Organization.
World Health Organization (1994). Lexicon of Alcohol Drug Terms. Geneva, Switzerland.
World Health Organization (2000). The World Health Report 2000. Geneva: World Health Organization.
South AfricaBradshaw D et al. (2001). Health status review. In: Ntuli A, Crisp N, Clarke E & Barron P (eds) 2001, The South
African Health Review 2000. Durban: Health Systems Trust.
Crime Information Analysis Centre (2000). The reported serious crime situation in South Africa for the periodJanuary-December 1999. Pretoria: South African Police Service.
Crime Information Analysis Centre (2002). The reported serious crime situation in South Africa for the periodJanuary-December 2001. Pretoria: Crime Information Analysis Centre.
Department of Social Development (2000). The state of South Africa’s population report. Population, poverty andvulnerability. 2000. Pretoria: Department of Social Development.
Emmett AB (2001). In: Rocha-Silva Lee. SA-ADAM: South African survey of drug-crime connections amongpersons entering the criminal justice system. Pretoria: Human Sciences Research Council. (Unpublishedresearch report.)
Emmett T & Butchart A (eds) (2000). Behind the mask. Getting to grips with crime and violence in South Africa.Pretoria: Human Sciences Research Council.
Everatt David (2000). From urban warrior to market segment? Youth in South Africa 1990-2000. DevelopmentUpdate. Quarterly Journal of the South African National NGO Coalition and Interfund, Vol. 3(2).
Ntuli A, Crisp N, Clarke E & Barron P (eds) (2001). The South African Health Review 2000. Durban: HealthSystems Trust.
Parry C (2001). Alcohol and other drug abuse. In: Ntuli A, Crisp N, Clarke E & Barron P (eds) 2001. South AfricanHealth Review 2000. Durban: Health Systems Trust.
Poverty and inequality in South Africa (1998). Durban: Fishwicks.
Rocha-Silva L (1992). Alcohol/drug-related research in the RSA: Meeting the challenge of the 1990s. Pretoria: HumanSciences Research Council.
Rocha-Silva Lee (2001). SA-ADAM: South African survey of drug-crime connections among persons entering thecriminal justice system. Pretoria: Human Sciences Research Council. (Unpublished research report.)
Rocha-Silva Lee (1998). The nature and extent of drug use and the prevalence of related problems in South Africa:National surveillance. Pretoria: Human Sciences Research Council.
Saloojee Y (2001). Tobacco control. In: Ntuli A, Crisp N, Clarke E & Barron P (eds) 2001. South African HealthReview 2000. Durban: Health Systems Trust.
Bibliography
76
Shopley J (2001). Alcohol advertising/sponsorship/counter-advertising/labeling. Research document forDepartment of Health. Johannesburg: SANCA National Office (unpublished report on focus group and in-depth interviews in the Global Initiative country report).
Southern African Development Community (SADC) Drug Control Committee (2001). Annual report—July 2000to June 2001. Gaborone: SADC Regional Drug Control Programme.
Statistics South Africa (2000). Stats in brief 2000. Pretoria: Statistics South Africa.
The Impending Catastrophy (2000): A Resource Book on the Emerging HIV/AIDS Epidemic in South Africa.Parklands: LoveLife.
Van der Spuy J and Marais S (2000). Trauma epidemiology data: Application in the prevention of injury and crime.In: Emmett T & Butchart A (eds) (2000), Behind the mask. Getting to grips with crime and violence in SouthAfrica. Pretoria: Human Sciences Research Council.
Wilson F and Ramphele M (1989). Uprooting poverty. The South African challenge. New York: WW Norton andCompany.
The United Republic of TanzaniaBarnum H (1944). The Economics of Tobacco Trade: Enabling the Transition. Tobacco Control, Vol. 3(4)
Basic Statistics in Education (1966-2000). National Data (June, 2001). Ministry of Education and Culture, Dar esSalaam, Tanzania.
Bureau of Statistics (1997). President’s Office, Planning Commission. Dar es Salaam, Tanzania.
Comoro CJ & Mmari F (1995). A Sociological Perspective of Youth Substance Misuse in Tanzania. Paperpresented at Workshop on Youth Growth and Related Problems in Tanzania, 19-21 October, Dar es Salaam.(Abstract in SSOSMED Monogram No. 3.)
Desjarlais R et al. (1995). World mental health: Problems and priorities in low-income countries, Chapter 10, pp.241-243. Oxford University Press
Hali ya Uchuni wa Taifa (Economic Review) (1999), (June 2000) Planning Commission, Dar es Salaam, Tanzania.
Tanzania Tobacco Processing and Marketing Board Act (1984), Dar es Salaam, Tanzania.
Hill RF & Fortenberry J (1992). Adolescence as a Culture Bound Syndrome. Science and Medicine, Vol. 35(1):73-80.
International Council on Alcohol and Addictions (1988). Project Report. Demand Reduction Practices World-Wide. Review of Innovative Approaches related to the Reduction of Demand for Dependence ProducingDrugs. Problems of Drug Education.
Kaali SN (1992). Prevalence of drug abuse among secondary school students in Dar es Salaam. Field ProjectReport, Department of Community Medicine, Muhimbili University College of Health Sciences of theUniversity of Dar es Salaam.
Kaaya SF et al. (1992). Prevalence of substance abuse among secondary school students in Dar es Salaam.Tanzania Medical Journal, 7(1):21-24.

Bibiography
77
Kilonzo GP (1983). Production and Consumption of Alcohol in Tanzania. Alcohol Monopoly Systems. Report No.18. Finland, Pub. Finish Institute of Alcohol Studies.
Kilonzo GP & Maselle AY (1986). Substance misuse in Tanzania. Tanzania Medical Journal, 3(1):21-22.
Kilonzo GP (1992). Consumption of alcohol in Tanzania – country description. In: Kilonzo GP & Pitkanen T (eds),Report of Alcohol Research Project in Tanzania. University of Helsinki.
Kilonzo GP (1992). Reduction of Demand for Dependence Producing Drugs – the Tanzanian Experience. Paperpresented at the International Conference Centre, 20-24 January.
Kilonzo GP (1999). Drug abuse situation – Tanzania country report. Paper presented to the African HarmReduction Network, Lagos, December.
Martin P & Cohen AY (1971). Understanding Drug Abuse and Adults. Guide to Drugs and the Young. Harper andRaw, New York
Mbatia J & Kilonzo G (1996). Drug abuse prevention. A hand book for educators in Tanzania, pp. 11-16.MEHATA publication.
Mbatia J (1998). Tobacco in Tanzania. A Situational Analysis Country Report for WHO Africa, Tanzania.
Mbatia J (1998). Tobacco in Tanzania. A Situational Analysis Country Report for WHO, July.
Mmbwambo J (1999). School-Based Health Promotion Pilot Study in Dar es Salaam Region. University of BergenReport.
Musoke IK (1997) Alcohol and Drug Abuse in Tanzanian Schools: Experiences from Dar es Salaam. ResearchReport for Alcohol and Drug Information Centre (ADIC), Dar es Salaam, Tanzania, September
Ministry of Health (1999). Health Statistical Abstract, Vol. I & II (November, 2000). Ministry of Health, Dar esSalaam, Tanzania.
National Profile (1988). Population Census, Basic Demographic and Socio-Economic Characteristics (September,1992). Bureau of Statistics, President’s Office, Planning Commission, Dar es Salaam, Tanzania.
National Bureau of Statistics (1999). Reproductive and Health Survey (November 2000). Dar es Salaam, Tanzania.
National AIDS Control Programme (1999). HIV/AIDS/STD Surveillance, Report No.14, December 1999(September, 2000), Dar es Salaam, Tanzania.
Kaplam HI & Sadok BJ (1994). Human Development Throughout the Life Cycle. In: Synopsis of Psychiatry. 7th
ed., Chapter 2, pp. 16-76.
Lauthan S (1988). Dealing with Substance Abuse in General Practice. In: Ebie JC & Toungue EJ (eds), Handbookof the African Training Course on Drug Dependence. ICAA/CIPAT University of Benin, Nigeria.
Prevention of Illicit Traffic of Narcotics and Psychotropic Substances and Drug Abuse (1987). InternationalConference on Drug and Illicit Trafficking, Vienna, United Nations, June.
World Bank (1993). Human Resource Development Survey (HRDS).

Bibliography
78
ZambiaOrganization of African Unity (1999, March). Minutes of the Second Experts Meeting on Drug Control in Zambia.
Lusaka.
World Bank (1993). Human Resource Development Survey (HRDS
Senderowitz J (1995). Meeting the needs of young adults. Popul. Rep. J., Oct. (41):1-43. Review.
United Nations Development Programme (2000). Human Development Report 2000. Oxford: Oxford UniversityPress.
United Nations Office for Drug Control and Crime Prevention (1999). The drug nexus in Africa. Vienna: UnitedNations Office for Drug Control and Crime Prevention.
United Nations Office for Drug Control and Crime Prevention (1999). Global illicit drug trends 1999. New York:United Nations Office for Drug Control and Crime Prevention.