success factors for computerized road management systems christopher r. bennett east asia transport...
TRANSCRIPT

Success Factors for Computerized Road
Management SystemsChristopher R. Bennett
East Asia Transport Unit

2
Background
• Highway agencies require tools for proper planning and programing of road investments
• Road management systems (RMS) have two componentsSoftware to store and process dataBusiness processes to use RMS to
make decisions

3
RMSFramework
Treatm ent byRoad SectionRMMS
RoutineMaint.
PeriodicMaint.
Additional DataCollection and
Detailed Design
Specific Treatm entPer Section
RoutineMaintenance Per
Section
Im provem ent
ProjectMonitoring
CentralDatabase
PMS
BMS
BridgeMaintenance
Requirem ents
Feasibility S tudy
GISInterface
Accidents TrafficEnviron-
ment
Key Data
NetworkDefinition
ConditionSurveys
InventorySurveys
Traffic Data
AccidentData
SpecialisedRoad
Surveys
RoadCentreline
Rem oteSensing
Other SpatialData
Lin
ea
r R
efe
ren
ce D
ata
Sp
atia
l Re
fere
nce
Da
ta
DigitalPhotographs
V ideos
Key Data

4
RMS Functions
• Major activities include:Needs Assessment;Strategic Planning, including budgeting
for new development and asset preservation
Development, under budget constraints, of multi-year works expenditure programs
Data collection

5
Project Impetus
• Donors have supported many countries to implement RMS and supply data
• Anecdotal evidence suggested RMS not used to full potential
• Conducted project to determine the factors leading to successful RMS implementations
• Funded by Transport and Rural Infrastructure Services Partnership (TRISP)
• Findings should influence design of future projects

6
Approach
• Project developed a standard questionnaire covering all aspects of RMS development and implementation
• Consultants visited 21 agencies in 17 countries for 1-2 days for interviews
• Focus on national road agencies, but some provincial agencies included
• Interviewed a range of personnel, usually in planning, asset management and IT
• Direct surveys allowed for in depth interviews and exploring responses

7
Team
Kevin McPherson Lead Consultant/Report Author
Indonesia and USA
Chris Bennett Manager/Report Co-Author
Sukomal Chakrabarti India and Bangladesh
Zuwei Deng China
Arnaud Desmarchelier Bukina Faso and Cameroon
Gerardo Flintsch Argentina, Chile Costa Rica, and Uruguay
Jens Hede Botswana, Mozambique, and Tanzania
Nabin Pradhan New Zealand and Papua New Guinea
8
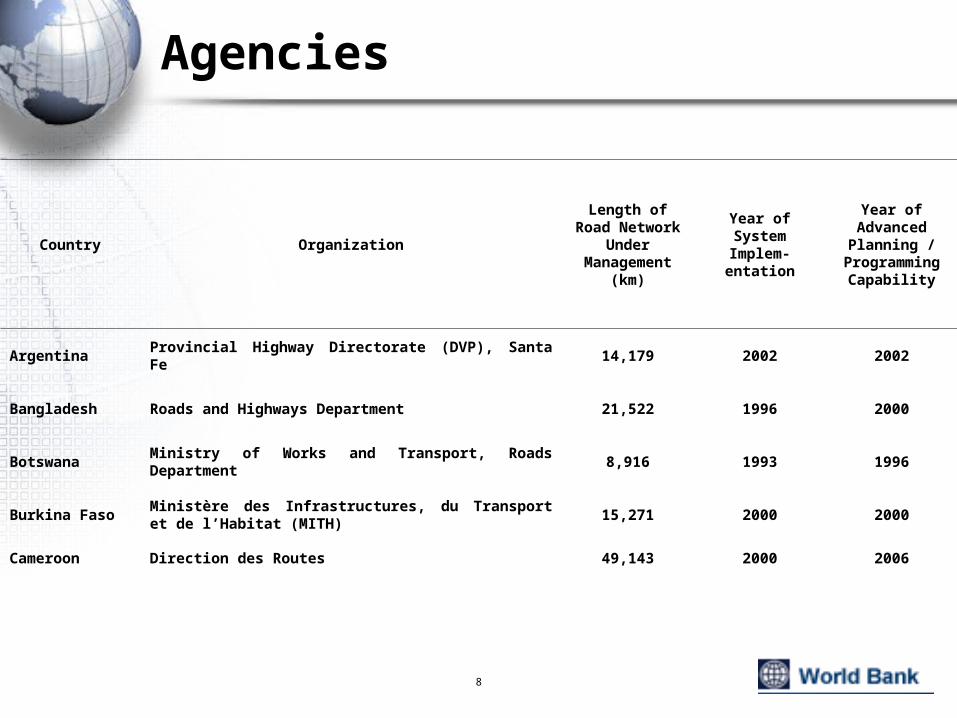
Agencies
Country Organization
Length of Road
Network Under
Management (km)
Year of SystemImplem-entation
Year of Advanced Planning /
Programming Capability
Argentina Provincial Highway Directorate (DVP), Santa Fe 14,179 2002 2002
Bangladesh Roads and Highways Department 21,522 1996 2000
BotswanaMinistry of Works and Transport, Roads Department
8,916 1993 1996
Burkina FasoMinistère des Infrastructures, du Transport et de l’Habitat (MITH)
15,271 2000 2000
Cameroon Direction des Routes 49,143 2000 2006

9
Agencies Continued …
Chile Ministry of Public Works 80,672 1980 1985
China Fujian Provincial Highway Administration Bureau 36,000 2002 -
China Henan Highway Administration Bureau 70,000 2003 2003
China Hubei Provincial Highway Administration Bureau 89,674 2003 -
Costa RicaMinistry of Public Works and Transportation
(MOPT), & National Road Board (CONAVI)7,424 1998 1998
India National Highways Authority of India (NHAI) 24,000 Developing 1997
India Public Works Department, Government of Kerala 22,991 Developing 2005
IndiaPublic Works Department, Government of
Rajasthan82,024 1996 1996
Indonesia Directorate General of Regional Infrastructure 35,000 1985 1990

10
Agencies Continued …
Mozambique Administração National de Estradas (ANE) 12,902 1997 1997
New Zealand Transit New Zealand (TNZ) 10,786 late 1980's 1998
New Zealand Papakura District Council 280 1998 1998
Papua New Guinea
Department of Works 27,500 2000 2004
TanzaniaMinistry of Works, Tanzanian National Roads
Agency28,892 2001 2002
Uruguay National Highway Directorate (DNV) 8,680 1999 1999
USA Vermont Agency of Transportation 5,310 1995 1995

11
The Key to Success
Processes People
Technology
FundingFunding
Funding
Successful projects properly address all three factors

12
Technology

13
Technology
• Key Success Factor:The IT components should be
appropriate
• To Achieve This:Need a strong IT division – or outsourceNeed an IT strategyRMS must fit into IT strategyRMS must be properly supported from
an IT perspective

14
IT Management
• IT is a challenge to all organizations
• Any sizable organization implementing an RMS should have a separate IT division
• They need to define IT PolicyStrategy for development and use of IT
across the agencyConsistent IT implementations

15
IT Management Skills
• Project Found:5/21 agencies had no separate IT
Divisions6/16 remaining had significant IT
vacanciesAbout 50% of agencies short of basic IT
staff

16
IT Support?
• 2/21 reported that IT Division does not bother with Planning Division needs: more concerned with other business functions such as financial management
• General impression in IT Divisions of road agencies that Planning Divisions do not perform a critical function and therefore do not get high priority for IT funding and support
• Few agencies had sufficient overall IT budget

17
Ratio of Users to IT Staff
0
50
100
150
200
250P
ap
ua
Ne
w G
uin
ea
Bu
rkin
a F
aso
Ba
ng
lad
esh
US
A (
Ve
rmo
nt)
Mo
zam
biq
ue
Ch
ina
(F
ujia
n)
Uru
gu
ay
Ta
nza
nia
Bo
tsw
an
a
Ch
ina
(H
ub
ei)
Co
sta
Ric
a
Ch
ile
Ra
tio
of
Us
ers
to
IT S
taff

18
IT Architecture and Standards
• ‘Technology Architecture’ is a series of principles, guidelines and rules directing the IT process
• Framework which all IT infrastructure should be established
• Should support applications and data required to perform business functions
• Without formal architecture and procurement control there will be a piecemeal IT implementation resulting in higher costs and reduced efficiency

19
Commercial Off-the-Shelf (COTS) Software
• Most large commercial organizations have policy of using COTS instead of custom software because: Lower cost Independence – many consultants Timeframe –
implemented much faster Experience – reflects inputs and testing from a
larger number of users Functionality – more functions Ongoing development – continual upgrades and
improvements Exchange of ideas – conferences and other users

20
COTS - Disadvantages
• Requirements – Functionality may not be exactly what is required
• Customization – time to develop new ideas may take longer since other clients also need to be taken care of
• Cost – agency may have problems meeting ongoing support and maintenance agreements

21
COTS - Recommendations
• COTS from a good supplier is almost always preferable to custom development
• Many packages available
• Careful review and assessment required prior to procurement
• Biggest issue is that client’s business processes do not exactly match the softwareSoftware can usually be modifiedOften, business processes should be
improved

22
Outsourcing
• IT infrastructure is complex, and getting worse
• Outsourcing often beneficial to agencies Ensures up-to-date skills are available More in depth support (often 24 x 7) Often faster response times (no funding
limitations) Eliminates staff recruitment and retention
problems
• Requires strong, local IT companies
• Some larger RMS suppliers host both software and data with access through VPN

23
Integration with Other Systems
• TORs too vague on requirements:“The Consultant shall integrate the
client’s Road Management System with xxx”
• Must ensure that TORs are explicit with the interfacing requirements and expectations of clients

24
Web-Enabled Systems
• Many TORs call for “web-enabled” RMS
• Prior to deciding to web-enable need to determine: Is this required? What is the scope of the web-enabling
• Issues: Internal vs external audience? Is there sufficient IT infrastructure available? What functions require web-enabling? Reports?
Data access? Everything? Should maps be available? If yes, will they be
static or dynamic?

25
Web-Enabling Continued …
• Data issues are very importantDoes the agency have the right to
publish all the data (some may be from other sources)
Must have metadata available or there will be misunderstandings data (eg meaning, accuracy, how recent, who collected it, reliability)
• Web-enabling requires very careful planning and a good TOR
26
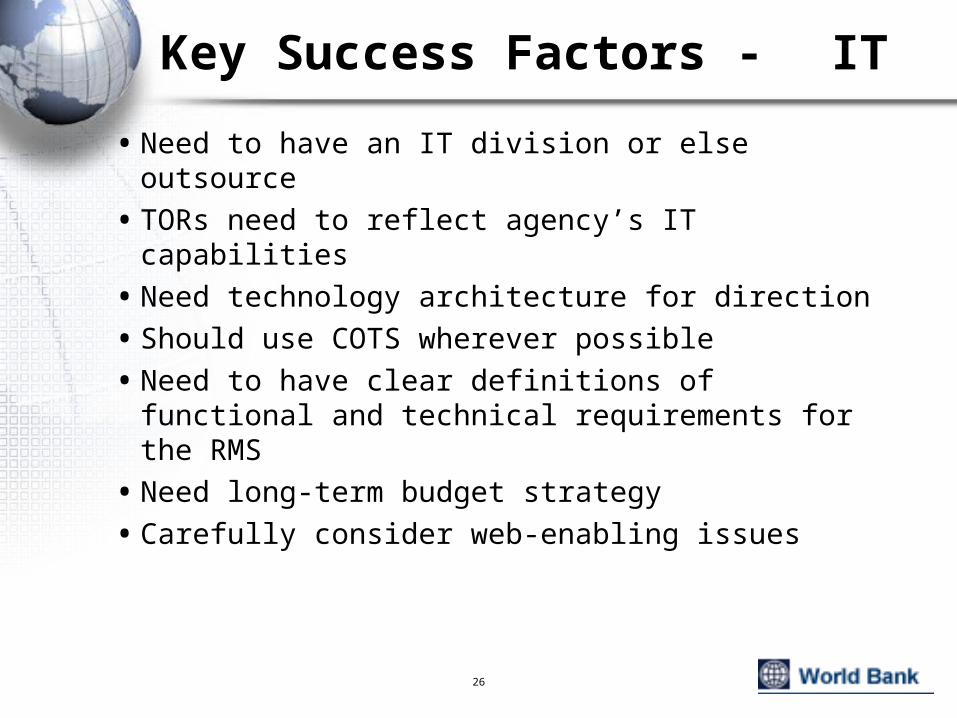
Key Success Factors - IT
• Need to have an IT division or else outsource
• TORs need to reflect agency’s IT capabilities
• Need technology architecture for direction
• Should use COTS wherever possible
• Need to have clear definitions of functional and technical requirements for the RMS
• Need long-term budget strategy
• Carefully consider web-enabling issues

People
28
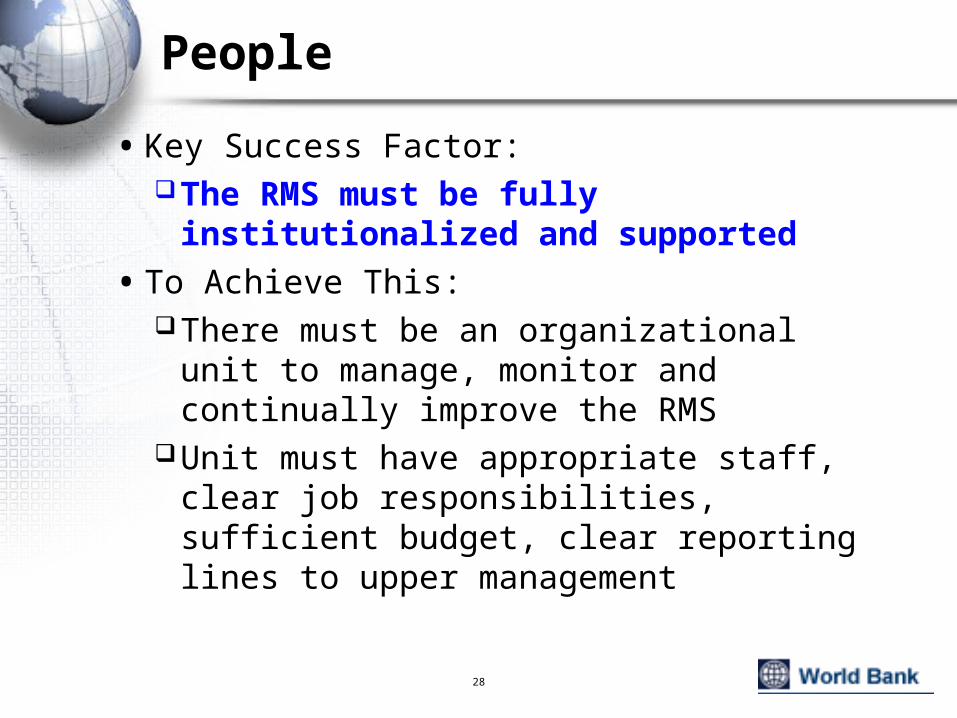
People
• Key Success Factor:The RMS must be fully institutionalized
and supported
• To Achieve This:There must be an organizational unit to
manage, monitor and continually improve the RMS
Unit must have appropriate staff, clear job responsibilities, sufficient budget, clear reporting lines to upper management

29
Institutionalization
• NZ and USA have well institutionalized and supported systems
• Few agencies interviewed in developing countries have ‘institutionalized’ their RMS12/21 had no job descriptions for RMS
staff10/21 had no formal data QA
procedures12/21 did not perform hit-rate analyiss

30
Comments from Agencies
• Tanzania: “ambiguous job descriptions with overlapping tasks… it has not been clear who was doing what”.
• Argentina: “Approximately ten staff members were trained and almost all have left the group”
• India: “The inventory updating was not completed … because the person making the efforts left on a 5-year leave”
• Botswana: “The PMS section comprises five positions, but all were vacant at the time of the survey”

31
Training
• Need to ensure that staff are trained in all elements of the RMS, from data collection procurement through management
• Most agencies claimed 5-10 days a year of training
• Bangladesh supports higher education (eg master’s degrees)
• Several countries reported training was carried out only at the end of the project just before consultant demobilized
• Few, if any, projects had produced complete (or any) training materials
32
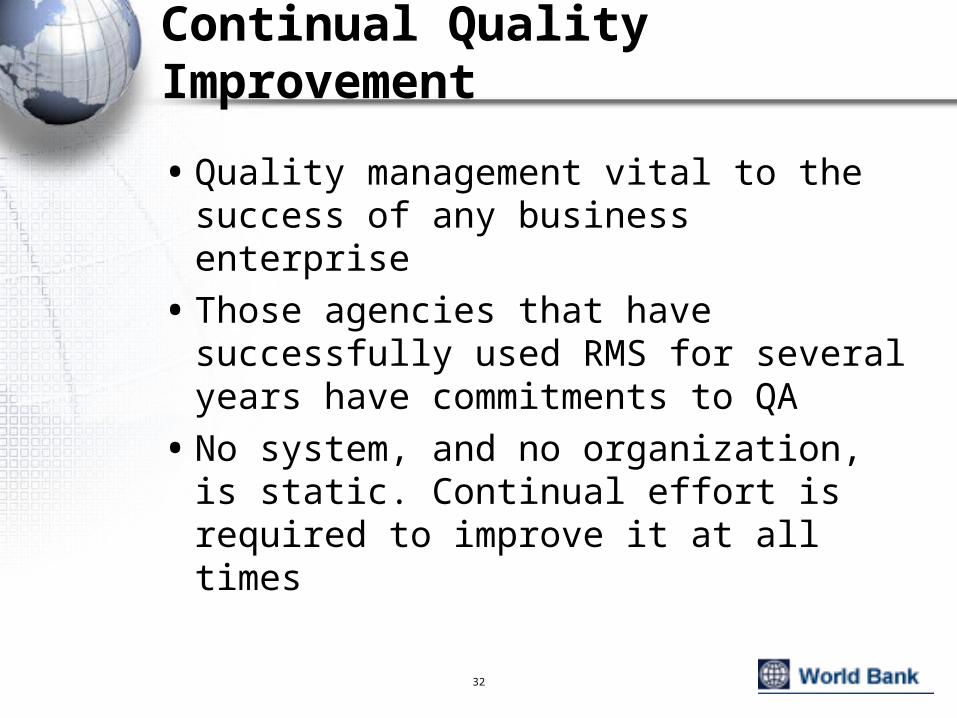
Continual Quality Improvement
• Quality management vital to the success of any business enterprise
• Those agencies that have successfully used RMS for several years have commitments to QA
• No system, and no organization, is static. Continual effort is required to improve it at all times

33
Key Success Factors - People
• Organizational unit dedicated to RMS
• Budget allocated for all aspects of system
• Clear job descriptions and a career path
• Jobs filled with appropriate quality staffRoad network managementData collectionData QAManagement reporting
• Continual training and development
• Commitment to continual improvement

34
Processes

35
Processes
• Key Success Factor:The RMS must have an active role in the
agency
• To Achieve This:The RMS must be an integral part of the
agency’s monitoring and planning processOutputs should be used to prepare annual
reports to ensure data are regularly collected and the system applied

36
Annual Reports
• Provide a structured framework for reporting the performance of the agency and plans
• Elements typically includeKey performance indicatorsFive-year goalsAnnual asset management planFinancial plan
• Relying on RMS for input to report helps ensure sustainability

37
Annual Report Extract – Transit New Zealand

38
Annual Report Extract – New South Wales RTA

39
Needs Assessments
• Key functions of RMS to:Justify budgetsDirect investments where most benefits
• Needs analysis ‘unconstrained’ analysis which determines total network needs
• Only about half agencies perform such an analysis
• One third who could do the analysis do not

40
Asset Management Budgets
• Sign of effective use of RMS is effective use for allocating funds to maintenance
• Study found wide variations between agencies

41
Budget Allocation For Asset Preservation
0
10
20
30
40
50
60
70
80
90
100C
hin
a (H
en
an
)
Ch
ina
(Hu
bei
)
Ch
ina
(Fu
jian
)
Ba
ng
lad
esh
Ta
nza
nia
Bo
tsw
an
a
Ind
ia (R
aja
sth
an)
Uru
gu
ay
Ind
on
esia
Mo
zam
biq
ue
Ne
w Z
eal
an
d(T
ran
sit)
Ch
ile
US
A (V
erm
on
t)
Pe
rcen
tag
e o
f To
tal B
ud
ge
t fo
r A
sse
t P
res
erv
atio
n

42
Accuracy of Forward Work Program
• Most RMS used to prepare forward work programs
• Predict future investment needs on section-by-section basis
• Prior to implementation agencies need to conduct a “hit-rate” analysis to confirm correctness of predictions
• Only 4 of 17 agencies (Chile, NZ x 2, Vermont) performed such an analysis

43
AgencyImplementation of Planning / Programming
CapabilityHit Rate Analysis
Argentina (Santa Fe) 2002 No
Bangladesh 2000No. Planning on doing one in 2006 after
condition data updated in 2005
Botswana 1996 No
Burkina Faso 2000 Calibration test sections only
Cameroon 2006 No
Chile 1985 Yes
China (Fujian) No No
China (Henan) 2003 No
China (Hubei) No No
Costa Rica 1998 No
India (Rajasthan) 1996 Not done
India (NHAI) 1997 System being Developed
Indonesia 1990 Preliminary
Mozambique 1997 No
New Zealand (TNZ) 1998 Yes
New Zealand (PDC) 1998 Yes
Papua New Guinea 2004 No
Tanzania 2002 No
Uruguay 1999 No
USA (VTrans) 1995 Yes

44
Implementation of RMS Program
• What is the degree to which the actual predicted program is implemented?
• Indication of importance of RMS to planning process
• Few systems designed to monitor this

45
Key Success Factors - Processes
• Agency must follow basic asset management principles
• Annual Reports/Business Plans should be prepared using RMS outputs to monitor performance
• Asset value should be monitored
• Must be commitment of leadership to RMS
• Provide annual budgets for data collection and operation of RMS
• Have policies and procedures for RMS operation, data collection, and other processes
• Need a program of continual quality improvement and auditing
46
Data Collection
47
Data Collection
• Data collection must be appropriate and sustainable
• Only collect:The essential dataAt the minimum level of detailWith the most appropriate technology given
the agency’s constraints and capabilities
• Agency must have explicit data collection policies and procedures
• There must be strict data QA procedures

48
Findings
• Most agencies had problems with data collection
• Both in-house and contracted data were problematic (for different reasons)
• Not easy to contract out data collectionRequires many checks and good
contract managementNeed liquidated damages for poor
performance
• Only 50% of agencies did any formal QA on data

49
Agency Data Quality Assurance Procedures
Argentina (Santa Fe) No
Bangladesh Formal documentation/Manual
Botswana No
Burkina Faso No
Cameroon No
Chile Yes (applying for ISO certification)
China (Fujian) Some formal documentation
China (Henan) Some formal documentation
China (Hubei) Some formal documentation
Costa Rica No
India (NHAI) Some formal documentation
India (Kerala) No
India (Rajasthan) No
Indonesia No
Mozambique No
New Zealand (TNZ) Yes
New Zealand (PDC) Yes
Papua New Guinea Yes
Tanzania Yes
Uruguay No
USA (VTrans) Yes

50
Conclusions

51
Success
• Depends on the convergence of processes, people and technology
• If any are weak or fail then the RMS will be compromised
• Overall satisfaction Everyone 5/10 (several are not using system) Using System 7/10 (COTS – 7.5; Custom 6.5)
• Too many projects focus on technology and underestimate processes/people issues
• Need to spend most effort on institutionalization and not technology

52
Agency Overall Satisfaction
Argentina (Santa Fe) 7.5
Bangladesh 6
Botswana 7.4
Burkina Faso 8.5
Cameroon 6
Chile 7
China (Fujian) (not used)
China (Henan) (not used)
China (Hubei) (not used)
Costa Rica 5
India (NHAI) (under development)
India (Kerala) (under development)
India (Rajasthan) (not used)
Indonesia 6
Mozambique 5.5
New Zealand (TNZ) 8
New Zealand (PDC) 8
Papua New Guinea 5
Tanzania 6.7
Uruguay 8
USA (VTrans) 9.9

53
The end …