success rate evaluation of severe storm phenomena and
TRANSCRIPT

Success Rate Evaluation of Severe Storm Phenomena and Flash
Floods Forecasting
DAVID ŠAUR
Regional research centre CEBIA-Tech
Tomas Bata University in Zlin
Faculty of Applied Informatics, Nad Stranemi 4511,760 05, Zlin
CZECH REPUBLIC
Abstract: - This article focuses on proposal new methods to predict strong convective storms that can cause
flash floods. Flash flood is determined by the interaction of a number of factors such as the very intense
convective precipitation (torrential rainfall accompanied by hail and strong wind gusts), slow motion of
convective storms and the soil saturation. These factors have been included in the Algorithm of Storm
Prediction, whose prediction results are presented in the two outcome of this article. The result section
contains an assessment of the success rate of predictions of convective precipitation and storm intensity, which
is complemented by the evaluation of the prediction success rate of severe storm phenomena. Primarily, the
goal of the algorithm is to provide predictive information about risk of flash floods that comprise all the above
mentioned outputs. Secondarily, the orieintally overview of other forecast outputs is part of the second result
section.
Key-Words: - Weather forecasting; convective storm; torrential rainfall; hailstorm; strong wind gusts; flash
floods; meteorological radars; crisis management; NWP models.
1 Introduction Natural disasters are one of the most significant
threats to contemporary society, particularly
disasters caused by the weather in the Czech
Republic and the world. These are mainly floods,
storms, and gales. Floods represent one of the most
significant direct hazards for the Czech Republic,
where there are significant losses in life and
economic losses. Floods caused by steady rain
significantly affected the Czech Republic in years
of 1997, 2002 and 2006. Flood damage amounted
to nearly 150 billion. Moreover, dozens of people
were killed as a result of heavy rainfall. Floods
caused by torrential rainfall (called "Flash floods")
have started to occur regularly in the Czech
Republic since 2007. Nevertheless, this type of
floods has become a current issue of crisis
management. At the same time a threat to our entire
society due to their high frequency of intensity and
short duration of severe storm phenomena,
especially torrential rainfall, which are one of the
leading causes of the flash floods [1, 2, 3].
Severe storm phenomena associated with strong
severe storms are one of the impacts of global
climate change with a natural uneven occurrence
[5]. Typical consequences of global climate change
are the global increase of surface temperature and
atmospheric humidity caused by the melting of
glaciers, frozen land and sea ice [4, 6], which
contributes to growing the frequency of these
extreme weather events and also flash floods.
The possibilities of flash floods prediction are
still insufficient due to a large number of
parameters that affect the formation of flash floods.
The reason for the low success rate of predicting
intense torrential rainfall and other dangerous
phenomena is their local occurrence in a tiny area
of several km2 with a short duration (approximately
ten of minutes). Current forecasting systems such
as numerical weather prediction models (NWP
models), nowcasting systems and expert
meteorological systems allow predicting the
occurrence of torrential rainfall with relatively low
success and short lead times. The prediction of
intense convective precipitation by NWP models
has been investigated in many studies [7, 8, 9]. The
fundamental problem of NWP models lies in the
lack of horizontal resolution, the amount of input
data, including the absence of the effect of
orography on the initiation of convection.
Nowcasting systems work with data from radar
rainfall measurements to calculate the motion field
of precipitation using extrapolation methods [10,
11, 12] with a very short lead time (approximately
WSEAS TRANSACTIONS on ENVIRONMENT and DEVELOPMENT David Šaur
E-ISSN: 2224-3496 548 Volume 14, 2018

60 minutes). These systems do not predict
variability of rainfall in time including orographic
influences. Expert meteorological systems combine
previous systems, including conceptual and
statistical models of orography, the use of which is
documented in some papers [13, 14, 15].
Limitations of expert systems are based on the
disadvantages of applied methods. None of these
forecasting tools provide relevant prediction
information with higher prediction accuracy. For
these reasons, the Algorithm of Storm Prediction
was developed to solve these problems. The goal of
the algorithm is to provide a more accurate
predictive information on convective precipitation
and dangerous severe phenomena for the early
warning of flash floods with the possibility of
deploying preventive flood control measures.
2 Methods The prediction of intense convective precipitation,
which is one of the leading causes of the flash
floods, is solved through these systems and
algorithms with forecast lead time:
1. System Integrated Warning Service of CHMI
with forecast lead time 24 hours.
2. The algorithm of Storm Prediction with lead
time 6-24 hours.
System Integrated Warning Service of CHMI
provides prediction warning information on
dangerous phenomena related to severe storms for
the territory of the regions and districts, shown
below in Table 1:
Table 1. Classification of dangerous phenomena [16]
Colour
The degree of
storm
intensity
Rainfall intensity,
dangerous phenomena
Weak storms below 29 mm/hr., heavy
rainfall
Strong storms
30-49 mm/hr., heavy
rainfall, hail and strong
wind gust
Very strong
storms
50-89 mm/hr., heavy
rainfall, hail, strong wind
gust and tornadoes
Extremely
strong storms
above 90 mm/hr., heavy
rainfall, hail, strong wind
gust and tornadoes
However, the territory of regions and districts is
relatively large, so it is essential to use a predictive
tool to provide more accurate predictive
information on the occurrence of convective
precipitation and other dangerous phenomena. This
predictive tool is the Algorithm of Storm Prediction
proposed in the dissertation work of the author of
this article.
2.1. Algorithm of Storm Prediction The Algorithm of Storm Prediction was developed
as a desktop application to provide predictive
information on severe convective storms. This
algorithm uses the principles of analysis and
evaluation of predictive meteorological elements
and parameters from NWP models, including the
evaluation of orography effects and the use of a
database of approximately 200 historical weather
situations [3].
The output of the algorithm is a report that
contains prediction information:
precipitation occurrence - municipalities with
extended powers (MEP) and its regions,
time of precipitation occurrence and
forecast lead time with 6-24 hr [3].
Fig. 1 demonstrate that predictive algorithm
outputs are computed through ten phases. The null
phase is focused on converting input data from
NWP models and other sources (database of
historical situations and relief characteristics, alerts
from CHMI and ESTOFEX) to coefficient values in
the interval 0-3.
Fig. 1. Flowchart of Algorithm of Storm Prediction [3]
Forecasting outputs are computed for each 3-
hour interval separately. In the first phase, 3-hour
intervals are determined on the forecast of
precipitation from seven NWP models with a
horizontal resolution of fewer than 11 km. The
second phase summarizes crucial predictive
information, in particular about the warnings of the
CHMI and ESTOFEX. The third phase predicts
conventional properties in the atmosphere. The
WSEAS TRANSACTIONS on ENVIRONMENT and DEVELOPMENT David Šaur
E-ISSN: 2224-3496 549 Volume 14, 2018
fourth stage predicts conditions of temperature,
humidity and airflow in the boundary layer of the
atmosphere including orographic effects to predict
the conditions for the initiation of atmospheric
convection. This phase forms the core of a
precision forecast of the probability of convective
precipitation. The fifth phase predicts the storm
intensity, which is compared with the warnings of
the CHMI and ESTOFEX. The occurrence
probability of dangerous phenomena such as
torrential rainfall, hail, strong wind gusts and
tornadoes are predicted in the sixth phase. The aim
of the seventh phase is merging outputs from third
to sixth phases, which are accompanied by a
statistical prediction of convective precipitation in
the eighth phase. The ninth phase summarizes and
visualizes these forecast outputs to maps for the
MEP and regions:
− general characteristics of the predicted situation
(alg.)
− forecast of the probability of convective
precipitation occurrence (alg.),
− forecast of storm intensity (alg.),
− forecast of the risk of flash floods (alg.),
− forecast of time probability and precipitation
occurrence (NWP models) and
− forecast of the risk of dangerous phenomena
(alg.).
− statistical prediction of the probability of
convective precipitation (alg.) [3, 4].
The situation associated with flash floods are
analyzed and evaluated by boldly marked
prediction outputs.
Predictive outputs are calculated as their
probability values, which is recalculated to
coefficient values in the range from 0 to 3
according to the formula:
,
(1)
where yij are values of the critical matrix Y (values
of coefficients, converted predictive parameters
from NWP models) and vj is the weight of the j-th
criterion which is weighted coefficient values of
predictive parameters. Σn represents the sum of
predictive parameters in a partial or main output
[3].
2.1.1 Forecast of the probability of the rainfall
intensity and its occurrence
This forecast output is calculated from outputs of
the fourth and fifth phase (Storm Intensity + Local
Conditions) according to formula 1. Verification of
this output is performed with data from the
stationary measurement of CHMI network [3].
2.1.2 Forecast of storm intensity
Storm intensity forecast is calculated from partial
outputs of the third phase according to formula 1:
day or night atmosphere instability,
comprehensive support for convection
mechanisms,
deep layer shear in levels 0 - 6 km,
propagation, and motion of storms.
This output is compared with the CHMI alerts
for a dangerous Storm phenomenon for its
verification [3].
2.1.3 Forecast of the risk of flash floods
Risk of flash floods is calculated by combining the
critical prediction algorithm outputs (formula 1):
the degree of soil saturation,
the number of potential risk precipitations in 1
hour,
the probability of convective precipitation,
the storm intensity,
the propagation and motion of storms,
the summary of dangerous phenomena [3].
The risk of flash floods is verified by the Czech
Hydrometeorological alerts, data from the radar and
station measurement of precipitation and flood
events reported by the Fire Rescue Service of the
Czech Republic.
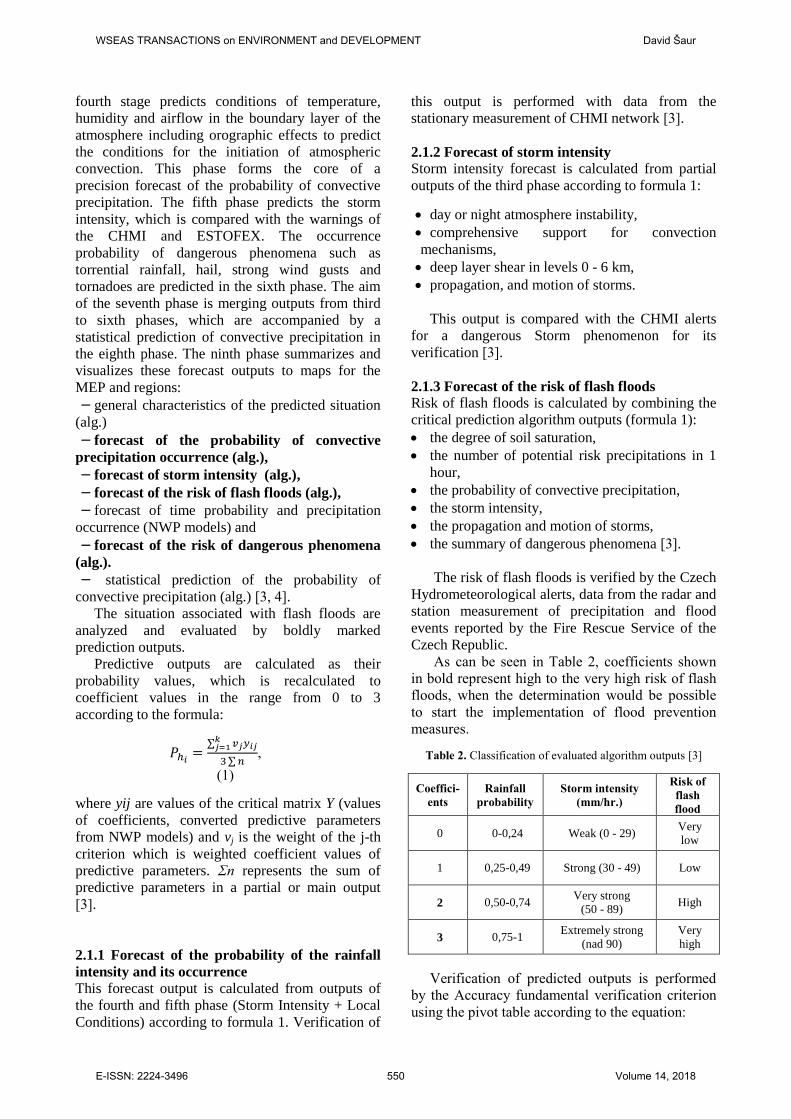
As can be seen in Table 2, coefficients shown
in bold represent high to the very high risk of flash
floods, when the determination would be possible
to start the implementation of flood prevention
measures.
Table 2. Classification of evaluated algorithm outputs [3]
Coeffici-
ents
Rainfall
probability
Storm intensity
(mm/hr.)
Risk of
flash
flood
0 0-0,24 Weak (0 - 29) Very
low
1 0,25-0,49 Strong (30 - 49) Low
2 0,50-0,74 Very strong
(50 - 89) High
3 0,75-1 Extremely strong
(nad 90)
Very
high
Verification of predicted outputs is performed
by the Accuracy fundamental verification criterion
using the pivot table according to the equation:
WSEAS TRANSACTIONS on ENVIRONMENT and DEVELOPMENT David Šaur
E-ISSN: 2224-3496 550 Volume 14, 2018

, (2)
where a is the number of cases where the
phenomenon was predicted and actually occurred; b
is the number of cases where the phenomenon was
not predicted and actually occurred; c is the number
of cases where the phenomenon was predicted and
did not actually occur, and d is the number of
instances when the phenomenon was not predicted
and did not actually occur.
The Accuracy verification criterion is calculated
for each three-hour interval separately, both for
municipalities with extended powers and their
regions according to the equation:
, (3)
where ∑xi is the sum of categories a, b, c, d, which
is evaluated for each situation separately [3].
2.1.4 Forecast of risk of severe storm phenomena
The prediction of the risk of severe storm
phenomena is the seventh predictive phase of
Algorithm of Storm Prediction. This output is
designed to calculate summaries of severe storm
phenomena, which is one of significant predictive
outputs for determining the risk of flash floods.
Coefficients values of the risk of severe storm
phenomena are calculated according to formula 1.
The weights of coefficients values of forecast
parameters for individual severe storm phenomena
were experimentally determined on:
the Check-list document from the Czech
Hydrometeorological Institute,
the percentage of prediction parameters of
severe storm phenomena,
weight parameters determined on the basis of
literature.
The Algorithm predictive output classification
is shown in Table 3. The intensity of the torrential
rainfall corresponds to the predicted output Storm
Intensity from the first result section.
Classification of Hail forecasting is based on the
document [17]. Classification of the prediction
output Strong wind gusts were taken from the
classification of severe storm phenomena of the
Integrated Warning Service System of the Czech
Hydrometeorological Institute [18].
Table 3. Prediction outputs classification of the second result
chapter [17].
Coeffici
ents
Intensity of
torrential
rainfall
(mm/hr.)
Radar reflectivity
(dBZ) measured
by the radar
network CZRAD,
converted on
rainfall intesity
(mm/hr.)
Strong
wind
gusts
(m/s)
0 0 - 29 48 (37) <20
1 30 - 49 52 (65) 20-24
2 50 - 89 56 (115) 25-29
3 above 90 60 (200) >30
Table 3 show the evaluation of Hail forecast
based on the radar precipitation measurements. The
hourly rainfall intensity is calculated by the
Marshall-Palmer formula:
Z = aIb (4)
I = 10(Z-10log(a))/10b. (5)
Where Z is the radar reflectivity in dBZ, I is the
rainfall intensity in mm / h, a and b are
experimentally determined constants (a = 200, b =
1.6) for medium latitudes. Hourly rainfall intensity
values have an exponential trend of the growth
depending on the radar reflectivity [3].
The radar measurement data was obtained from the
CZRAD radar network and the MMR50 X-band
meteorological radar of the Zlín Region.
2.1.3.1 Forecast of risk of torrential rainfall
"The torrential rainfall is a rain of high intensity,
which is predominantly short in the order of several
tens of minutes to hours, and a small area in km2 in
our regions" [19].
Fig. 2 Torrential rainfall
As can be seen in Fig. 2, the torrential rainfall is
caused by a strong rainfall effect of convective
WSEAS TRANSACTIONS on ENVIRONMENT and DEVELOPMENT David Šaur
E-ISSN: 2224-3496 551 Volume 14, 2018
storm due to favorable temperature, humidity and
wind conditions in the atmosphere, especially high
Convective avalaible potential energy (CAPE)
values and Deep layer shear (DLS). The massive
vertical range of the convective cell (over 10 km)
and the terrain orography that can significantly
enhance this phenomenon in terms of upslope
triggering in combination with the ground-level
convergence of air flow are at the same time other
important conditions for the formation of this
severe storm phenomenon (Řezáčová, 2007).
The risk of torrential rainfall is calculated
according to these partial forecast outputs:
speed of storm motion
conditions for the occurrence of severe storm
phenomena (mechanisms to support the
occurrence of severe storm phenomena, storm
intensity and probability of precipitation)
probability of occurrence of torrential rainfall
(6th prediction phase of the algorithm)
The probability of the occurrence of torrential
rainfall is determined on the above-mentioned
forecast parameters [3].
2.1.3.2 Forecast of risk of hailstorm
Hailstorm is precipitation contained by hails, which
is spherical, conical or irregular pieces of ice. It
takes a few minutes and hits very small areas.
Meteorological radars are used for early
identification of the occurrence of this severe storm
phenomenon [19].
Fig. 3 Principle of hailstorm
Fig. 3 illustrate the hailstorm, which is occurred
in the massive vertically convective clouds with
characteristic high velocity air flow of its updraft,
where are applied same conditions as a torrentiall
rainfall. For example, high values of combination
indices convection CAPE and DLS, favorable
temperature and humidity surroundings, e.g. the
zero isotherm level must lie very high, over 4-5 km.
The risk of hailstorm is calculated according to
these partial forecast outputs:
conditions for the occurrence of hailstorm
probability of occurrence of hailstorm [3].
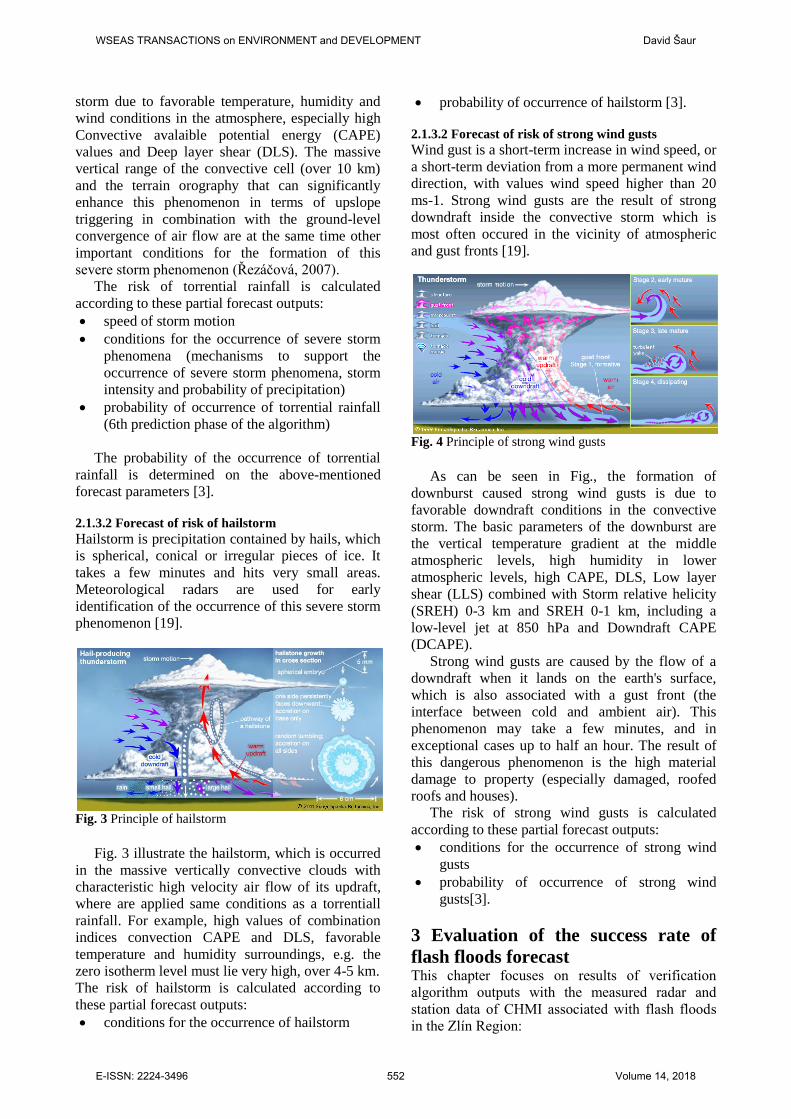
2.1.3.2 Forecast of risk of strong wind gusts
Wind gust is a short-term increase in wind speed, or
a short-term deviation from a more permanent wind
direction, with values wind speed higher than 20
ms-1. Strong wind gusts are the result of strong
downdraft inside the convective storm which is
most often occured in the vicinity of atmospheric
and gust fronts [19].
Fig. 4 Principle of strong wind gusts
As can be seen in Fig., the formation of
downburst caused strong wind gusts is due to
favorable downdraft conditions in the convective
storm. The basic parameters of the downburst are
the vertical temperature gradient at the middle
atmospheric levels, high humidity in lower
atmospheric levels, high CAPE, DLS, Low layer
shear (LLS) combined with Storm relative helicity
(SREH) 0-3 km and SREH 0-1 km, including a
low-level jet at 850 hPa and Downdraft CAPE
(DCAPE).
Strong wind gusts are caused by the flow of a
downdraft when it lands on the earth's surface,
which is also associated with a gust front (the
interface between cold and ambient air). This
phenomenon may take a few minutes, and in
exceptional cases up to half an hour. The result of
this dangerous phenomenon is the high material
damage to property (especially damaged, roofed
roofs and houses).
The risk of strong wind gusts is calculated
according to these partial forecast outputs:
conditions for the occurrence of strong wind
gusts
probability of occurrence of strong wind
gusts[3].
3 Evaluation of the success rate of
flash floods forecast This chapter focuses on results of verification
algorithm outputs with the measured radar and
station data of CHMI associated with flash floods
in the Zlín Region:
WSEAS TRANSACTIONS on ENVIRONMENT and DEVELOPMENT David Šaur
E-ISSN: 2224-3496 552 Volume 14, 2018
July 24, 2015,
August 5, 2016,
July 22, 2017.
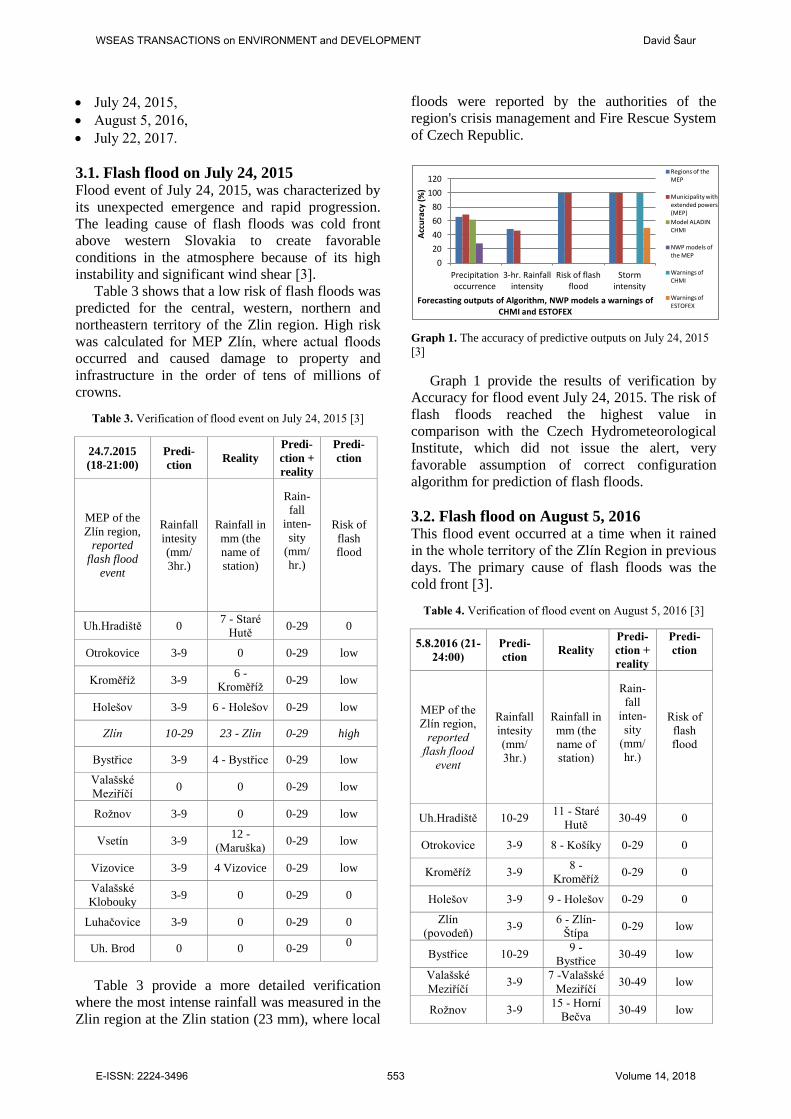
3.1. Flash flood on July 24, 2015 Flood event of July 24, 2015, was characterized by
its unexpected emergence and rapid progression.
The leading cause of flash floods was cold front
above western Slovakia to create favorable
conditions in the atmosphere because of its high
instability and significant wind shear [3].
Table 3 shows that a low risk of flash floods was
predicted for the central, western, northern and
northeastern territory of the Zlin region. High risk
was calculated for MEP Zlín, where actual floods
occurred and caused damage to property and
infrastructure in the order of tens of millions of
crowns.
Table 3. Verification of flood event on July 24, 2015 [3]
24.7.2015
(18-21:00)
Predi-
ction Reality
Predi-
ction +
reality
Predi-
ction
MEP of the
Zlín region,
reported
flash flood
event
Rainfall
intesity
(mm/
3hr.)
Rainfall in
mm (the
name of
station)
Rain-
fall
inten-
sity
(mm/
hr.)
Risk of
flash
flood
Uh.Hradiště 0 7 - Staré
Hutě 0-29 0
Otrokovice 3-9 0 0-29 low
Kroměříž 3-9 6 -
Kroměříž 0-29 low
Holešov 3-9 6 - Holešov 0-29 low
Zlín 10-29 23 - Zlín 0-29 high
Bystřice 3-9 4 - Bystřice 0-29 low
Valašské
Meziříčí 0 0 0-29 low
Rožnov 3-9 0 0-29 low
Vsetín 3-9 12 -
(Maruška) 0-29 low
Vizovice 3-9 4 Vizovice 0-29 low
Valašské
Klobouky 3-9 0 0-29 0
Luhačovice 3-9 0 0-29 0
Uh. Brod 0 0 0-29 0
Table 3 provide a more detailed verification
where the most intense rainfall was measured in the
Zlin region at the Zlin station (23 mm), where local
floods were reported by the authorities of the
region's crisis management and Fire Rescue System
of Czech Republic.
Graph 1. The accuracy of predictive outputs on July 24, 2015
[3]
Graph 1 provide the results of verification by
Accuracy for flood event July 24, 2015. The risk of
flash floods reached the highest value in
comparison with the Czech Hydrometeorological
Institute, which did not issue the alert, very
favorable assumption of correct configuration
algorithm for prediction of flash floods.
3.2. Flash flood on August 5, 2016 This flood event occurred at a time when it rained
in the whole territory of the Zlín Region in previous
days. The primary cause of flash floods was the
cold front [3].
Table 4. Verification of flood event on August 5, 2016 [3]
5.8.2016 (21-
24:00)
Predi-
ction Reality
Predi-
ction +
reality
Predi-
ction
MEP of the
Zlín region,
reported
flash flood
event
Rainfall
intesity
(mm/
3hr.)
Rainfall in
mm (the
name of
station)
Rain-
fall
inten-
sity
(mm/
hr.)
Risk of
flash
flood
Uh.Hradiště 10-29 11 - Staré
Hutě 30-49 0
Otrokovice 3-9 8 - Košíky 0-29 0
Kroměříž 3-9 8 -
Kroměříž 0-29 0
Holešov 3-9 9 - Holešov 0-29 0
Zlín
(povodeň) 3-9
6 - Zlín-
Štípa 0-29 low
Bystřice 10-29 9 -
Bystřice 30-49 low
Valašské
Meziříčí 3-9
7 -Valašské
Meziříčí 30-49 low
Rožnov 3-9 15 - Horní
Bečva 30-49 low
0
20
40
60
80
100
120
Precipitation occurrence
3-hr. Rainfall intensity
Risk of flash flood
Storm intensity
Acc
ura
cy (
%)
Forecasting outputs of Algorithm, NWP models a warnings of CHMI and ESTOFEX
Regions of the MEP
Municipality with extended powers (MEP)
Model ALADIN CHMI
NWP models of the MEP
Warnings of CHMI
Warnings of ESTOFEX
WSEAS TRANSACTIONS on ENVIRONMENT and DEVELOPMENT David Šaur
E-ISSN: 2224-3496 553 Volume 14, 2018

Vsetín 10-29 24 - Val.
Senice 30-49 low
Vizovice 0-3 9 -
Vizovice 30-49 low
Valašské
Klobouky 10-29
21 -
Brumov-
Bylnice
30-49 high
Luhačovice 10-29 14 - Luha-
čovice 30-49 low
Uh. Brod 10-29 14 - Strání 30-49 low
As can be seen in Table 4, high risk was
predicted for the Vsetín and Valašské Klobouky
regions, where a local flash flood occurred on the
Brumovka river between 22 and 23 o'clock. This
flood has caused enormous damage mainly to the
infrastructure and property of the population. The
intensity of strong storms was predicted for nearly
two-thirds of the region, but only in the Valašské
Klobouky region, there was a flash flood where the
second highest rainfall was measured at the
Brumov-Bylnice station (21 mm).
Graph 2. The accuracy of predictive outputs on August 5,
2016 [3]
Graph 2 shows the very high success rate of
convective rainfall occurring throughout the Zlín
Region. On the contrary, lower values were at the
storm intensity. Predicting the risk of flash floods
correspond with reality, which was reported flash
flood in the MEP of Valašské Klobouky. On the
other hand, the Czech Hydrometeorological
Institute again did not issue a warning, even though
the presence of some factors (for example extreme
soil saturation) recorded a probable flood event in
the eastern of the Czech Republic.
3.3. Flash flood on July 22, 2017 The last evaluated flood event was the situation on
July 22, 2017, when there were very intense
convective precipitation between villages of Horní
Lhota and Luhačovice in a concise time
(approximately 60-90 minutes). The leading cause
of flash floods was occluded front, where there was
rainfall intensity of 30 mm/hr. in combination with
strong wind shear. Just wind shear caused the
stationary movement of the severe storm, which led
to the formation of the flash flood [3].
Graph 3. Accuracy of predictive outputs on July 22, 2017 [3]
As can be seen in the Graph 3, algorithm and
NWP models have the high predictability of
convective precipitation. The highest success rate
was achieved in predicting the risk of flash floods
and storm intensity (the algorithm and warnings of
the CHMI). The forecast of the flash flood risk
corresponded to the fact that a flood in the
Luhačovice MEP was reported. Czech
Hydrometeorological warnings were issued for the
entire territory of the Zlin Region and despite that
flash flood occurred in only one district.
Table 5. The accuracy of predictive outputs on July 22, 2017
[3]
22.7.2017
(15-18:00)
Predi-
ction Reality
Predi-
ction +
reality
Predi-
ction
MEP of the
Zlín region,
reported
flash event
Rainfall
intesity
(mm/
3hr.)
Rainfall in
mm (the
name of
station)
Rain-fall
inten-sity
(mm/ hr.)
Risk of
flash
flood
Uh.Hradiště 0 3 - Hluk 0-29 0
Otrokovice 0 0 0-29 0
Kroměříž 0 0 0-29 0
Holešov 0 0 0-29 0
Zlín
(povodeň) 10-29 0 0-29 low
Bystřice 0 0 0-29 0
Valašské
Meziříčí 0 0 0-29 0
Rožnov 0 0 0-29 0
Vsetín 3-9 3 - Val.
Polanka 0-29 0
0
20
40
60
80
100
120
Precipitation occurrence
3-hr. Rainfall intensity
Risk of flash flood
Storm intensity
Acc
ura
cy (
%)
Forecasting outputs of Algorithm, NWP models a warnings of CHMI and ESTOFEX
Regions of the MEP
Municipality with extended powers (MEP)
Model ALADIN CHMI
NWP models of the MEP
Warnings of CHMI
Warnings of ESTOFEX
0
20
40
60
80
100
120
Precipitation occurrence
3-hr. Rainfall intensity
Risk of flash flood
Storm intensity
Acc
ura
cy (%
)
Forecasting outputs of Algorithm, NWP models a warnings of CHMI and ESTOFEX
Regions of the MEP
Municipality with extended powers (MEP)
Model ALADIN CHMI
NWP models of the MEP
Warnings of CHMI
Warnings of ESTOFEX
WSEAS TRANSACTIONS on ENVIRONMENT and DEVELOPMENT David Šaur
E-ISSN: 2224-3496 554 Volume 14, 2018
Vizovice 3-9 0 0-29 0
Valašské
Klobouky 3-9 0 0-29 0
Luhačovice 30-49 36 - Horní
Lhota 30-49 high
Uh. Brod 0 0 0-29 0
Table 5 show that this situation was
characterized by the presence of strong local
precipitations measured at Horní Lhota station (36
mm / hour), which had a significant influence on
the formation of the flash flood. The forecast
corresponded to the actual state. High risk was
predicted only for the Luhačovice region, where 58
mm / 2 hours precipitation was measured. The flash
flood affected the isolated area and damaged the
transport infrastructure.
4 Evaluation of success rate of severe
storm phenomena forecast This chapter focuses on results of verification
algorithm outputs with the measured station and
radar data of CHMI and MMR50 X-band
meteorological radar of the Zlin Region associated
with severe storm phenomena, which is caused
flash floods in the Zlín Region:
July 24, 2015,
August 5, 2016,
July 22, 2017.
4.1. Flash flood on July 24, 2015 The cause of severe storm phenomena, especially
torrential rainfall, which was one of significant
factors of the flash flood in the central part of the
Zlín Region, was the undulated cold front. The
formation of torrential rainfall, hailstorm and strong
wind gusts have been supported by very favorable
thermal, humidity and especially wind conditions,
which was a strong wind shear caused by the
ground northeast and high-rise southwest winds.
Another initiating factor was the orography of
Hostýnsko-Vsetínské Highland in terms of the
effect of their upslope triggering and leeward
effects.
Initially, intense convective precipitation
occurred over western Slovakia. The strongest
precipitation began to return from Slovakia to the
northeast and east of the Czech Republic during the
afternoon and evening hours due to the influence of
the warm sector of the undulated cold front. As a
result, the convective storm slowed down and at the
same time to increase precipitation.
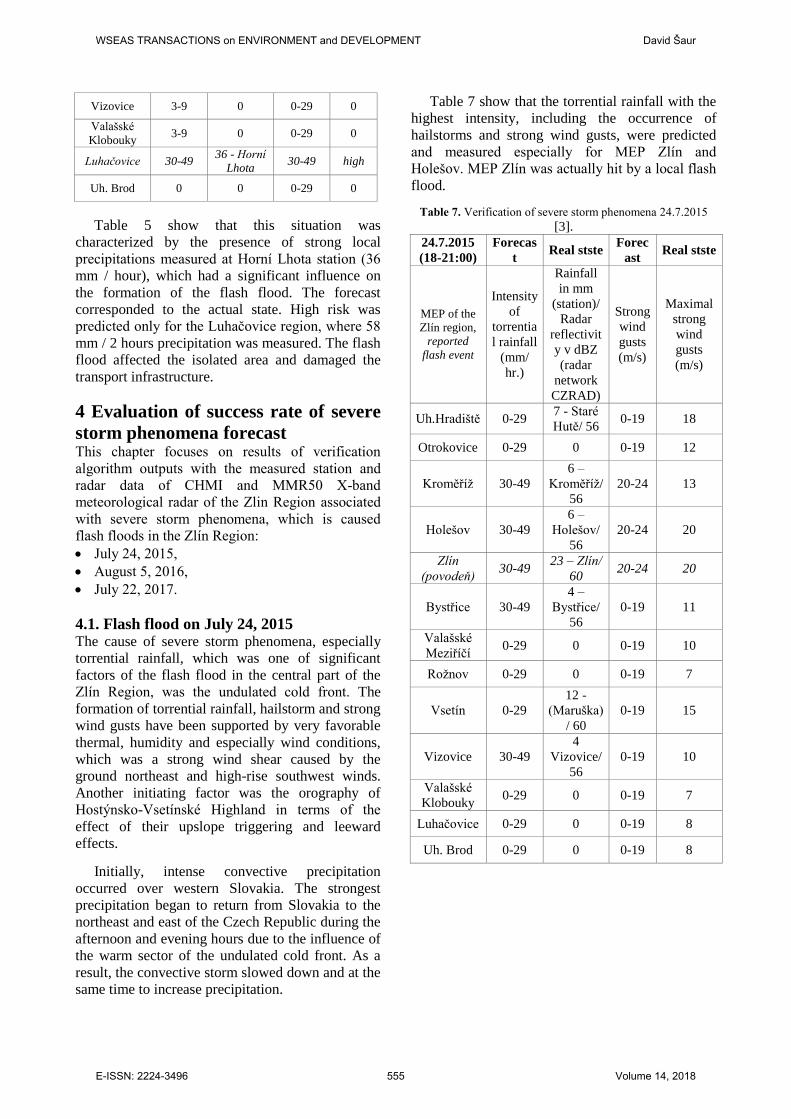
Table 7 show that the torrential rainfall with the
highest intensity, including the occurrence of
hailstorms and strong wind gusts, were predicted
and measured especially for MEP Zlín and
Holešov. MEP Zlín was actually hit by a local flash
flood.
Table 7. Verification of severe storm phenomena 24.7.2015
[3].
24.7.2015
(18-21:00)
Forecas
t Real stste
Forec
ast Real stste
MEP of the
Zlín region,
reported
flash event
Intensity
of
torrentia
l rainfall
(mm/
hr.)
Rainfall
in mm
(station)/
Radar
reflectivit
y v dBZ
(radar
network
CZRAD)
Strong
wind
gusts
(m/s)
Maximal
strong
wind
gusts
(m/s)
Uh.Hradiště 0-29 7 - Staré
Hutě/ 56 0-19 18
Otrokovice 0-29 0 0-19 12
Kroměříž 30-49
6 –
Kroměříž/
56
20-24 13
Holešov 30-49
6 –
Holešov/
56
20-24 20
Zlín
(povodeň) 30-49
23 – Zlín/
60 20-24 20
Bystřice 30-49
4 –
Bystřice/
56
0-19 11
Valašské
Meziříčí 0-29 0 0-19 10
Rožnov 0-29 0 0-19 7
Vsetín 0-29
12 -
(Maruška)
/ 60
0-19 15
Vizovice 30-49
4
Vizovice/
56
0-19 10
Valašské
Klobouky 0-29 0 0-19 7
Luhačovice 0-29 0 0-19 8
Uh. Brod 0-29 0 0-19 8
WSEAS TRANSACTIONS on ENVIRONMENT and DEVELOPMENT David Šaur
E-ISSN: 2224-3496 555 Volume 14, 2018
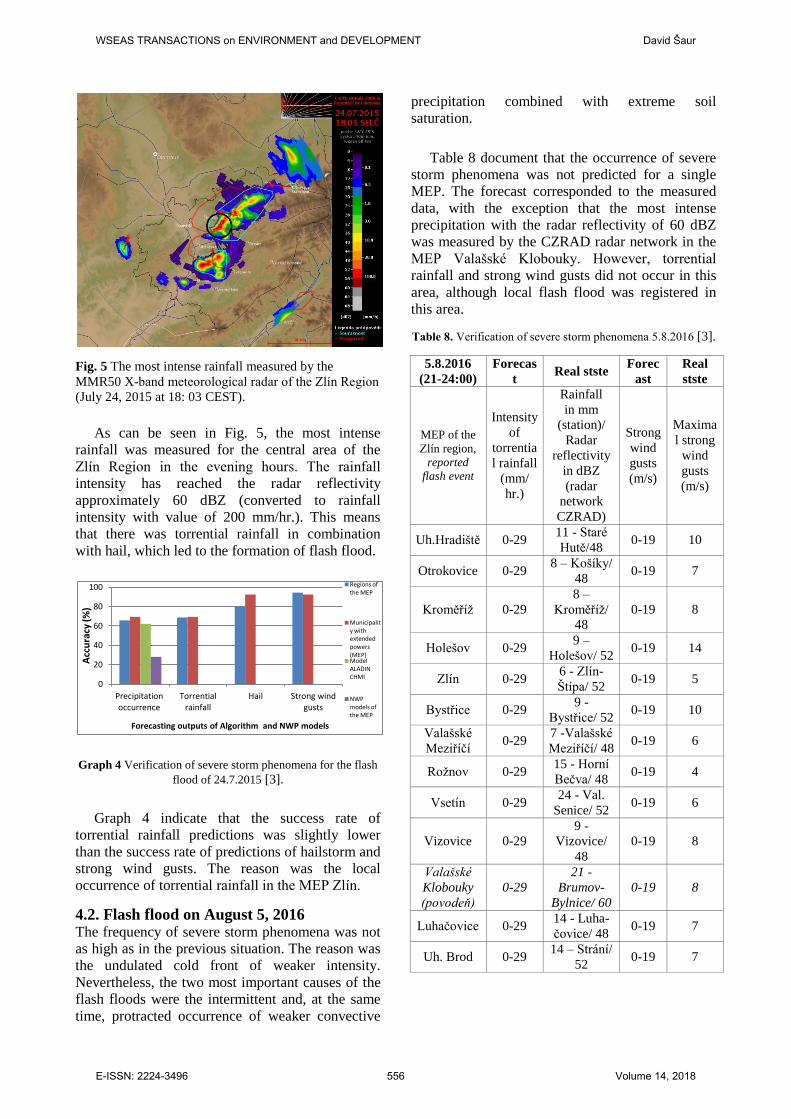
Fig. 5 The most intense rainfall measured by the
MMR50 X-band meteorological radar of the Zlín Region
(July 24, 2015 at 18: 03 CEST).
As can be seen in Fig. 5, the most intense
rainfall was measured for the central area of the
Zlín Region in the evening hours. The rainfall
intensity has reached the radar reflectivity
approximately 60 dBZ (converted to rainfall
intensity with value of 200 mm/hr.). This means
that there was torrential rainfall in combination
with hail, which led to the formation of flash flood.
Graph 4 Verification of severe storm phenomena for the flash
flood of 24.7.2015 [3].
Graph 4 indicate that the success rate of
torrential rainfall predictions was slightly lower
than the success rate of predictions of hailstorm and
strong wind gusts. The reason was the local
occurrence of torrential rainfall in the MEP Zlín.
4.2. Flash flood on August 5, 2016 The frequency of severe storm phenomena was not
as high as in the previous situation. The reason was
the undulated cold front of weaker intensity.
Nevertheless, the two most important causes of the
flash floods were the intermittent and, at the same
time, protracted occurrence of weaker convective
precipitation combined with extreme soil
saturation.
Table 8 document that the occurrence of severe
storm phenomena was not predicted for a single
MEP. The forecast corresponded to the measured
data, with the exception that the most intense
precipitation with the radar reflectivity of 60 dBZ
was measured by the CZRAD radar network in the
MEP Valašské Klobouky. However, torrential
rainfall and strong wind gusts did not occur in this
area, although local flash flood was registered in
this area.
Table 8. Verification of severe storm phenomena 5.8.2016 [3].
5.8.2016
(21-24:00)
Forecas
t Real stste
Forec
ast
Real
stste
MEP of the
Zlín region,
reported
flash event
Intensity
of
torrentia
l rainfall
(mm/
hr.)
Rainfall
in mm
(station)/
Radar
reflectivity
in dBZ
(radar
network
CZRAD)
Strong
wind
gusts
(m/s)
Maxima
l strong
wind
gusts
(m/s)
Uh.Hradiště 0-29 11 - Staré
Hutě/48 0-19 10
Otrokovice 0-29 8 – Košíky/
48 0-19 7
Kroměříž 0-29
8 –
Kroměříž/
48
0-19 8
Holešov 0-29 9 –
Holešov/ 52 0-19 14
Zlín 0-29 6 - Zlín-
Štípa/ 52 0-19 5
Bystřice 0-29 9 -
Bystřice/ 52 0-19 10
Valašské
Meziříčí 0-29
7 -Valašské
Meziříčí/ 48 0-19 6
Rožnov 0-29 15 - Horní
Bečva/ 48 0-19 4
Vsetín 0-29 24 - Val.
Senice/ 52 0-19 6
Vizovice 0-29
9 -
Vizovice/
48
0-19 8
Valašské
Klobouky
(povodeň)
0-29
21 -
Brumov-
Bylnice/ 60
0-19 8
Luhačovice 0-29 14 - Luha-
čovice/ 48 0-19 7
Uh. Brod 0-29 14 – Strání/
52 0-19 7
0
20
40
60
80
100
Precipitation occurrence
Torrential rainfall
Hail Strong wind gusts
Acc
ura
cy (%
)
Forecasting outputs of Algorithm and NWP models
Regions of the MEP
Municipality with extended powers (MEP) Model ALADIN CHMI
NWP models of the MEP
WSEAS TRANSACTIONS on ENVIRONMENT and DEVELOPMENT David Šaur
E-ISSN: 2224-3496 556 Volume 14, 2018
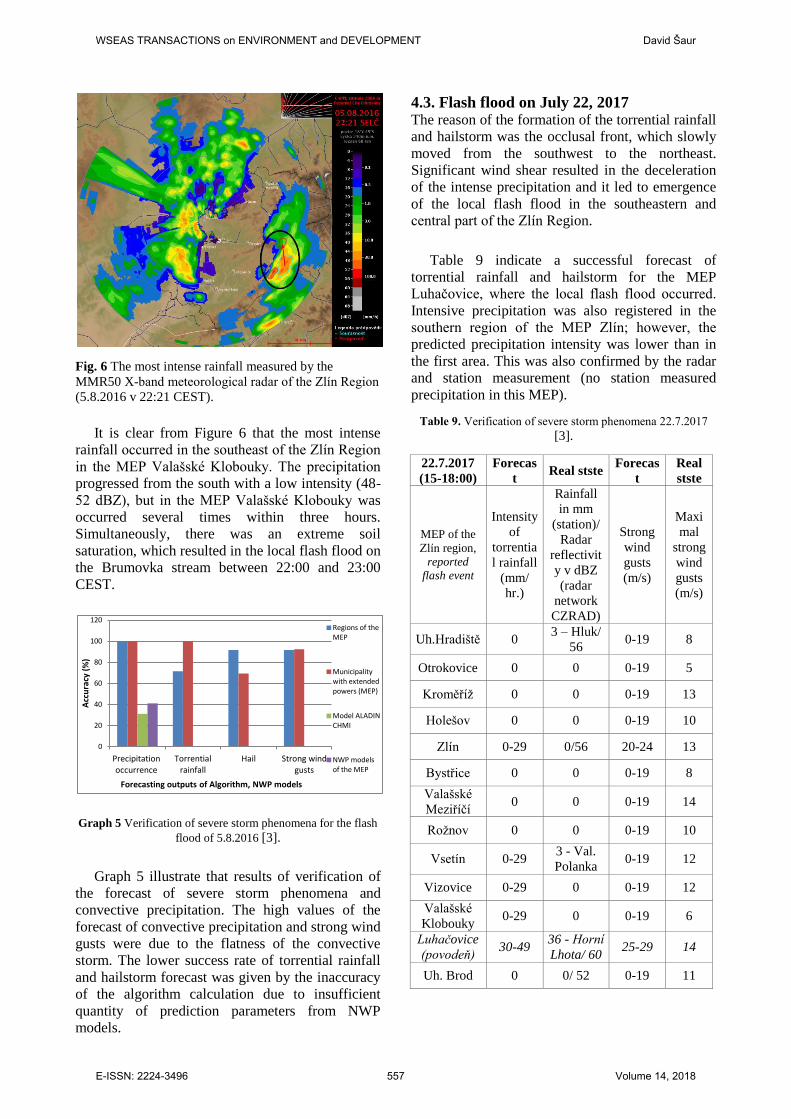
Fig. 6 The most intense rainfall measured by the
MMR50 X-band meteorological radar of the Zlín Region
(5.8.2016 v 22:21 CEST).
It is clear from Figure 6 that the most intense
rainfall occurred in the southeast of the Zlín Region
in the MEP Valašské Klobouky. The precipitation
progressed from the south with a low intensity (48-
52 dBZ), but in the MEP Valašské Klobouky was
occurred several times within three hours.
Simultaneously, there was an extreme soil
saturation, which resulted in the local flash flood on
the Brumovka stream between 22:00 and 23:00
CEST.
Graph 5 Verification of severe storm phenomena for the flash
flood of 5.8.2016 [3].
Graph 5 illustrate that results of verification of
the forecast of severe storm phenomena and
convective precipitation. The high values of the
forecast of convective precipitation and strong wind
gusts were due to the flatness of the convective
storm. The lower success rate of torrential rainfall
and hailstorm forecast was given by the inaccuracy
of the algorithm calculation due to insufficient
quantity of prediction parameters from NWP
models.
4.3. Flash flood on July 22, 2017 The reason of the formation of the torrential rainfall
and hailstorm was the occlusal front, which slowly
moved from the southwest to the northeast.
Significant wind shear resulted in the deceleration
of the intense precipitation and it led to emergence
of the local flash flood in the southeastern and
central part of the Zlín Region.
Table 9 indicate a successful forecast of
torrential rainfall and hailstorm for the MEP
Luhačovice, where the local flash flood occurred.
Intensive precipitation was also registered in the
southern region of the MEP Zlín; however, the
predicted precipitation intensity was lower than in
the first area. This was also confirmed by the radar
and station measurement (no station measured
precipitation in this MEP).
Table 9. Verification of severe storm phenomena 22.7.2017
[3].
22.7.2017
(15-18:00)
Forecas
t Real stste
Forecas
t
Real
stste
MEP of the
Zlín region,
reported
flash event
Intensity
of
torrentia
l rainfall
(mm/
hr.)
Rainfall
in mm
(station)/
Radar
reflectivit
y v dBZ
(radar
network
CZRAD)
Strong
wind
gusts
(m/s)
Maxi
mal
strong
wind
gusts
(m/s)
Uh.Hradiště 0 3 – Hluk/
56 0-19 8
Otrokovice 0 0 0-19 5
Kroměříž 0 0 0-19 13
Holešov 0 0 0-19 10
Zlín 0-29 0/56 20-24 13
Bystřice 0 0 0-19 8
Valašské
Meziříčí 0 0 0-19 14
Rožnov 0 0 0-19 10
Vsetín 0-29 3 - Val.
Polanka 0-19 12
Vizovice 0-29 0 0-19 12
Valašské
Klobouky 0-29 0 0-19 6
Luhačovice
(povodeň) 30-49
36 - Horní
Lhota/ 60 25-29 14
Uh. Brod 0 0/ 52 0-19 11
0
20
40
60
80
100
120
Precipitation occurrence
Torrential rainfall
Hail Strong wind gusts
Acc
ura
cy (
%)
Forecasting outputs of Algorithm, NWP models
Regions of the MEP
Municipality with extended powers (MEP)
Model ALADIN CHMI
NWP models of the MEP
WSEAS TRANSACTIONS on ENVIRONMENT and DEVELOPMENT David Šaur
E-ISSN: 2224-3496 557 Volume 14, 2018
Graph 6 Verification of severe storm phenomena for the flash
flood of 22.7.2017 [3].
As can be seen in the Graph 4, the high success
rate predictions was in all severe storm phenomena,
which is paradoxically higher than the prediction of
convective precipitations calculated by the
Algorithm and NWP models. This case has again
confirmed the importance of rare phenomena that
occur very locally.
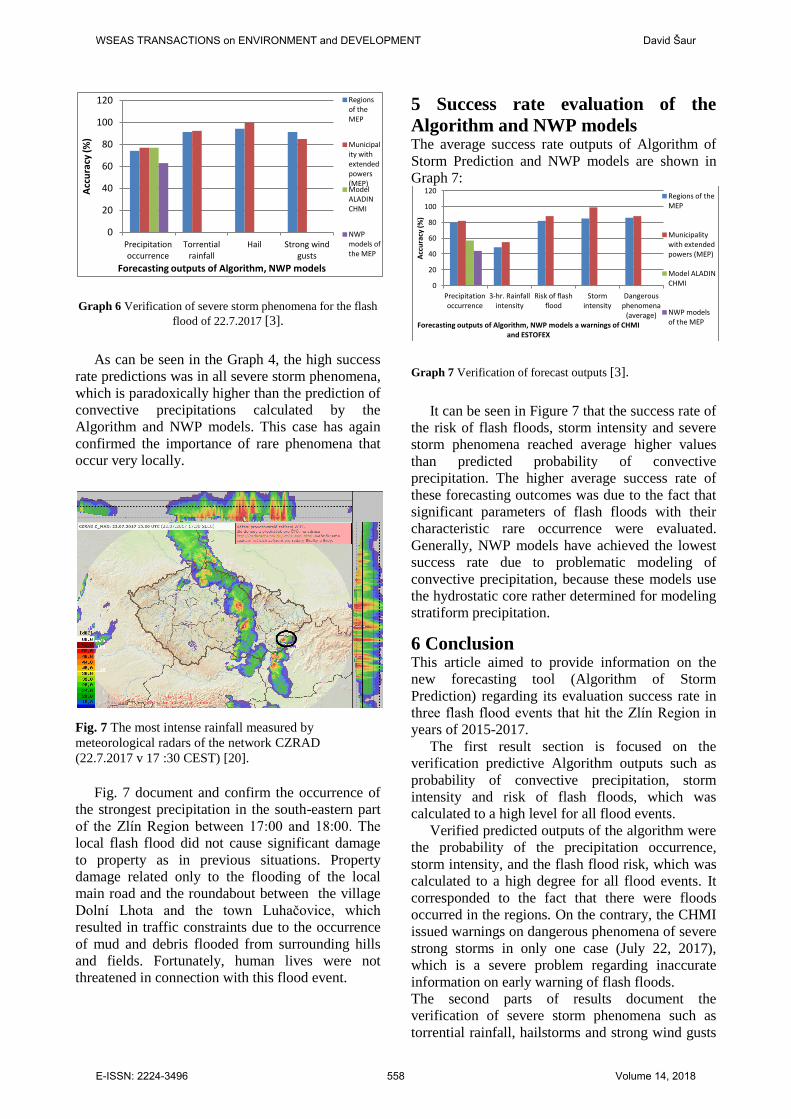
Fig. 7 The most intense rainfall measured by
meteorological radars of the network CZRAD
(22.7.2017 v 17 :30 CEST) [20].
Fig. 7 document and confirm the occurrence of
the strongest precipitation in the south-eastern part
of the Zlín Region between 17:00 and 18:00. The
local flash flood did not cause significant damage
to property as in previous situations. Property
damage related only to the flooding of the local
main road and the roundabout between the village
Dolní Lhota and the town Luhačovice, which
resulted in traffic constraints due to the occurrence
of mud and debris flooded from surrounding hills
and fields. Fortunately, human lives were not
threatened in connection with this flood event.
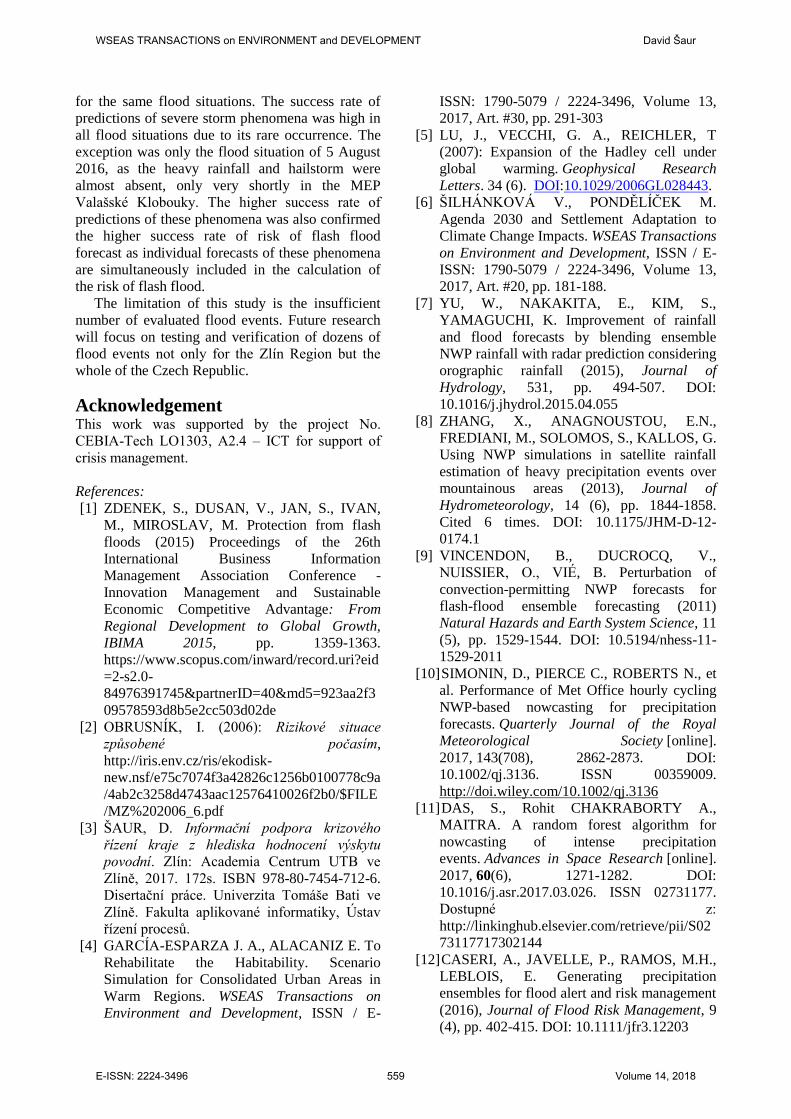
5 Success rate evaluation of the
Algorithm and NWP models The average success rate outputs of Algorithm of
Storm Prediction and NWP models are shown in
Graph 7:
Graph 7 Verification of forecast outputs [3].
It can be seen in Figure 7 that the success rate of
the risk of flash floods, storm intensity and severe
storm phenomena reached average higher values
than predicted probability of convective
precipitation. The higher average success rate of
these forecasting outcomes was due to the fact that
significant parameters of flash floods with their
characteristic rare occurrence were evaluated.
Generally, NWP models have achieved the lowest
success rate due to problematic modeling of
convective precipitation, because these models use
the hydrostatic core rather determined for modeling
stratiform precipitation.
6 Conclusion This article aimed to provide information on the
new forecasting tool (Algorithm of Storm
Prediction) regarding its evaluation success rate in
three flash flood events that hit the Zlín Region in
years of 2015-2017.
The first result section is focused on the
verification predictive Algorithm outputs such as
probability of convective precipitation, storm
intensity and risk of flash floods, which was
calculated to a high level for all flood events.
Verified predicted outputs of the algorithm were
the probability of the precipitation occurrence,
storm intensity, and the flash flood risk, which was
calculated to a high degree for all flood events. It
corresponded to the fact that there were floods
occurred in the regions. On the contrary, the CHMI
issued warnings on dangerous phenomena of severe
strong storms in only one case (July 22, 2017),
which is a severe problem regarding inaccurate
information on early warning of flash floods.
The second parts of results document the
verification of severe storm phenomena such as
torrential rainfall, hailstorms and strong wind gusts
0
20
40
60
80
100
120
Precipitation occurrence
Torrential rainfall
Hail Strong wind gusts
Acc
ura
cy (%
)
Forecasting outputs of Algorithm, NWP models
Regions of the MEP
Municipality with extended powers (MEP) Model ALADIN CHMI
NWP models of the MEP
0
20
40
60
80
100
120
Precipitation occurrence
3-hr. Rainfall intensity
Risk of flash flood
Storm intensity
Dangerous phenomena
(average)
Acc
ura
cy (%
)
Forecasting outputs of Algorithm, NWP models a warnings of CHMI and ESTOFEX
Regions of the MEP
Municipality with extended powers (MEP)
Model ALADIN CHMI
NWP models of the MEP
WSEAS TRANSACTIONS on ENVIRONMENT and DEVELOPMENT David Šaur
E-ISSN: 2224-3496 558 Volume 14, 2018
for the same flood situations. The success rate of
predictions of severe storm phenomena was high in
all flood situations due to its rare occurrence. The
exception was only the flood situation of 5 August
2016, as the heavy rainfall and hailstorm were
almost absent, only very shortly in the MEP
Valašské Klobouky. The higher success rate of
predictions of these phenomena was also confirmed
the higher success rate of risk of flash flood
forecast as individual forecasts of these phenomena
are simultaneously included in the calculation of
the risk of flash flood.
The limitation of this study is the insufficient
number of evaluated flood events. Future research
will focus on testing and verification of dozens of
flood events not only for the Zlín Region but the
whole of the Czech Republic.
Acknowledgement This work was supported by the project No.
CEBIA-Tech LO1303, A2.4 – ICT for support of
crisis management.
References:
[1] ZDENEK, S., DUSAN, V., JAN, S., IVAN,
M., MIROSLAV, M. Protection from flash
floods (2015) Proceedings of the 26th
International Business Information
Management Association Conference -
Innovation Management and Sustainable
Economic Competitive Advantage: From
Regional Development to Global Growth,
IBIMA 2015, pp. 1359-1363.
https://www.scopus.com/inward/record.uri?eid
=2-s2.0-
84976391745&partnerID=40&md5=923aa2f3
09578593d8b5e2cc503d02de
[2] OBRUSNÍK, I. (2006): Rizikové situace
způsobené počasím,
http://iris.env.cz/ris/ekodisk-
new.nsf/e75c7074f3a42826c1256b0100778c9a
/4ab2c3258d4743aac12576410026f2b0/$FILE
/MZ%202006_6.pdf
[3] ŠAUR, D. Informační podpora krizového
řízení kraje z hlediska hodnocení výskytu
povodní. Zlín: Academia Centrum UTB ve
Zlíně, 2017. 172s. ISBN 978-80-7454-712-6.
Disertační práce. Univerzita Tomáše Bati ve
Zlíně. Fakulta aplikované informatiky, Ústav
řízení procesů.
[4] GARCÍA-ESPARZA J. A., ALACANIZ E. To
Rehabilitate the Habitability. Scenario
Simulation for Consolidated Urban Areas in
Warm Regions. WSEAS Transactions on
Environment and Development, ISSN / E-
ISSN: 1790-5079 / 2224-3496, Volume 13,
2017, Art. #30, pp. 291-303
[5] LU, J., VECCHI, G. A., REICHLER, T
(2007): Expansion of the Hadley cell under
global warming. Geophysical Research
Letters. 34 (6). DOI:10.1029/2006GL028443.
[6] ŠILHÁNKOVÁ V., PONDĚLÍČEK M.
Agenda 2030 and Settlement Adaptation to
Climate Change Impacts. WSEAS Transactions
on Environment and Development, ISSN / E-
ISSN: 1790-5079 / 2224-3496, Volume 13,
2017, Art. #20, pp. 181-188.
[7] YU, W., NAKAKITA, E., KIM, S.,
YAMAGUCHI, K. Improvement of rainfall
and flood forecasts by blending ensemble
NWP rainfall with radar prediction considering
orographic rainfall (2015), Journal of
Hydrology, 531, pp. 494-507. DOI:
10.1016/j.jhydrol.2015.04.055
[8] ZHANG, X., ANAGNOUSTOU, E.N.,
FREDIANI, M., SOLOMOS, S., KALLOS, G.
Using NWP simulations in satellite rainfall
estimation of heavy precipitation events over
mountainous areas (2013), Journal of
Hydrometeorology, 14 (6), pp. 1844-1858.
Cited 6 times. DOI: 10.1175/JHM-D-12-
0174.1
[9] VINCENDON, B., DUCROCQ, V.,
NUISSIER, O., VIÉ, B. Perturbation of
convection-permitting NWP forecasts for
flash-flood ensemble forecasting (2011)
Natural Hazards and Earth System Science, 11
(5), pp. 1529-1544. DOI: 10.5194/nhess-11-
1529-2011
[10] SIMONIN, D., PIERCE C., ROBERTS N., et
al. Performance of Met Office hourly cycling
NWP-based nowcasting for precipitation
forecasts. Quarterly Journal of the Royal
Meteorological Society [online].
2017, 143(708), 2862-2873. DOI:
10.1002/qj.3136. ISSN 00359009.
http://doi.wiley.com/10.1002/qj.3136
[11] DAS, S., Rohit CHAKRABORTY A.,
MAITRA. A random forest algorithm for
nowcasting of intense precipitation
events. Advances in Space Research [online].
2017, 60(6), 1271-1282. DOI:
10.1016/j.asr.2017.03.026. ISSN 02731177.
Dostupné z:
http://linkinghub.elsevier.com/retrieve/pii/S02
73117717302144
[12] CASERI, A., JAVELLE, P., RAMOS, M.H.,
LEBLOIS, E. Generating precipitation
ensembles for flood alert and risk management
(2016), Journal of Flood Risk Management, 9
(4), pp. 402-415. DOI: 10.1111/jfr3.12203
WSEAS TRANSACTIONS on ENVIRONMENT and DEVELOPMENT David Šaur
E-ISSN: 2224-3496 559 Volume 14, 2018
[13] BAKER, L. H., A. C. RUDD, S.
MIGLIORINI, et al. Representation of model
error in a convective-scale ensemble prediction
system. Nonlinear Processes in
Geophysics [online]. 2014, 21(1), 19-39 [cit.
2018-03-20]. DOI: 10.5194/npg-21-19-2014.
ISSN 1607-7946. Dostupné z:
http://www.nonlin-processes-
geophys.net/21/19/2014/
[14] L. NISI, AMBROSETI P., Clementi L.
Nowcasting severe convection in the Alpine
region: the COALITION approach.Quarterly”
Journal of the Royal Meteorological
Society [online]. 2014, vol. 140, issue 682, s.
1684-1699 DOI: 10.1002/qj.2249.
[15] LAKSHMANAN, V., CROCKETT, J.,
SPEROW, K., BA, M., XIN, L. Tuning
AutoNowcaster automatically (2012) Weather
and Forecasting, 27 (6), pp. 1568-1579. Cited
4 times. DOI: 10.1175/WAF-D-11-00141.1
[16] ŠAUR, D. Algoritmus předpovědi bouří:
Technická specifikace. Univerzita Tomáše Bati
ve Zlíně, Fakulta aplikované informatiky,
CEBIA-Tech, 2018.
[17] ŠAUR, D. Metodika využití meteorologického
radaru Zlínského kraje pro potřeby krizového
řízení. Zlín, Zlínský kraj, 2016.
[18] SIVS - kód V. Bouřkové jevy: Český
hydrometeorologický ústav. 1997 - 2018.
Avalaible at:
http://portal.chmi.cz/files/portal/docs/meteo/o
m/vystrahy/napoveda/bourky.html
[19] Meteorologický slovník výkladový a
terminologický (eMS). 1993 -2017. Avalaible
at: http://slovnik.cmes.cz
[20] JSRadView – radar data browser CHMI, 2010
- 2018 Avalaible at:
http://portal.chmi.cz/files/portal/docs/meteo/ra
d/data_jsradview.h
WSEAS TRANSACTIONS on ENVIRONMENT and DEVELOPMENT David Šaur
E-ISSN: 2224-3496 560 Volume 14, 2018