successes and challenges of volunteer monitoring
TRANSCRIPT

Successes and Challenges ofVolunteer Monitoring
New Jersey Monitoring CouncilMay 25, 2005
Linda T. Green
National Water Quality Monitoring CouncilUniversity of Rhode Island Cooperative Extension
USDA Cooperative State Research EducationExtension Service (CSREES)


Pioneering Programs
National Weather Service (1890)1900 National Audubon Society1954 National Marine Fisheries ServiceStream Monitoring - (Maryland - 1969)
Lakes - (Maine, Minnesota, Michigan, NH) – 1971-1978
Estuaries – RI, Chesapeake Bay -1985

0200400600800
1000
1988 1990 1992 1994 1998
# of Reported Programs# of Reported Programs
* Nat’l Dir. of Envir. Mon. Progs. - 5th Ed.
Volunteer Monitoring Came ofAge in the 1990s*

Ecosystems Monitored*
0 25 50 75 100
River/Stream
Lake/Pond
Wetland
Estuary
Reservoir
Groundwater
Marine
% of Programs Monitoring Each Environment% of Programs Monitoring Each Environment
* Nat’l Dir. of Envir. Mon. Progs. - 5th Ed.

What Is Volunteer Monitoring?
People who willingly, diligently andregularly assess water quality of variousenvironments in their free time.People who watch over the health of theirwatersheds because they care.People who advocate for improvementand/or protection of their waters

Who Are These Volunteers?
Mid-lifeMid-lifeAdults (40%)Adults (40%)
Youth underYouth under18 (28%)18 (28%)
SeniorsSeniors(25%)(25%)
College-ageCollege-age(7%)(7%)

Volunteer Monitors are CommunityEducators

Casco BayKeepers, Maine

Message Culminated in Action
Media campaignincluded full page adsHome & garden centerbrochuresGarden show boothDirect mail
] Workshop attended by~120 homeownersand applicators

Wisconsin Research on SocietalParticipation*
Experienced monitors –Did not have more factual info about water quality Feel more connected to those in their communityconcerned with environmental issuesare more likely to participate in political action events
reading, personal research (72%)Talk with neighbors (72%)Attend public meetings (65%)Share monitoring info with others (54%)
*Overdevest, Orr, Stepenuck, 2004 NWQMC conference
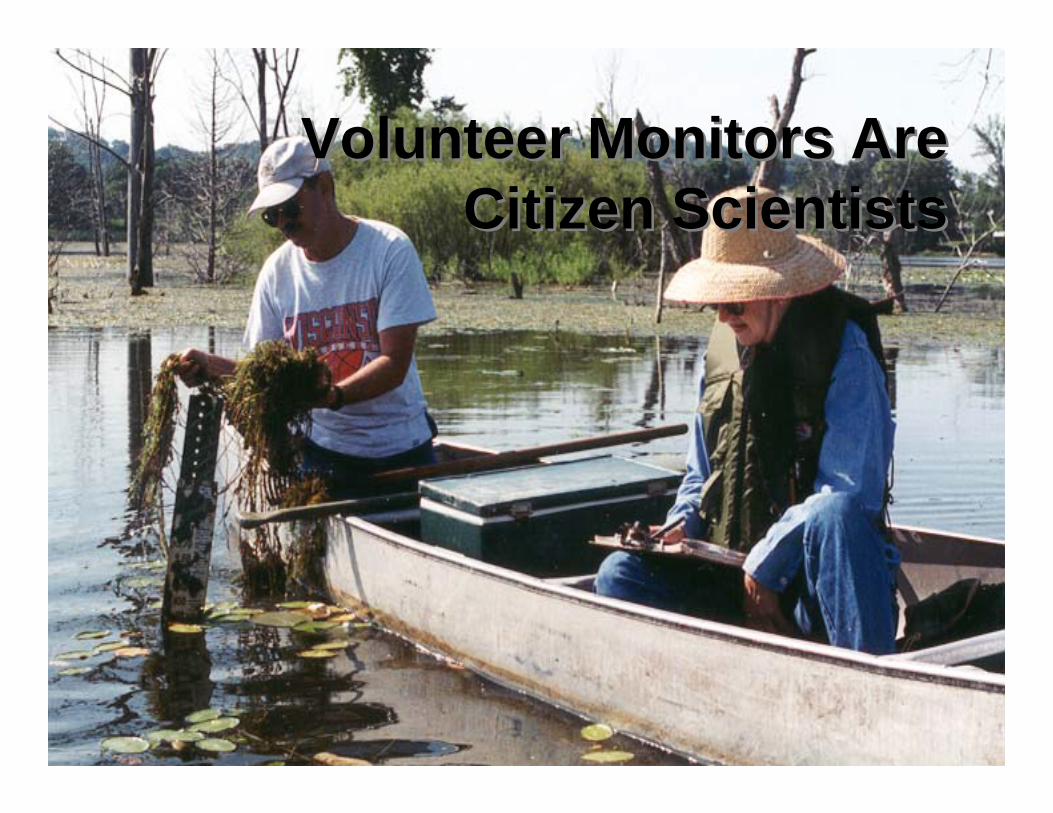
Volunteer Monitors AreCitizen Scientists
Volunteer Monitors AreCitizen Scientists

Top Parameters Lakes & Rivers*
River/StreamsWater Temp. (88%)pH (78%)Macroinverts (76%)Diss. Oxygen (73%)Nitrogen (53%)Flow/water level(51%)
River/StreamsWater Temp. (88%)pH (78%)Macroinverts (76%)Diss. Oxygen (73%)Nitrogen (53%)Flow/water level(51%)
LakesSecchi trans. (88%)Water Temp. (74%)Phosphorus (66%)Diss. Oxygen (58%)Chlorophyll (51%)pH (45%)
LakesSecchi trans. (88%)Water Temp. (74%)Phosphorus (66%)Diss. Oxygen (58%)Chlorophyll (51%)pH (45%)
* Nat’l Dir. of Envir. Mon. Progs. - 5th Ed.

Meadowbrook Pond0
0.5
1
1.5
2
2.5
3
4/18
5/2
5/16
5/30
6/13
7/6
7/12
7/24
8/15
8/29
9/10
9/26
10/8
10/2
6
11/3
Depth (m)
Eutrophic
Mesotrophic
SECCHI DEPTH
0
5
10
15
20
25
30
35
40
4/21 5/5 5/19 6/2 6/16 6/30 7/14 7/28 8/11 8/25 9/8 9/22 10/6 10/20 11/3
Me s otrophic
Eutrophic
ppbCHLOROPHYLL LEVELS

Distribution of Lakes by P TSI
25
30
35
40
45
50
55
60
65
70
1 5 9 13 17 21 25 29 33 37 41 45 49 53 57 61 65 69 73
RANK OF LAKES BY MEAN MULTI-YEAR TROPHIC STATUS
Oligotrophic
Mesotrophic
Eutrophic
URIWW Locations with 3 or more years of data only

0
2
4
6
8
10
12
10-M
ay
30-J
ul
17-O
ct
8-Ju
n
2-Sep
19-A
pr
5-Ju
l
20-S
ep
21-M
ay
21-A
ug
26-A
pr
6-Aug
7-M
ay
6-Aug
4-M
ay
27-J
ul
26-O
ct
6-Ju
l
20-S
ep
24-M
ay
8-Aug
23-O
ct
10-J
ul
26-S
ep
11-J
un
27-A
ug
17-M
ay
4-Aug
4-M
ay
20-J
ul
5-O
ct
21-J
un
6-Sep
6-Ju
n
22-A
ug
6-Aug
Secchi Depth Bottom Depth
Watchaug Pond - Water Clarity 1988 - 2004, running averages
Depth (m)
Source of Long term Data

Total Maximum Daily Load(TMDL)URIWW data used toURIWW data used to
•• Assess impairment Assess impairment
•• Develop TMDL and community “buy-in” Develop TMDL and community “buy-in”
•• Monitor effectiveness upon Monitor effectiveness uponimplementationimplementation

Lower Order Streams,Southern RI - 1991
020406080
100120
Belleville Sluice.
Carr InletChipuxet - ResChipuxet - MillBrushy Br.Log House Br.Meadow Br.Mud BrookPasq InletOak Hill BrShore InletShick - PotterShick - MiskShunock - Babcock
Shunock - Hewitt
Watchaug Inlet
TPppb

Illegal Shellfish ProcessorNo provision for proper waste disposalNo provision for proper waste disposal
1975 to 1988 unlined sewage lagoons1975 to 1988 unlined sewage lagoons (= above ground detention basins) (= above ground detention basins)
10 mg/l total P in lagoons10 mg/l total P in lagoons1 mg/l total P in groundwater1 mg/l total P in groundwater1130 mg/l 1130 mg/l ClCl in groundwater in groundwater
0.025 mg/l P in lakes = algae blooms

Decreased P, decreased algae, increasedclarity … great advertisement for program
05
10152025303540
ug/l
chl-a
1988 1989 1990 1991 1992 1993 1994 1995 1996
BarberYawgoo

“It is in the marriage of credibledata and increasedstewardship behavior that thetrue potential and vitality ofcitizen monitoring begins toemerge.”-Steven Hubbell, Colorado River Watch

Stafford Pond
314/319 GrantsDiagnostic studyPublic EducationProject
Home*A*SystTargetedFactsheetsResidentialguide0
2468
10121416
ppb
1993 1994 1995 1996
Algal Concentration

Lake Monitoring and NPSProgram Partnerships Deliver: The Lake Chocorua Project
Jeffrey SchlossUniversity of New Hampshire
Cooperative Extension Water ResourcesUNH Center for Freshwater Biology

(the volunteer monitors were)‘the “hub of the wheel” thatmade the project asuccess…They provided thefactual data on whichdecisions were made. ’ - -Sherry GodlewskiNH DES
‘…it is this type of modelproject that we at the EPA wantto support and continue to seeoccur … ’
-Warren Howard EPA-NE

-Toby PageLake Chocorua Association
‘I don’t knowwhen was the lasttime I’ve workedwith 12 agenciesand gottensomething done’

Many programs are entering theirsecond decade of monitoring
Clarified their purpose(s)Secure in their techniquesHave jumped thru QA hoopsAre realizing the value of theircommunity connections

CredibilityCredibility doesn’t meandoesn’t meanhaving the most exactinghaving the most exacting
techniques. It meanstechniques. It meansdelivering on your promises,delivering on your promises,no matter how small or largeno matter how small or large
they are.they are.-Meg Kerr-Meg Kerr
RI River RescueRI River Rescue

Main Uses of Volunteer DataWater Quality or Watershed EducationDocument Existing ConditionsProblem IdentificationLocal Decisions

Education/Awareness
Problem ID, Assess
Impairment,Local
Decisions
Legal &Regulatory
Increasing Time - Rigor - QA - Expense $$Increasing Time - Rigor - QA - Expense $$
Geoff Dates, River Network
The Continuum of Monitoring Data Use

NJ - Options for InvolvementNJ - Options for Involvement
Tier A: Environmental EducationTier A: Environmental EducationTier B: StewardshipTier B: StewardshipTier C: Community AssessmentTier C: Community AssessmentTier D: Indicators/Regulatory ResponseTier D: Indicators/Regulatory Response

Tier C: Community &/or WatershedAssessment- NJ
•Local decision-makers
•Watershedassociation
•Environmentalorganizations
•Possibly DEP
•Assess currentconditions
•Track trends
•Source track down ofNonpoint sourcepollution
•Medium/highlevel of rigor
•Data needs toreliably detectchanges overtime & space
•QAPPapproved & onfile w/ intendeddata user.
•Trainingrequired
Data Users Data Use
Quality Needed

Quality is Assured through:TrainingRepetitionRoutine samplingMonitoring multiple indicatorsQA/QC field and laboratory testingAdhering to established procedures
The most important factor determiningthe level of quality is the cost of being
wrong.

Secchi Comparison Plot
0
0.5
1
1.5
2
2.5
3
3.5
4
4.5
0 0.5 1 1.5 2 2.5 3 3.5 4 4.5
Depth (m)
Volu
ntee
rs
Staff
= 1:1
R2 = .96

Methodology:Professional Vs. Volunteer
Volunteers typically use kits orsend samples to professionallaboratories.
Sampling and analyticalmethods used are generallycomparable to those used byprofessionals.

The Volunteer MonitoringThe Volunteer Monitoring“System”“System”
Regional
State
National
DirectDirectServiceService
ProvidersProviders
MonitoringGroups
Volunteer Monitoring: Moving into the Mainstream, Austin TX 2000

Strong Support by the US EPANumerous Web sitesGuidance documents
Volunteer Lake Monitoring: A Methods ManualVolunteer Estuary Monitoring: A Methods ManualVolunteer Stream Monitoring: A Methods ManualThe Volunteer Monitor’s Guide to Quality AssuranceProject Plans
Volunteer Monitor NewsletterNational Directory of Volunteer ProgramsVolunteer Monitoring List serve (~300program coordinators)Workshops

www.usawaterquality.org/volunteer

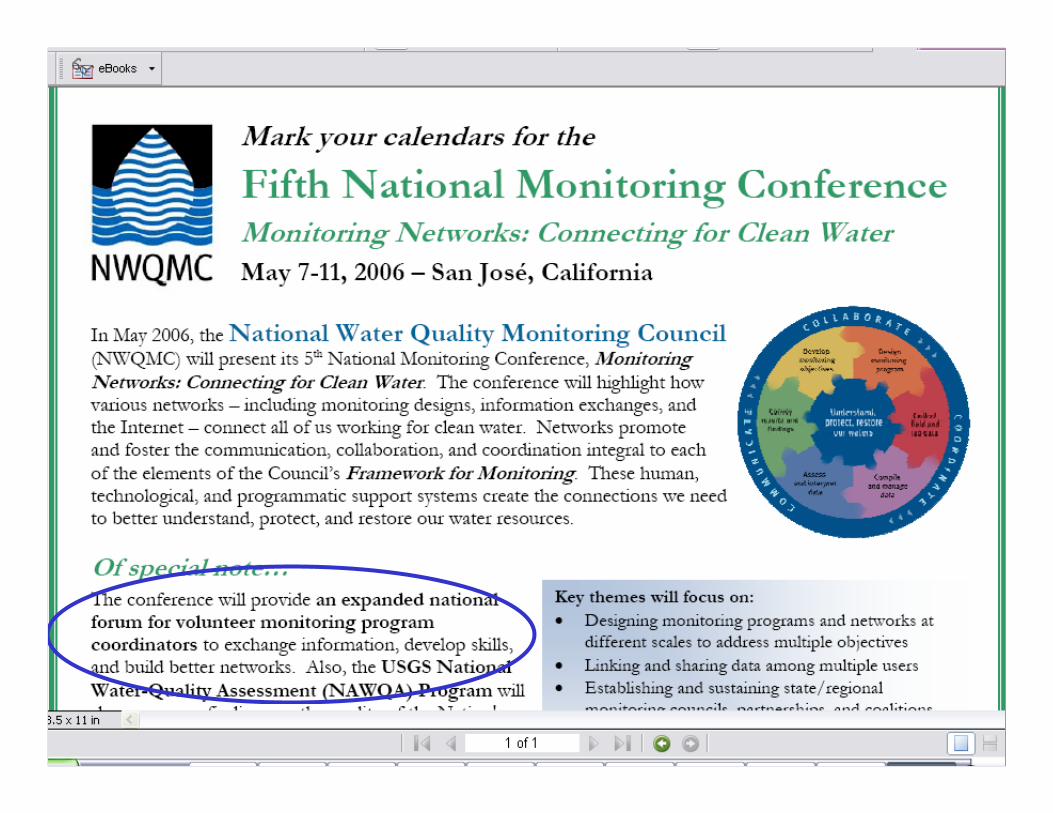
The National Water Quality Monitoring Councilprovides a national forum to coordinate consistentand scientifically defensible methods and strategiesfor improving water quality monitoring, assessment,
and reporting.
•Promoting State Monitoring Councils•Conferences
•National Environmental MethodsIndex (NEMI)
•Water Quality Data Elements

Provide organizational and technical serviceto program coordinators at all levels
Organizational development and supportStudy designTechnical training and supportAnalytical servicesData management and interpretationNetworking with other programs
State, County, Academic, andNon-profit Organizations

ChallengesMethodology
How real time does it have to be? How exact?Volunteer – professional comparisonsInvolving vs using volunteers
monitoring vs sample collectingLiability issues
The ever-rising QC barWill the data stand up in court? Should it haveto?Prescriptive techniques vs performance basedData validation issuesQAPP’s

ChallengesData Handling
Databases vs spreadsheetsWho’s data is it anyway?What route does it take thru anagencySTORET –easier to STOR than RET
FundingCost-Effective NOT cost freeStart-up funding easier than continuationCommunity support essential

Reality of Using VolunteerCollected Data
•We need more data at a higher frequencyof collection
•EPA has encouraged use of volunteercollected data
•Volunteers want to do it right
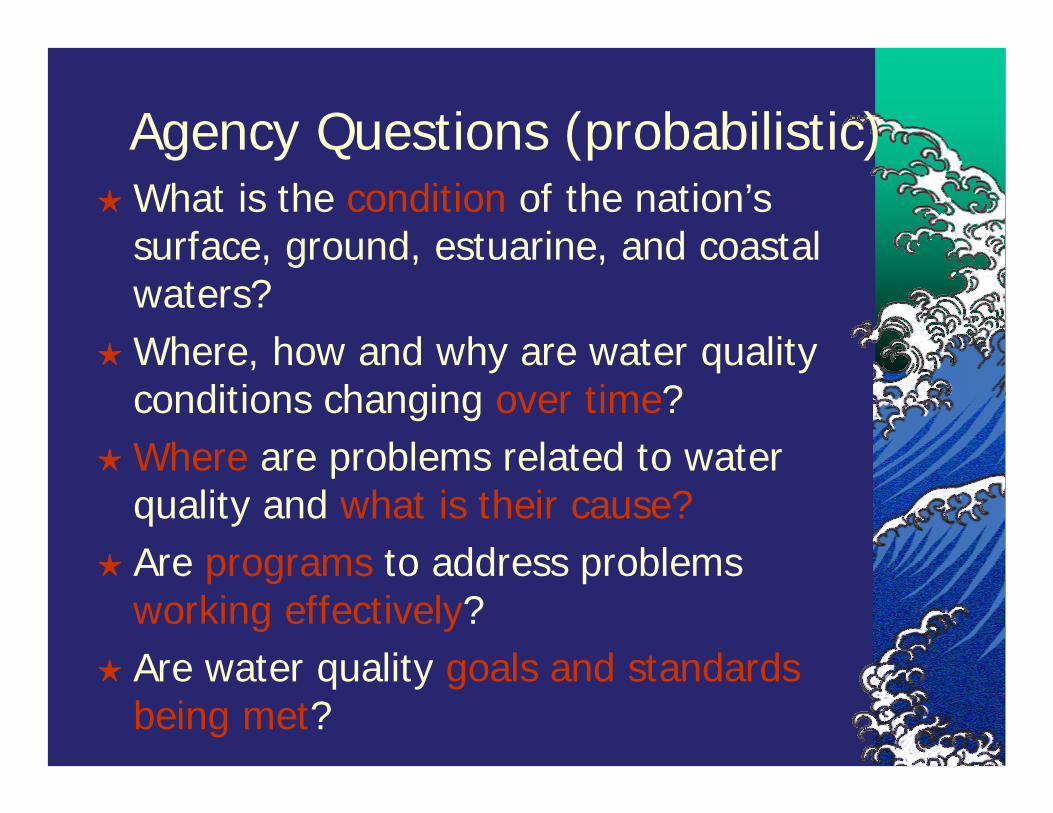
Agency Questions (probabilistic)What is the condition of the nation’ssurface, ground, estuarine, and coastalwaters?Where, how and why are water qualityconditions changing over time?Where are problems related to waterquality and what is their cause?Are programs to address problemsworking effectively?Are water quality goals and standardsbeing met?

-I want to find out what’s in mywater.
-I think there’s something wrongwith my lake/river/bay.
-Is it safe to swim in the water?
-Is it safe to drink this water?
Community and IndividualConcerns (targetted monitoring)

Development of MeaningfulIndicators for the Community
Agency needs vs organizations needsHypoxia vs no troutHypereutophication vs pea soup
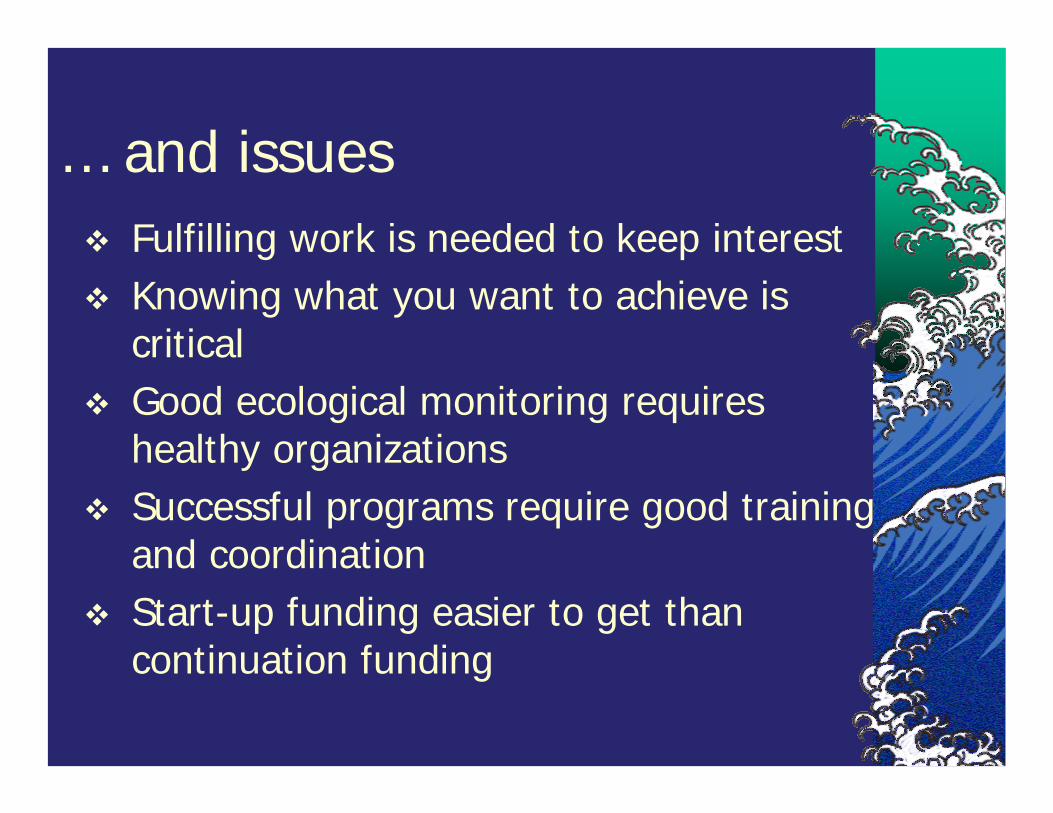
… and issuesFulfilling work is needed to keep interestKnowing what you want to achieve iscriticalGood ecological monitoring requireshealthy organizationsSuccessful programs require good trainingand coordinationStart-up funding easier to get thancontinuation funding

SuccessesVolunteer Monitoring originates in thecommunity & builds strong communitypartnershipsVolunteer monitoring educates thecommunity to make informed decisionsVolunteer monitoring provides youth withcivic lessons and hands-on scienceVolunteer monitoring provides a pathway toincreased civic activities/responsibility

SuccessesVolunteer monitoring can build familyrelationshipsVolunteer monitoring can reach underservedaudiencesVolunteer monitoring tangibly connectspeople to their environment
counteracts the plastic world of TV, videos,computer games
Ordinary people can collect good data

SuccessesHuge increase in number of locationsmonitored (~10 vol mon to 1 agency site)Source of long-term data (15, 20, 25 years…)IDs the high quality waters as well as problemareasProvides agency personnel the opportunity toget out in the fieldCan gain support for agency initiatives

Volunteer MonitoringMakes A DifferenceIdentifies & solves problems locallyInvolves people in real scienceRaises awareness, and educatesProvides info on places where no oneelse is lookingCreates an informed constituencyCreates stewards

Volunteers- The Wave of theFuture for Watershed Planningand Implementation - C. Snyder, PA DEP
Remember that only 18% ofUS waters have beenassessed
Thank you!
Geoff Dates
Jerry Schoen
Elizabeth Herron
Jeff Schloss
Danielle Donkersloot
Kris Stepenuck