sud gap analysis reportâ•fidraft hp final
TRANSCRIPT

New Mexico Substance Use Disorder Treatment Gap Analysis
January 2020

New Mexico Substance Use Disorder Treatment Gap Analysis
PREPARED BY
New Mexico Department of Health Kathyleen Kunkel Cabinet Secretary
January 2020
Page | 2
SUBSTANCE USE DISORDER TREATMENT GAP ANALYSIS | New Mexico Department of Health | January 2020
Table of Contents EXECUTIVE SUMMARY
Introduction ............................................................................... 1 Acknowledgements ................................................................... 1 Trends ........................................................................................ 2 Treatment Capacity ................................................................... 3 Treatment Gap Analysis ............................................................. 3 Recommendations ..................................................................... 5
TREATMENT CAPACITY
Methods ................................................................................... 6 Results ...................................................................................... 7 Treatment Locations ............................................................ 8
TREATMENT GAP ANALYSIS
People in Treatment ............................................................ 12 Methods ................................................................................... 12 Results ...................................................................................... 13
People Living with SUD ........................................................ 16 Methods ................................................................................... 16 Results ...................................................................................... 17
Treatment Gap .................................................................... 20
RECOMMENDATIONS
Strategies to Meet Identified Gaps ....................................... 23 Maintenance of SUD Treatment Provider Dataset................. 23
REFERENCES
References .......................................................................... 24 Appendix A: Provider Survey Instrument ................................. 25 Appendix B: Death Rate Maps .................................................. 27

SUBSTANCE USE DISORDER TREATMENT GAP ANALYSIS | New Mexico Department of Health | January 2020
Page | 1
Introduction The New Mexico Department of Health’s (NMDOH) mission is to promote health and wellness, improve health outcomes, and assure safety net services for all people in New Mexico. The information provided in this document addresses one of the leading causes of early death for New Mexicans – the misuse of substances including alcohol and drugs.
This report aims to provide an overview of substance use disorder (SUD) treatment services currently available across the state and by county for individuals, families, and communities. It also presents an estimate of people who are living with a SUD in New Mexico, both for those who have received some treatment as well as those who may need treatment but have not received it during 2018. Finally, this report offers recommendations on which additional services and/or approaches are needed to maximize current resources and address gaps in services.
The treatment availability portion of this study was conducted during the fourth quarter of the 2019 calendar year. The information gathered represents data available at a given point in time. The treatment gap represents the difference between the estimated number of people living with a SUD and the number of people who received treatment for a SUD in 2018.
Acknowledgements The information presented in this report is the result of input provided to the NMDOH Epidemiology and Response Division by several state agencies, including:
Children, Youth and Families Department (CYFD) Behavioral Health Services
Human Services Department (HSD) Behavioral Health Services Division (BHSD)
Department of Finance Administration Local Driving While Impaired Program
Regulation and Licensing Department Board of Pharmacy
The Substance Abuse Epidemiology Section and Prescription Drug Overdose Prevention Program of the Epidemiology and Response Division oversaw development of the treatment capacity data collection and provider survey instrument and conducted the treatment gap analysis.
Treatment capacity data collection and report drafting were conducted by an independent contractor, Creative Communications, Inc., under the direction of company President Cathy Imburgia.
Executive Summary

Page | 2
SUBSTANCE USE DISORDER TREATMENT GAP ANALYSIS | New Mexico Department of Health | January 2020
Trends Substance use is a significant public health issue in New Mexico. For nearly four decades, New Mexico has ranked among the highest in the nation for alcohol-related death. In 2018, New Mexico recorded its highest ever alcohol-related death rate at 70.3 deaths per 100,000 population. Nationally, one in ten deaths among working age adults (20-64 years) is attributable to alcohol. In New Mexico, this ratio is twice as high at one in five deaths.
Drug overdose death has also long been a significant public health issue in New Mexico. In 2018, the state recorded its second highest drug overdose death rate at 26.6 deaths per 100,000 population. Overdose deaths involving methamphetamine increased in 2018, overtaking non-fentanyl prescription opioids as the drug most commonly causing drug overdose death in New Mexico. It is also important to note that
many overdose deaths involve more than one substance making polysubstance use an important public health issue. Both alcohol-related death rates and drug overdose death rates by county for the aggregated five-year period 2014-2018 are shown in Figure 1.
The consequences of substance use constitute a huge burden on the state's economy as they are most prevalent among working age adults (20- 64 years). Deaths due to substance use disproportionately affect men, and alcohol-related death disparately affects the American Indian population in New Mexico. The negative consequences of substance use are not limited to death, but also include domestic violence, crime, poverty, and unemployment, as well as motor vehicle crash and other injuries, mental illness, and a number of other medical problems.
FIGURE 1 Alcohol-Related Death Rates and Drug Overdose Death Rates by County, New Mexico, 2014–2018
Source: NMDOH Bureau of Vital Records and Health Statistics

Page | 3
SUBSTANCE USE DISORDER TREATMENT GAP ANALYSIS | New Mexico Department of Health | January 2020
Treatment Capacity
From October 2019 through January 2020, 308 treatment locations were identified and included in this report. All but three locations completed profiles. For those three locations, as much information as possible was included based on the locations’ websites or administrative staff that knew only general information about SUD treatment at their location.
The locations profiled include facilities that provide Inpatient or Residential services, Intensive Outpatient (IOP) services, and Outpatient services. At least one SUD treatment service location has been identified in each of the 33 counties within the state. In addition, many treatment locations and primary care providers are offering Medication-Assisted Treatment (MAT). MAT is the use of medication (e.g. methadone, buprenorphine, or naltrexone) to treat substance use disorders, often with other supportive services, and is considered the gold standard for opioid use disorder treatment (Substance Abuse and Mental Health Services Administration [SAMHSA], 2019). Table 1 on page 4 shows treatment locations by county.
Treatment capacity data represents a snapshot of what was available at the point in time when the study was conducted. Many outpatient treatment slots could not be accurately reconciled as some locations do not have a mechanism in place to track SUD patients separately from patients being seen for other issues. The total number of treatment slots identified in the study was 22,553, and 74% (16,644) of those slots were filled at the point-in-time census.
Treatment Gap Analysis People in Treatment
Estimates of persons receiving treatment in calendar year 2018, the most recent year for which data were available, were produced. In 2018, there were 70,303 total substance use treatment patients across all included datasets, with treatment most often provided for opioid misuse/use disorder and alcohol use disorder. The total number of MAT patients was 15,948.
People Living with SUD
Multiple sources of data were used to create a synthetic estimate of the number of persons in the state who were living with any substance use disorder in 2018. This synthetic estimate yielded 204,681 persons living with a substance use disorder. Alcohol use disorder (AUD) was the most common SUD, with an estimated 101,012 persons living with an AUD. Opioid (38,989) and cannabis (17,766) were the next most common use disorders.
Estimated Treatment Gap
The treatment gap represents the difference between the estimated number of people living with a SUD in 2018 and the number of people who received SUD treatment in 2018. The total number of persons living with a SUD was estimated to be 204,681 persons. Based on available data, approximately 70,303 persons received some treatment in 2018. The calculated gap suggests an estimated 134,378 persons needing but not receiving treatment for their SUD in 2018. The largest gaps by substance type were for alcohol (73,178) and benzodiazepines (14,218).

Page | 4
SUBSTANCE USE DISORDER TREATMENT GAP ANALYSIS | New Mexico Department of Health | January 2020
Table 1
Substance Use Disorder Treatment Locations by County, New Mexico, 2019 Number of Locations Providing: Number of Locations Providing:
County Total Number of Locations
Inpatient Services
Outpatient Services
IOP Services MAT
% Providing MAT Methadone Buprenorphine Naltrexone
Individual MAT Providers*
Bernalillo 89 20 67 22 37 42% 10 29 11 106 Catron 1 0 1 0 0 0% 0 0 0 0 Chaves 4 1 3 1 3 75% 1 1 2 4 Cibola 10 1 9 1 2 20% 0 1 1 3 Colfax 4 0 4 1 1 25% 0 1 0 1 Curry 3 0 3 1 0 0% 0 0 0 0 De Baca 1 0 1 0 0 0% 0 0 0 0 Doña Ana 23 2 17 6 8 35% 1 8 3 17 Eddy 5 1 4 1 2 40% 0 2 0 4 Grant 7 1 5 3 1 14% 0 1 0 2 Guadalupe 5 0 5 0 1 20% 0 1 0 1 Harding 1 0 1 0 1 100% 0 1 0 1 Hidalgo 2 0 2 0 1 50% 0 1 0 2 Lea 2 0 2 1 1 50% 0 1 0 1 Lincoln 1 0 1 0 1 100% 0 1 0 1 Los Alamos 2 0 2 1 0 0% 0 0 0 0 Luna 5 0 4 1 0 0% 0 0 0 0 McKinley 10 3 9 1 2 20% 0 2 2 2 Mora 2 0 2 0 2 100% 0 2 0 2 Otero 7 1 7 2 1 14% 0 1 0 0 Quay 2 0 2 0 0 0% 0 0 0 0 Rio Arriba 18 2 16 3 11 61% 1 10 4 30 Roosevelt 2 0 2 0 1 50% 0 0 1 1 San Juan 11 3 10 5 1 9% 1 0 0 2 San Miguel 8 0 7 3 5 63% 0 5 2 12 Sandoval 26 2 24 9 9 35% 1 4 4 11 Santa Fe 25 4 21 5 13 52% 2 10 6 38 Sierra 4 0 4 0 1 25% 0 1 0 2 Socorro 3 0 3 0 3 100% 0 3 0 2 Taos 12 3 10 2 5 42% 0 5 0 7 Torrance 2 0 2 0 0 0% 0 0 0 0 Union 2 0 2 0 0 0% 0 0 0 0 Valencia 9 0 8 2 5 56% 1 4 3 7 New Mexico 308 44 260 71 118 38% 18 95 39 259
This table represents Point-In-Time data collected from the SUD treatment locations profiled from October 2019 through January 2020. All but three locations completed profiles. IOP = Intensive Outpatient Services; MAT = Medication-Assisted Treatment *Individual providers at the identified SUD treatment locations.

Page | 5
SUBSTANCE USE DISORDER TREATMENT GAP ANALYSIS | New Mexico Department of Health | January 2020
Recommendations
This report highlights the need to close the treatment gap and better utilize resources available in the state. One way to do this is to use a continuum of care approach. Substance use issues are complex and require both prevention and treatment interventions. This report also demonstrates unequal access to care, with rural New Mexicans at a disadvantage compared to urban New Mexicans.
The effort to map existing substance use disorder treatment providers and identify gaps is one step in an ongoing effort to expand and promote access to effective SUD treatment services throughout the state.
Some recommendations to address the identified gap of more than 100,000 people in New Mexico who need but do not receive treatment for their SUD include:
Integrate SUD screenings and treatment into primary care.
Utilize emergency departments, hospitals, and the criminal justice system as entry points for screening and treatment services.
Provide additional supports to rural healthcare practitioners and mental health therapists to provide SUD screening and treatment.
Increase availability of SUD treatment including MAT services at all points of entry (primary care, syringe services programs, emergency departments, corrections facilities, etc.)
Increase access to SUD treatment including MAT throughout New Mexico including supportive services.
Many treatment locations reported that patients often cancel appointments due to lack of money for copays, difficulty obtaining transportation, and not having a caregiver available for children or elderly family members.
Dedicate resources for treatment of alcohol dependence and the growing misuse of methamphetamine.
Increase the use and availability of technology to promote and enhance a continuum of care.
The OpenBeds platform (https://openbeds.net/) is a system HSD is implementing both to connect treatment providers as a network and to connect persons searching for SUD treatment to an appropriate treatment location.
Maintain and update the gap analysis annually.

Page | 6
SUBSTANCE USE DISORDER TREATMENT GAP ANALYSIS | New Mexico Department of Health | January 2020
Survey Questions Location
Types of SUD Treatment Services
Types of SUDs Treated
Wait Time
MAT Offered
Related Services Offered
Population Served
Disqualifiers
Payment Method
Other Recovery Services
The survey instrument is included in Appendix A.
METHODS The method to identify current SUD treatment locations in New Mexico involved a three-step process: 1) identify providers and facilities via online research; 2) compare supplied lists from multiple sources, remove duplicates, and compile the final contact list; and 3) survey each identified location by phone and follow-up emails to complete the survey instrument (Appendix A). Following are detailed methods of how the 308 locations in this report were contacted and surveyed.
Step 1: Identify Locations
Due to the lack of a comprehensive, up-to-date list of New Mexico SUD treatment locations, the initial step included online research to compile a list of current contact information for identified sites. National directory websites that provide data by state, such as Start Your Recovery, were used to compile the initial contact list. Many online lists are not updated frequently enough to account for the constantly changing composition of services in New Mexico.
Step 2: Compare Provided Lists
Lists of treatment locations from multiple sources were supplied to the contractor. Lists included: Networks of Care; NM Substance Abuse Resource Directory; Suboxone Providers in NM; State Opiate Treatment Programs; Medicaid Payer List, among others. All supplied lists were compared and validated to the list generated during step one to both
remove duplicates and add treatment locations not included.
Step 3: Survey Identified Treatment Locations
From October 2019 through January 2020, locations from the final list were contacted by phone to verify if SUD treatment was indeed offered by them the types of services available. When multiple locations were identified within one organization, each of the locations was contacted separately to obtain site-specific information. Over 1,000 phone calls were made. Locations were excluded from the final total if they were no longer in business or if they stated they did not provide SUD treatment. In total, 308 SUD treatment locations were included in the final number, and 305 locations completed profiles. For the three remaining locations, general SUD treatment information was obtained from their website or available administrative staff.
Treatment Capacity
Page | 7
SUBSTANCE USE DISORDER TREATMENT GAP ANALYSIS | New Mexico Department of Health | January 2020
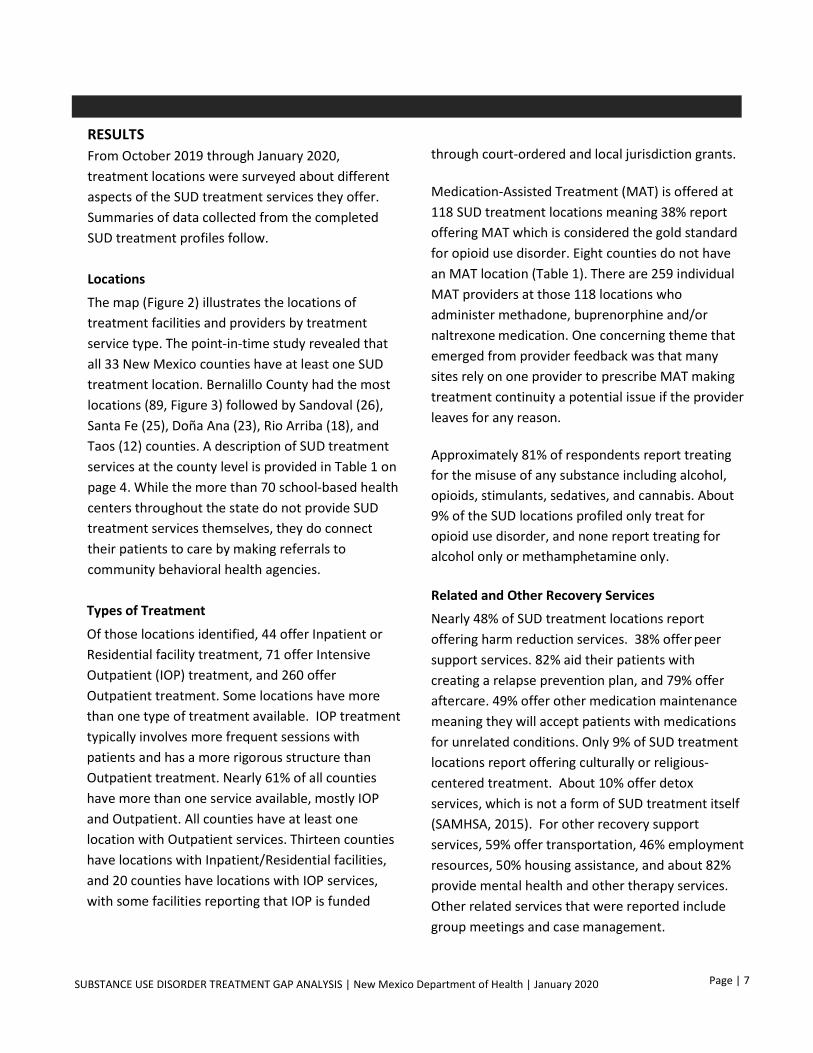
RESULTS From October 2019 through January 2020, treatment locations were surveyed about different aspects of the SUD treatment services they offer. Summaries of data collected from the completed SUD treatment profiles follow. Locations
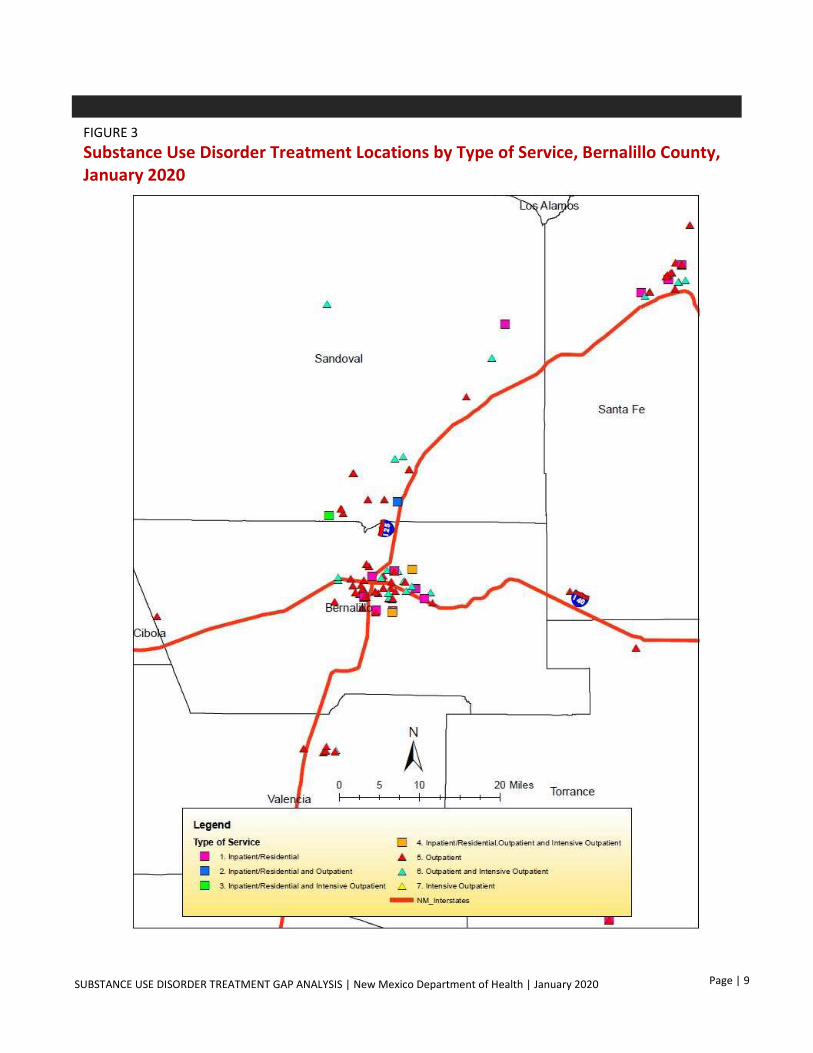
The map (Figure 2) illustrates the locations of treatment facilities and providers by treatment service type. The point-in-time study revealed that all 33 New Mexico counties have at least one SUD treatment location. Bernalillo County had the most locations (89, Figure 3) followed by Sandoval (26), Santa Fe (25), Doña Ana (23), Rio Arriba (18), and Taos (12) counties. A description of SUD treatment services at the county level is provided in Table 1 on page 4. While the more than 70 school-based health centers throughout the state do not provide SUD treatment services themselves, they do connect their patients to care by making referrals to community behavioral health agencies. Types of Treatment
Of those locations identified, 44 offer Inpatient or Residential facility treatment, 71 offer Intensive Outpatient (IOP) treatment, and 260 offer Outpatient treatment. Some locations have more than one type of treatment available. IOP treatment typically involves more frequent sessions with patients and has a more rigorous structure than Outpatient treatment. Nearly 61% of all counties have more than one service available, mostly IOP and Outpatient. All counties have at least one location with Outpatient services. Thirteen counties have locations with Inpatient/Residential facilities, and 20 counties have locations with IOP services, with some facilities reporting that IOP is funded
through court-ordered and local jurisdiction grants.
Medication-Assisted Treatment (MAT) is offered at 118 SUD treatment locations meaning 38% report offering MAT which is considered the gold standard for opioid use disorder. Eight counties do not have an MAT location (Table 1). There are 259 individual MAT providers at those 118 locations who administer methadone, buprenorphine and/or naltrexone medication. One concerning theme that emerged from provider feedback was that many sites rely on one provider to prescribe MAT making treatment continuity a potential issue if the provider leaves for any reason.
Approximately 81% of respondents report treating for the misuse of any substance including alcohol, opioids, stimulants, sedatives, and cannabis. About 9% of the SUD locations profiled only treat for opioid use disorder, and none report treating for alcohol only or methamphetamine only. Related and Other Recovery Services
Nearly 48% of SUD treatment locations report offering harm reduction services. 38% offer peer support services. 82% aid their patients with creating a relapse prevention plan, and 79% offer aftercare. 49% offer other medication maintenance meaning they will accept patients with medications for unrelated conditions. Only 9% of SUD treatment locations report offering culturally or religious-centered treatment. About 10% offer detox services, which is not a form of SUD treatment itself (SAMHSA, 2015). For other recovery support services, 59% offer transportation, 46% employment resources, 50% housing assistance, and about 82% provide mental health and other therapy services. Other related services that were reported include group meetings and case management.

Page | 8
SUBSTANCE USE DISORDER TREATMENT GAP ANALYSIS | New Mexico Department of Health | January 2020
FIGURE 2 Substance Use Disorder Treatment Locations by Type of Service, New Mexico, January 2020
Page | 9
SUBSTANCE USE DISORDER TREATMENT GAP ANALYSIS | New Mexico Department of Health | January 2020
FIGURE 3 Substance Use Disorder Treatment Locations by Type of Service, Bernalillo County, January 2020

Page | 10
SUBSTANCE USE DISORDER TREATMENT GAP ANALYSIS | New Mexico Department of Health | January 2020
Capacity
This study attempted to gather information on both available treatment slots and a point-in- time census of patients currently in treatment for each type of treatment service offered. With available treatment slots changing daily, capacity data presented in this report represent a snapshot of what was available at the point in time when the surveys were conducted. Additional limitations include that many Outpatient locations reported that they see patients for other reasons and do not track SUD treatment separately. With these limitations, the total number of treatment slots reported is 22,553. The point-in-time census of patients was 16,644, meaning an estimated 74% of treatment slots were filled at the time of the survey. Populations Served
Approximately 61% of the locations profiled offer treatment for minors under 18 years of age, and 95% provide services to adults 18+. The majority of treatment locations offer services for both children and adults, with only six of the respondents providing services specifically for minors. Treatment services are available for male, female, and transgender populations, with 88% of locations offering services for all. Figure 4 illustrates the number of treatment locations by populations served including special populations like pregnant women and individuals with certain health conditions. 51 locations allow a parent to bring children with them either to their sessions or in transitional living houses, removing the barrier of finding child care during treatment.
Disqualifiers
About 35% of the SUD treatment locations report having reasons to disqualify a person from receiving treatment. Reasons provided include sexual offenders, violent behaviors, active warrants, non-compliance to treatment, and active use of benzodiazepines (38 locations) or opioid agonists (2 locations).
Wait Time
Most treatment providers report they do not have a wait time at the point in time of the survey. For those sites that do have a wait time (33%), the most frequent average wait time reported was 1-2 weeks. The longest average wait time disclosed was 2-3 months. Reasons given for the wait time were availability and the need to conduct pre-qualification screenings. Payment Methods
All but 32 profiled treatment locations accept Medicaid payment for services. While private insurance is accepted by 81% of the sites, providers report some private insurance carriers limit contracts to new providers making it difficult to fully service their communities. Self-pay, grant-funded, PRC/IHS, and CYFD/HSD funding are other reported methods of payment, with most of the reported grant-funded services available through local jurisdiction, Department of Corrections, or SAMHSA agreements.

Page | 11
SUBSTANCE USE DISORDER TREATMENT GAP ANALYSIS | New Mexico Department of Health | January 2020
FIGURE 4 Populations Served by New Mexico SUD Treatment Providers, 2019
Limitations
There are several limitations to this point-in-time study. Information provided by many treatment providers was reported to change frequently. Much of the data collected is the result of available administrative staff willing to respond to the phone interview to the best of their ability. Three facilities were unable to be profiled due to lack of response. However, some general SUD treatment information was able to be obtained from their website or from other staff about what types of services they provide.
275
275
51
276
240
273
294
291
294
189
0 50 100 150 200 250 300
HIV/AIDS, TB, Viral Hepatitis
Chronic Health Conditions
Parent can bring Children
Physical Disablities
Pregnant Women
Transgender
Female
Male
Adults 18+
Minors <18
Number of Locations
Page | 12
SUBSTANCE USE DISORDER TREATMENT GAP ANALYSIS | New Mexico Department of Health | January 2020
People in Treatment Estimate of New Mexicans Who Received Treatment for SUD in 2018
Estimates of people receiving treatment for a substance use disorder in calendar year 2018 in New Mexico were produced. The estimate of people in treatment was calculated based on available treatment data from the New Mexico Prescription Monitoring Program (PMP) of the New Mexico Board of Pharmacy, Medicaid claims from the New Mexico Human Services Department (HSD), and local driving while impaired (LDWI) program data.
METHODS Data from the PMP were the number of people receiving medication assisted treatment (MAT) in the form of buprenorphine/naloxone by county. This estimate was the unduplicated count of MAT patients with 10+ days of MAT in 2018. Data were aggregated to the state and county level.
HSD provided counts of people who received Medicaid paid methadone services from opioid treatment providers (OTP). OTPs or ‘Methadone Clinics’ provide substance use treatment including dispensing methadone to clients. This is the only source of information on people receiving MAT in the form of methadone.
HSD also provided data on Medicaid paid services from providers other than OTPs. These services were for substance use disorder treatment (SUD)
for any SUD including opioid use disorder (OUD), alcohol use disorder (AUD), stimulant use disorder (usually methamphetamine use), benzodiazepine (hypnotic sedative) use disorder, cannabis use disorder (CUD), and other substance use disorder. Medicaid data inclusion criteria were any patient with SUD services and a substance misuse related ICD10-CM code from diagnostic code fields 1 through 12. Diagnostic codes included were any code beginning with F10, F11, F12, F13, F14, F15, F16, F18, or F19. All data were aggregated to the state and county level.
HSD also provided Treatment Episode Data Set (TEDS) data for 2018. TEDS included details on people receiving publicly-funded (non-Medicaid) treatment. TEDS inclusion criteria were the same as for Medicaid data. HSD provided county-level TEDS data by substance use category.
The New Mexico Department of Finance Administration (DFA) provided Local DWI program data for 2018. These data included counts of LDWI clients who were assigned to treatment. The local DWI program fund paid for treatment for LDWI clients. LDWI clients are asked their primary substance of use, and this information was used to categorize patients by substance. LDWI clients most often identified alcohol or cannabis as their primary substance. Based on this, counts of LDWI treatment patients are aggregated to the state and county-level for total (any substance), alcohol, and cannabis treatment patients.
Treatment Gap Analysis

Page | 13
SUBSTANCE USE DISORDER TREATMENT GAP ANALYSIS | New Mexico Department of Health | January 2020
RESULTS
In 2018 the total number of MAT patients was 15,948. This includes patients at opioid treatment programs (OTPs) who received methadone services paid for by Medicaid (6,911) and patients who received 10 or more days of buprenorphine/naloxone (9,037) based on PMP data. Medicaid paid for buprenorphine/naloxone for 6,275 patients (who are also counted in the Medicaid paid OUD services total). The estimate of patients receiving non-Medicaid paid buprenorphine/naloxone was 2,762. Medicaid paid for SUD treatment for 52,139 patients in 2018. Of these, 20,999 received services for OUD, 23,237 received services for AUD, 12,047 received services for methamphetamine use (amphetamine use disorder), 10,826 received services for CUD, and 1,756 received services for benzodiazepine use disorder (sedative hypnotic use disorder). These counts are not mutually exclusive because some patients received treatment for more than one use disorder. Also, some patients received services for substance misuse without a SUD diagnosis. The TEDS report showed a total of 5,961 people treated for an SUD. Of this total, 2,743 received services for opioids, 2,278 for alcohol, 787 for stimulants, 116 for cannabis, 13 for benzodiazepines, and 24 for other substances. These counts are mutually exclusive. Some patients may have also received services for a second or subsequent substance during the course of treatment for their primary substance. The LDWI file showed a total of 2,987 people referred for treatment, of whom 2,209 needed
services for alcohol, 638 for cannabis, and 140 for other substances. These counts are mutually exclusive. Some patients may have also received services for a second or subsequent substance during the course of treatment for their primary substance. The estimate of SUD patients from the included data sources was the sum of the Medicaid SUD patient count, TEDS patients, LDWI total treatment clients, methadone patients, and the estimate of non-Medicaid buprenorphine/naloxone treatment patients. The estimate of OUD patients was the sum of the Medicaid OUD count, TEDS OUD count, methadone patients, and the estimate of non-Medicaid buprenorphine/naloxone treatment patients. The estimate of AUD patients was the sum of Medicaid, TEDS, and LDWI AUD patients. The estimate of stimulant (methamphetamine) use disorder patients was the sum of the Medicaid and TEDS methamphetamine patients. The estimate of benzodiazepine use disorder patients was the sum of the Medicaid and TEDS benzodiazepine patients. The estimate of CUD patients was the sum of the Medicaid, TEDS, and LDWI cannabis use patients. In 2018 there were an estimated 70,303 people receiving SUD treatment across all included datasets (Table 2). Of these at least 33,415 received services for OUD, 27,724 for AUD, 12,834 for methamphetamine use disorder, 11,580 for CUD, and 1,769 for benzodiazepine use disorder. These patients received treatment for any duration in 2018.

Page | 14
SUBSTANCE USE DISORDER TREATMENT GAP ANALYSIS | New Mexico Department of Health | January 2020
Table 2
Estimate of People Who Received Any Treatment for SUD by County and Substance, New Mexico, 2018
Individual substance treatment categories are not mutually exclusive.
County
Total Substance Use
Treatment Patients
Opioid Use Treatment
Patients
Amphetamine Use Treatment
Patients
Alcohol Use Treatment
Patients
Benzodiazepine Use Treatment
Patients
Cannabis Use Treatment
Patients
Bernalillo 24,045 14,529 3,872 7,137 647 3,413
Catron 38 6 8 19 0 10
Chaves 1,408 416 419 641 90 354
Cibola 992 214 197 622 8 184
Colfax 545 196 207 191 7 104
Curry 957 172 304 448 22 382
De Baca 44 14 16 19 4 7
Dona Ana 4,572 1,735 914 1,878 147 1,156
Eddy 1,395 535 416 497 39 202
Grant 853 241 288 363 19 203
Guadalupe 143 45 39 68 3 35
Harding 5 3 0 1 0 1
Hidalgo 96 32 42 33 2 13
Lea 1,231 286 414 408 25 395
Lincoln 435 110 125 208 22 95
Los Alamos 161 85 12 71 4 21
Luna 596 145 199 255 12 161
McKinley 2,377 350 249 1,813 22 444
Mora 145 60 14 78 3 15
Otero 1,551 436 470 743 88 360
Quay 245 65 78 107 2 79
Rio Arriba 3,282 2,398 188 926 93 216
Roosevelt 323 68 114 139 8 119
San Juan 4,592 924 852 3,075 47 766
San Miguel 1,501 565 212 747 38 295
Sandoval 3,402 1,433 480 1,523 75 595
Santa Fe 8,920 5,124 1,537 3,054 200 1,060
Sierra 373 129 75 171 4 77
Socorro 979 605 210 273 24 123
Taos 1,869 652 203 1,078 38 198
Torrance 560 356 104 141 10 63
Union 59 8 26 28 1 14
Valencia 2,609 1,435 533 714 65 394
New Mexico 70,303 33,415 12,834 27,724 1,769 11,580

Page | 15
SUBSTANCE USE DISORDER TREATMENT GAP ANALYSIS | New Mexico Department of Health | January 2020
Private Insurance and Medicare Data for services paid by private insurance or Medicare were estimated based on available data sources. This estimate was not included in the final count of people who had received treatment in 2018. Using available PMP data and the TEDS report, it is estimated that between 9-15% of patients receiving buprenorphine/naloxone MAT for OUD were not covered by Medicaid or state funding. The largest proportions of the remaining 9-15% are Medicare and private insurance. The Hospital Inpatient Discharge Dataset (HIDD) was also queried for SUD-related visits in 2018 and payor type. For the 2018 data, 71% of visits were paid for by Medicaid, 23% were paid by Medicare, and 6% were paid by private insurance. Based on these two estimates of the proportion of SUD treatment not paid for by Medicaid, the estimate generated of people who received treatment in 2018 may be only 71-91% complete.
Limitations A major limitation of this study was related to the varied definitions of SUD treatment. Treatment can be provided for people who are misusing substance(s) but do not have a SUD diagnosis. This may be due to people proactively seeking treatment for problematic use, or to others (courts, employers, or, in the case of minors, parents) mandating treatment.
A second limitation is that information from private insurance and Medicare was not available for inclusion in this study. This was in part due to the short deadline for this study. In future updates, private insurance and Medicare should be included to provide a fuller picture of SUD treatment in New Mexico. An all-payor claims database would allow for easier access to these data.
Page | 16
SUBSTANCE USE DISORDER TREATMENT GAP ANALYSIS | New Mexico Department of Health | January 2020
People Living with SUD
Synthetic Estimate of New Mexicans Living with SUD in 2018
Multiple sources of data were used to create a synthetic estimate of the number of people in New Mexico who were living with substance use disorders in 2018. A broad net was cast for data collection; however, not all data collected were used in the synthetic estimate. Data sources were the NM PMP, NM Syndromic Surveillance, NMDOH Harm Reduction Syringe Services Program (SSP), SAMHSA National Survey of Drug Use and Health (NSDUH), and the US Department of Justice Bureau of Justice Statistics.
METHODS
A search of the published literature on synthetic estimates of people living with substance abuse disorders was conducted in October 2019 using PubMed. The methodology employed for this synthetic estimate was informed by five articles that were most similar to the current project and that included detailed methods. The New Mexico PMP contains records of all controlled substance prescription fills at retail pharmacies. PMP data included for the synthetic estimate were the number of people in 2018 with chronic opioid prescriptions and with chronic benzodiazepine prescriptions. An estimated 25% of people on chronic opioids or benzodiazepines may have a use disorder (Vowles et al., 2015; NIDA, 2019; American Addiction Centers, 2019; Gerlach et al., 2018). A literature search yielded no published
research on use disorder rates for persons with both chronic opioids and benzodiazepines (duo-use patients). Therefore, duo-use patients were included only in the synthetic estimate for OUD to remove duplicates in the total synthetic estimate. Summary tables from the 2017 NSDUH survey (Lipari & Van Horn, 2017) included state-level estimates of past year drug use, past month drug use, and of people living with use disorders by age group. NSDUH estimates of the percent of the population aged 12 or older living with untreated AUD, past year heroin use, past year methamphetamine use, past year abuse of prescription pain killers, and with past month cannabis use were included in the synthetic estimate as described further in the results. While NSDUH also had estimates of persons living with any SUD and with SUDs other than AUD as separate categories, these estimates were excluded from the final synthetic estimate as they were much lower than the total estimate based on other sources. NMDOH Harm Reduction SSP data include the total number of clients by county and the percentage of clients who used heroin (an opioid), or methamphetamine (a stimulant), or both. Client counts are from New Mexico state Fiscal Year 2018 (FY18). The percentages of clients who used heroin or methamphetamine were based on Point-In-Time surveys conducted at SSP sites in 2017 and 2019. Counts of clients by the percentage of substance used (heroin or methamphetamine) were included in this estimate in their respective substance use categories (opioid or stimulant). While some overlap exists due to polysubstance use, the

Page | 17
SUBSTANCE USE DISORDER TREATMENT GAP ANALYSIS | New Mexico Department of Health | January 2020
polysubstance use estimates from SSP data were not included in the final synthetic estimate to avoid duplication. The Prison Policy Initiative produces annual reports of incarceration rates for the US. They report that in 2018 New Mexico had an incarceration rate of 829 per 100,000 population (Wagner & Sawyer, 2018).
The NM Syndromic Surveillance system includes all Emergency Department (ED) data from all but one non-federal ED in 2018. Counts of patients seen in an ED for a suspected opioid poisoning or a suspected amphetamine poisoning were collected from the NM Syndromic Surveillance system for ED visits in 2018. For these data all diagnosis fields were included. While these data were informative, they were ultimately excluded from the synthetic estimate as these counts could not be disentangled from other data sources included.
RESULTS
Using 2018 PMP data and applying the estimated use disorder rate of 25% for chronic use patients, an estimated 17,256 persons receiving prescription opioids may have an OUD, and an estimated 15,987 persons receiving prescription benzodiazepines may have a benzodiazepine (hypnotic sedative) use disorder. These estimates were included in the final synthetic estimate (Table 3). To avoid duplication in the AUD counts, the NSDUH estimate of persons aged 12 or older living with an untreated AUD (5.57%) was chosen yielding an estimated 101,012 persons with AUD in New Mexico in 2018 (Table 3).
The estimate of persons with CUD were generated using the NSDUH past 30-day use rate (11.96%) and an estimate of the percent of cannabis users who may develop a CUD (9%) (Lopez-Quintero et al., 2011). Based on these rates, an estimated 17,766 persons aged 12 or older in New Mexico have CUD (Table 3).
In FY18, there were 14,164 clients in the NMDOH Harm Reduction SSP. Unweighted averages of the Point-in-Time surveys were calculated. 77.5% of SSP clients used heroin, and 51.5% of SSP clients used methamphetamine. Applying these percentages to the total client population yields approximately 10,977 clients who used heroin and an estimated 7,294 who used methamphetamine. Based on the NSDUH, 0.34% of New Mexicans aged 12 or older used heroin in the past year or 6,166 persons. The estimate for SSP clients who used heroin was 10,977. For each county the larger of the two estimates, SSP or NSDUH, was included as the estimate of people living with heroin use disorder for that county. The New Mexico statewide total for heroin use was calculated as the sum of the county estimates. NSDUH estimated 0.52% of New Mexicans aged 12 or older misused prescription opioids for a total of 9,430 persons with prescription opioid use disorder. This estimate and the heroin use estimate were included in the final synthetic estimate in the OUD category along with the estimate based on the PMP data as described previously (Table 3). NSDUH estimated 1.19% of New Mexicans aged 12 or older used methamphetamine in the past year. Applying this estimate to the New Mexico population yielded an estimated 21,694 persons

Page | 18
SUBSTANCE USE DISORDER TREATMENT GAP ANALYSIS | New Mexico Department of Health | January 2020
living with a methamphetamine use disorder. As with the heroin estimates for each county, the larger of the two estimates, SSP or NSDUH, was used as an estimate of persons living with methamphetamine use disorder. The state total was calculated as the sum of the county estimates. These estimates were included in the final synthetic estimate in the stimulant use disorder category (Table 3). Nationally, 53% of people incarcerated in state facilities met DSM criteria for substance dependence or abuse (Muoloa & Karberg, 2004). In 2018 New Mexico had an incarceration rate of 829 per 100,000 people. Applying this rate of incarceration and percentage meeting DSM criteria to the 2018 New Mexico population yields an estimated 9,234 additional persons who may have had an unspecified use disorder in New Mexico in 2018. This estimate was included as a separate column in Table 3 because they could not be separated into specific SUD categories. In 2018 there were 6,255 ED visits for suspected opioid poisoning and 1,138 ED visits for suspected amphetamine poisoning. Not all persons who overdose are seen in an ED, and some have multiple ED visits for overdose in a year. Therefore, these counts of non-fatal overdoses are a minimum estimate. These counts, while informative, were ultimately not included in the synthetic estimate. TOTAL SYNTHETIC ESTIMATE
The final synthetic estimates (Table 3) were compiled as follows. The total estimate of persons living with OUD (38,989) included the number of people with OUD from the PMP,
heroin users as described previously, and prescription opioid misusers from the NSDUH.
The estimate of people living with methamphetamine use disorder (stimulant use disorder) were based on both the SSP and NSDUH as described previously yielding a total of 21,694 persons. The estimate of people living with untreated AUD (101,012) was based on the NSDUH. The PMP data were the sole source for the number of people living with benzodiazepine use disorder (15,987). The number of people living with CUD (17,766) was derived solely from the NSDUH. The number with unspecified use disorder (9,234) includes the estimate based on the incarcerated population as described previously. Lastly, the total number of people living with any SUD (204,681) in New Mexico in 2018 was calculated as the sum of the individual SUD estimates (Table 3). AUD was the most common SUD followed by OUD and CUD.
LIMITATIONS
One limitation of generating the synthetic estimate was the reliance on NSDUH estimates. Although the NSDUH is the single best national source of information on substance use and mental health, it is known to under count some New Mexico populations. For example, in 2018 the estimated number of clients in the NMDOH Harm Reduction SSP who use heroin (10,977) was nearly twice as high as the 2017 NSDUH estimated number of persons in New Mexico who use heroin (6,166). Another limitation was that the data sources cannot be deduplicated. Therefore, the estimates may be higher or lower than the actual totals. This was particularly true for the estimated total number of persons living with SUD.

Page | 19
SUBSTANCE USE DISORDER TREATMENT GAP ANALYSIS | New Mexico Department of Health | January 2020
Table 3
Estimate of People Living with a SUD by County and Substance, New Mexico, 2018
County Total
Substance Use Disorder
Opioid Use Disorder
Stimulant Use Disorder*
Alcohol Use Disorder
Benzodiazepine Use Disorder
Cannabis Use Disorder
Unspecified Use
Disorder**
Bernalillo 66,603 13,080 7,033 32,919 4,762 5,830 2,980
Catron 335 52 39 183 12 34 15
Chaves 6,690 1,491 653 3,055 682 524 285
Cibola 2,436 408 276 1,290 117 227 119
Colfax 1,342 285 129 602 164 109 53
Curry 4,404 683 495 2,317 285 405 220
De Baca 185 35 19 87 21 15 8
Dona Ana 19,934 3,167 2,206 10,325 1,478 1,803 955
Eddy 5,642 1,111 579 2,708 520 469 256
Grant 2,787 486 289 1,354 294 243 121
Guadalupe 452 96 46 216 37 38 19
Harding 73 13 8 36 7 7 3
Hidalgo 426 84 44 206 37 37 19
Lea 6,554 1,167 689 3,225 615 546 311
Lincoln 2,140 408 208 972 292 175 86
Los Alamos 1,834 257 195 914 224 161 83
Luna 2,403 462 245 1,147 240 200 108
McKinley 5,883 861 701 3,280 171 558 313
Mora 455 83 48 225 37 41 20
Otero 6,210 997 679 3,177 500 563 294
Quay 835 157 87 409 73 72 37
Rio Arriba 4,145 948 400 1,870 427 329 172
Roosevelt 1,722 280 196 915 86 161 85
San Juan 11,577 1,828 1,285 6,016 662 1,223 563
San Miguel 3,780 613 298 1,397 315 1,034 123
Sandoval 12,715 2,281 1,496 7,004 1,044 251 638
Santa Fe 17,335 4,561 1,713 7,491 1,563 1,349 658
Sierra 1,201 241 119 557 132 103 49
Socorro 1,814 454 177 826 136 146 75
Taos 3,436 654 352 1,647 340 298 145
Torrance 1,554 298 166 778 105 138 69
Union 414 76 44 206 33 37 18
Valencia 7,365 1,372 782 3,658 580 640 334
New Mexico 204,681 38,989 21,694 101,012 15,987 17,766 9,234 *Stimulant Use Disorder included only estimates of methamphetamine use disorder. **Unspecified Use Disorder includes the estimate of incarcerated persons living with any SUD.

Page | 20
SUBSTANCE USE DISORDER TREATMENT GAP ANALYSIS | New Mexico Department of Health | January 2020
Treatment Gap
Estimate of New Mexicans Needing but Not Receiving Treatment in 2018
The treatment gap was calculated as the difference between the number of persons living with a substance use disorder and the number of persons who received any substance use disorder treatment in New Mexico in 2018. The total number of persons living with a SUD was estimated to be 204,681 persons. Based on available data, approximately 70,303 persons received some treatment in 2018. The calculated gap suggests an estimated 134,378 persons who needed but did not receive treatment for their SUD in 2018 (Table 4). The largest gaps by substance type were for alcohol (73,178) and benzodiazepines (14,218). The AUD treatment gap is particularly concerning considering the alcohol-related death rate for 2014-2018 was about 2.5 times the drug overdose death rate (65.6 deaths per 100,000 vs 25.5 deaths per 100,000). In addition, both alcohol and benzodiazepines greatly increase the risk of overdose if used concurrently with an opioid as all three substances are central nervous system depressants. While the OUD gap was the lowest, it is concerning that only 38% of treatment locations report offering MAT. MAT has been proven to improve patient survival, increase treatment retention, decrease criminal activity and illicit use, increase the patient’s ability to be gainfully employed, and improve maternal and infant outcomes for pregnant women with an OUD (SAMHSA, 2019).
Estimates by county in Table 5 show that only 4 of 33 counties in New Mexico have a percentage of persons living with an untreated SUD less than 50%. Seven counties had more than 80% of residents living with an untreated SUD. While every county was found to have at least one SUD treatment location, it is clear in Figure 2 that many New Mexicans, especially in rural counties, still have to travel long distances to their closest treatment location.
Table 4
Estimate of the SUD Treatment Gap by Substance, New Mexico, 2018
Substance Type People Living with SUD People Who Received Treatment
People Needing Treatment
People Who May Enter Treatment
Alcohol 101,012 27,834 73,178 7,318
Opioids 38,989 33,415 5,574 557
Stimulants (Methamphetamine) 21,694 12,834 8,860 886
Benzodiazepines 15,987 1,769 14,218 1,422
Cannabis 17,776 10,580 7,196 720 Total 204,681 70,303 134,378 13,438

Page | 21
SUBSTANCE USE DISORDER TREATMENT GAP ANALYSIS | New Mexico Department of Health | January 2020
Table 5
Estimate of the SUD Treatment Gap by County, New Mexico, 2018
County People Living
with SUD
People Who Received
Treatment
People Needing Treatment
% of Persons with SUD Needing
Treatment
People Who May Enter Treatment
% of Persons with SUD Who
May Enter Treatment
Bernalillo 66,603 24,045 42,558 64% 4,256 6%
Catron 335 38 297 89% 30 9%
Chaves 6,690 1,408 5,282 79% 528 8%
Cibola 2,436 992 1,444 59% 144 6%
Colfax 1,342 545 797 59% 80 6%
Curry 4,404 957 3,447 78% 345 8%
De Baca 185 44 141 76% 14 8%
Dona Ana 19,934 4,572 15,362 77% 1,536 8%
Eddy 5,642 1,395 4,247 75% 425 8%
Grant 2,787 853 1,934 69% 193 7%
Guadalupe 452 143 309 68% 31 7%
Harding 73 5 68 93% 7 10%
Hidalgo 426 96 330 77% 33 8%
Lea 6,554 1,231 5,323 81% 532 8%
Lincoln 2,140 435 1,705 80% 170 8%
Los Alamos 1,834 161 1,673 91% 167 9%
Luna 2,403 596 1,807 75% 181 8%
McKinley 5,883 2,377 3,506 60% 351 6%
Mora 455 145 310 68% 31 7%
Otero 6,210 1,551 4,659 75% 466 8%
Quay 835 245 590 71% 59 7%
Rio Arriba 4,145 3,282 863 21% 86 2%
Roosevelt 1,722 323 1,399 81% 140 8%
San Juan 11,577 4,592 6,985 60% 699 6%
San Miguel 3,780 1,501 2,279 60% 228 6%
Sandoval 12,715 3,402 9,313 73% 931 7%
Santa Fe 17,335 8,920 8,415 49% 842 5%
Sierra 1,201 373 828 69% 83 7%
Socorro 1,814 979 835 46% 83 5%
Taos 3,436 1,869 1,567 46% 157 5%
Torrance 1,554 560 994 64% 99 6%
Union 414 59 355 86% 35 8%
Valencia 7,365 2,609 4,756 65% 476 6%
New Mexico 204,681 70,303 134,378 66% 13,438 7%

Page | 22
SUBSTANCE USE DISORDER TREATMENT GAP ANALYSIS | New Mexico Department of Health | January 2020
People Who May Enter Treatment The Office of the Surgeon General estimates that only about 1 in 10 people with a SUD receive any type of SUD treatment (SAMHSA Office of the Surgeon General, 2016). This percentage was used to calculate the number of people who may enter treatment (13,438) from the number of people needing treatment (134,378). Ideally, treatment would be available to and utilized by the 134,378 people with SUDs who were not in treatment in 2018. Based on the Office of the Surgeon General estimate, only 13,438 people may enter treatment. However, it is important to note that this could be due to a variety of reasons including barriers to treatment or the perception that they do not have a use disorder.

Page | 23
SUBSTANCE USE DISORDER TREATMENT GAP ANALYSIS | New Mexico Department of Health | January 2020
Recommendations
Identified SUD Treatment Gaps New Mexico has a long history of high death rates attributable to excessive alcohol consumption and substance misuse. The problem is complex and often driven by underlying social determinants of health, including poverty and historical trauma. The effort undertaken in this report to map existing substance use treatment locations and identify gaps in treatment is one step in an ongoing effort to identify and provide information on SUD treatment services available throughout the state.
New Mexico’s geography poses certain challenges for improving health status indicators, including those associated with substance use. Providing healthcare and public health services in rural areas has many obstacles including the ability to hire and maintain a full-time workforce and the distances people must travel to get care. Even when there is a practitioner within a reasonable distance, other barriers may exist. The practitioner may not provide the type of service the person needs. They may not be accepting or have a wait list for new patients, and they may not accept the person’s insurance. People in rural areas may also be concerned about privacy for substance use treatment received in small communities.
With these obstacles to access to treatment, it is imperative that SUD screenings and treatment be integrated into primary care to fully address the more than 100,000 people in New Mexico who need but are not currently receiving treatment for their SUD. Additionally, hospitals and the criminal justice system can be better utilized as entry points into treatment.
Strategies to Address Identified Gaps
Connect people with SUD to available slots for evidence-based treatment o OpenBeds o Maintaining and disseminating the treatment
location list that resulted from this study Focus SUD treatment expansion to those counties
with greatest unmet need Integrate SUD screening and treatment into primary
care Increase evidence-based treatment for AUD and
methamphetamine (stimulant) use disorder Implement an all-payor claims database in New
Mexico to enhance tracking of SUD treatment services and track improvement in access
Maintenance of SUD Treatment
Provider Dataset The SUD Treatment Providers list is a snapshot from Fall 2019. It is important that the list be maintained and updated. Following are recommendations to maintain the list:
Single source dataset – maintaining the current list through ongoing updates.
Annual update reports – Due to the frequency of changes reported during the study, it is recommended updates be done continuously with annual reports on current providers issued.
Multiple agency involvement – NMHSD and NMDOH were the primary agencies involved in the creation of the treatment provider dataset. Future reports should have input from other agencies.
Recommendations

Page | 24
SUBSTANCE USE DISORDER TREATMENT GAP ANALYSIS | New Mexico Department of Health | January 2020
References
1. American Addiction Centers. (2019). Benzodiazepine Addiction Treatment. https://americanaddictioncenters.org/benzodiazepine
2. Gerlach LB, Maust DT, Leong SH, Mavandadi S, Oslin DW. (2018). Factors Associated with Long-term Benzodiazepine Use Among Older Adults. JAMA Internal Medicine. 2018;178(11):1560–1562. https://doi.org/10.1001/jamainternmed.2018.2413
3. Lipari, R.N. and Van Horn, S.L. (2017). Trends in substance use disorders among adults aged 18 or older. The CBHSQ Report: 2017. Center for Behavioral Health Statistics and Quality, Substance Abuse and Mental Health Services Administration, Rockville, MD. https://www.samhsa.gov/data/sites/default/files/report_2790/ShortReport-2790.html
4. Lopez-Quintero, C., Pérez de los Cobos, J., Hasin, D. S., Okuda, M., Wang, S., Grant, B. F., & Blanco, C. (2011).
Probability and predictors of transition from first use to dependence on nicotine, alcohol, cannabis, and cocaine: results of the National Epidemiologic Survey on Alcohol and Related Conditions (NESARC). Drug and Alcohol Dependence, 115(1–2), 120–130. https://doi.org/10.1016/j.drugalcdep.2010.11.004
5. Muoloa, C. and Karberg, J. (2007). Bureau of Justice Statistics Special Report; Drug Use and Dependence, State and Federal Prisoners, 2004. NCJ 213530, 2006. Revised 1/19/2007 https://www.bjs.gov/content/pub/pdf/dudsfp04.pdf
6. National Institute on Drug Abuse (NIDA). (2019) Opioid Overdose Crisis. National Institutes of Health; U.S. Department of Health and Human Services. https://www.drugabuse.gov/drugs-abuse/opioids/opioid-overdose-crisis
7. Substance Abuse and Mental Health Services Administration (SAMHSA) Center for Substance Abuse Treatment. (2015). Treatment Improvement Protocol Series. No. 45. HHS Publication No. 15-4131. https://store.samhsa.gov/system/files/sma15-4131.pdf
8. Substance Abuse and Mental Health Services Administration (SAMHSA) and Office of the Surgeon General (OSG). (2016). Facing Addiction in America: The Surgeon General's Report on Alcohol, Drugs, and Health. Washington (DC): US Department of Health and Human Services; 2016 Nov. Chapter 4, Early Intervention, Treatment, and Management of Substance Use Disorders. https://www.ncbi.nlm.nih.gov/books/NBK424859/
9. Substance Abuse and Mental Health Services Administration (SAMHSA). (2019, May). Medication and Counseling Treatment. Retrieved from https://www.samhsa.gov/medication-assisted-treatment/treatment
10. Vowles, K. E., McEntee, M. L., Siyahhan Julnes, P., Frohe, T., Ney, J. P., & van der Goes, D. N. (2015). Rates of opioid
misuse, abuse, and addiction in chronic pain: A systematic review and data synthesis. Pain, 156, 569-576.
11. Wagner, P. and Sawyer, W. (2018). States of Incarceration, the Global Context 2018. Prison Policy Initiative. https://www.prisonpolicy.org/global/2018.html

Page | 25
SUBSTANCE USE DISORDER TREATMENT GAP ANALYSIS | New Mexico Department of Health | January 2020
APPENDIX A: PROVIDER SURVEY INSTRUMENT

Page | 26
SUBSTANCE USE DISORDER TREATMENT GAP ANALYSIS | New Mexico Department of Health | January 2020

Page | 27
SUBSTANCE USE DISORDER TREATMENT GAP ANALYSIS | New Mexico Department of Health | January 2020
Appendix B: Alcohol-Related Death and Drug Overdose Death Rates (Deaths per 100,000) by County, New Mexico, 2014-2018
Alcohol-Related Death Rate
Drug Overdose Death Rate
23SUBSTANCE USE DISORDER TREATMENT AND GAP ANALYSIS | New Mexico Department of Health | December 2019
New Mexico Substance Use Disorder Treatment Gap Analysis
January 2020