sudden oak death in california: disease progression in
TRANSCRIPT

www.elsevier.com/locate/foreco
Forest Ecology and Management 213 (2005) 71–89
Sudden oak death in California: Disease progression
in oaks and tanoaks
Brice A. McPherson a,*, Sylvia R. Mori b, David L. Wood c, Andrew J. Storer d,Pavel Svihra e, N. Maggi Kelly f, Richard B. Standiford a
a Center for Forestry, College of Natural Resources, 145 Mulford Hall,
University of California, Berkeley, CA 94720, USAb Environmental Statistics Unit, United States Department of Agriculture, Forest Service,
Pacific Southwest Research Station, Albany, CA 94710, USAc Department of Environmental Science, Policy, and Management, Division of Insect Biology,
201 Wellman Hall, University of California, Berkeley, CA 94720, USAd School of Forest Resources and Environmental Science, Michigan Technological University,
1400 Townsend Drive, Houghton, MI, 49931-1295, USAe University of California Cooperative Extension, 1682 Novato Blvd., Novato, CA 94947, USA
f Department of Environmental Science, Policy, and Management, Ecosystem Sciences Division,
University of California, Berkeley, CA 94720, USA
Received 6 December 2004; received in revised form 23 March 2005; accepted 25 March 2005
Abstract
Sudden oak death (SOD), caused by Phytophthora ramorum, is killing oaks and tanoaks in the Coast Ranges of California,
from Monterey County to Humboldt County. In March 2000, 20 disease progression plots were established in Marin County,
California, to characterize the progress of disease symptoms, and to determine the fidelity of the association of three or more
bark and ambrosia beetle species (Coleoptera: Scolytidae) with diseased oaks and tanoaks. Symptoms of sudden oak death and
signs of associated organisms were recorded from coast live oaks (Quercus agrifolia), California black oaks (Q. kelloggii),
valley oaks (Q. lobata), and tanoaks (Lithocarpus densiflorus), four times per year, from March 2000 through March 2003.
Symptoms and signs in Q. agrifolia progressed from bleeding, to infestation by scolytid beetles, to the development of fruiting
structures of the fungus Hypoxylon thouarsianum. Mortality of symptomatic trees increased from 2000 to 2003 as follows:
Q. agrifolia (n = 668), 5.8–17.4%; Q. kelloggii (n = 53), 3.8–9.4%; and L. densiflorus (n = 164), 8.3–22.2%. All 31 Q. lobata
remained asymptomatic. From 2000 to 2003, bleeding trees were 25.0–23.6% of living Q. agrifolia, 15.5–25.0% of Q. kelloggii,
and 39.0–62.4% of L. densiflorus. Scolytid beetles colonized more than 95% of the living symptomatic Q. agrifolia that
subsequently died. Same-symptom cohorts were followed from March 2000 through March 2003. In the asymptomatic
Q. agrifolia cohort, 12.0% developed bleeding by 2003. For the bleeding only cohort, 22.7% of Q. agrifolia died, but 73.5% of
the beetle-colonized bleeding cohort died. Bleeding developed in 40.9% of the initially asymptomatic L. densiflorus cohort. By
2003, 24.6% of the initially bleeding L. densiflorus cohort had died. Both Weibull and Cox Proportional Hazards regression were
* Corresponding author. Tel.: +1 510 6425806; fax: +1 510 6433490.
E-mail address: [email protected] (B.A. McPherson).
0378-1127/$ – see front matter # 2005 Elsevier B.V. All rights reserved.
doi:10.1016/j.foreco.2005.03.048

B.A. McPherson et al. / Forest Ecology and Management 213 (2005) 71–8972
used to model cohort survival. The median survival time estimated by Weibull regression models declined rapidly by disease
category (asymptomatic, bleeding only, bleeding with beetles), from 29 to 2.7 years for Q. agrifolia, and from 12.6 to 2.9 years
for L. densiflorus. By 2003, structural bole failure had occurred in 21.5% of the Q. agrifolia that were bleeding in 2000, 93% of
which had ambrosia beetle tunnels at the breakage point. For both Q. agrifolia and L. densiflorus, health failure analysis modeled
by Weibull regression found a greater probability of developing sudden oak death for trees with larger stem diameters. Beetles
were also positively correlated with larger diameter bleeding Q. agrifolia.
# 2005 Elsevier B.V. All rights reserved.
Keywords: Coast live oak; Tanoak; California black oak; Sudden oak death; Phytophthora ramorum; Scolytidae; Survival analysis
1. Introduction
Phytophthora ramorum, the pathogen that causes
sudden oak death (SOD), infects a number of woody
plant species in mesic forested habitats in coastal
California and southwestern Oregon (Garbelotto
et al., 2003; McPherson et al., 2000). The forests
where this disease is presently found are classified as
coastal oak woodland, montane hardwood, montane
hardwood-conifer, redwood, and Douglas-fir types
(Mayer and Laudenslayer, 1988). The death of the
foliage of mature tanoaks (Lithocarpus densiflorus)
was first observed in 1994 at the urban-wildland
interface in Marin County, California (Svihra,
1999a), and subsequently in coast live oaks (Quercus
agrifolia) in 1995 (Svihra, 2001). By the late 1990s,
extensive mortality in these widely distributed
species was reported in disjunct forests and wood-
lands throughout the Coast Ranges of California,
from Big Sur in Monterey County, through the Santa
Cruz Mountains, and north into Marin and Sonoma
Counties. In 2000, a previously undescribed Phy-
tophthora that had been isolated from bleeding bark
cankers on Q. agrifolia and L. densiflorus in Marin
County, California, was shown to produce the
symptoms and signs of sudden oak death in both
species (Rizzo et al., 2002). The same pathogen,
P. ramorum, was previously isolated from orna-
mental Rhododendron species in The Netherlands
and Germany (Werres and Marwitz, 1997; Werres
et al., 2001), and is now recognized as the cause of
sudden oak death (Rizzo et al., 2002).
The primary symptom of sudden oak death is the
production of a viscous red to black exudate from bark
cankers, typically on the lower trunk, referred to as
bleeding. The bleeding areas on such trees are often
colonized by bark and ambrosia beetles (Svihra,
1999a), and may exhibit the fruiting bodies (spor-
ophores) of the native endophytic fungus, Hypoxylon
thouarsianum (McPherson et al., 2000; Svihra, 2000).
Bark and ambrosia beetles (Coleoptera: Scolytidae)
are known to colonize stressed trees in a number of
coniferous forests (Furniss and Carolin, 1977; Waters
et al., 1985), but selective attacks on the bark
overlying cankers has not been reported previously
for any of the insects observed to colonize oaks that
have root diseases or stem cankers (Chamberlain,
1958; Furniss and Carolin, 1977).
In natural environments in coastal California,
P. ramorum is known to parasitize species in 12 plant
families, including Aceraceae, Anacardiaceae, Betu-
laceae, Caprifoliaceae, Cupressaceae, Ericaceae,
Fagaceae, Hippocastanaceae, Lauraceae, Pinaceae,
Rhamnaceae, and Rosaceae (Garbelotto et al., 2003).
The degree of pathogenicity varies by host species; in
most, the disease causes foliar blights and twig
cankers, with some hosts apparently serving as disease
reservoirs (Rizzo and Garbelotto, 2003). The only
large-scale mortality known to be due to stem cankers
is in the red oaks and in L. densiflorus.
Three of the susceptible oaks, Q. agrifolia,
California black oak (Q. kelloggii), and Shreve oak,
(Q. parvula var. shrevei), are in the Erythrobalanus
(red oak) subgenus. Canyon live oak (Q. chrysolepis),
which is in the Protobalanus subgenus, is the other
known host oak species native to California (Murphy
and Rizzo, 2003). Although the susceptibility of most
other oaks is not known, no mature North American
species in the Lepidobalanus (white oak) group, which
includes valley oak, (Q. lobata), have been reported to
be hosts. The relationship between Quercus and the
primarily southern Asian genus Lithocarpus, of which
L. densiflorus is the sole New World representative, is
complex and poorly defined.
B.A. McPherson et al. / Forest Ecology and Management 213 (2005) 71–89 73
A large number of the woody plants in these forests
are P. ramorum hosts, but in most, the resulting
diseases are not fatal. Oaks and tanoaks have ecological
impacts out of proportion to their representation in
these habitats. In addition to their importance as the
principal (or only) nut-producing species, a number of
birds, mammals, insects, and fungi are dependent on
these trees. Understanding of the etiology of this
disease, as modified through interactions with second-
ary organisms, should lead to improved predictions of
its consequences to these ecosystems and to better
management decisions.
Monitoring plots were established in early 2000 to
characterize the sequence of symptom progression,
with the goal of modeling rates of change in diseased
trees. No causal agents had been identified, the
association with beetles lacked a quantitative basis,
and no trees had been monitored long enough to confirm
temporal relationships among signs and symptoms. The
three primary objectives of the study were to: (a)
determine the strength of the association of the
characteristic bleeding on the main stem in Q. agrifolia,
Q. kelloggii, and L. densiflorus and infestation by
ambrosia and bark beetles and the production of H.
thouarsianum sporophores; (b) determine whether
attacks by scolytid beetles on symptomatic trees
resulted in acceleration of tree death and subsequent
stem failure; and (c) estimate the impact of sudden oak
death in the forests where the plots were located.
2. Materials and methods
2.1. Study sites
Disease progression plots were located to encom-
pass a variety of forest types. Several factors were
considered in plot selection. These included the
dominance of the principal host tree species of interest
Q. agrifolia (eight plots), L. densiflorus (two plots),
history of past fires (three plots), stand structure, and
the diversity of host and non-host tree species within
these sites. In the absence of standing dead or
obviously failing trees, the presence of the disease in a
plot could only be detected by inspection. Thus, all
plots were placed in watersheds where the disease had
been reported, but without prior knowledge of its
presence within each site. Plot size and shape were
delimited by physical boundaries; including trails,
topography (ravines and ridge tops), and such natural
vegetation cover transitions as open fields and
increased density of shrubs. This selection process
led to plots that varied considerably in the numbers of
stems and proportions of host trees that were
symptomatic. Ten plots were established at each of
two protected forests, one in China Camp State Park
and one in land managed by Marin Municipal Water
District, near Mt. Tamalpais State Park. The number of
host trees per plot ranged from 35 to 84. Plots
were chosen to contain primarily Q. agrifolia and
L. densiflorus, with Q. kelloggii and Q. lobata
occurring as relatively minor components.
China Camp State Park is located on the south-
western shore of San Pablo Bay, (latitude = 38.00059,
longitude = �122.48514) near the city of San Rafael.
Elevation varies from near sea level to 290 m. The
dominant overstory forest trees are Q. agrifolia,
Q. kelloggii, bay laurel (Umbellularia californica),
and madrone (Arbutus menziesii). Other overstory
trees that constitute significant portions of the forest
flora and that are locally abundant include Q. lobata,
blue oak (Q. douglasii), California buckeye (Aesculus
californica), Douglas-fir (Pseudotsuga menziesii), big
leaf maple (Acer macrophyllum), Eucalyptus spp., and
coast redwood (Sequoia sempervirens). The vegeta-
tion cover varies considerably, comprising open fields,
dense shrub thickets, and relatively open, oak-
dominated closed canopy forests. The coastal oak
woodland, montane hardwood, and montane hard-
wood-conifer forest types (Mayer and Laudenslayer,
1988) are represented in China Camp plots. Common
shrubs, small trees, and vines include manzanita
(Arctostaphylos manzanita), toyon (Heteromeles
arbutifolia), hazel (Corylus cornuta), buckeye (Aes-
culus californica), coffeeberry (Rhamnus californica),
huckleberry (Vaccinium ovatum), rhododendron
(Rhododendron macrophyllum), poison oak (Toxico-
dendron diversilobum), and honeysuckle (Lonicera
hispidula). With the exception of the white oaks,
Q. douglasii and Q. lobata, and Eucalyptus spp., these
woody plants have all been confirmed as hosts of
P. ramorum (Davidson et al., 2003; Garbelotto et al.,
2003).
The Marin Municipal Water District (MMWD) wat-
ershed (latitude = 37.5721, longitude = �122.3636),
NE of Mt. Tamalpais State Park, is generally at a
B.A. McPherson et al. / Forest Ecology and Management 213 (2005) 71–8974
higher elevation than China Camp State Park. The
elevation of the research plots varies between 190 and
270 m. In addition to the tree and shrub species found in
China Camp State Park, L. densiflorus and dense stands
of S. sempervirens are present in MMWD. The forest
types represented include those in China Camp, as well
as the redwood and Douglas-fir forest types (Mayer and
Laudenslayer, 1988).
Both sites have a temperate marine climate, with
potential for fog at least part of the day for much of the
year. Annual rainfall in China Camp State Park
averaged 91 cm between 1948 and 2000. Rainfall in
MMWD averaged 132 cm per year between 1979 and
1996. The annual mean temperature range in the city
closest to both locations, San Rafael, is 8.9–21.4 8C.
Three plots are greater than 50-m from hiking or
bicycling trails. One plot is adjacent to a campsite, in
15 plots a trail defines one edge, and two plots are
within 20-m of a trail. In summer 2001, one plot in
MMWD was burned. All the trees in the burned plot
and an additional 18 symptomatic Q. agrifolia that
were removed in 2001 from a plot in China Camp State
Park as hazards were deleted from further analysis.
2.2. Plot characteristics
Each oak and L. densiflorus stem greater than 5 cm
diameter at breast height (dbh) was labeled with an
aluminum tag. The coordinates of most trees were
recorded using a Trimble GeoXT DGPS (Differential
Global Positioning System) unit. Each stem that was
separated from other stems at 1 m above the soil line
was considered to be an individual tree. Although this
treatment effectively considers genetically identical
stems as separate individuals, it is consistent with the
observation that bleeding often appears to be
distributed independently on the stems of multiple
stem trees. Plot size varied as a function of natural
landscape features and ranged from 320 to 3600 m2,
with a mean area of 1234 m2 (S.E. = 199 m2). Survival
of Q. agrifolia seedlings and saplings in the study area
was poor in the understory below mature trees,
whereas L. densiflorus were abundant in the unders-
tory. Q. agrifolia-dominated plots had few individuals
smaller than about 10 cm dbh, but the size distribution
of the L. densiflorus included many smaller trees.
Trees were monitored at approximately 3-month
intervals, beginning in March 2000. The resampling
frequency allowed the verification of symptoms for
individual trees in which characterization of symptom
states was uncertain on earlier dates.
2.3. Symptom evaluation
Trees were evaluated on the basis of the observed
symptoms and signs that are associated with sudden
oak death in oaks and L. densiflorus (Davidson et al.,
2003; McPherson et al., 2000; Rizzo et al., 2002). The
most consistent symptom of P. ramorum infection in
these species is bleeding. By this definition, an
asymptomatic tree, while not bleeding, could show
other symptoms of decline. A recently isolated
pathogen, P. nemorosa, causes bleeding cankers in
oaks and in L. densiflorus, although it appears to be
much less consistently fatal in oaks (Hansen et al.,
2003). Symptom-based disease estimates may there-
fore overestimate the true incidence of P. ramorum in
these plots. Each tree was visually rated for presence
or absence of bleeding on the main stem. Bleeding was
rarely observed on lateral branches. Assessment of
bleeding was usually straightforward when the
presence of the exudate was obvious. Although heavy
rain can remove the exudate, the bark below bleeding
areas often remained stained for months. In order to
standardize symptom evaluation among observers,
only bleeding that was noted on consecutive
monitoring dates was recorded. Mosses and lichens
below bleeding zones may be stained dark brown by
this exudate, signaling the presence of a bleeding
canker. Oak trees also produce exudate on the bark in
response to injuries and other pathogens, such as
Armillaria spp. (Sinclair et al., 1987) and other
Phytophthora spp. (Mercetich et al., 1977; Tainter
et al., 2000). Bleeding can be confused with bacterial
wetwood, found in oaks and many other hardwoods,
characterized by malodorous and watery seeping
associated with branch stubs, bark fissures, and old
wounds (Hartley et al., 1961). However, wetwood
seeping can be readily differentiated from the bleeding
associated with P. ramorum infection, which dries to a
hard consistency with a distinct oak odor. Beetle
tunneling has not been observed to be associated with
wetwood.
Current methods for confirming P. ramorum
infection in suspect plants require the removal of
tissue samples for culturing or DNA amplification

B.A. McPherson et al. / Forest Ecology and Management 213 (2005) 71–89 75
(Blomquist and Kubisiak, 2003). Since wounding the
bark potentially facilitates fresh P. ramorum inocula-
tion, possibly attracting saprotrophic insects and
introducing pathogens, thus affecting the natural
course of events being monitored, the decision was
made to not cut into bark to sample tissue.
The evaluation of sudden oak death was based on
symptoms alone. The tunneling of bark and ambrosia
beetles was detected by the presence of white and
reddish brown boring dust on the bark surface. Within
the first year following the appearance of bleeding,
beetle tunneling is restricted to the bark directly
overlying bleeding cankers. The tunneling activity of
these insects occurs primarily during two periods,
from March through June and from August through
October (P. Svihra, unpublished data). When boring
dust is not fresh, its presence from previous flight
seasons can often be observed matted in moss, bark
crevices, and spider webs. Also, entrance and exit
holes (approximately 1 mm diameter) produced by
these beetles can be seen with careful observation.
The sporophores of H. thouarsianum were recorded
as present when they occurred on the main stem of a
living tree. The ecology of this endophyte is not well
understood. The presence of reproductive structures is
the only reliable way to confirm the presence of this
otherwise cryptic fungus. In the absence of sudden oak
death, sporophores are typically observed on standing
dead and fallen trees, dead branches on living trees, and
the dead portions of the stems of standing, live trees.
Every time trees were assessed, the presence or
absence of bleeding, beetle frass, and fruiting structures
of H. thouarsianum were recorded. A tree was
considered dead once its foliage had turned brown.
Green sprouting from the root crown was observed in
many of these trees after all the existing foliage was
brown, but the tree was never observed to recover.
2.4. Structural failure
The structural failure of Q. agrifolia on the main
bole was evaluated for each of the 13 monitoring
dates, from March 2000 through March 2003. The
presence of scolytid beetle tunneling, the presence of
H. thouarsianum sporophores, and whether leaves
were green or brown at the time the breakage occurred
were recorded. Only trees exhibiting structural failure
on the main bole were counted as failures.
2.5. Data analysis
Although observations were recorded at 3-month
intervals, the observed low rate of change in symptom
progression led to the decision to analyze the data in
1-year increments (March 2000, March 2001, March
2002, and March 2003) to determine the incidence of:
(a) living trees showing bleeding cankers only; (b) the
presence of bleeding cankers plus beetle activity;
(c) the presence of bleeding cankers, beetles, and
H. thouarsianum sporophores together; and (d) the
presence of beetles and H. thouarsianum sporophores
separately, in the absence of bleeding cankers. Dead
trees that exhibited evidence of bleeding before death,
and those trees that died without the bleeding
symptom were analyzed separately.
2.5.1. Cohorts
Cohort analysis (Law, 1981) was applied to same-
symptom cohorts of Q. agrifolia and L. densiflorus
that were defined at the start of the study in March
2000 to estimate the duration of each disease stage, the
proportion of the population affected, and survival
through March 2003 within each cohort. Similar
approaches have been used to follow the progress of
air pollution injury in Southern California forests
(Cobb and Stark, 1970) and pitch canker in urban
forests of central California (Storer et al., 2002). For
Q. agrifolia, cohort categories and numerical codes
used for the survival analyses were: asymptomatic (1);
bleeding only (2); bleeding with beetle colonization
(3); bleeding with beetle colonization and H.
thouarsianum fruiting bodies (4); and dead (5). The
L. densiflorus cohort categories were asymptomatic
(1); bleeding only (2); bleeding with beetle coloniza-
tion, with or without H. thouarsianum fruiting bodies
(3); and dead (4). The numbers of bleeding trees
colonized by beetles and those that also showed
H. thouarsianum sporophores were not analyzed
separately, because few bleeding L. densiflorus in
the plots exhibited these secondary organisms. There
were insufficient numbers of Q. kelloggii for a similar
analysis. The symptom states employed here could
only be precisely defined for the asymptomatic
cohorts, since the infection date, the date of first
bleeding, and the date of beetle colonization were all
unknown. However, the timing of changes in status
was known within three months for all trees.
B.A. McPherson et al. / Forest Ecology and Management 213 (2005) 71–8976
These analyses yielded the numbers of trees that
had left the initial category and entered another, at
1-year intervals. Thus, for the initially asymptomatic
Q. agrifolia cohort, the categories for subsequent
years included: asymptomatic trees; trees that devel-
oped bleeding only; trees that developed bleeding and
were colonized by beetles; trees with bleeding,
beetles, and H. thouarsianum sporophores; and dead
trees (with and without bleeding). For the bleeding
only cohort, subsequent categories were: bleeding
with beetles, bleeding with beetles and H. thouarsia-
num sporophores, and dead trees. Trees that were
initially categorized as bleeding with beetles could
progress to development of H. thouarsianum spor-
ophores and to death. Trees that were categorized as
bleeding with beetles plus H. thouarsianum spor-
ophores could only progress to death.
The Weibull survival regression model (parametric
model) and the Cox proportional hazard (PH) model
(semi-parametric model) (Lee and Wang, 2003) were
both used to analyze survival time for each of the Q.
agrifolia and L. densiflorus cohorts described above.
SAS 8.2 and SPSS release 10.0 were used to estimate
the parameters and prepare graphic displays. The
variables that were considered as explanatory vari-
ables to be included in the regression models were tree
category (defined above), dbh in year 2000, and for the
oaks only, site (China Camp and MMWD). Akaike’s
information criterion (AIC) was used to decide
whether a variable should be included in the analysis
(Akaike, 1974).
The Cox PH model is the most commonly used
model for survival analysis. This is because it does not
require knowledge of the underlying distribution of the
survival scores. However, this model cannot predict
survival beyond the time frame of the input data.
Because this study has only three years of data, an
insufficient time interval to envision possible survival
times of 10–30 years, a model using the Weibull
probabilistic distribution was also developed. This two-
parameter distribution is most commonly used because
of the different distributional shapes that it can take just
by changing the values of these two parameters. Thus,
the results of the survival analysis should be viewed in a
critical manner in lieu of additional years of data.
The observation period in this study was relatively
short and the models differ in both scope and
limitations. The survival functions for both models
are displayed to help readers reach their own
conclusions about the reliability of the projected
results.
2.5.2. Relationship between stem diameter and
bleeding
The relationship between stem diameter and
bleeding status was analyzed using t-tests (SAS,
2002) to compare the diameters (dbh) of living
symptomatic and asymptomatic trees in 2000. For
Q. agrifolia and L. densiflorus, the analysis was
performed for the populations of living trees at the
March 2000 starting date, and then for March of each
subsequent year, while for Q. kelloggii, these trees
were evaluated for only 2000 and 2003. The
relationship between stem diameter and bleeding
status for dead trees, including those that were dead at
the start of the study, was evaluated using t-tests.
Symptomatic and asymptomatic dead trees were
analyzed separately. Stem diameter was also analyzed
as a predictor of beetle colonization of bleeding
Q. agrifolia for 2000 only. Weibull regression was
used in a health analysis to define the relationship
between tree diameter and the development of
bleeding for Q. agrifolia and L. densiflorus.
2.5.3. Association of beetles with bleeding trees
The association of scolytid beetle activity with
bleeding was analyzed for Q. agrifolia, Q. kelloggii,
and L. densiflorus using log-likelihood ratio tests
(SAS, 2002). Analyses were run on Q. agrifolia and
L. densiflorus at each of the four annual sampling
dates. Q. kelloggii were analyzed only for 2000 and
2003.
3. Results
3.1. Plot characteristics
The mean diameter at breast height of Q. agrifolia
ranged from 21.5 to 44.5 cm on a plot (Table 1). On a
plot basis, the incidence of both living and dead trees
that had symptoms consistent with sudden oak death
ranged from 0 to 65% in 2000 (Fig. 1). By 2003, this
percentage had increased in all plots that had bleeding
trees in 2000. For L. densiflorus, the mean diameter at
breast height ranged from 12.2 to 20.2 cm per plot

B.A. McPherson et al. / Forest Ecology and Management 213 (2005) 71–89 77
Table 1
Abundance of oaks and tanoaks by plot and the mean diameter for species in plots with four or more stems eacha
Plot Coast live oak Mean DBH Black oak Mean DBH Valley oak Mean DBH Tanoak Mean DBH
C-1 65 29.6 � 1.6 4 50.8 � 5.5 4 39.4 � 4.3 0 0
C-2 48 37.4 � 2.0 0 5 29.0 � 3.5 0 0
C-3 69 29.6 � 1.5 6 46.6 � 3.3 9 25.4 � 2.5 0 0
C-4 34 44.5 � 4.8 4 40.0 � 7.4 4 32.4 � 3.8 0 0
C-5 40 39.1 � 4.0 0 0 0 0
C-6 40 34.6 � 2.0 5 47.8 � 9.0 2 0 0
C-7 38 33.0 � 2.5 0 5 31.5 � 4.1 0 0
C-8 52 25.3 � 1.2 0 0 0 0
C-9 45 31.4 � 1.6 0 0 0 0
C-10 35 27.9 � 2.2 0 0 0 0
M-1 0 0 0 0 46 18.6 � 2.1
M-2 38 38.7 � 3.5 12 38.1 � 2.4 2 0 0
M-3 24 23.4 � 2.2 13 27.0 � 2.8 0 35 20.2 � 2.1
M-4 11 37.4 � 7.4 1 0 28 12.2 � 0.9
M-5 40 27.9 � 2.3 0 0 0 0
M-6 33 41.3 � 2.1 5 38.6 � 10.6 0 0 0
M-7 36 21.5 � 2.0 0 0 14 19.6 � 3.5
M-8 1 – 0 0 44 13.3 � 1.7
M-9 45 32.3 � 1.9 2 0 1 0
M-10 37 25.1 � 1.5 1 0 14 12.3 � 1.9
Means (cm) � S.E.a Plots C-1 to C-10 are in China Camp State Park. Plots M-1 to M-10 are in Marin Municipal Water District. The diameter values are for March
2000.
(Table 1). Both Q. kelloggii and Q. lobata were present
as relatively minor components, averaging approxi-
mately five stems for each species in the plots where
they occurred.
Fig. 1. Sudden oak death impact on Q. agrifolia (bleeding and
symptomatic dead trees) as a percentage of the total number of trees
in each plot (�S.E.), for 2000 (closed bars) and 2003 (open bars).
3.2. Q. agrifolia and Q. kelloggii
These oak species are considered to be closely
related and hybridize readily. Their responses to P.
ramorum infection appear to be very similar, although
the numbers of Q. kelloggii in this study are much
lower than Q. agrifolia. The results for Q. kelloggii are
reported separately, but are included in the same
sections as those for Q. agrifolia.
3.2.1. Bleeding and dead trees
At the start of the study in March 2000, there were
731 Q. agrifolia with stems greater than 5 cm dbh, of
which 668 were alive and 167 (25.0%) were bleeding
(Table 2). Bleeding trees constituted similar propor-
tions of the living Q. agrifolia in each of the next
three years, amounting to 23.6% in March 2003. The
nearly static proportion of bleeding trees for the four
dates obscures the true impact of sudden oak death in
these plots. In March 2000, 5.8% of the trees were
dead with evidence of bleeding, with the cumulative
total rising to 17.4% by 2003 (Table 2). The numbers
of dead trees without evidence of bleeding increased
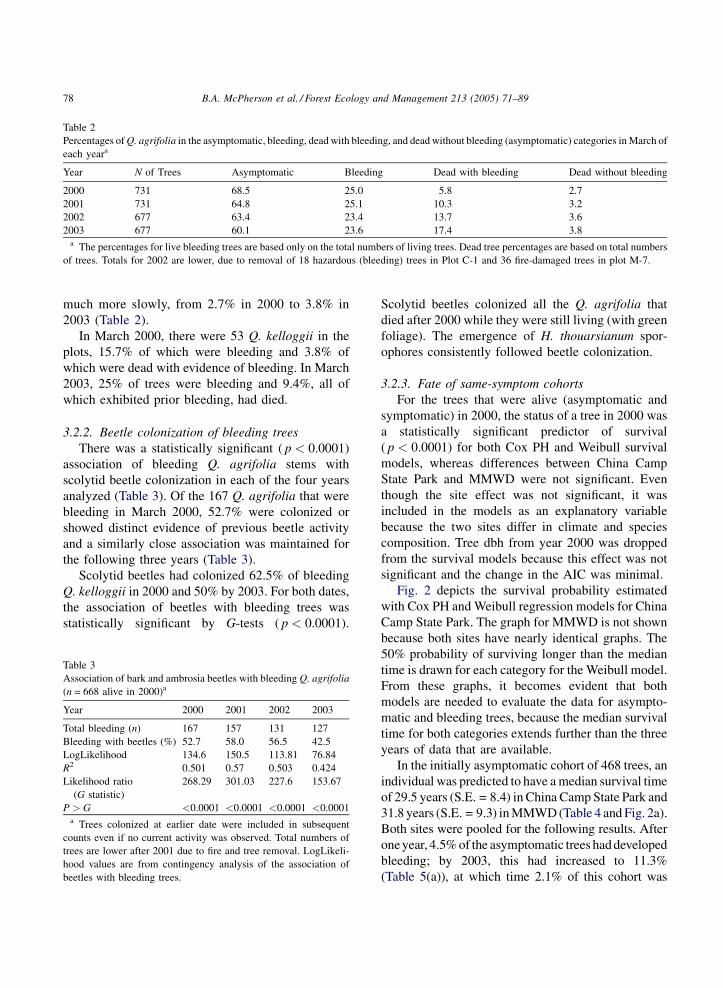
B.A. McPherson et al. / Forest Ecology and Management 213 (2005) 71–8978
Table 2
Percentages of Q. agrifolia in the asymptomatic, bleeding, dead with bleeding, and dead without bleeding (asymptomatic) categories in March of
each yeara
Year N of Trees Asymptomatic Bleeding Dead with bleeding Dead without bleeding
2000 731 68.5 25.0 5.8 2.7
2001 731 64.8 25.1 10.3 3.2
2002 677 63.4 23.4 13.7 3.6
2003 677 60.1 23.6 17.4 3.8a The percentages for live bleeding trees are based only on the total numbers of living trees. Dead tree percentages are based on total numbers
of trees. Totals for 2002 are lower, due to removal of 18 hazardous (bleeding) trees in Plot C-1 and 36 fire-damaged trees in plot M-7.
much more slowly, from 2.7% in 2000 to 3.8% in
2003 (Table 2).
In March 2000, there were 53 Q. kelloggii in the
plots, 15.7% of which were bleeding and 3.8% of
which were dead with evidence of bleeding. In March
2003, 25% of trees were bleeding and 9.4%, all of
which exhibited prior bleeding, had died.
3.2.2. Beetle colonization of bleeding trees
There was a statistically significant ( p < 0.0001)
association of bleeding Q. agrifolia stems with
scolytid beetle colonization in each of the four years
analyzed (Table 3). Of the 167 Q. agrifolia that were
bleeding in March 2000, 52.7% were colonized or
showed distinct evidence of previous beetle activity
and a similarly close association was maintained for
the following three years (Table 3).
Scolytid beetles had colonized 62.5% of bleeding
Q. kelloggii in 2000 and 50% by 2003. For both dates,
the association of beetles with bleeding trees was
statistically significant by G-tests ( p < 0.0001).
Table 3
Association of bark and ambrosia beetles with bleeding Q. agrifolia
(n = 668 alive in 2000)a
Year 2000 2001 2002 2003
Total bleeding (n) 167 157 131 127
Bleeding with beetles (%) 52.7 58.0 56.5 42.5
LogLikelihood 134.6 150.5 113.81 76.84
R2 0.501 0.57 0.503 0.424
Likelihood ratio
(G statistic)
268.29 301.03 227.6 153.67
P > G <0.0001 <0.0001 <0.0001 <0.0001a Trees colonized at earlier date were included in subsequent
counts even if no current activity was observed. Total numbers of
trees are lower after 2001 due to fire and tree removal. LogLikeli-
hood values are from contingency analysis of the association of
beetles with bleeding trees.
Scolytid beetles colonized all the Q. agrifolia that
died after 2000 while they were still living (with green
foliage). The emergence of H. thouarsianum spor-
ophores consistently followed beetle colonization.
3.2.3. Fate of same-symptom cohorts
For the trees that were alive (asymptomatic and
symptomatic) in 2000, the status of a tree in 2000 was
a statistically significant predictor of survival
( p < 0.0001) for both Cox PH and Weibull survival
models, whereas differences between China Camp
State Park and MMWD were not significant. Even
though the site effect was not significant, it was
included in the models as an explanatory variable
because the two sites differ in climate and species
composition. Tree dbh from year 2000 was dropped
from the survival models because this effect was not
significant and the change in the AIC was minimal.
Fig. 2 depicts the survival probability estimated
with Cox PH and Weibull regression models for China
Camp State Park. The graph for MMWD is not shown
because both sites have nearly identical graphs. The
50% probability of surviving longer than the median
time is drawn for each category for the Weibull model.
From these graphs, it becomes evident that both
models are needed to evaluate the data for asympto-
matic and bleeding trees, because the median survival
time for both categories extends further than the three
years of data that are available.
In the initially asymptomatic cohort of 468 trees, an
individual was predicted to have a median survival time
of 29.5 years (S.E. = 8.4) in China Camp State Park and
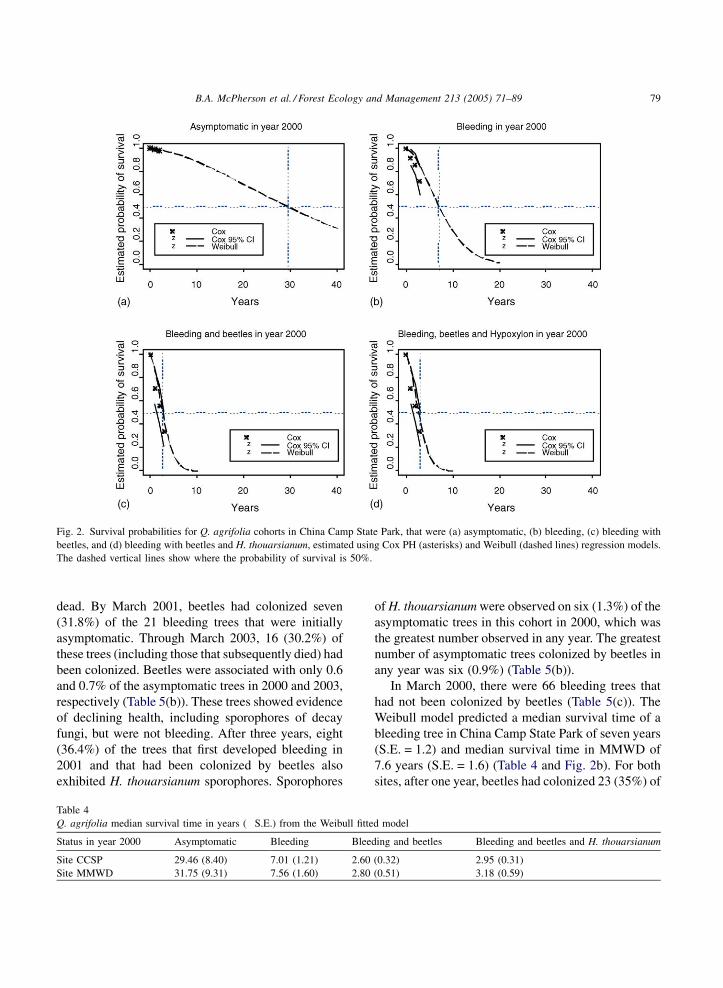
31.8 years (S.E. = 9.3) in MMWD (Table 4 and Fig. 2a).
Both sites were pooled for the following results. After
one year, 4.5% of the asymptomatic trees had developed
bleeding; by 2003, this had increased to 11.3%
(Table 5(a)), at which time 2.1% of this cohort was
B.A. McPherson et al. / Forest Ecology and Management 213 (2005) 71–89 79
Fig. 2. Survival probabilities for Q. agrifolia cohorts in China Camp State Park, that were (a) asymptomatic, (b) bleeding, (c) bleeding with
beetles, and (d) bleeding with beetles and H. thouarsianum, estimated using Cox PH (asterisks) and Weibull (dashed lines) regression models.
The dashed vertical lines show where the probability of survival is 50%.
dead. By March 2001, beetles had colonized seven
(31.8%) of the 21 bleeding trees that were initially
asymptomatic. Through March 2003, 16 (30.2%) of
these trees (including those that subsequently died) had
been colonized. Beetles were associated with only 0.6
and 0.7% of the asymptomatic trees in 2000 and 2003,
respectively (Table 5(b)). These trees showed evidence
of declining health, including sporophores of decay
fungi, but were not bleeding. After three years, eight
(36.4%) of the trees that first developed bleeding in
2001 and that had been colonized by beetles also
exhibited H. thouarsianum sporophores. Sporophores
Table 4
Q. agrifolia median survival time in years (�S.E.) from the Weibull fitte
Status in year 2000 Asymptomatic Bleeding Blee
Site CCSP 29.46 (8.40) 7.01 (1.21) 2.60
Site MMWD 31.75 (9.31) 7.56 (1.60) 2.80
of H. thouarsianum were observed on six (1.3%) of the
asymptomatic trees in this cohort in 2000, which was
the greatest number observed in any year. The greatest
number of asymptomatic trees colonized by beetles in
any year was six (0.9%) (Table 5(b)).
In March 2000, there were 66 bleeding trees that
had not been colonized by beetles (Table 5(c)). The
Weibull model predicted a median survival time of a
bleeding tree in China Camp State Park of seven years
(S.E. = 1.2) and median survival time in MMWD of
7.6 years (S.E. = 1.6) (Table 4 and Fig. 2b). For both
sites, after one year, beetles had colonized 23 (35%) of
d model
ding and beetles Bleeding and beetles and H. thouarsianum
(0.32) 2.95 (0.31)
(0.51) 3.18 (0.59)
B.A. McPherson et al. / Forest Ecology and Management 213 (2005) 71–8980
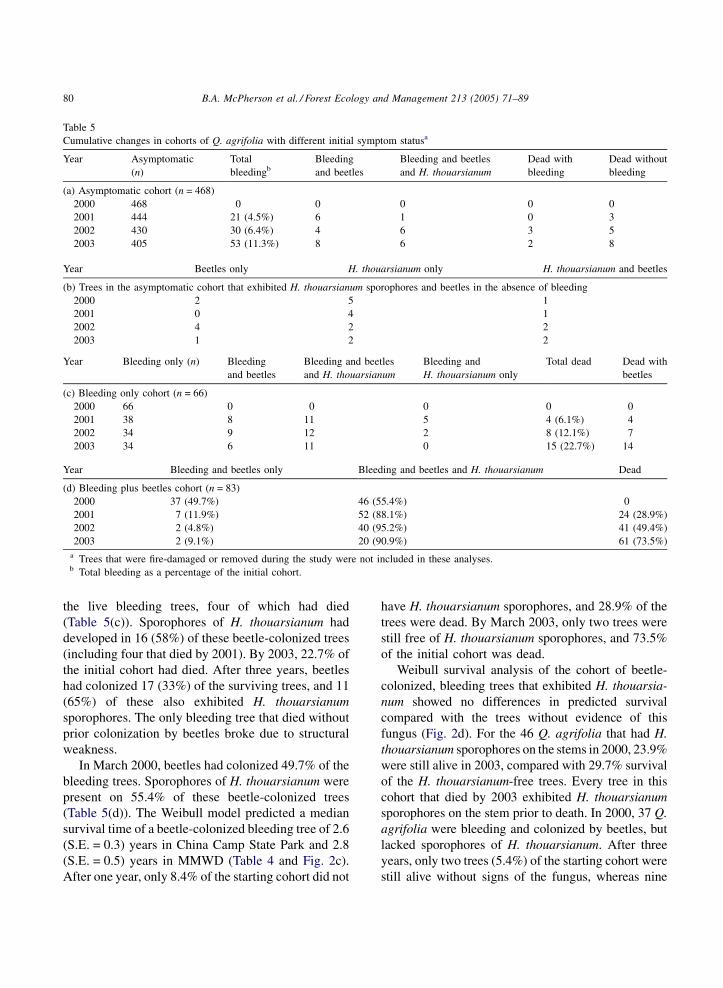
Table 5
Cumulative changes in cohorts of Q. agrifolia with different initial symptom statusa
Year Asymptomatic
(n)
Total
bleedingb
Bleeding
and beetles
Bleeding and beetles
and H. thouarsianum
Dead with
bleeding
Dead without
bleeding
(a) Asymptomatic cohort (n = 468)
2000 468 0 0 0 0 0
2001 444 21 (4.5%) 6 1 0 3
2002 430 30 (6.4%) 4 6 3 5
2003 405 53 (11.3%) 8 6 2 8
Year Beetles only H. thouarsianum only H. thouarsianum and beetles
(b) Trees in the asymptomatic cohort that exhibited H. thouarsianum sporophores and beetles in the absence of bleeding
2000 2 5 1
2001 0 4 1
2002 4 2 2
2003 1 2 2
Year Bleeding only (n) Bleeding
and beetles
Bleeding and beetles
and H. thouarsianum
Bleeding and
H. thouarsianum only
Total dead Dead with
beetles
(c) Bleeding only cohort (n = 66)
2000 66 0 0 0 0 0
2001 38 8 11 5 4 (6.1%) 4
2002 34 9 12 2 8 (12.1%) 7
2003 34 6 11 0 15 (22.7%) 14
Year Bleeding and beetles only Bleeding and beetles and H. thouarsianum Dead
(d) Bleeding plus beetles cohort (n = 83)
2000 37 (49.7%) 46 (55.4%) 0
2001 7 (11.9%) 52 (88.1%) 24 (28.9%)
2002 2 (4.8%) 40 (95.2%) 41 (49.4%)
2003 2 (9.1%) 20 (90.9%) 61 (73.5%)
a Trees that were fire-damaged or removed during the study were not included in these analyses.b Total bleeding as a percentage of the initial cohort.
the live bleeding trees, four of which had died
(Table 5(c)). Sporophores of H. thouarsianum had
developed in 16 (58%) of these beetle-colonized trees
(including four that died by 2001). By 2003, 22.7% of
the initial cohort had died. After three years, beetles
had colonized 17 (33%) of the surviving trees, and 11
(65%) of these also exhibited H. thouarsianum
sporophores. The only bleeding tree that died without
prior colonization by beetles broke due to structural
weakness.
In March 2000, beetles had colonized 49.7% of the
bleeding trees. Sporophores of H. thouarsianum were
present on 55.4% of these beetle-colonized trees
(Table 5(d)). The Weibull model predicted a median
survival time of a beetle-colonized bleeding tree of 2.6
(S.E. = 0.3) years in China Camp State Park and 2.8
(S.E. = 0.5) years in MMWD (Table 4 and Fig. 2c).
After one year, only 8.4% of the starting cohort did not
have H. thouarsianum sporophores, and 28.9% of the
trees were dead. By March 2003, only two trees were
still free of H. thouarsianum sporophores, and 73.5%
of the initial cohort was dead.
Weibull survival analysis of the cohort of beetle-
colonized, bleeding trees that exhibited H. thouarsia-
num showed no differences in predicted survival
compared with the trees without evidence of this
fungus (Fig. 2d). For the 46 Q. agrifolia that had H.
thouarsianum sporophores on the stems in 2000, 23.9%
were still alive in 2003, compared with 29.7% survival
of the H. thouarsianum-free trees. Every tree in this
cohort that died by 2003 exhibited H. thouarsianum
sporophores on the stem prior to death. In 2000, 37 Q.
agrifolia were bleeding and colonized by beetles, but
lacked sporophores of H. thouarsianum. After three
years, only two trees (5.4%) of the starting cohort were
still alive without signs of the fungus, whereas nine
B.A. McPherson et al. / Forest Ecology and Management 213 (2005) 71–89 81
(24.3%) of the living and 26 (70%) of the dead trees had
developed these fruiting bodies.
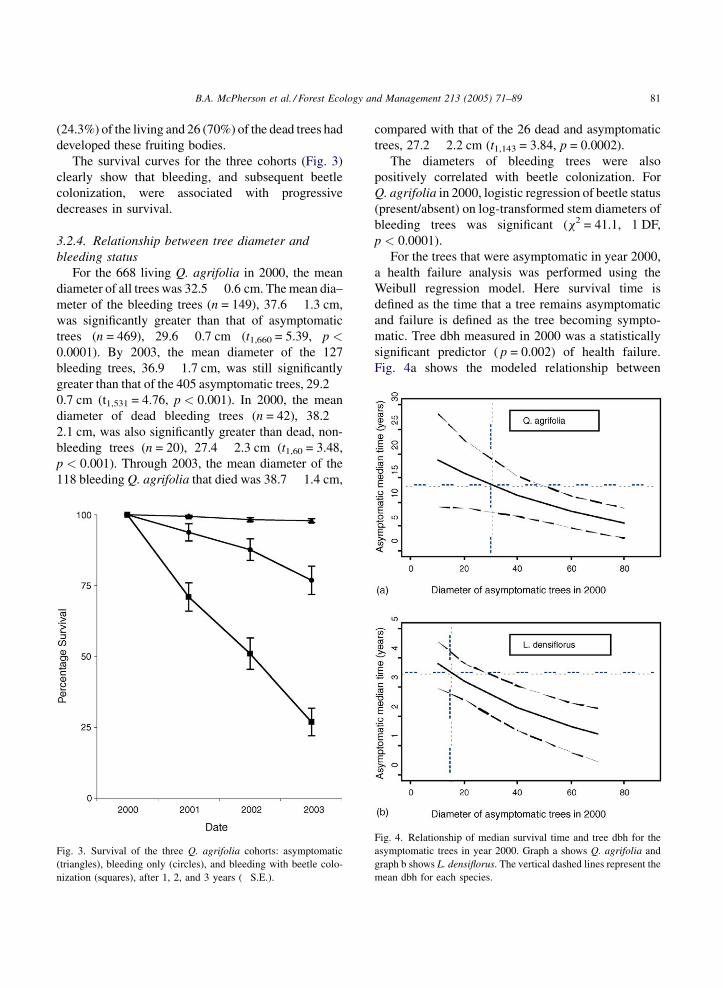
The survival curves for the three cohorts (Fig. 3)
clearly show that bleeding, and subsequent beetle
colonization, were associated with progressive
decreases in survival.
3.2.4. Relationship between tree diameter and
bleeding status
For the 668 living Q. agrifolia in 2000, the mean
diameter of all trees was 32.5 � 0.6 cm. The mean dia–
meter of the bleeding trees (n = 149), 37.6 � 1.3 cm,
was significantly greater than that of asymptomatic
trees (n = 469), 29.6 � 0.7 cm (t1,660 = 5.39, p <0.0001). By 2003, the mean diameter of the 127
bleeding trees, 36.9 � 1.7 cm, was still significantly
greater than that of the 405 asymptomatic trees, 29.2 �0.7 cm (t1,531 = 4.76, p < 0.001). In 2000, the mean
diameter of dead bleeding trees (n = 42), 38.2 �2.1 cm, was also significantly greater than dead, non-
bleeding trees (n = 20), 27.4 � 2.3 cm (t1,60 = 3.48,
p < 0.001). Through 2003, the mean diameter of the
118 bleeding Q. agrifolia that died was 38.7 � 1.4 cm,
Fig. 3. Survival of the three Q. agrifolia cohorts: asymptomatic
(triangles), bleeding only (circles), and bleeding with beetle colo-
nization (squares), after 1, 2, and 3 years (�S.E.).
compared with that of the 26 dead and asymptomatic
trees, 27.2 � 2.2 cm (t1,143 = 3.84, p = 0.0002).
The diameters of bleeding trees were also
positively correlated with beetle colonization. For
Q. agrifolia in 2000, logistic regression of beetle status
(present/absent) on log-transformed stem diameters of
bleeding trees was significant (x2 = 41.1, 1 DF,
p < 0.0001).
For the trees that were asymptomatic in year 2000,
a health failure analysis was performed using the
Weibull regression model. Here survival time is
defined as the time that a tree remains asymptomatic
and failure is defined as the tree becoming sympto-
matic. Tree dbh measured in 2000 was a statistically
significant predictor ( p = 0.002) of health failure.
Fig. 4a shows the modeled relationship between
Fig. 4. Relationship of median survival time and tree dbh for the
asymptomatic trees in year 2000. Graph a shows Q. agrifolia and
graph b shows L. densiflorus. The vertical dashed lines represent the
mean dbh for each species.

B.A. McPherson et al. / Forest Ecology and Management 213 (2005) 71–8982
Table 6
Health analysis of Q. agrifolia, showing the median asymptomatic time in years (�S.E.) as a function of stem dbh (cm)
dbh in 2000
dbh = 10 dbh = 20 dbh = 40 dbh = 60 dbh = 80
Site 1; CCSP 18.74 (4.78) 15.86 (3.47) 11.35 (2.04) 8.13 (1.64) 5.82 (1.54)
Site 2; MMWD 18.44 (5.08) 15.61 (3.72) 11.17 (2.17) 8.00 (1.65) 5.73 (1.52)
Q. agrifolia mean stem diameter and time a tree
remained healthy. Larger trees were more likely to
develop bleeding during the three years covered in the
analysis (Table 6).
The mean diameter of the 51 Q. kelloggii that were
alive in 2000 was 37.7 � 2.1 cm. The mean diameter
of the bleeding trees (n = 8), 50.8 � 2.2 cm, was
significantly greater than the asymptomatic trees
(n = 43), 35.3 � 2.2 cm, (t1,50 = 2.89, p = 0.0055).
This relationship was also significant in 2003.
3.2.5. Structural failure of Q. agrifolia
Through March 2003, 12.2% (89 trees) of the Q.
agrifolia that were standing in March 2000 had failed
on the main stem, within 0.3 to 2 m of the soil line.
Clear evidence of bleeding was observed on 84% of
the failed trees, both living and dead. Only 7.7% of the
living trees and 10% of the dead trees that failed were
asymptomatic. Ambrosia beetle tunnels that predated
the stem failure were present at the point of breakage
in 34 (94.4%) of the 36 bleeding trees that failed with a
green canopy and in 41 (91.1%) of the bleeding trees
that failed after dying. Both beetle tunnels and
sporophores of H. thouarsianum were present on
88.2% of the failed living trees. Failures of both living
and dead trees rose markedly, from five through March
2001, to 35 through March 2002, and to 89 through
March 2003.
Table 7
Percentages of asymptomatic, bleeding, and dead L. densiflorusa
Year N of trees Asymptomatic Bleeding
2000 181 55.3 39.0
2001 181 42.5 51.6
2002 167 32.3 58.5
2003 167 28.1 62.4a For bleeding trees, percentages are based on total living trees. Dead tree
the population size is lower due to removal of burned trees from the tota
3.3. L. densiflorus
3.3.1. Bleeding and dead trees
At the start of the study in March 2000, there were
181 living and dead L. densiflorus. Stem bleeding was
present in 39.0% of these trees, 8.3% were dead with
bleeding, and 1.1% were dead and asymptomatic
(Table 7). By 2003, 62.4% of the trees were bleeding,
22.2% were dead with bleeding, and 3.0% were dead
without bleeding. The combined proportions of
bleeding and dead trees, on a plot basis, varied from
21 to 61% in 2000 and increased in every plot by 2003
(Fig. 5).
3.3.2. Bleeding and beetle colonization
In 2000, scolytid beetles had colonized 9.4% of the
living L. densiflorus that were also bleeding. This
percentage increased to 12.8% in 2003. The associa-
tion of bleeding trees with beetles was statistically
significant for each of these years (G-tests, p < 0.01
for each year).
3.3.3. Fate of same-symptom cohorts
For the trees that were alive (asymptomatic and
symptomatic) in year 2000, the initial status of a tree
was a statistically significant predictor of survival
( p < 0.0001) for both Cox PH and Weibull survival
models (Fig. 6). Tree dbh for year 2000 was dropped
Dead with bleeding Dead with no bleeding
8.3 1.1
11.1 1.1
19.8 2.4
22.2 3.0
percentages are based on total numbers of trees. For 2002 and 2003,
ls.

B.A. McPherson et al. / Forest Ecology and Management 213 (2005) 71–89 83
Fig. 5. Sudden oak death impact on L. densiflorus (bleeding and
symptomatic dead trees) as a percentage of the total number of trees
in each plot (�S.E.), for 2000 (closed bars) and 2003 (open bars).
Fig. 6. Survival probabilities for L. densiflorus cohorts in Marin Municip
bleeding with beetles (including trees with H. thouarsianum), estimated usi
The dashed vertical lines denote the time to 50% survival probability.
from the survival models because this effect was not
significant and the change in AIC was minimal.
In March 2000, 93 L. densiflorus were asympto-
matic. After one year, 21.5% of these trees were
bleeding and 2.2% were dead with evidence of
bleeding (Table 8(a)). By March 2003, the total
number of bleeding trees had increased to 38 (40.9%
of the starting cohort), five (13.2%) of which had also
been colonized by beetles, and eight (8.6%) were dead
with bleeding. Weibull regression predicted a median
survival time of 12.6 years (S.E. = 3.8) for a tree that
was asymptomatic in 2000 (Table 9).
In 2000, 57 L. densiflorus were bleeding. By 2003,
14 (24.6%) of these trees were dead (Table 8(b)).
Weibull regression predicted a median survival time of
8.7 years (S.E. = 2.3) for a tree that was bleeding in
2000 (Table 9). In 2000, beetles had colonized six
(10.5%) of the bleeding L. densiflorus; four of these
trees were dead by 2003. Of the 51 bleeding trees that
were beetle-free in 2000, 10 (19.6%) had died by 2003
al Water District that were (a) asymptomatic, (b) bleeding, and (c)
ng Cox PH (asterisks) and Weibull (dashed lines) regression models.

B.A. McPherson et al. / Forest Ecology and Management 213 (2005) 71–8984
Table 8
L. densiflorus cohort summary
Year Asymptomatic Total
bleeding
Bleeding
and beetles
Bleeding and
Hypoxylon
Bleeding and Beetles
and Hypoxylon
Dead with
bleeding
Dead with
no bleeding
(a) Asymptomatic cohort (n = 93)a
2000 93 0 0 0 0 0 0
2001 71 20 (21.5%) 0 0 0 2 0
2002 54 29 (34.9%) 2 0 0 7 3
2003 44 38 (40.9%) 5 0 0 8 3
Year Total bleeding Bleeding and beetles Bleeding and Hypoxylon Bleeding and Beetles and Hypoxylon Dead
(b) Bleeding Cohort, including those with beetles in 2000 (n = 57)
2000 57 5 1 1 0
2001 54 6 1 3 3 (5.3%)
2002 51 5 0 3 6 (10.5%)
2003 43 4 0 3 14 (24.6%)
(c) Bleeding cohort, without beetles in 2000. This is a subset of the bleeding cohort (n = 51)
2000 51 0 1 0 0
2001 49 3 1 1 2 (3.9%)
2002 46 3 0 2 5 (9.8%)
2003 41 2 0 3 10 (19.6%)
a Total bleeding as a percentage of the initial cohort.
(Table 8(c)); beetles had colonized half of these
trees while they were still alive. Four of the six
initially beetle-free trees that were colonized after
2000 had died by 2003. The Weibull regression model
predicted that a beetle-colonized bleeding tree in 2000
had a median survival time of 2.9 years (S.E. = 1.0)
(Table 9).
From the survival curves shown in Fig. 7, it is clear
that the presence of bleeding cankers is strongly
associated with decreased survival.
3.3.4. Relationship between L. densiflorus stem
diameter and bleeding status
The mean diameter of all 181 L. densiflorus in the
plots at the start of the study in 2000 was 16.1 � 0.9 cm.
Removal of fire-damaged trees reduced the mean dia-
meter for all living stems (n = 150) to 15.8 � 0.9 cm.
Table 9
L. densiflorus median survival time in years (�S.E.) from Weibull
fitted model
Status in year 2000
Asymptomatic 12.57 (3.82)
Bleeding only 8.66 (2.31)
Bleeding and beetles or bleeding
and beetles and H. thouarsianum
2.85 (0.97)
Although initially not different, by 2003 the mean
diameter of the bleeding trees (n = 79) was significantly
larger, 16.4 � 1.1 cm, than the asymptomatic trees
(n = 46) 12.0 � 1.6 cm (t1,124 = 2.62, p = 0.0009).
Fig. 7. Survival of asymptomatic (circles) and bleeding (triangles)
L. densiflorus cohorts after 1, 2, and 3 years (�S.E.).

B.A. McPherson et al. / Forest Ecology and Management 213 (2005) 71–89 85
Table 10
Health analysis of L. densiflorus, showing the median asymptomatic
time in years (�S.E.) as a function of dbh (cm)
dbh in year 2000
dbh = 10 dbh = 20 dbh = 40 dbh = 60 dbh = 70
3.80 (0.41) 3.21 (0.32) 2.30 (0.39) 1.64 (1.80) 1.39 (0.47)
For the trees that were asymptomatic in 2000, a
health failure analysis performed using the Weibull
regression model found that dbh was a significant
predictor ( p < 0.0064) of future susceptibility to
bleeding (Fig. 4b). For a tree with dbh of 40 cm, the
mean for the population, the model predicted with a
50% probability that a tree would remain asymptomatic
(median healthy time) for 2.3 years (S.E. = 0.4) (Table
10). For a tree with dbh of 10 cm, a tree was predicted to
remain asymptomatic for 3.8 years (S.E. = 0.4).
4. Discussion
Each of the three tree hosts that are most
consistently killed by P. ramorum in California, Q.
agrifolia, Q. kelloggii, and L. densiflorus, followed a
consistent sequence of signs and symptoms following
the development of bleeding. Bleeding was the first
visible symptom of sudden oak death in both oak
species, followed by ambrosia beetle colonization,
then emergence of H. thouarsianum sporophores. In
Q. agrifolia and Q. kelloggii, the joint occurrence of
scolytid beetles and H. thouarsianum preceded tree
death, except for a few cases in which structural failure
occurred before the foliage died. The sequence of
symptoms and signs in L. densiflorus was generally
similar to that of the oaks, although foliar symptoms
(flagging and death of branch tips and individual
leaves that resemble dieback caused by other biotic
and abiotic agents) often appeared before bleeding,
beetle colonization was less consistent, and
H. thouarsianum sporophores only developed infre-
quently before death of a tree. The numbers of
asymptomatic trees that developed bleeding and the
numbers of symptomatic trees that died from 2000 to
2003 increased for all three species.
Survival analyses of same-symptom cohorts con-
firmed that sudden oak death is a progressive disease
in Q. agrifolia and L. densiflorus. Decreased survival
was strongly correlated in both species with beetle
attacks on bleeding trees, and with subsequent
emergence of H. thouarsianum sporophores on Q.
agrifolia. Both Weibull and Cox PH survival analyses
showed that, although the presence of this endophytic
fungus was strongly associated with prior beetle
attacks, survival did not decrease in trees that showed
evidence of both organisms. This suggests that beetle
colonization is the better predictor of mortality. These
analyses also estimated very similar survival times for
both species, approximately seven to nine years for
bleeding and under three years for beetle-infested
trees (Tables 4 and 9, Figs. 2 and 6). Once a tree has
been infected by P. ramorum, the processes leading to
death may be broadly similar in both species.
The Weibull model makes assumptions about the
underlying distribution of the data. Results are thus
influenced by the choice of parameters. The Cox
proportional hazard model is semi-parametric, with
fewer assumptions, but cannot extrapolate trends
beyond the data set that is used. Considering these
caveats, the models produce survival estimates that are
in close agreement. The tendency for larger diameter
trees to become symptomatic should lead to a positive
correlation between dbh and mortality. Although the
Weibull health analysis model found a significant
relationship between stem dbh and development of
the bleeding symptom for both Q. agrifolia and
L. densiflorus, dbh was not a statistically significant
factor in the survival analyses. This is likely due to the
limited number of asymptomatic trees (the basis for
the health analysis) that died during the study and to
the fact that the trees in all other cohorts were
symptomatic.
After three years, mortality in the initially
asymptomatic Q. agrifolia cohort was only 0.4%
for trees that developed the bleeding symptom
(Table 5(a)). It is apparent that the mortality rate
from this disease is a product of additional factors.
Beetle colonization was associated with dramatically
shortened survival in infected trees. In the initially
bleeding Q. agrifolia cohort, mortality was preceded
in all but one tree by scolytid beetle colonization of the
bleeding area and development of H. thouarsianum
sporophores in the vicinity of the bleeding cankers.
The trees that were dead in 2000 with evidence of
bleeding, beetles, and H. thouarsianum sporophores
are assumed to have gone through the same sequence.

B.A. McPherson et al. / Forest Ecology and Management 213 (2005) 71–8986
The high mortality in the bleeding plus beetles cohort,
as well as the development of H. thouarsianum
sporophores on all but seven trees after one year,
clearly indicates that most of these trees had been
infected for more than three years when the study
began (Table 5(d)). The consistent presence of insects
and fungi in Q. agrifolia infected with P. ramorum
illustrates the difficulty in isolating mortality caused
by the pathogen from mortality influenced by the
secondary organisms that respond to infected oaks.
Although it is probable that infected trees would
develop secondary fungal infections and decline in the
absence of beetle colonization, this study shows that
once beetles colonized a tree, its probability of
survival declined rapidly.
The damage caused by P. ramorum cankers alone
seems unlikely to lead to structural failure of mature
trees, since this pathogen has not been reported to
penetrate deeper than approximately 3 cm into the
sapwood (Rizzo et al., 2002). The presence of
associated organisms, principally ambrosia beetles
and H. thouarsianum, was highly correlated with both
symptomatic living and dead Q. agrifolia that failed.
The point where green and bleeding trees snapped off
typically exhibited extensive ambrosia beetle tunnels
to a depth of 10 cm and greater into the sapwood, and
in numbers sufficient to plausibly cause structural
weakening. Beetle penetration of the outer bark
breaches the primary defense of a tree against
pathogens and tunneling into the outer sapwood
disrupts water conduction. Thus, these beetles can
create avenues for entry of decay fungi, as reported for
a number of other pathogen-tree-beetle interactions
(Anderson and Hoffard, 1978; Carpenter et al., 1988;
Hijii et al., 1991; Kessler, 1974) and may also
facilitate the development of endophytic fungi, such as
H. thouarsianum. In other hardwood species, decay
located on the main stem can lead to breakage of living
trees. Hypoxylon mammatum infection can lead to
structural failure in living Populus spp. (Manion and
Griffin, 1986). The joint activity of the fungi, Nectria
spp., beech scale (Cryptococcus fagisuga), and
ambrosia beetles (Xyloterus domesticum), in European
beech bark disease can result in beech snap, the
structural failure of mature Fagus sylvatica trees
(Speight, 1981).
The localized response of native ambrosia and bark
beetles to P. ramorum-induced bleeding cankers on
native oaks constitutes a shift in their host selection
behavior. The principal species involved are two
ambrosia beetles, the oak ambrosia beetle (Monar-
thrum scutellare) and the minor oak ambrosia beetle
(M. dentigerum), and the western oak bark beetle
(Pseudopityophthorus pubipennis), which colonize
fresh dead limbs of living trees, trees that are freshly
killed or broken, or trees severely weakened by
disease (Chamberlain, 1958; Furniss and Carolin,
1977; Wood, 1982). Ambrosia beetles inoculate their
tunnels and brood chambers with co-evolved fungi
that serve as food for both adults and developing
larvae (Beaver, 1989). Prior invasion of the sapwood
by mycelia of decay fungi should prevent successful
ambrosia beetle colonization through competitive
exclusion of the ambrosia fungi. Because these
beetles’ fungi are at a competitive disadvantage,
selective pressures favor beetle colonization of host
trees with sound, undecayed wood. A tree that is in
decline caused by decay fungi probably does not
provide suitable host material for ambrosia beetles. In
a stand of Q. agrifolia infected with P. ramorum, those
trees that are severely weakened, as indicated by
sparse and pale foliage, are assumed to provide
suitable host material for these beetles. These trees
may undergo mass beetle attack at this stage.
However, bleeding cankers are the only visual
evidence of P. ramorum infection in Q. agrifolia
prior to beetle attack. On a freshly broken (non-
infected) Q. agrifolia, the characteristic colonization
pattern is not localized on the lower bole, but is
distributed relatively uniformly over the entire tree
(McPherson, unpublished observation). Where bleed-
ing cankers are present on a living tree, beetles
initially colonize only the bark that overlies the
cankers. The cues to which these insects respond are
unknown, but the close proximity of their tunneling
activity to bleeding sites on the bark suggests that
infected subcortical tissues may produce volatiles that
signal the presence of suitable host material.
The criteria that are reliably used to evaluate
symptomatic Q. agrifolia are not always adequate to
detect infected L. densiflorus. Since the relationship
between foliar symptoms and stem cankers is not
known for the latter species, evaluations based on
bleeding alone are likely to underestimate the true
extent of infection in a stand. This conclusion is
derived from both the Weibull survival analyses

B.A. McPherson et al. / Forest Ecology and Management 213 (2005) 71–89 87
(Tables 4 and 9) and mortality in asymptomatic
cohorts (Tables 5 and 8) for both species. Although the
mortality recorded for the initially asymptomatic
cohorts was proportionally higher for L. densiflorus
than Q. agrifolia after three years, both the predicted
and observed mortality of the bleeding and beetle-
infested cohorts were similar in these species. The
Weibull analysis predicted that the survival time of a
tree in the asymptomatic Q. agrifolia cohort was more
than twice that of an asymptomatic L. densiflorus
(Figs. 2 and 5). This difference could be due to a
greater susceptibility of L. densiflorus to P. ramorum
infection. Very high infection and mortality levels
have been observed in this species in Marin and
Monterey County forests, and in a number of areas, a
majority of the mature trees have been infected or
killed. It is also probable that infected L. densiflorus
are undercounted, because infected trees may not all
have bleeding cankers at the early stages of the
disease.
The high structural failure rate of living Q.
agrifolia with bleeding cankers (5.8% of the total
stems alive in 2000) indicates that P. ramorum
infection has altered the rate of failure in this species.
The role played by beetles in tree failure cannot be
separated from that of H. thouarsianum, as indicated
by the presence of their sporophores. However,
because beetle tunneling precedes the development
of H. thouarsianum sporophores, beetles are the more
consistent and reliable predictor of failure in living
Q. agrifolia infected by P. ramorum.
The finding that larger diameter trees are more
likely to develop sudden oak death suggests that mean
stem diameters have been reduced since the epidemic
started. The association of tunneling beetles with
larger diameter bleeding Q. agrifolia also will
decrease the mean diameter in the population, since
the survival analysis showed that once beetles
colonize a bleeding tree, its expected survival is
significantly decreased. Taken together, these results
suggest that as P. ramorum continues to infect new
trees, the size distribution of both Q. agrifolia and
Q. kelloggii will shift downward. This process may
lead to recruitment of new seedling cohorts in these
overstory-dominated forests, as the forest canopy
opens. Whereas infection of oak foliage is rare, the
foliage of L. densiflorus is much more susceptible to P.
ramorum infection (Davidson et al., 2002). In closed
canopy forests, L. densiflorus saplings and seedlings
can be abundant in the understory. Since P. ramorum is
a lethal pathogen for L. densiflorus in all age classes,
including seedlings, saplings, and mature trees (Rizzo
et al., 2002), this species is threatened as a major
component of these forests.
The infection process is not yet understood for bark
cankers. The tendency for P. ramorum cankers to be
primarily confined to the bark and cambium (Rizzo
et al., 2002) could indicate that bark quality affects
infections in oaks and tanoaks. In the absence of any
documented mechanism for infection through the
bark, the possible role of insects in the spread of
P. ramorum, though speculative, should be considered.
A number of characteristics potentially predispose
insects to serve as vectors of tree pathogens (Leach,
1940). Because none of the beetle species associated
with P. ramorum-infected oaks are reported to attack
healthy trees, these insects are not likely candidates as
vectors. Attempts to isolate P. ramorum from
ambrosia and bark beetles emerged from infected
logs have not been successful (unpublished data).
Beech bark disease of Fagus grandifolia in eastern
North America results from the interaction of an
introduced scale insect (Cryptococcus fagisuga) and
both introduced and native Nectria spp., and is more
likely to occur in larger diameter trees (Houston,
1975). The elevated nitrogen content of the bark in
larger trees leads to selective feeding by these insects
(Wargo, 1988). Where a source of inoculum is
abundant, unrecognized wounding by insects that
selectively feed on larger diameter trees may serve as
infection courts for P. ramorum. If infection is a result
of a randomly distributed process, the greater surface
area and more complex bark surface structure of larger
trees may increase the probability of infection.
The persistence of asymptomatic host trees that are
surrounded by bleeding and dead trees may indicate
disease resistance within these stands (Dodd et al.,
2005). Assuming that P. ramorum was recently
introduced into these forests, some proportion of
the population would have become infected, but as
fewer of the resistant individuals develop infections in
later years, the number of newly symptomatic Q.
agrifolia should stabilize or decline. Evidence for
variation in resistance of Q. agrifolia to P. ramorum is
suggested by studies in which mechanical inoculations
produced cankers that varied considerably in size and

B.A. McPherson et al. / Forest Ecology and Management 213 (2005) 71–8988
in frequency of disease development among trees
(McPherson et al., unpublished data; Rizzo et al.,
2002).
Acknowledgements
We appreciate the field assistance of Dan Stark,
Gabriela Ritok-Owens, Jake Schweitzer, Danny Fry,
and Brandon Collins. Patrick Robards (China Camp
State Park), George Gray (California State Parks), and
Mike Swezy (MMWD) provided access to protected
properties and other assistance. Nadir Erbilgin
provided a helpful review of the paper. Funding has
been provided by the University of California Division
of Agriculture and Natural Resources, USDA-Forest
Service, Pacific Southwest Research Station, and the
University of California Statewide Integrated Pest
Management Program for Exotic/Invasive Pests and
Diseases.
References
Akaike, H., 1974. A new look at statistical model identification.
IEEE Trans. Automat. Contr. AU-19, 716–722.
Anderson, R.L., Hoffard, W.H., 1978. Fusarium canker-ambrosia
beetle complex on tulip poplar in Ohio. Plant Dis. Rep. 62, 751.
Beaver, R.A., 1989. Insect-fungus relationships in the bark and
ambrosia beetles. In: Wilding, N., Collins, N.M., Hammond,
P.M., Webber, J.F. (Eds.), Insect-Fungus Interactions. Academic
Press, London, pp. 121–143.
Blomquist, C., Kubisiak, T. 2003. Laboratory diagnostics of Phy-
tophthora ramorum from field samples. In: Sudden Oak Death
Online Symposium. How Concerned Should You Be. http://
sod.apsnet.org/Papers/blomquist_kubisiak/default.htm.
Carpenter, S.E., Harmon, M.E., Ingham, E.R., Kelsey, R.G., Lattin,
J.D., Schowalter, T.D., 1988. Early patterns of heterotrophic
activity in conifer logs. Proc. Royal Soc. Edinburgh 94B, 33–43.
Chamberlain, W.J., 1958. The Scolytidae of the Northwest. Oregon
State College, Corvallis, OR.
Cobb, F.W., Stark, R.W., 1970. Decline and mortality of smog-
injured ponderosa pine. J. For. 68, 147–149.
Davidson, J.M., Rizzo, D.M., Garbelotto, M., Tjosvold, S.,
Slaughter, G.M., 2002. Phytophthora ramorum and sudden
oak death in California. II. Transmission and survival. In:
Standiford, R.B., McCreary, D., Purcell, K.L. (Eds.), Pro-
ceedings of the 5th Symposium on California Oak Woodlands,
San Diego, CA: Forest Service, USDA Forest Service; 741–
749.
Davidson, J.M., Werres, S., Garbelotto, M., Hansen, E.M., Rizzo,
D.M., 2003. Sudden oak death and associated diseases caused
by Phytophthora ramorum. Plant Health Progr. Online 10,
1094.
Dodd, R.S., Huberli, D., Douhovnikoff, V., Harnik, T.Y., Afzal-
Rafii, Z., Garbelotto, M., 2005. Is variation in susceptibility to
Phytophthora ramorum correlated with population genetic
structure in coast live oak (Quercus agrifolia)? New Phytol.
165, 203–214.
Furniss, R.L., Carolin, V.M., 1977. Western Forest Insects. USDA,
Forest Service, Washington.
Garbelotto, M., Davidson, J.M., Ivors, K., Maloney, P.E., Huberli,
D., Koike, S.T., Rizzo, D.M., 2003. Non-oak native plants are
main hosts for sudden oak death pathogen in California. Calif.
Agric. 57, 18–23.
Hansen, E.M., Reeser, P., Davidson, J.M., Garbelotto, M., Iverson,
K., Douhan, L., Rizzo, D.M., 2003. Phytophthora nemorosa, a
new species causing cankers and leaf blight of forest trees in
California and Oregon. U.S.A. Mycotaxon 88, 129–138.
Hartley, C., Davidson, R.W., Crandall, B.S. 1961. Wetwood, bac-
teria, and increased pH in trees, U.S. Department of Agriculture
Forest Products Laboratory, Report no. 2215, USDA Forest
Service, Washington.
Hijii, N., Kajimura, H., Nishibe, Y., 1991. A note on the discolora-
tion and fungal infiltration processes on wood tissues surround-
ing the gallery system of scolytid beetles. Bull. Nagoya Univ.
For. 11, 31–38.
Houston, D.R., 1975. Beech bark disease: the aftermath forests are
structured for a new outbreak. J. For. 73, 660–663.
Kessler, K., 1974. An apparent symbiosis between Fusarium fungi
and ambrosia beetles causes canker on black walnut stems. Plant
Dis. Rep. 58, 1044–1047.
Law, R., 1981. The dynamics of a colonizing population of Poa
annua. Ecology 62, 1267–1277.
Leach, J.G., 1940. Insect Transmission of Plant Diseases. McGraw-
Hill, New York.
Lee, E.T., Wang, J.W., 2003. Statistical Methods for Survival Data
Analysis. Wiley-Interscience, New York.
Manion, P.D., Griffin, D.H., 1986. Sixty-five Years of Research on
Hypoxylon Canker of Aspen. Plant Dis. 70, 803–808.
Mayer, K.E., Laudenslayer, W.F., 1988. A Guide to Wildlife Habitats
in California. California Department of Forestry, Sacramento.
McPherson, B.A., Wood, D.L., Storer, A.J., Svihra, P., Rizzo, D.M.,
Kelly, N.M., Standiford, R.B. 2000. Oak mortality syndrome:
Sudden death of oaks and tanoaks. California Deptartment of
Forestry and Fire Protection, Tree Notes, 6.
Mercetich, S.M., Campbell, R.N., Matherton, M.E., 1977. Phy-
tophthora trunk canker of coast live oak and cork oak trees in
California. Plant Dis. Rep. 61, 66–70.
Murphy, S.K., Rizzo, D.M., 2003. First report of Phytophthora
ramorum on Canyon Live Oak in California. Plant Dis. 87, 315.
Rizzo, D.M., Garbelotto, M., 2003. Sudden oak death: endangering
California and Oregon forest ecosystems. Front. Ecol. Environ.
1, 197–204.
Rizzo, D.M., Garbelotto, M., Davidson, J.M., Slaughter, G.W.,
Koike, S.T., 2002. Phytophthora ramorum as the cause of
extensive mortality of Quercus spp. and Lithocarpus densiflorus
in California. Plant Dis. 86, 205–214.
SAS. 2002. JMP, SAS Institute, Inc., Cary, NC.

B.A. McPherson et al. / Forest Ecology and Management 213 (2005) 71–89 89
Sinclair, W.A., Lyon, H.H., Johnson, W.T., 1987. Diseases of Trees
and Shrubs. Comstock Publishing Associates, Ithaca.
Speight, M.R., 1981. Tree pests-5. Beech Scale (Cryptococcus
fagisuga Lind) and Ambrosia beetle (Xyloterus domesticum
L.). Arboricult. J. 5, 143–146.
Storer, A.J., Wood, D.L., Gordon, T.R., 2002. The epidemiology of
pitch canker in California. For. Sci. 48, 694–700.
Svihra, P. 1999a. Sudden Death of Tanoak, Lithocarpus densiflorus.
University of California Coooperative Extension in Marin
County, Pest Alert #1:2.
Svihra, P. 2000. Protecting Live Oaks Against Bark Beetles and
Ambrosia Beetles. University of California Cooperative Exten-
sion in Marin County, Pest Alert #3B.
Svihra, P., 2001. Diagnosis of SOD: case study of a scientific
process. Calif. Agric. 55, 12–13.
Tainter, F.H., O’Brien, J.G., Hernandez, A., Orozco, F., Rebolledo,
O., 2000. Phytophthora cinnamomi as a cause of oak mortality in
the state of Colima, Mexico. Plant Dis. 84, 394–398.
Wargo, P.M., 1988. Amino nitrogen and phenolic constituents of
bark of American beech, Fagus grandifolia, and infestation by
the beech scale, Cryptococcus fagisugi. Eur. J. For. Pathol. 18,
279–290.
Waters, W.E., Stark, R.W., Wood, D.L. (Eds.), 1985. Integrated
Pest Management in Pine-Bark Beetle Ecosystems. John Wiley
and Sons, Inc., New York.
Werres, S., Marwitz, R., 1997. Triebsterben an rhododendron:
Unbekannte Phytophthora. Deutscher Gartenbau 21, 1166–
1168.
Werres, S., Marwitz, R., Man, In’T., Veld, W.A., DeCock, A.W.,
Bonants, P.J.M., DeWeerdt, M., Themann, K., Ilieva, E.,
Baayen, R.P., 2001. Phytophthora ramorum sp. nov.: a new
pathogen on Rhododendron and Viburnum. Mycol. Res. 105,
1155–1165.
Wood, S.L., 1982. The Bark and Ambrosia Beetles of North
and Central America (Coleoptera: Scolytidae), a Taxonomic
Monograph. Brigham Young University, Provo.