sulfate reduction, acetate turnover and carbon metabolism
TRANSCRIPT
Vol. 109: 245-255-1994 MARINE ECOLOGY PROGRESS SERIES Mar. Ecol. Prog. Ser.
I ; Published June 23
Sulfate reduction, acetate turnover and carbon metabolism in sediments of the Ao Nam Bor
mangrove, Phuket, Thailand
Erik Kristensenl, Gary M. ~ i n g ~ , Marianne ~ o l m e r ' , Gary T. ~an t a ' , Mikael H. ~ensen' , Kim Hansenl, Nipavan ~ u s s a r a w i t ~
Institute of Biology, Odense University, DK-5230 Odense M, Denmark Darling Marine Center, University of Maine, Walpole, Maine 04573. USA
Phuket Marine Biological Center, PO Box 60, Phuket, 83000 Thailand
ABSTRACT Rates of sediment O2 uptake, CO2 production, sulfate reduction and acetate turnover were examined during January 1992 in the Ao Nam Bor mangrove, Phuket, Thailand. The impact of air exposure on O2 uptake was most pronounced in the intensely bioturbated high-intertidal zone (6.4 times higher than during water cover), and decreased to almost zero in the low-intertidal zone. This indcates a gradual increased area of sediment-air contact zones with tidal elevation due to changes in surface topography. Based on an average water cover for January, the diurnal O2 uptake - and thus total decay of deposited detritus - was 4 to 5 and 8 times faster in the high-intertidal compared to the mid- and low-intertidal zones, respectively. Sulfate reduction rates were generally low. The depth- integrated (0 to 30 cm) sulfate reduction was highest in the mid-intertidal zone, and supported 85 % of the estimated daily CO2 release. In the high- and low-intertidal zones, sulfate reduction supported 11 and 92%, respectively, of daily CO2 release. Rates of acetate uptake were also higher in the mid- than in the low-intertidal zone (no data from high-intertidal) However, the depth-integrated acetate uptake was consistently about 2.6 times the rates of CO, release and 5 to 6 times the 0 to 11 cm integrated sulfate reduction, which suggests that pool sizes of acetate and thus uptake rates may have been overestimated. In conclusion, while benthic respiration in the mid- and low-intertidal zones of the Ao Nam Bor mangrove was dominated by sulfate reduction with acetate as carbon source. 'suboxic' conditions related to bioturbation in the active high-intertidal sediment made respiration by other electron acceptors than SO.,- more important.
KEY WORDS: Mangrove sediment . Thailand . Carbon metabolism . Sulfate reduction . Acetate turn- over . Tidal variation
INTRODUCTION
The most important factors controlling sediment metabolism in tropical mangrove swamps are inunda- tion frequency, and quantity and quality of organic input (e.g. Alongi 1989, Wattayakorn et al. 1990, Kris- tensen et al. 1992). However, depending on location and season, factors like crab bioturbation, monsoon storms and human deforestation also can affect the structure and activity of the benthic community con- siderably (Chansang et al. 1982, Hylleberg & Natee- wathana 1984, Robertson & Daniel 1989).
Based on tidal height and inundation frequency, mangrove forests can be divided into low-, mid- and high-intertidal zones, corresponding roughly to the gradations in the extremes and means of spring and neap tides (Alongi 1989). These zones are character- ized by specific tree communities and sediment com- position. The low-intertidal zone (mudflats or creek banks) is usually characterized by patchy growth of Avicennia species in sandy and silty sediment. The mid-intertidal zone is dominated by dense growth of Rhizophora species in silty, high-organic sediment with peat-like appearance. In the high-intertidal zone
O Inter-Research 1994 Resale of fuU article not permjtted
24 6 Mar. Ecol. Prog. Ser. 109: 245-255, 1994
various mixtures of tree species are found, in many cases dwarfed due to high salinity, dry sediment and nutrient deficiency (Lugo & Snedaker 1974).
Organic input to the sediment in the various zones is dominated by litter fall and root growth of the tree species present (e.g. Flores-Verdugo et al. 1987, Komiyama et al. 1987). While the ultimate deposition sites of litter are controlled by tidally dominated hori- zontal transport (e.g. Lugo & Snedaker 1974, Wattaya- korn et al. 1990), root materials will be decomposed within the sediment where they are produced. Sedunent detritus in mangroves is usually nitrogen-poor (high C:N ratio) with high contents of cellulose and lignin (Benner & Hodson 1985, Kristensen 1990). These mate- rials decompose slowly - especially under anaerobic conditions - due to their aromatic nature, and due to a genera! nutcent limitation of microbial decomposers (e.g. Gonzalez-Farias & Mee 1988, Alongi 1989, Enriquez et al. 1993). Since oxygen is depleted below a few mm depth in mangrove sediments, even when the surface is exposed to air, anaerobic metabolism pre- dominates with decomposition mediated primarily by fermentation and sulfate reduction (Kristensen et al. 1992). The quantitative role of sulfate reduction may, however, vary depending on tidal elevation and thus the general oxidation state of the sediment (e.g. Nedwell & Abram 1978, King 1988, Kristensen et al. 1991).
The low molecular fraction of dissolved organic carbon (DOC) (e.g. acetate and other short-chain fatty acids) is usually considered the most important sub- strate for sulfate-reducing bacteria in marine sedi- ments (Ansbzk & Blackburn 1980, Balba & Nedwell 1982, Parkes et al. 1984, Shaw et al. 1984). Although the labile fraction of leachable organics from man- grove leaves is mineralized rapidly after incorporation in sediment, a large fraction of the DOC pool is com- posed of tannins and phenolics which may hamper - or even inhibit - microbial activity (Benner & Hodson 1985, Gonzales-Farias & Mee 1988).
The purpose of this work was to determine the role of acetate uptake and sulfate reduction for benthic metabolism and organic matter decay at 3 tidal eleva- tions in a southeast Asian mangrove swamp (Ao Nam Bor). The impact of air exposure on benthic fluxes of O2 and CO2 was evaluated and related to crab bioturba- tion and sources of organic input in the sediment. This work is a continuation and comprehensive extension of a previous study on benthic metabolism at the same location (Kristensen et al. 1991).
MATERIALS AND METHODS
Site description. Samples were collected during January 1992 in a 300 m wide mangrove forest, Ao Nam
Bor, in Makham Bay, ca 4 km south of Phuket Town on the east coast of Phuket Island, Thailand. A detailed description of the study site is given by Frith et al. (1976). The 3 stations described by Kristensen et al. (1991) were also chosen for this study. Stn 1 was situated close to the landward fringe on a nonvegetated bank adjacent to a small (ca 1 m wide) creek. This high-intertidal station was heavily bioturbated by ocypodid and grapsid crabs (1046 i 508 burrow openings m-'; G. T. Banta unpubl.). Stn 2 was located within the mangrove forest between 'prop' roots of Rhizophora apiculata ca 50 m from the seaward fringe. This mid-intertidal station was moder- ately affected by burrowing fauna (41 * 6 crab burrows and 500 i 62 sipunculid worms m-'). The low-intertidal Stn 3 was located on the tidal flat ca 100 m outside the forest. The dominating burrowing animals were ocypo- did crabs (8 2 1 m-'), mudskippers (Gobioidae) (about 5 m-2) and small ( l to 3 cm long) polychaete worms of unknown species (1400 i 600 m-2). Salinity and water temperature at all 3 stations were 33 to 35%0 and 28 to 33 "C.
0' and CO, flux. Rates of benthic metabolism were estimated from O2 uptake and CO2 production of water-covered (+W-core) sediment and O2 uptake of air-exposed (-W-core) sediment. Sediment cores were taken by hand at low tide during day using 8 cm i.d. and 25 cm long (+W-core) or 15 cm long (-W-core) acrylic core tubes. Diffusive O2 flux in both light and darkness (+W- and -W-profile) was estimated from O2 microprofiles measured on cores used for flux incuba- t i o n ~ . Cores were usually processed in the laboratory within 2 h after sampling.
For +W-core flux incubations, 4 cores (13 cm sedi- ment and 9 cm headspace) were sampled per station. In the laboratory, the still air-exposed cores were preincubated in the dark in a water bath at 29OC. After 1 to 4 h, seawater was carefully added and cores were submerged. Flux rates of O2 and CO2 were obtained by standard closed-core incubations according to Kris- tensen et al. (1991). Flux rates were determined during incubation periods of 2 to 7 h. Oxygen was measured by a mini Clark-type O2 electrode (Microelectrodes, Inc.) inserted into the gently stirred water column. At least 4 measurements were made at regular intervals during the incubation period. Care was taken not to let the O2 concentration in the overlying water drop lower than 60% of air saturation. The O2 results presented from Stn 2 are based on Winkler data due to electrode malfunction. Total carbon dioxide (TC02) was quanti- fied at the start and end by potentiometric Gran titra- tion (Talling 1973). Flux measurements for +W-cores were made on 2 consecutive days. Cores were drained and held in the seawater tank with air-exposed sedi- ment for 6 to 12 h between incubations to simulate low tide. As the 2 measurements for the 2 days generally
Kristensen et al. Carbon rnetabol~sn~ in mangrove sed~rnents 247
agreed within 10% the results are presented as the average.
Oxygen uptake by the sediment at low tide (-W-core) was estimated from the O2 decrease in the headspace of sealed, air-exposed cores (Kristensen et al. 1992). Four cores (11 cm sediment and 3 cm headspace) were incubated in darkness at each station. After a 1 to 2 h acclimation period in the laboratory at 2g°C, a rubber stopper, with a Clark-type O2 electrode (Radiometer, Denmark) inserted through a hole in the center, was fitted to the core liner allowing about 2 cm air space above the sediment. After 10 to 15 h the final electrode reading was noted. Subsequently, the O2 electrode was calibrated to air saturation (equivalent to the start concentration). Oxygen uptake was calculated using the concentration change and air volume trapped below the rubber stopper.
Depth penetration of O2 into the sediment was mea- sured by a polarographic needle O2 electrode (Dia- mond Electro-Tech, Inc.) with a platinum tip diameter of 35 to 40 pm, providing a spatial resolution of less than 0.2 mm (Helder & Bakker 1985). The electrode was mounted on a micromanipulator and connected to a picoammeter. Light (intensity: 1000 to 1500 pE m-2 S - ' ) and dark O2 profiles from the 3 stations were obtained under in situ conditions. Profiles were meas- ured in steps of 0.2 mm on 8 cm i.d. cores both with (+W-profile) and without (-W-profile, only in darkness) overlying water. Stirring rate in the water-covered cores was maintained at 10 rpm (water velocity at the site of measurement: 1 to 3 cm S- ' ) . The diffusive flux of O2 out of and into the sediment was estimated from the steepest gradient below the sediment-water inter- face by the l-dimensional version of Fick's first law of diffusion (Berner 1980). The apparent diffusion co- efficient of O2 at the sediment-water interface was calculated from porosity data and the temperature- corrected diffusion coefficient of O2 in seawater (Broecker & Peng 1974, Berner 1980).
Sulfate reduction. Sulfate reduction was measured by the core injection technique of Jnrgensen (1978). Three 40 cm long and 5.2 cm i.d. cores from each sta- tion were subcored using 2.6 cm i.d. and 16 cm long core tubes with silicone-filled injection ports. A volume of 2 p1 carrier-free 35S-S0,2- (70 kBq) was injected at 1 cm intervals and the cores were incubated with dry surfaces in darkness for 12 h. Subsequently, each sub- core was sectioned in 1 to 2 cm segments and fixed in 20% ZnAc. Samples were stored frozen until distilla- tion by the l-step procedure of Fossing & Jnrgensen (1989) and radioassayed within 1 to 3 mo.
Acetate uptake. Pore water acetate: Pore water for acetate analysis from Stns 2 and 3 was obtained by 2 methods - centrifugation (1500 rpm, 500 X g for 7 rnin) and 'sippers'. The i n situ 'sipper' technique was chosen
to examine possible artifacts resulting from coring and centrifugation (Howes et al. 1985). Sippers were con- structed from narrow-bore capillary tubing (1 mm i.d. X
5 mm 0.d.) with pipet tips containing glass wool and sealed with glass beads attached to one end. The pipet tips were notched to about one-half the circumference to form ports for pore water passage. The opposite ends of the tubing were sealed with serum stoppers. Sippers were slowly inserted vertically into the sedi- ment until the sampling ports were at the desired depths (1, 3, 5, 7 and 11 cm). After at least 24 h , pore water (1 to 2 ml) was collected by needle and syringe through the serum stoppers (first 0.5 to 1.0 m1 dis- carded). Samples were retained in syringes at ambient temperature for no more than 1 h before being frozen in vials until analysis. Due to the sand content of Stn 3, pore water was obtained readily from all depths. The silty sediment at Stn 2 prohibited sample collection from all except the 1 and 5 cm depths.
The enzyme-based HPLC technique of K n g (1991) was used to assay acetate. The samples were incubated with acetyl CoA synthase for 1 h at 30°C and enzyme activity was terminated by boiling for 5 min. AMP pro- duced by the reaction of pore water acetate with added ATP and acetyl CoA synthase was analyzed by HPLC within 4 d . In the interim, samples were stored frozen.
3H-acetate turnover: Sediment samples were ob- tained from 9 cm i.d. core tubes by slowly inserting cut-off 5 cm3 syringes horizontally into ports arrayed vertically (1, 3, 5 , 7 and 11 cm depth). After obtaining 3 to 5 cm3 of sediment, the syringes were sealed with butyl septa, injected with 10 p1 of a 3H-acetate solution (ca 3.7 kBq) and incubated for 5 , 15, 30 and 60 min at 29 "C. Incubations were terminated by extruding sub- cores into vials containing 0.5 M NaOH. Time zero controls were prepared by extruding subcores into base immediately after injection.
Rate constants of acetate uptake were determined by a modification of the technique described by Sawyer & King (1993). The sediment-base mixtures were centrifuged and the supernatants dried to remove 3H20 . The residues from drying were neutral- ized and mixed with a scintillation fluid for radioassay. Rate constants were calculated from a regression analysis of ln(DPM, disintegrations per minute) in the dried pore-water residues as a function of incubation time. Uptake rates were obtained from the product of the rate constants and pore water acetate pool sizes determined as described above.
Molybdate inhibition: Samples of surface sediment were collected by inserting 5 cm3 cut-off syringes vertically into the sediment at Stn 3 and removing the upper 3.5 cm of the profile. The syringes were sealed with butyl septa and, after 1 to 1.5 h , 1 triplicate set of syringes was injected with 0.5 m1 each of 200 mM
Mar. Ecol. Prog. Ser. 109: 245-255, 1994
sodium molybdate in artificial seawater. Another tripli- cate set was incubated as uninhibited controls. The syringes were then incubated for 0, 0.5, 1.0, 1.5 and 2 h at 29 "C. At each time point, the syringe contents tvere transferred into 50 m1 centrifuge tubes and centrifuged for 3 to 5 min at 1500 rpm (500 X g) . One m1 of the supernatant was collected from each sample and frozen prior to acetate analysis as above.
Other sediment parameters. Cores (5.2 cm i.d.) for determination of sediment characteristics were sec- tioned at the same depth intervals as those used for the sulfate reduction assay. Porosity was calculated from wet densities and water loss at 105°C for 12 h. Sub- samples of the 105°C dried sediment were used for Stepwise ThermoGravimetry (STG) to obtain the Rp index: (ignition loss from 280 to 520 "C) /(ignition loss from 130 :G 523°C) (Kristensen 1990). Low Rps (around 0.2) are typical for materials rich in aliphatic com- pounds (Lipids, carbohydrates), whereas high Rps (> 0.5) represent aromatic compounds and materials rich in nitrogen (humates, proteins). Samples of 130°C dried sediment were analyzed for particulate organic carbon (POC) and nitrogen (PON) using a Carlo Erba CHNS analyzer. Chlorophyll a from the upper 0.5 cm sedi- ment was determined spectrophotometrically (Parsons et al. 1984) in 4 replicates per station after extracting the samples in 90 % acetone (1:6 v./v.) for 24 h at 5 "C.
RESULTS
Sediment characteristics
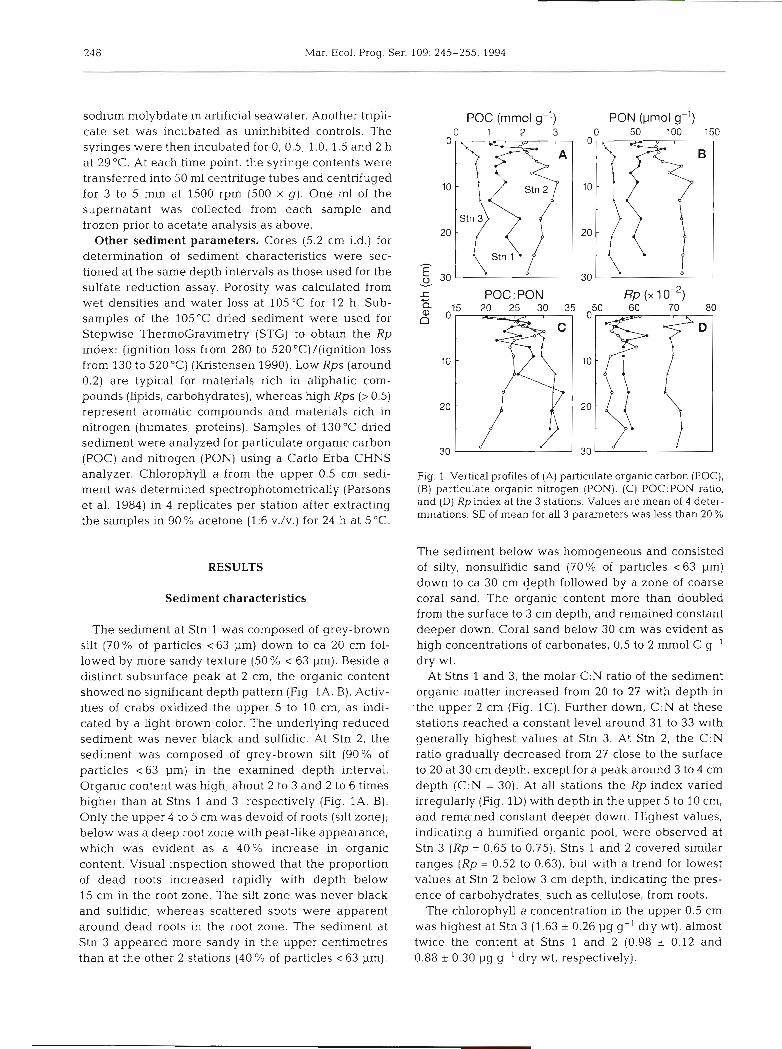
The sediment at Stn 1 was composed of grey-brown silt (70% of particles <63 pm) down to ca 20 cm fol- lowed by more sandy texture (50% 63 pm). Beside a distinct subsurface peak at 2 cm, the organic content showed no significant depth pattern (Fig. lA, B). Activ- ities of crabs oxidized the upper 5 to 10 cm, as indi- cated by a light brown color. The underlying reduced sediment was never black and sulfidic. At Stn 2, the sediment was composed of grey-brown silt (90% of particles <63 pm) in the examined depth interval. Organic content was high, about 2 to 3 and 2 to 6 times higher than at Stns 1 and 3, respectively (Fig. l A , B). Only the upper 4 to 5 cm was devoid of roots (silt zone); below was a deep root zone with peat-like appearance, which was evident as a 40% increase in organic content. Visual inspection showed that the proportion of dead roots increased rapidly with depth below 15 cm in the root zone. The silt zone was never black and sulfidic, whereas scattered spots tvere apparent around dead roots in the root zone. The sediment at Stn 3 appeared more sandy in the upper centimetres than at the other 2 stations (40 % of particles < 63 pm).
POC (mmol g-l) PON (pmol g-l) 0 1 2 3 0 50 100 150
Fig. 1. Vertical profiles of (A) particulate organic carbon (POC), (B) particulate organic nitrogen (PON), (C) P0C:PON ratio, and (D) R p index at the 3 stations. Values are mean of 4 deter- mination~. SE of mean for all 3 parameters was less than 20 %
The sediment below was homogeneous and consisted of silty, nonsulfidic sand (70% of particles <63 pm) down to ca 30 cm depth followed by a zone of coarse coral sand. The organic content more than doubled from the surface to 3 cm depth, and remained constant deeper down. Coral sand below 30 cm was evident as high concentrations of carbonates, 0.5 to 2 mm01 C g-' dry wt.
At Stns 1 and 3, the molar C:N ratio of the sediment organic matter increased from 20 to 27 with depth in
-the upper 2 cm (Fig. 1C). Further down, C:N at these stations reached a constant level around 31 to 33 with generally highest values at Stn 3. At Stn 2, the C:N ratio gradually decreased from 27 close to the surface to 20 at 30 cm depth, except for a peak around 3 to 4 cm depth (C:N = 30). At all stations the R p index varied irregularly (Fig. ID) with depth in the upper 5 to 10 cm, and remained constant deeper down. Highest values, indicating a humified organic pool, were observed at Stn 3 (Rp = 0.65 to 0.75). Stns 1 and 2 covered similar ranges (Rp = 0.52 to 0.63), but with a trend for lowest values at Stn 2 below 3 cm depth, indicating the pres- ence of carbohydrates, such as cellulose, from roots.
The chlorophyll a concentration in the upper 0.5 cm was highest at Stn 3 (1.63 + 0.26 pg g-' dry wt), almost twice the content at Stns 1 and 2 (0.98 + 0.12 and 0.88 * 0.30 pg g-' dry wt, respectively).
Kristensen et al.: Carbon metabolism in mangrove sediments 249
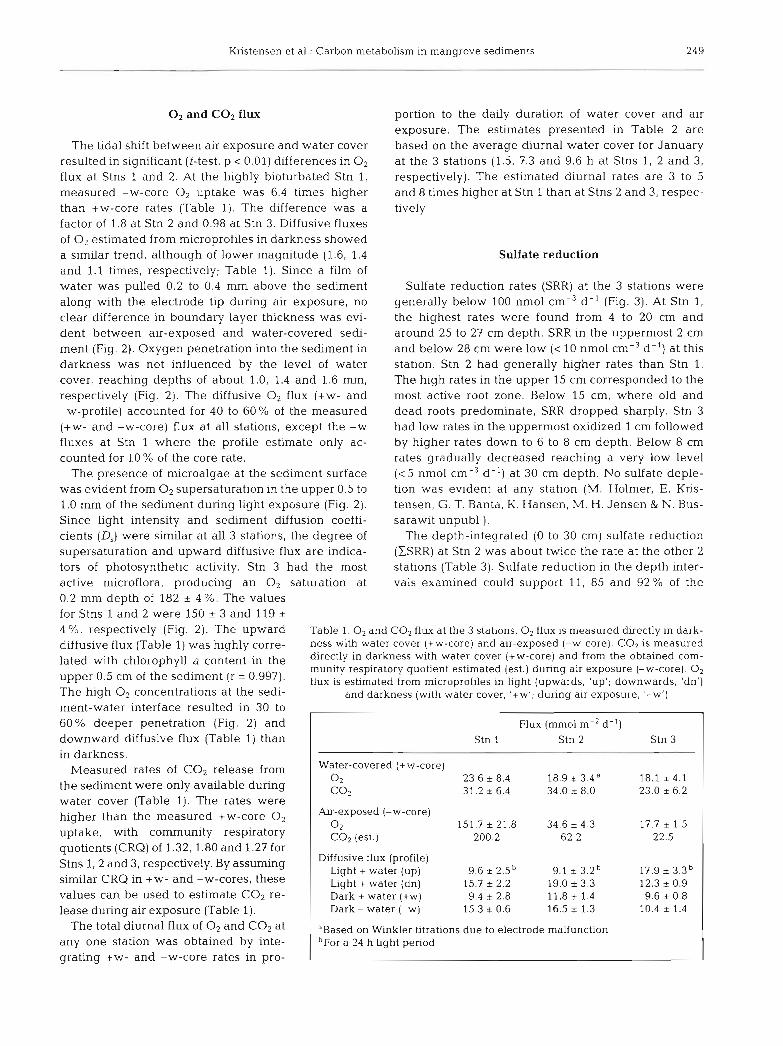
O2 and CO2 flux portion to the daily duration of water cover and air exposure. The estimates presented in Table 2 are
The tidal shift between air exposure and water cover based on the average diurnal water cover for January resulted in significant (t-test, p < 0.01) differences in O2 at the 3 stations (1.5, 7.3 and 9.6 h at Stns 1, 2 and 3, flux at Stns 1 and 2. At the highly bioturbated Stn 1, respectively). The estimated diurnal rates are 3 to 5 measured -W-core 0, uptake was 6.4 times higher and 8 times higher at Stn 1 than at Stns 2 and 3, respec- than +W-core rates (Table 1). The difference was a tively. factor of 1.8 at Stn 2 and 0.98 at Stn 3. Diffusive fluxes of O2 estimated from microprofiles in darkness showed a simllar trend, although of lower magnitude (1.6, 1.4 Sulfate reduction and 1.1 times, respectively; Table 1). Since a film of water was pulled 0.2 to 0.4 mm above the sediment Sulfate reduction rates (SRR) at the 3 stations were along with the electrode tip during air exposure, no generally below 100 nmol cm-3 d-' (Fig. 3). At Stn 1, clear difference in boundary layer thickness was evi- the highest rates were found from 4 to 20 cm and dent between air-exposed and water-covered sedi- around 25 to 27 cm depth. SRR in the uppermost 2 cm ment (Fig. 2) . Oxygen penetration into the sediment in and below 28 cm were low (< 10 nmol cm-3 d-l) at this darkness was not influenced by the level of water station. Stn 2 had generally higher rates than Stn 1. cover, reaching depths of about 1.0, 1.4 and 1.6 mm, The high rates in the upper 15 cm corresponded to the respectively (Fig. 2). The diffusive O2 flux (+W- and most active root zone. Below 15 cm, where old and -W-profile) accounted for 40 to 60% of the measured dead roots predominate, SRR dropped sharply. Stn 3 (+W- and -W-core) flux at all stations, except the -W had low rates in the uppermost oxidized 1 cm followed fluxes at Stn 1 where the profile estimate only ac- by higher rates down to 6 to 8 cm depth. Below 8 cm counted for 10 % of the core rate. rates gradually decreased reaching a very low level
The presence of microalgae at the sediment surface ( < 5 nmol cm-3 d- l ) at 30 cm depth. No sulfate deple- was evident from O2 supersaturation in the upper 0.5 to tion was evident at any station (M. Holmer, E. Kris- 1.0 mm of the sediment during light exposure (Fig. 2). tensen, G. T. Banta, K. Hansen, M. H. Jensen & N. Bus- Since light intensity and sediment diffusion coeffi- sarawit unpubl.). cients (D,) were similar at all 3 stations, the degree of The depth-integrated (0 to 30 cm) sulfate reduction supersaturation and upward diffusive flux are indica- (ESRR) at Stn 2 was about twice the rate at the other 2 tors of photosynthetic activity. Stn 3 had the most stations (Table 3). Sulfate reduction in the depth inter- active microflora, producing an O2 saturation at vals examined could support 11, 85 and 92 % of the 0.2 mm depth of 182 + 4 %. The values for Stns 1 and 2 were 150 * 3 and 119 * 4 %, respectively (Fig. 2). The upward Table 1. O2 and CO2 flux at the 3 stations. O2 flux is measured directly in dark- diffusive flux (Table l ) was highly corre- ness with water cover (+W-core) and air-exposed (-W-core). CO2 is measured
lated with chlorophyll a content in the directly in darkness with water cover (+W-core) and from the obtained com- munity respiratory quotient estimated (est.) during air exposure (-W-core). 0 2
'pper 0.5 cm Of the sediment ( r = 0.997). flux is estimated from rnlcroprofiles in light (upwards, 'up'; downwards, 'dn') The high O2 concentrations at the sedi- and darkness (with water cover, '+W'; during air exposure, '-W')
ment-water interface resulted in 30 to 60% deeper penetration (Fig. 2) and downward diffusive flux (Table 1) than in darkness.
Measured rates of CO, release from the sediment were only available during water cover (Table 1). The rates were higher than the measured +W-core 0, uptake, with community respiratory quotients (CRQ) of 1.32, 1.80 and 1.27 for Stns 1 , 2 and 3, respectively. By assuming similar CRQ in +W- and -W-cores, these values can be used to estimate CO2 re- lease during air exposure (Table 1).
The total diurnal flux of O2 and CO2 at any one station was obtained by inte- grating +W- and -W-core rates in pro-
Flux (mm01 m-2 d- ') Stn 1 Stn 2 Stn 3
Water-covered (+ W-core) 0 2 23.6 r 8.4 18.9 i 3.4a 18.1 2 4.1 c02 31.2 i 6.4 34.0 * 8.0 23.0 6.2
Air-exposed (-W-core) 0 2 151.7 i 21.8 34.6 i 4.3 17.7 * 1.5 CO2 (est.) 200.2 62.2 22.5
Diffusive flux (profile) Light +water (up) 9.6 i 2.5 9.1 i 3.2 17.9 * 3.3 Light + water (dn) 15.7 i 2.2 19.0 i 3.3 12.3 * 0.9 Dark + water (+W) 9.4 i 2.8 11.8 r 1.4 9.6 0.8 Dark - water (-W) 15.3 i 0.6 16.5 * 1.3 10.4 * 1.4
Vased on Winkler titrations due to electrode malfunction bFor a 24 h light penod
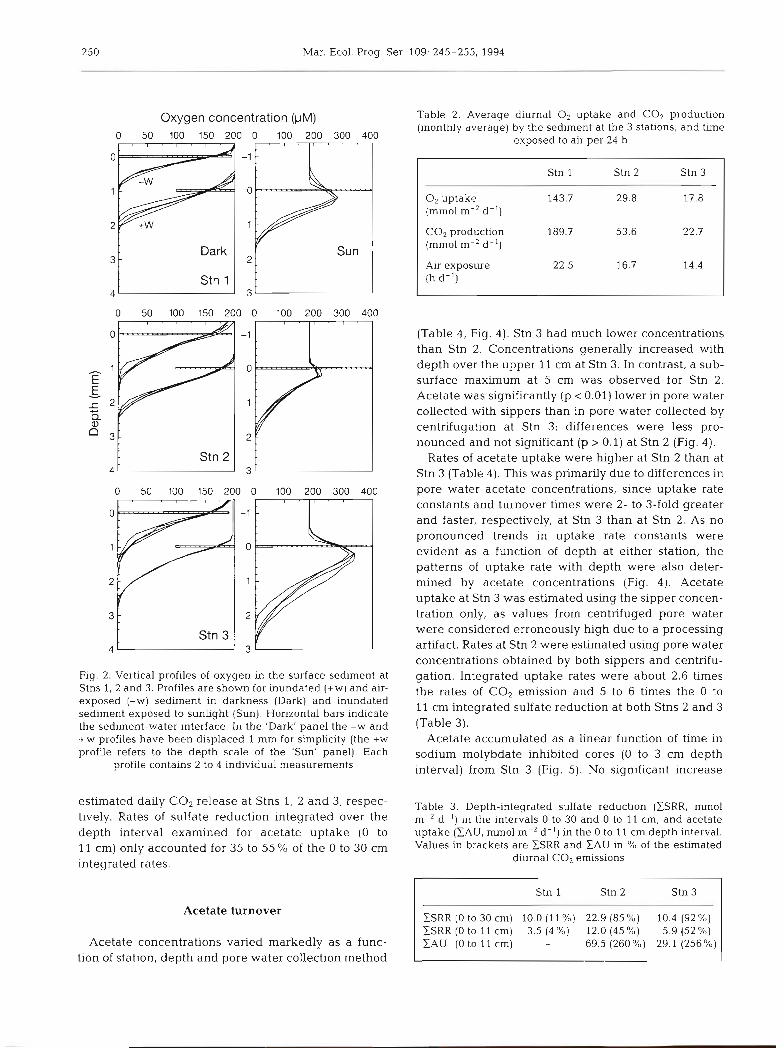
250 Mar. Ecol. Prog. Ser. 109: 245-255, 1994
Oxygen concentration (FM) 0 50 100 150 200 0 100 200 300 400
-1 -
3 -
Fig. 2. Vertical profiles of oxygen in the surface sedlment at Stns 1, 2 and 3. Profiles are shown for inundated (+W) and air- exposed (-W) sediment In darkness (Dark) and inundated sediment exposed to sunlight (Sun). Horizontal bars indicate the sediment-water interface. In the 'Dark' panel the -W and +W profiles have been displaced l mm for simplicity (the +W wrofile refers to the depth scale of the 'Sun' panel). Each
profile contains 2 to 4 individual measurements
estimated daily CO, release at Stns 1, 2 and 3, respec- tively. Rates of sulfate reduction integrated over the depth interval examined for acetate uptake (0 to l l cm) only accounted for 35 to 55 % of the 0 to 30 cm integrated rates.
Acetate turnover
Acetate concentrations varied markedly as a func- tion of station, depth and pore water collection method
Table 2. Average diurnal 0, uptake and CO2 production (monthly average) by the sediment at the 3 stations, and time
exposed to air per 24 h
Stn 1
O2 uptake 143.7 (mmol m-' d-l)
CO2 production (mmol m-2 d-')
Air exposure 22.5 (h d-l)
(Table 4 , Fig. 4 ) . Stn 3 had much lower concentrations than Stn 2. Concentrations generally increased with depth over the upper 11 cm at Stn 3. In contrast, a sub- surface maximum at 5 cm was observed for Stn 2. Acetate was significantly (p < 0.01) lower in pore water collected with sippers than in pore water collected by centrifugation at Stn 3; differences were less pro- nounced and not significant (p > 0.1) at Stn 2 (Fig. 4).
Rates of acetate uptake were higher at Stn 2 than at Stn 3 (Table 4). This was primarily due to differences in pore water acetate concentrations, since uptake rate constants and turnover times were 2- to 3-fold greater and faster, respectively, at Stn 3 than at Stn 2. As no pronounced trends in uptake rate constants were evident as a function of depth at either station, the patterns of uptake rate with depth were also deter- mined by acetate concentrations (Fig. 4). Acetate uptake at Stn 3 was estimated using the sipper concen- tration only, as values from centrifuged pore water were considered erroneously high due to a processing artifact. Rates at Stn 2 were estimated using pore water concentrations obtained by both sippers and centrifu- gation. Integrated uptake rates were about 2.6 times the rates of CO, emission and 5 to 6 times the 0 to 11 cm integrated sulfate reduction at both Stns 2 and 3 (Table 3).
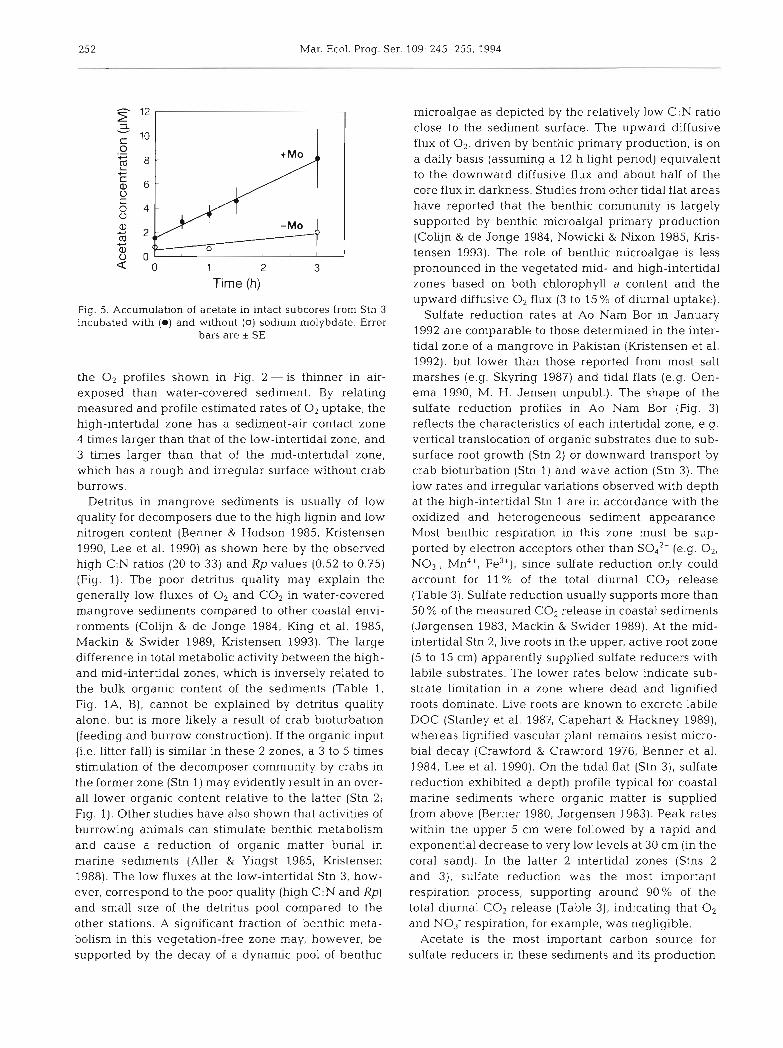
Acetate accumulated as a linear function of time in sodium molybdate inhibited cores (0 to 3 cm depth interval) from Stn 3 (Fig. 5). No significant increase
Table 3. Depth-integrated sulfate reduction (ZSRR, mm01 m-' d - ' ) in the intervals 0 to 30 and 0 to 11 cm, and acetate uptake (EAU, mm01 m-2 d-l) in the 0 to 11 cm depth interval. Values in brackets are CSRR and EAU in % of the estimated
dlurnal CO2 emissions
Stn 1 Stn 2 Stn 3
ESRR (0 to 30 cm) 10.0 (1 1 %) 22.9 (85 %) 10.4 (92 %) ZSRR (0 to 11 cm) 3.5 (4 %) 12.0 (45%) 5.9 (52%) ZAU (0 to 11 cm) - 69.5 (260 %) 29.1 (256%)
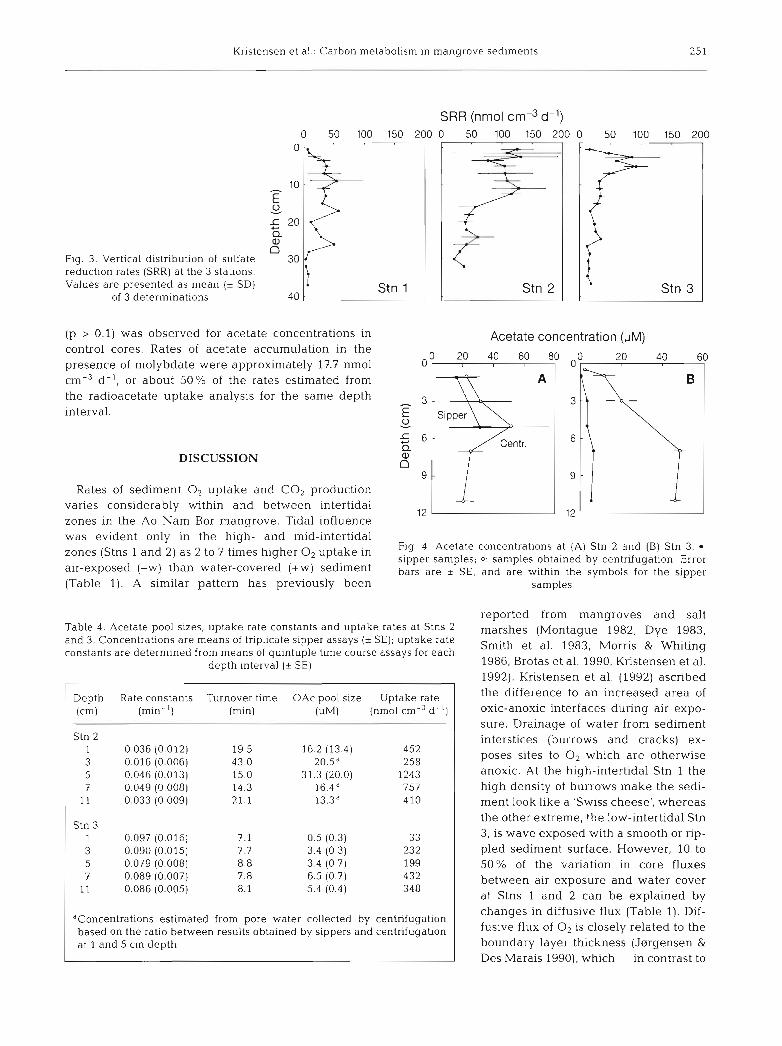
Kristensen et al.: Carbon metabolism In mangrove sedlments 25 1
Fig. 3. Vertical distribution of sulfate reduction rates (SRR) a t the 3 stations. Values are presented a s mean (* SD)
of 3 determinations
SRR (nmol cm-3 d-l) 0 50 100 150 200
7 Stn 2
(p > 0.1) was observed for acetate concentrations in Acetate concentration (FM) control cores. Rates of acetate accumulation in the presence of molybdate were approximately 17.7 nmol cm-3 d- ' , or about 50% of the rates estimated from the radioacetate uptake analysis for the same depth interval. E
DISCUSSION a, n
Rates of sediment O2 uptake and CO, production varies considerably within and between intertidal
12 zones in the Ao Nam Bor mangrove. Tidal influence
i I was evident only in the high- and mid-intertidal
Fig. 4. Acetate concentrations a t (A) Stn 2 and (B) Stn 3. 0 :
'Ones (Stns and 2, as to times higher O2 uptake in sipper samples; o: samples obtained by centrifugation. Error air-exposed (-W) than water-covered (+W) sediment bars are + SE, and are within the symbols for the sipper (Table 1). A similar pattern has previously been samples
Stn 2 1 3 5 7
11
Stn 3 1 3 5 7
11
reported from mangroves and salt Table 4 . Acetate pool sizes, uptake rate constants and uptake rates at Stns 2 ( ~ ~ ~ t ~ ~ ~ ~ 1982, 1983, and 3. Concentrations are means of triplicate sipper assays (* SE); uptake rate constants are determined from means of quintuple time course assays for each Smith et al. 1983, Morris & Whiting
depth interval (t SE) 1986, Brotas et al. 1990, Kristensen et al. 1992). Kristensen et al. (1992) ascribed
dConcentrations estimated from pore water collected by centrifugatlon based on the ratio between results obtained by sippers and centrifugahon at 1 and 5 cm depth
Depth Rate constants Turnover time OAc pool size Uptake rate (cm) (min-l) (min) ( p ~ ) (nmol cm-3 d-1)
interstices (burrows and cracks) ex- poses sites to O2 which are otherwise anoxic. At the high-intertidal Stn 1 the high density of burrows make the sedi- ment look like a 'Swiss cheese', whereas the other extreme, the low-intertidal Stn 3, is wave exposed with a smooth or rip- pled sediment surface. However, 10 to 50% of the variation in core fluxes between air exposure and water cover at Stns 1 and 2 can be explained by
the difference to an increased area of oxic-anoxic interfaces during air expo- sure. Drainage of water from sediment
changes in diffusive flux (Table 1). Dif- fusive flux of O2 is closely related to the boundary layer thickness (Jargensen &
Des Marais 1990), which - in contrast to
252 Mar. Ecol. Prog. Ser. 109: 245-255, 1994
Time (h)
Fig. 5. Accumulation of acetate in intact subcores from Stn 3 incubated with (m) and without (0) sodium molybdate. Error
bars are i SE
the 0, profiles shown in Fig. 2 -is thinner in air- exposed than water-covered sediment. By relating measured and profile estimated rates of O2 uptake, the high-intertidal zone has a sediment-air contact zone 4 times larger than that of the low-intertidal zone, and 3 times larger than that of the mid-intertidal zone, which has a rough and irregular surface without crab burrows.
Detritus in mangrove sediments is usually of low quality for decomposers due to the high lignin and low nitrogen content (Benner & Hodson 1985, Kristensen 1990, Lee et al. 1990) as shown here by the observed high C:N ratios (20 to 33) and Rp values (0.52 to 0.75) (Fig. 1). The poor detritus quality may explain the generally low fluxes of O2 and CO2 in water-covered mangrove sediments compared to other coastal envi- ronments (Colijn & de Jonge 1984, King et al. 1985, Mackin & Swider 1989, Kristensen 1993). The large difference in total metabolic activity between the high- and mid-intertidal zones, which is inversely related to the bulk organic content of the sediments (Table 1, Fig. lA, B), cannot be explained by detritus quality alone, but is more likely a result of crab bioturbation (feeding and burrow construction). If the organic input (i.e. litter fall) is similar in these 2 zones, a 3 to 5 times stimulation of the decomposer community by crabs in the former zone (Stn 1) may evidently result in an over- all lower organic content relative to the latter (Stn 2; Fig. 1). Other studies have also shown that activities of burrowing animals can stimulate benthic metabolism and cause a reduction of organic matter burial in marine sediments (Aller & Yingst 1985, Kristensen 1988). The low fluxes at the low-intertidal Stn 3, how- ever, correspond to the poor quality (high C:N and Rp) and small size of the detritus pool compared to the other stations. A significant fraction of benthic meta- bolism in this vegetation-free zone may, however, be supported by the decay of a dynamic pool of benthic
microalgae as depicted by the relatively low C:N ratio close to the sediment surface. The upward diffusive flux of 02, driven by benthic primary production, is on a daily basis (assuming a 12 h light period) equivalent to the downward diffusive flux and about half of the core flux in darkness. Studies from other tidal flat areas have reported that the benthic community is largely supported by benthic microalgal primary production (Colijn & de Jonge 1984, Nowicki & Nixon 1985, Kris- tensen 1993). The role of benthic microalgae is less pronounced in the vegetated mid- and high-intertidal zones based on both chlorophyll a content and the upward diffusive O2 flux (3 to 15 % of diurnal uptake).
Sulfate reduction rates at Ao Nam Bor in January 1992 are comparable to those determined in the inter- tidal zone of a mangrove in Pakistan (Kristensen et al. 1992), but lower than those reported from most salt marshes (e.g. Skyring 1987) and tidal flats (e.g. Oen- ema 1990, M. H. Jensen unpubl.). The shape of the sulfate reduction profiles in Ao Nam Bor (Fig. 3) reflects the characteristics of each intertidal zone, e.g. vertical translocation of organic substrates due to sub- surface root growth (Stn 2) or downward transport by crab bioturbation (Stn 1) and wave action (Stn 3). The low rates and irregular variations observed with depth at the high-intertidal Stn 1 are in accordance with the oxidized and heterogeneous sediment appearance. Most benthic respiration in this zone must be sup- ported by electron acceptors other than SO,'- (e.g. 02, NO3; Mn4+, Fe3+), since sulfate reduction only could account for 11 % of the total diurnal CO2 release (Table 3). Sulfate reduction usually supports more than 50 % of the measured CO2 release in coastal sediments (Jsrgensen 1983, Mackin & Swider 1989). At the mid- intertidal Stn 2, live roots in the upper, active root zone (5 to 15 cm) apparently supplied sulfate reducers with labile substrates. The lower rates below indicate sub- strate limitation in a zone where dead and lignified roots dominate. Live roots are known to excrete labile DOC (Stanley et al. 1987, Capehart & Hackney 1989), whereas lignified vascular plant remains resist micro- bial decay (Crawford & Crawford 1976, Benner et al. 1984, Lee et al. 1990). On the tidal flat (Stn 3), sulfate reduction exhibited a depth profile typical for coastal marine sediments where organic matter is supplied from above (Berner 1980, Jnrgensen 1983). Peak rates within the upper 5 cm were followed by a rapid and exponential decrease to very low levels at 30 cm (in the coral sand). In the latter 2 intertidal zones (Stns 2 and 3), sulfate reduction was the most important respiration process, supporting around 90 % of the total diurnal CO2 release (Table 3), indicating that 0, and NO3- respiration, for example, was negligible.
Acetate is the most important carbon source for sulfate reducers in these sediments and its production
Kristensen et al.: Carbon metabolism In mangrove sediments
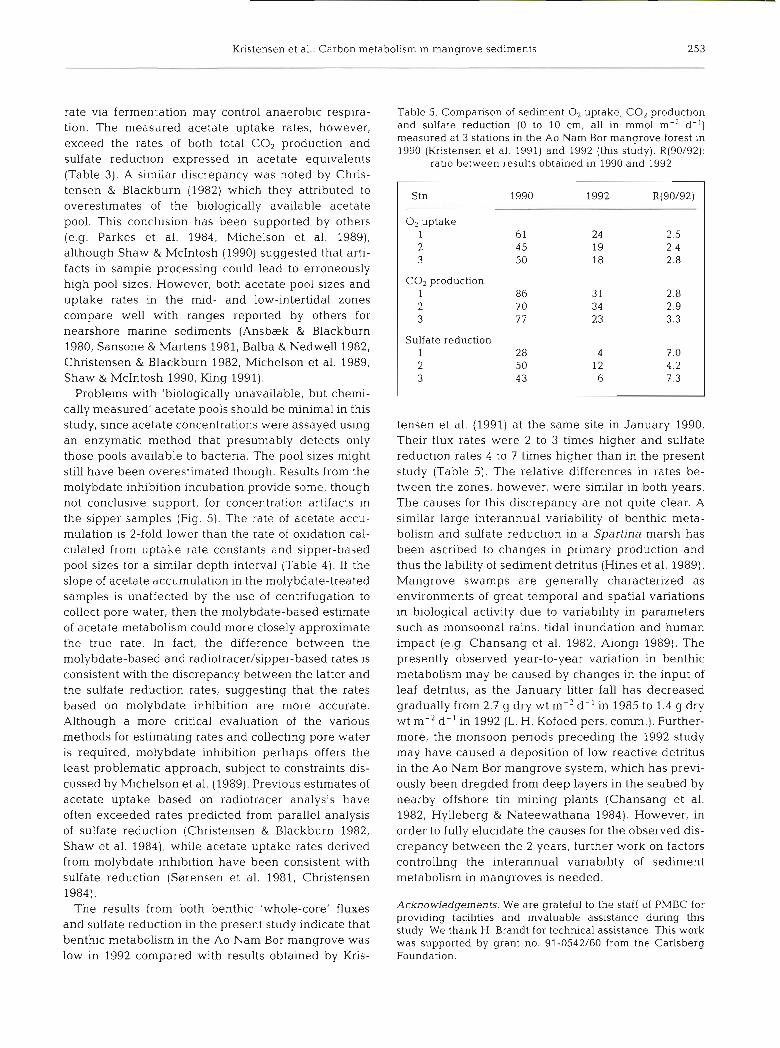
Stn 1990 1992 R(90/92)
O2 uptake 1 61 24 2.5 2 45 19 2.4 3 50 18 2.8
COz production 1 2.8 2 2.9 3 3.3
Sulfate reduction 1 28 4 7.0 2 50 12 4.2 3 43 6 7.3
rate via fermentation may control anaerobic respira- Table 5. Comparison of sediment O2 uptake, CO2 production tion. The measured acetate uptake rates, however, and ~ u l f a t e reduction (0 to 10 cm, all in mm01 m-2 d-'1
exceed the rates of both total C-.2 production and measured at 3 stations in the Ao Nam Bor mangrove forest in 1990 (Kristensen et al. 1991) and 1992 (this study). R(90/92):
sulfate reduction expressed in acetate equivalents ratio between results obtained in 1990 and 1992 (Table 3). A similar discrepancy was noted by Chris- tensen & Blackburn (1982) which they attributed to overestimates of the biologically available acetate pool. This conclusion has been supported by others (e.g. Parkes et al. 1984, Michelson et al. 1989), although Shaw & McIntosh (1990) suggested that arti- facts in sample processing could lead to erroneously high pool sizes. However, both acetate pool sizes and uptake rates in the mid- and low-intertidal zones compare well with ranges reported by others for nearshore marine sediments (Ansbzk & Blackburn 1980, Sansone & Martens 1981, Balba & Nedwell1982, Christensen & Blackburn 1982, Michelson et al. 1989, Shaw & McIntosh 1990, King 1991).
Problems with 'biologically unavailable, but chemi- cally measured' acetate pools should be minimal in this study, since acetate concentrations were assayed using tensen et al. (1991) at the same site in January 1990. an enzymatic method that presumably detects only Their flux rates were 2 to 3 times higher and sulfate those pools available to bacteria. The pool sizes might reduction rates 4 to 7 times higher than in the present still have been overestimated though. Results from the study (Table 5). The relative differences in rates be- molybdate inhibition incubation provide some, though tween the zones, however, were similar in both years. not conclusive support, for concentration artifacts in The causes for this discrepancy are not quite clear. A the sipper samples (Fig. 5). The rate of acetate accu- similar large interannual variability of benthic meta- mulation is 2-fold lower than the rate of oxidation cal- bolism and sulfate reduction in a Spartina marsh has culated from uptake rate constants and sipper-based been ascribed to changes in primary production and pool sizes for a similar depth interval (Table 4) . If the thus the lability of sediment detritus (Hines et al. 1989). slope of acetate accumulation in the molybdate-treated Mangrove swamps are generally characterized as samples is unaffected by the use of centrifugation to environments of great temporal and spatial variations collect pore water, then the molybdate-based estimate in biological activity due to variability in parameters of acetate metabolism could more closely approximate such as monsoonal rains, tidal inundation and human the true rate. In fact, the difference between the impact (e.g. Chansang et al. 1982, Alongi 1989). The molybdate-based and radiotracer/sipper-based rates is presently observed year-to-year variation in benthic consistent with the discrepancy between the latter and metabolism may be caused by changes in the input of the sulfate reduction rates, suggesting that the rates leaf detritus, as the January litter fall has decreased based on molybdate inhibition are more accurate. gradually from 2.7 g dry wt m-2 d - ' in 1985 to 1.4 g dry Although a more critical evaluation of the various wt m-2 d-' in 1992 (L. H. Kofoed pers. cornrn.). Further- methods for estimating rates and collecting pore water more, the monsoon periods preceding the 1992 study is required, molybdate inhibition perhaps offers the may have caused a deposition of low reactive detritus least problematic approach, subject to constraints dis- in the Ao Nam Bor mangrove system, which has previ- cussed by Michelson et al. (1989). Previous estimates of ously been dregded from deep layers in the seabed by acetate uptake based on radiotracer analysis have nearby offshore tin mining plants (Chansang et al. often exceeded rates predicted from parallel analysis 1982, Hylleberg & Nateewathana 1984). However, in of sulfate reduction (Chnstensen & Blackburn 1982, order to fully elucidate the causes for the observed dis- Shaw et al. 1984), while acetate uptake rates derived crepancy between the 2 years, further work on factors from molybdate inhibition have been consistent with controlling the interannual variability of sediment sulfate reduction (Serrensen et al. 1981, Christensen metabolism in mangroves is needed. 1984).
~h~ results from both benthic ~ ~ h ~ l ~ - ~ ~ ~ ~ ~ fluxes Acknowledgements. We are grateful to the staff of PMBC for providing facilities and invaluable assistance during this
and "lfate reduction in the present indicate that study. We thank H, Brandt for technical assistance, This work benthic metabolism in the *o Nam Bar mangrove was was supported by grant no. 91-0542/60 from the Carlsberg low in 1992 compared with results obtained by Kris- Foundation.
254 Mar. Ecol. Prog. Ser. 109: 245-255, 1994
LITERATURE CITED
Aller, R. C., Yingst, J . Y (1985). Effects of the marine deposit- feeders Heteromastus filiforrnis, Macoma balthica and TeUina texana on averaged sedimentary solute transport, reaction rates and microbial distribution. J . mar. Res. 43: 615-645
Alongi, D. M. (1989). The role of soft-bottom benthic commu- nities in tropical mangrove and coral reef ecosystems. Rev. aquat. Sci. 1: 243-280
Ansbeek, J., Blackburn, T. H. (1980). A method for the analy- sis of acetate turnover in a coastal marine sediment. Mlcrob. Ecol. 5: 253-264
Balba, M. T., Nedwell, D. B. (1982). Microbial metabolism of acetate, propionate and butyrate in anoxic sediment from the Colne Point saltmarsh, Essex, U.K. J. gen. Microbiol. 128: 1415-1422
Benner, R., Hodson, R. E. (1985). Microbial degradation of the leachable and lignocellulosic components of leaves and wood from Rhjzophora mangle in a troplcal mangrove swamp. Mar. Ecol. Prog. Ser. 23: 221-230
Benner, R., Maccubbin, A. E., Hodson, R. E. (1984). Prepara- tion, characterization and microbial degradation of specifi- cally radiolabeled ['4C]lignocelluloses from manne and freshwater macrophytes. Appl. environ. Microb~ol. 47: 381-389
Berner, R. A. (1980). Early diagenesis. Princeton University Press, Princeton, NJ
Broecker, W. S., Peng, T.-H. (1974). Gas exchange rates between air and sea. Tellus 26: 21-35
Brotas, V., Arnorirn-Ferrelra, A., Vale, C., Catarino, F. (1990). Oxygen proflles in intertidal sedunents of Ria Formosa (S. Portugal). Hydrobiologia 207: 123- 129
Capehart, A. A.. Hackney. C. T (1989). The potential role of roots and rhizomes in structuring salt-marsh benthic communities. Estuaries 12: 119-122
Chansang, H., Poovachiranon, S., Wungboonkong, C. (1982). Human impact on a mangrove forest on Phuket Island, Thailand. Biotrop. Spec. Publ. 17: 45-54
Christensen, D. (1984). Determination of substrates ox~dized by sulfate reduction in intact cores of marine sediments. Lirnnol. Oceanogr. 29: 189-192
Christensen, D., Blackburn, T. H. (1982). Turnover of I4C- labelled acetate in marine sediments. Mar. Biol. 71: 113-119
Colijn, F., de Jonge, V. N. (1984). Primary production of microphytobenthos in the Ems-Dollard estuary. Mar. Ecol. Prog. Ser. 14: 185-196
Crawford. D. L., Crawford. R. L. (1976). Microbial degrada- tion of lignocellulose: the lignin component. Appl. envi- ron. Microbiol. 31: 714-717
Dye, A. H. (1983). Oxygen consumption by sediments in a Southern African mangrove swamp. Estuar. coast. Shelf Sci. 17: 473-478
Enriquez, S., Duarte, C. M., Sand-Jensen, K. (1993). Patterns in decomposition rates among photosynthetic organisms: the importance of detritus C:N:P content. Oecologia 94: 457-471
Flores-Verdugo, F. J., Day, J. W., Briseno-Duenas, R. (1987). Structure, litter fall, decomposition, and detritus dynamics of mangroves in a Mexican coastal lagoon with an ephemeral inlet. Mar. Ecol. Prog. Ser. 35: 83-90
Fossing, H., Jerrgensen, B. B. (1989). Measurement of bac- terial sulfate-reduction in sediments: evaluation of a single-step chromium reduction method. Biogeochemistry 8: 205-222
Frith, D. W., Tantanasiriwong, R., Bhatia, 0. (1976). Zona-
tion and abundance of macrofauna on a mangrove shore. Phuket Island. Res. Bull. Phuket mar. Biol. Cent. 6: 1-37
Gonzalez-Farias, F., Mee, L. D. (1988). Effect of mangrove humlc-like substances on biodegradation rate of detntus. J . exp. mar. Biol. Ecol. 119: 1-13
Helder, W., Bakker, J. F. (1985). Shipboard comparison of micro- and minielectrodes for measuring oxygen distribu- tion ~n marine sedirnents. Limnol. Oceanogr. 30: 1106-1109
Hines, M. E., Knollmeyer, S. L., Tugel, J. B. (1989). Sulfate reduction and other sedimentary biogeochernistry in a northern New England salt marsh. Limnol. Oceanogr. 34: 578-590
Howes, B. L., Dacey, J . W. H., Wakeham, S. G. (1985). Effects of sampling technique on measurements of pore water constituents in salt marsh sediments. Limnol. Oceanogr. 30: 221-227
Hylleberg, J., Nateewathana, A. (1984). Response of poly- chaete families to monsoon and offshore mining - asso- ciated sediment disturbance. In: Hutchings, P. A. (ed.) Proc. 1st int. Polychaete Conf. The Linnean Soc., Sydney, p. 279-291
Jsrgensen, B. B. (1978). A comparison of methods for the quantification of bacterial sulfate reduction in coastal marine sediments. Geomicrobiol. J. 1: 11-27
Jerrgensen. B. B. (1983). Processes at the sediment-water interface. In: Bolin, B., Cook, R. B. (eds.) The major bio- geochemical cycles and their ~nteractions. John Wiley, Chichester, p. 477-509
Jsrgensen, B. B., Des Marais, D. J. (1990). The diffusive boundary layer of sediments: oxygen microgradients over a microbial mat. Limnol. Oceanogr. 35: 1343-1355
King, G. M. (1988). Patterns of sulfate reduction and the sulfur cycle in a South Carolina salt marsh. Limnol. Oceanogr. 33: 376-390
k n g , G. M. (1991). Measurement of acetate concentralons in marine pore waters by using an enzymatic approach. Appl. environ. Microbiol. 57: 3476-3481
brig, G. M, , Howes, B. L., Dacey, J . W. H. (1985). Short-term endproducts of sulfate reduction in a salt marsh: formahon of acid volatile sulfides, elemental sulfur, and pyrite. Geochim. Cosmochim. Acta 49: 1561-1566
Komiyama, A., Ogino, K., Aksornkoae, S., Sabhasri, S. (1987). Root biomass of a mangrove forest in southern Thailand. 1. Estimation by the trench method and the zonal structure of root biomass. J. Trop. Ecol. 3: 97-108
Kristensen, E. (1988). Benthic fauna and b~ogeochemical processes in marine sediments: microbial activities and fluxes. In: Blackburn, T. H., Serensen, J. (eds.) Nitrogen cycling in coastal manne environments. John Wiley, Chichester, p. 275-299
Kristensen. E. (1990). Characterization of biogenic organic matter by stepwise thermogravimetry (STG). Biogeo- chemistry 9: 135-159
Kristensen, E. (1993). Seasonal variat~on in benthic comrnu- nity metabolism and nitrogen dynamics in a shallow, organic-poor Danish lagoon. Estuar. coast. Shelf Sci. 37: 565-586
Kristensen, E., Devol, A. H., Ahmed, S. I., Saleem, M. (1992). Preliminary study of benthic metabolism and sulfate reduction in a mangrove swamp of the Indus Delta, Pakistan. Mar. Ecol. Prog. Ser. 90: 287-297
Kristensen, E., Holmer, M., Bussarawit, N. (1991). Benthic metabolism and sulfate reduction in a southeast Asian mangrove swamp. Mar. Ecol. Prog. Ser. 73: 93-103
Lee, K.-H., Moran, M. A., Benner, R., Hodson, R. E. (1990). Influence of soluble components of red mangrove (Rhizo-
Kristensen et al.: Carbon metabolism in mangrove sediments 255
phora mangle) leaves on microbial decomposition of struc- tural (Lignocellulosic) leaf components in seawater. Bull. mar. Sci. 46: 374-386
Lugo, A. E., Snedaker, S. C. (1974). The ecology of man- groves. A. Rev. Ecol. Syst. 5: 39-64
Mackin, J E., Swider, K. T. (1989). Organic matter decompo- sition pathways and oxygen consumption in coastal marine sediments. J . mar. Res. 47: 681-716
Michelson, A. R. , Jacobsen, M. E. , Scranton, M. I . , Mackin, J. E. (1989). Modeling the distnbut~on of acetate in anoxic estuarine sediments. Limnol. Oceanogr. 34: 747-757
Montague, C. L. (1982). The influence of fiddler crab burrows and burrowing on metabolic processes in salt marsh sedi- ments. In: Kennedy, V. S. (ed.) Estuarine comparisons. Academic Press, New York, p. 283-301
Morris, J . T., Whiting, G. J. (1986). Emission of gaseous carbon dioxide from salt-marsh sedirnents and its relation to other carbon losses. Estuaries 9: 9-19
Nedwell, D. B., Abram, J . W. (1978). Bacterial sulphate reduc- tlon in relation to sulphur geochemistry in two contrasting areas of saltmarsh sediment. Estuar. coast. Shelf Sci. 6: 341-351
Nowicki. B. L., Nixon, S. W. (1985). Benthic community metabolism in a coastal lagoon ecosystem. Mar. Ecol. Prog. Ser. 22: 21-30
Oenema. 0. (1990). Sulfate reduction in fine-grained sedi- ments in the Eastern Scheldt, southwest Netherlands. Bio- geochemistry 9: 53-74
Parkes, R. .I., Taylor, J., Jorck-Ramberg, D. (1984). Demon- stration, using Desulfobacter spp., of two pools of acetate with different biological availabihties in marine pore water. Mar. Biol. 83: 271-276
Parsons, T. R., Maita, Y., Lalli, C. M. (1984). A manual of chemical and biological methods for seawater analysis. Pergamon, Oxford
This article was submitted to the editor
Robertson, A. I., Daniel, P. A. (1989). The influence of crabs on litter processing in high intertidal mangrove forests in tropical Australia. Oecologia 78: 191-198
Sansone, F. J., Martens, C. S. (1981). Determination of volatile fatty acid turnover rates in organic-rich marine sediments. Mar. Chem. 10: 233-247
Sawyer, T. E., k n g , G. M. (1993). Glucose uptake and end product formation in an intertidal marine sediment. Appl. environ. Microbiol. 59: 120-128
Shaw, D. G., Alperin, M. J . , Reeburgh. W. S., McIntosh, D J. (1984). Biogeochemistry of acetate in anoxic sediments of Skan Bay, Alaska. Geochim. Cosmochim. Acta 48: 1819-1825
Shaw. D. G., McIntosh, D. J. (1990). Acetate in recent anoxic sediments: direct and indirect measurements of concen- tration and turnover rates. Estuar. coast. Shelf Sci. 31: 775-788
Skynng, G. W. (1987). Sulfate reduction in coastal ecosys- tems. Geomicrobiol. J . 5: 295-373
Smith, C. J. , DeLaune, R. D. , Patnck, W. H. (1983). Carbon dioxide emission and carbon accumulation in coastal wetlands. Estuar. coast. Shelf Sci. 17: 21-29
Sarensen, J., Christensen, D., Jergensen, B. B. (1981). Volatile fatty acids and hydrogen substrates for sulfate-reducing bacteria in anaerobic marine sediment. Appl. environ. Microbiol. 42: 5-11
Stanley, S. O., Boto, K. G., Alongi, D. M., Gillan, F. T. (1987). Composition and bacterial utilization of free amino acids in tropical mangrove sediments. Mar. Chem. 22: 13-30
Tahng, F. (1973). The application of some electrochemical methods to the measurement of photosynthesis and respi- ration in fresh water. Freshwat. Biol. 3: 335-362
Wattayakorn, G., Wolanski, E., Kjerfve, B. (1990). Mixing, trapping and outwelling in the Klong Ngao mangrove swamp, Thailand. Estuar. coast. Shelf Sci. 31: 667-688
Manuscript first received: September 3, 1993 Revised version accepted: March 30, 1994