sulphur market outlook - fertilizer industry round table | 2016 - sulphur...sulphur market outlook...
TRANSCRIPT
Sulphur Market Outlook
Meena ChauhanHead of Sulphur and Sulphuric AcidInteger Research
The Fertilizer Institute Outlook and Technology conferenceFort Lauderdale, Florida
www.integer‐research.com
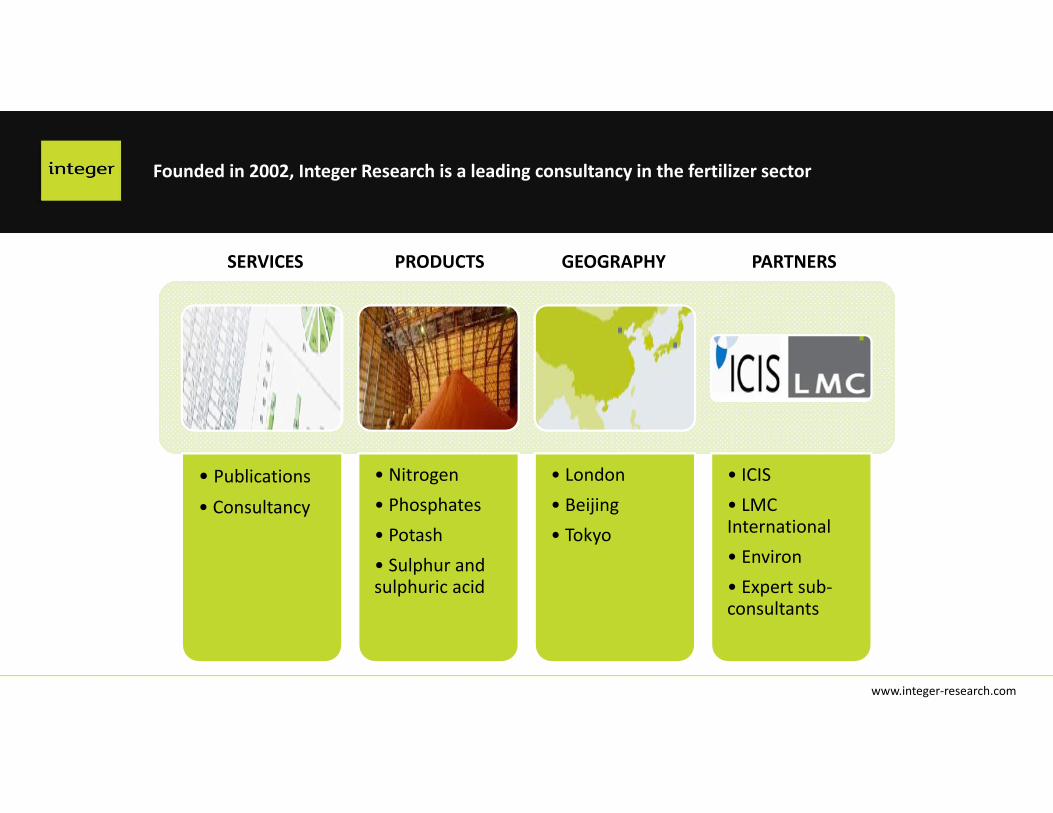
Founded in 2002, Integer Research is a leading consultancy in the fertilizer sector
• Publications• Consultancy
• Nitrogen• Phosphates• Potash• Sulphur and sulphuric acid
• London• Beijing• Tokyo
• ICIS • LMC International• Environ• Expert sub‐consultants
SERVICES PRODUCTS GEOGRAPHY PARTNERS
Sulphur market overview
www.integer‐research.com
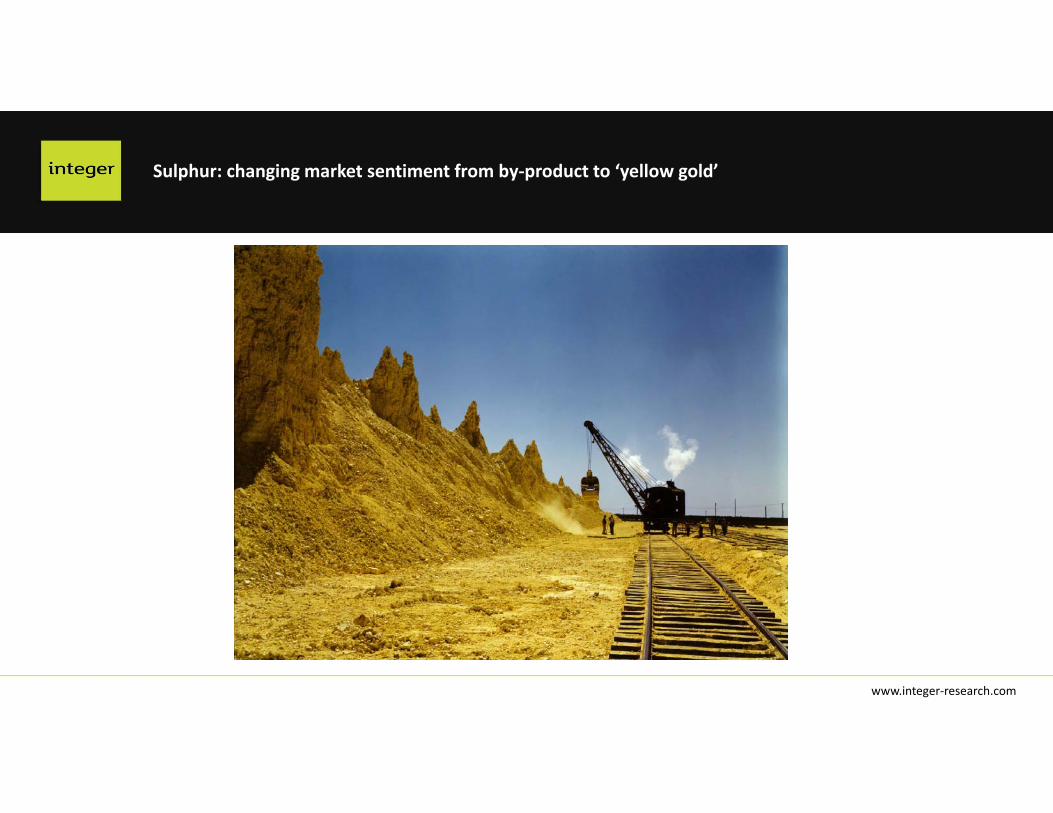
Sulphur: changing market sentiment from by‐product to ‘yellow gold’
www.integer‐research.com
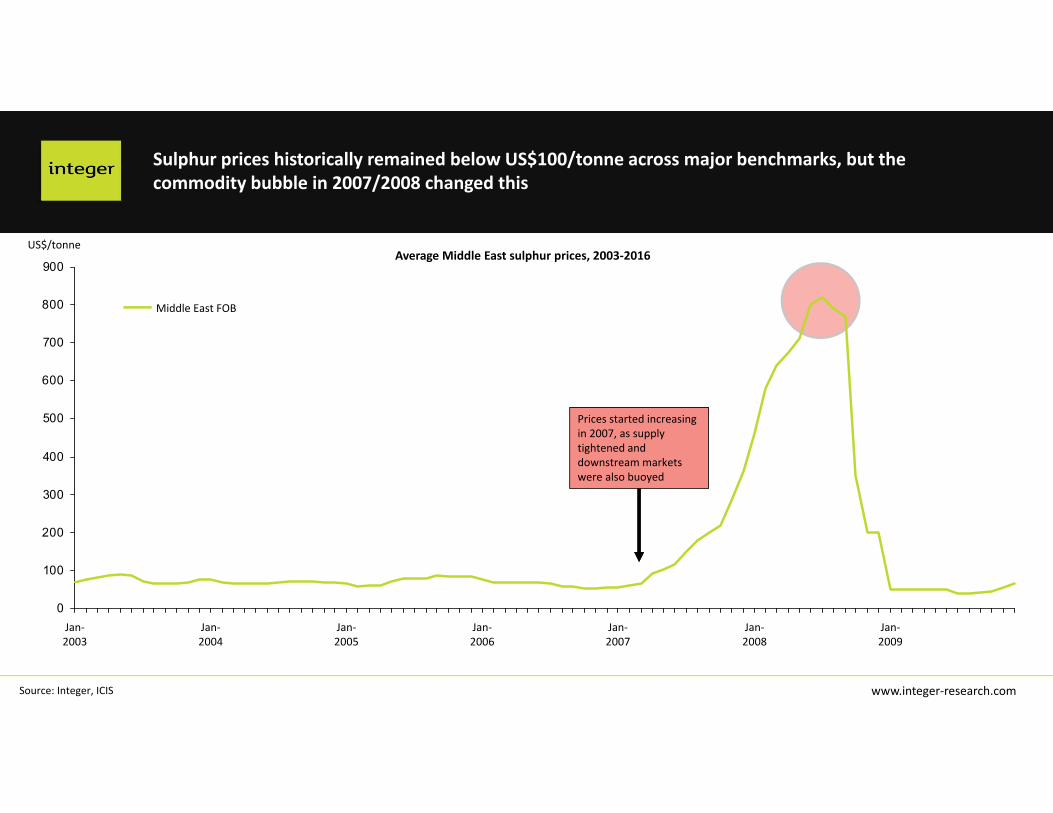
Sulphur prices historically remained below US$100/tonne across major benchmarks, but the commodity bubble in 2007/2008 changed this
0
100
200
300
400
500
600
700
800
900
Jan‐2007
Jan‐2006
Jan‐2005
Jan‐2004
Jan‐2003
Jan‐2008
Jan‐2009
Middle East FOB
Prices started increasing in 2007, as supply tightened and downstream markets were also buoyed
Average Middle East sulphur prices, 2003‐2016
Source: Integer, ICIS
US$/tonne
www.integer‐research.com
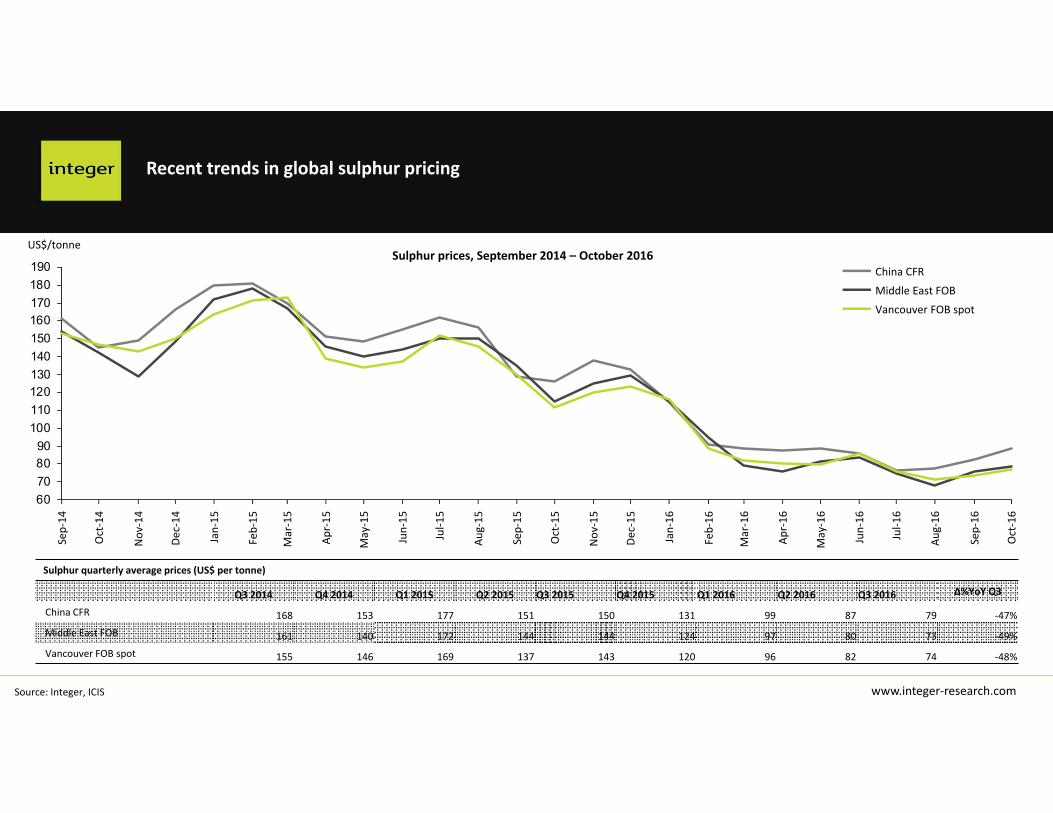
Sulphur prices, September 2014 – October 2016
Sulphur quarterly average prices (US$ per tonne)
Q3 2014 Q4 2014 Q1 2015 Q2 2015 Q3 2015 Q4 2015 Q1 2016 Q2 2016 Q3 2016 Δ%YoY Q3
China CFR 168 153 177 151 150 131 99 87 79 ‐47%
Middle East FOB 161 140 172 144 144 124 97 80 73 ‐49%
Vancouver FOB spot 155 146 169 137 143 120 96 82 74 ‐48%
US$/tonne
Source: Integer, ICIS
Recent trends in global sulphur pricing
60708090
100110120130140150160170180190
Oct‐15
Sep‐15
Aug‐15
Jul‐1
5
Jun‐15
Oct‐16
May‐15
Apr‐15
Mar‐15
Jan‐15
Dec‐14
Nov
‐14
Oct‐14
Sep‐14
Feb‐15
Sep‐16
Aug‐16
Jul‐1
6
Jun‐16
May‐16
Apr‐16
Mar‐16
Feb‐16
Jan‐16
Dec‐15
Nov
‐15
Vancouver FOB spot
Middle East FOB
China CFR
www.integer‐research.comSource: Integer
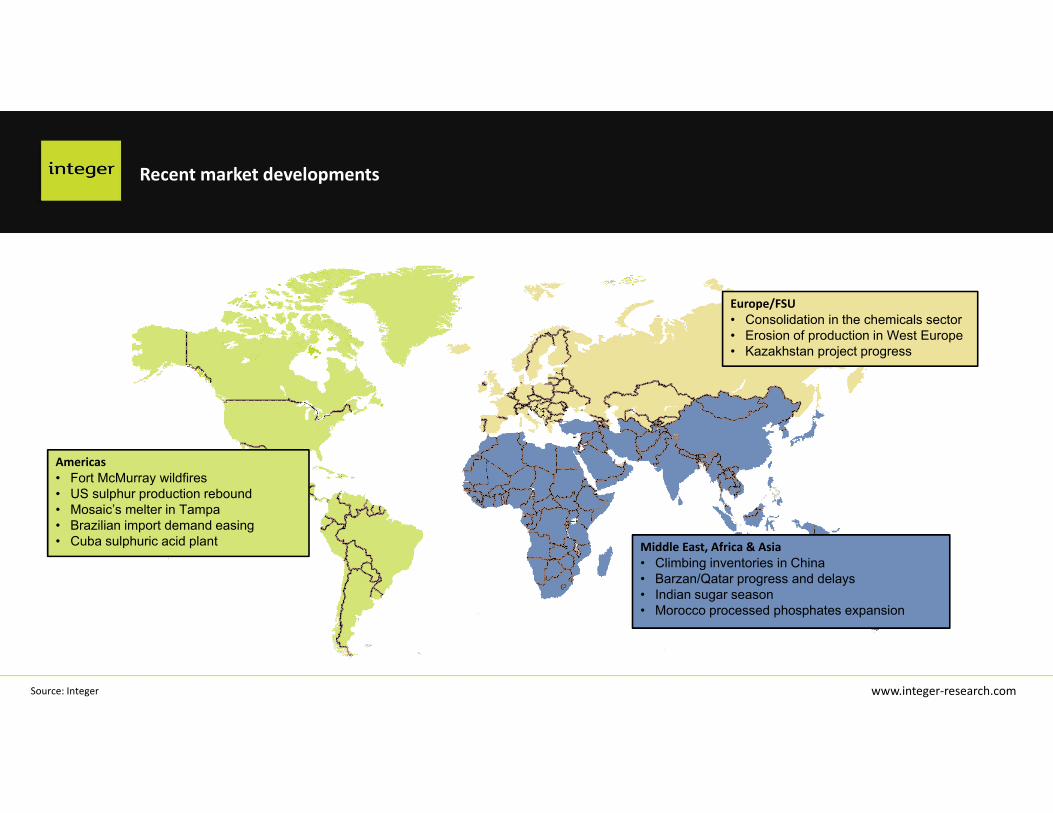
Recent market developments
Europe/FSU• Consolidation in the chemicals sector• Erosion of production in West Europe• Kazakhstan project progress
Americas• Fort McMurray wildfires• US sulphur production rebound• Mosaic’s melter in Tampa• Brazilian import demand easing• Cuba sulphuric acid plant Middle East, Africa & Asia
• Climbing inventories in China• Barzan/Qatar progress and delays• Indian sugar season• Morocco processed phosphates expansion
Supply
www.integer‐research.com
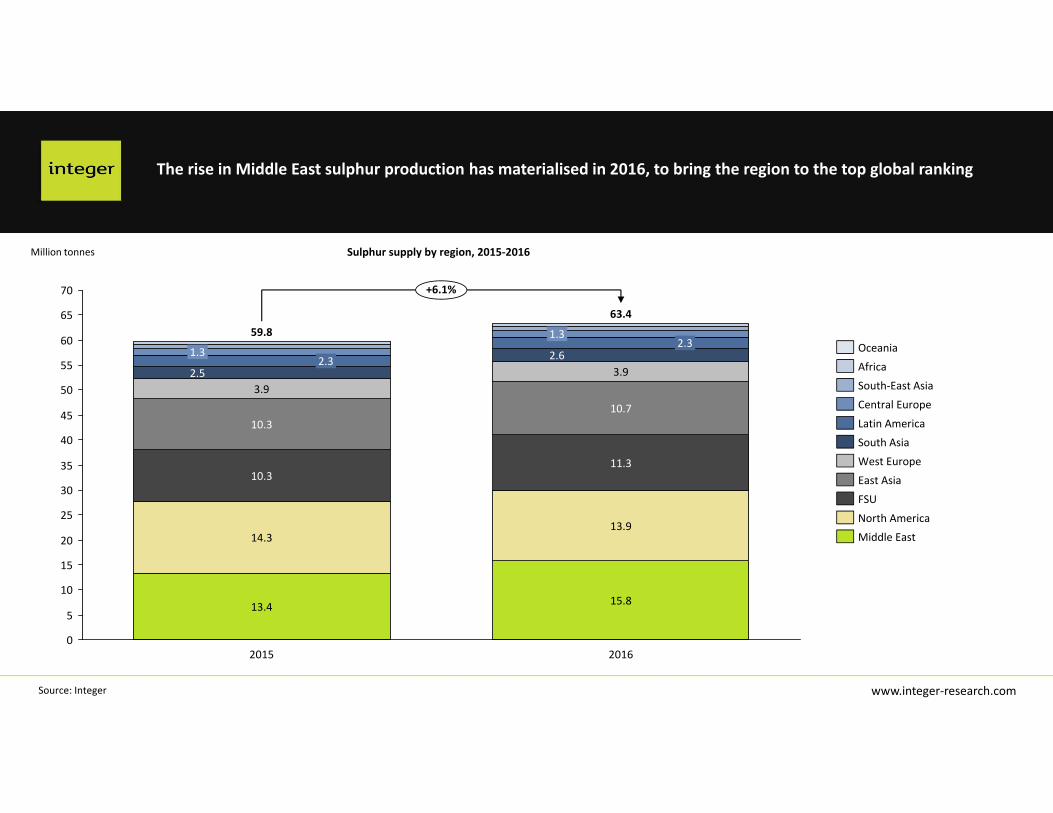
Million tonnes
Source: Integer
The rise in Middle East sulphur production has materialised in 2016, to bring the region to the top global ranking
70
45
60
55
50
40
35
30
25
20
15
10
5
0
65
2.5
13.9
1.3
+6.1%
2016
63.4
2.3
15.8
11.3
10.7
3.92.6
2.31.3
2015
14.3
59.8
13.4
10.3
10.3
3.9 South‐East Asia
Oceania
Central Europe
Africa
East Asia
FSU
West Europe
South Asia
North America
Middle East
Latin America
Sulphur supply by region, 2015‐2016
www.integer‐research.com
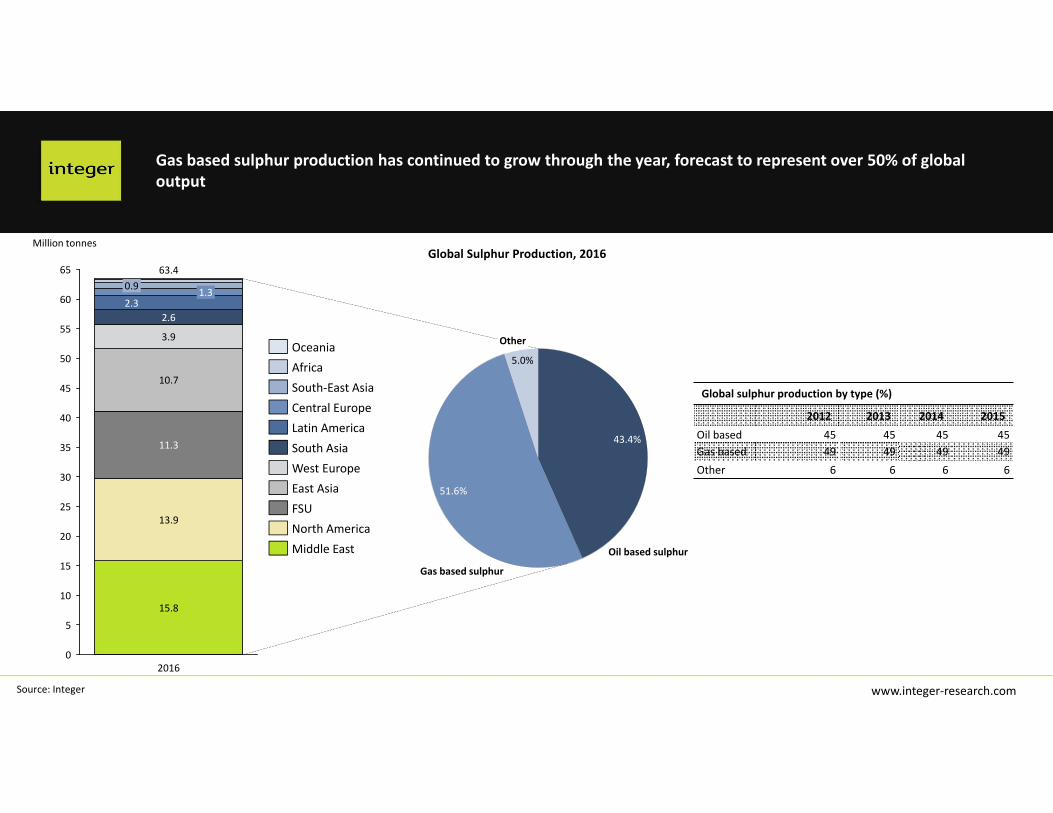
Million tonnes
Source: Integer
Gas based sulphur production has continued to grow through the year, forecast to represent over 50% of global output
65
60
55
50
45
40
35
30
25
20
15
10
5
0
63.4
2016
15.8
13.9
11.3
10.7
3.9
2.62.3
1.30.9
Global Sulphur Production, 2016
Other
5.0%
Gas based sulphur
51.6%
Oil based sulphur
43.4%
Global sulphur production by type (%)
2012 2013 2014 2015Oil based 45 45 45 45Gas based 49 49 49 49Other 6 6 6 6
North AmericaMiddle East
FSUEast AsiaWest EuropeSouth AsiaLatin AmericaCentral EuropeSouth‐East AsiaAfricaOceania
www.integer‐research.com
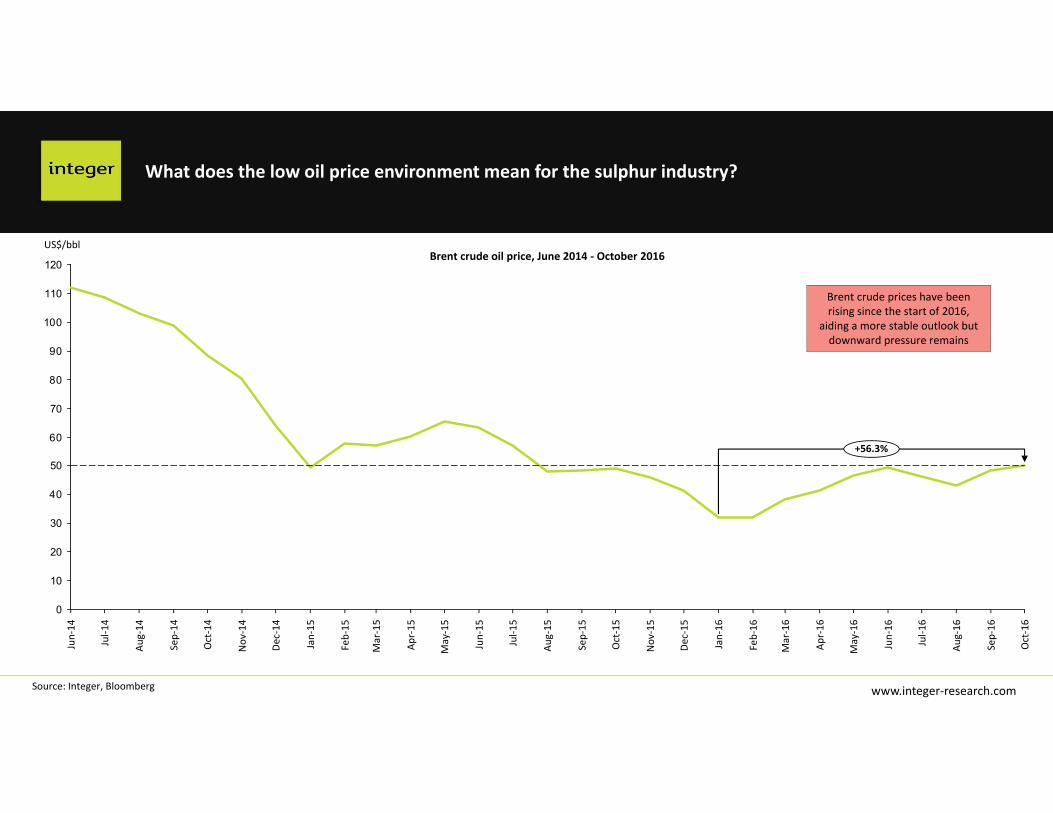
US$/bbl
What does the low oil price environment mean for the sulphur industry?
0
10
20
30
40
50
60
70
80
90
100
110
120
Jan‐16
Dec‐15
Apr‐16
Oct‐16
Sep‐16
Aug‐16
Jul‐1
6
Jun‐16
May‐16
Mar‐16
Feb‐16
Oct‐14
Sep‐14
Aug‐14
Jul‐1
4
Jun‐14
Nov
‐15
Oct‐15
Sep‐15
Aug‐15
Jul‐1
5
Jun‐15
May‐15
Apr‐15
Mar‐15
Feb‐15
Jan‐15
Dec‐14
Nov
‐14
+56.3%
Brent crude oil price, June 2014 ‐ October 2016
Source: Integer, Bloomberg
Brent crude prices have been rising since the start of 2016,
aiding a more stable outlook but downward pressure remains
www.integer‐research.com
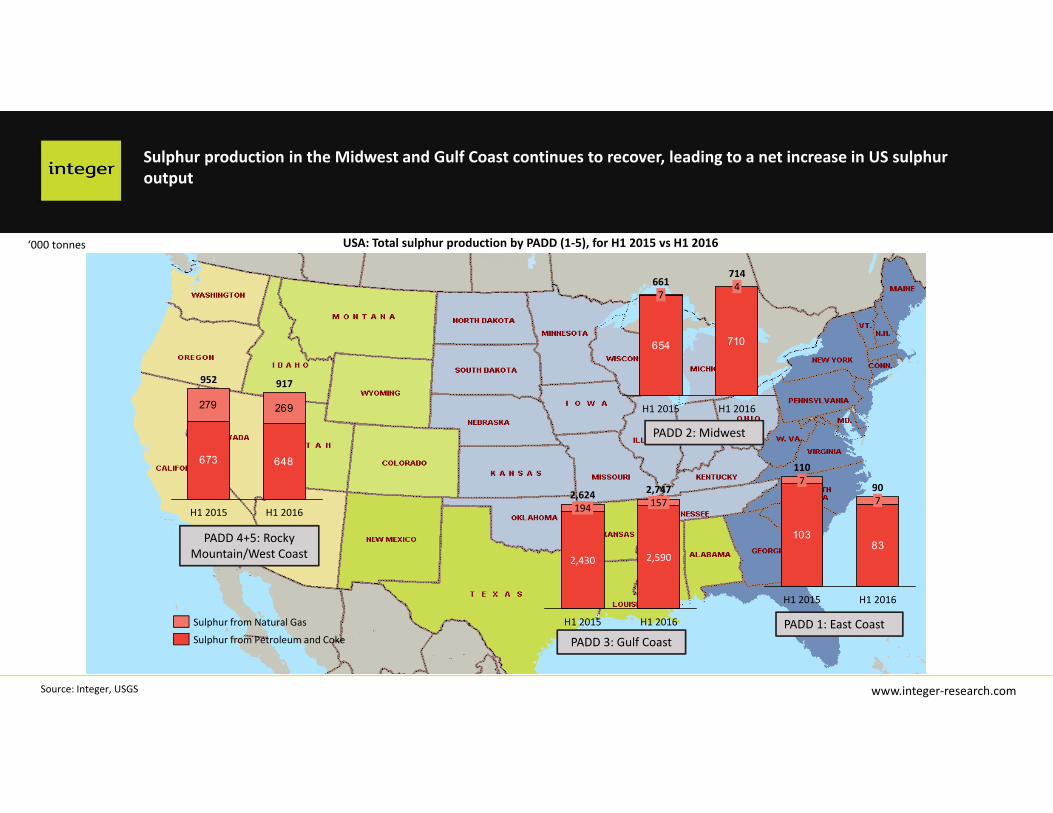
USA: Total sulphur production by PADD (1‐5), for H1 2015 vs H1 2016
Sulphur production in the Midwest and Gulf Coast continues to recover, leading to a net increase in US sulphur output
10383
H1 2016
7
1107
H1 2015
90
Sulphur from Petroleum and Coke
Sulphur from Natural Gas
654 710
H1 2016
6617
H1 2015
7144
H1 2016
1572,624
2,430
194
H1 2015
2,747
2,590
673 648
279 269
H1 2015
917952
H1 2016
Source: Integer, USGS
PADD 1: East Coast
PADD 2: Midwest
PADD 3: Gulf Coast
PADD 4+5: Rocky Mountain/West Coast
‘000 tonnes
www.integer‐research.com
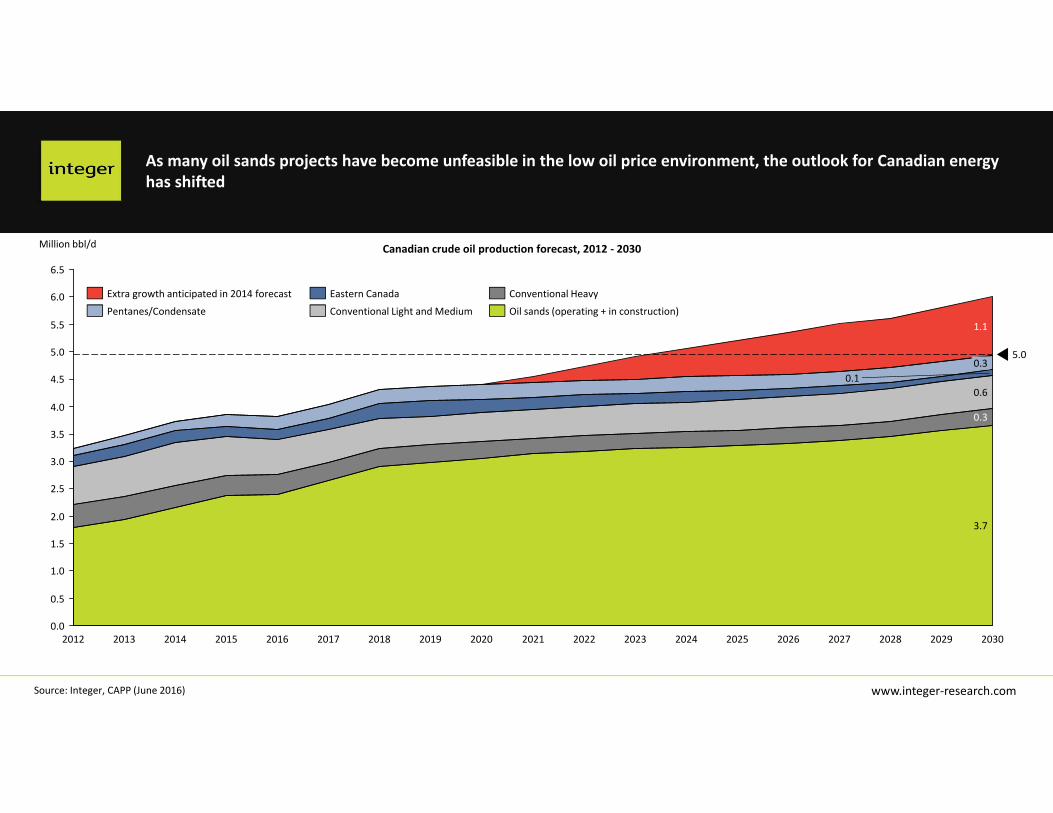
Million bbl/d
As many oil sands projects have become unfeasible in the low oil price environment, the outlook for Canadian energy has shifted
5.0
6.5
6.0
5.5
2.5
4.5
4.0
3.5
3.0
2.0
1.5
1.0
0.5
0.0
5.0
2030
3.7
0.3
0.60.1
0.3
1.1
202920282027202620252024202320222021202020192018201720162015201420132012
Pentanes/Condensate
Extra growth anticipated in 2014 forecast
Oil sands (operating + in construction)
Conventional Heavy
Conventional Light and Medium
Eastern Canada
Source: Integer, CAPP (June 2016)
Canadian crude oil production forecast, 2012 ‐ 2030
www.integer‐research.com
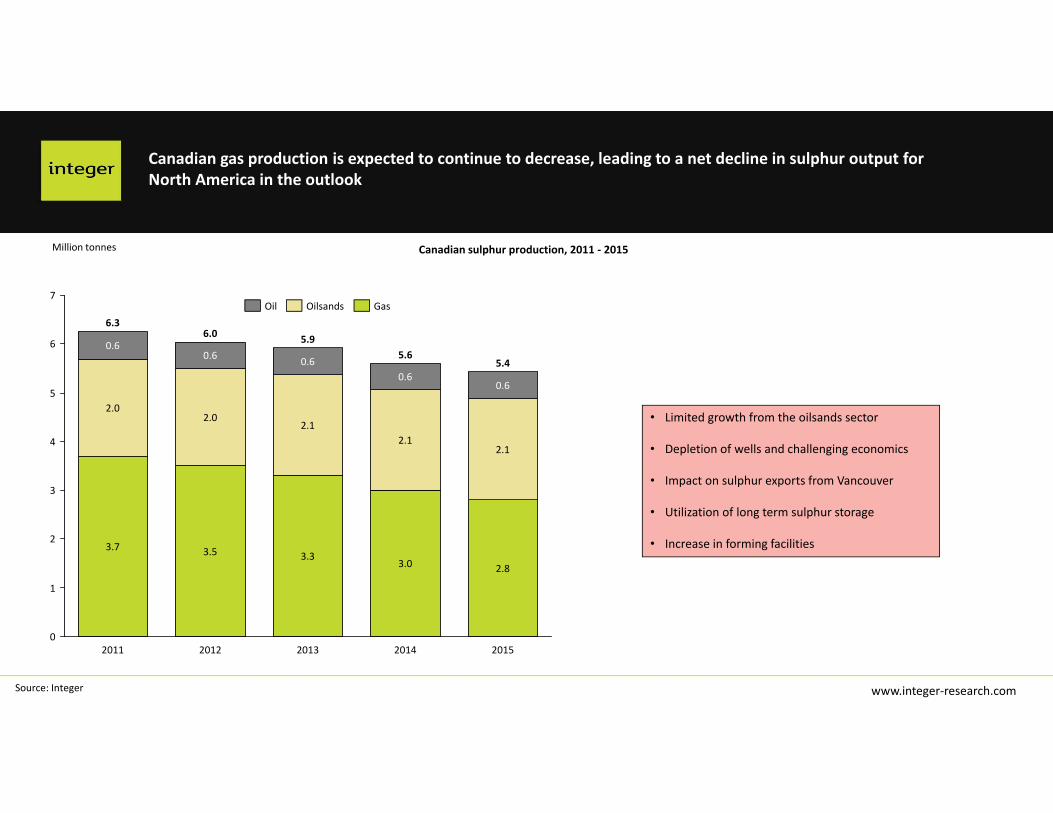
Million tonnes
Canadian gas production is expected to continue to decrease, leading to a net decline in sulphur output for North America in the outlook
0
7
6
5
4
3
2
1
5.6
3.0
2.1
0.6
2013
5.9
3.3
6.3
2.1
2.0
0.6
0.6
2014
2.0
0.6
2011
2.1
0.6 5.4
2.8
2015
6.0
3.5
2012
3.7
Oilsands GasOil
Source: Integer
Canadian sulphur production, 2011 ‐ 2015
• Limited growth from the oilsands sector
• Depletion of wells and challenging economics
• Impact on sulphur exports from Vancouver
• Utilization of long term sulphur storage
• Increase in forming facilities
Trade: changing dynamics
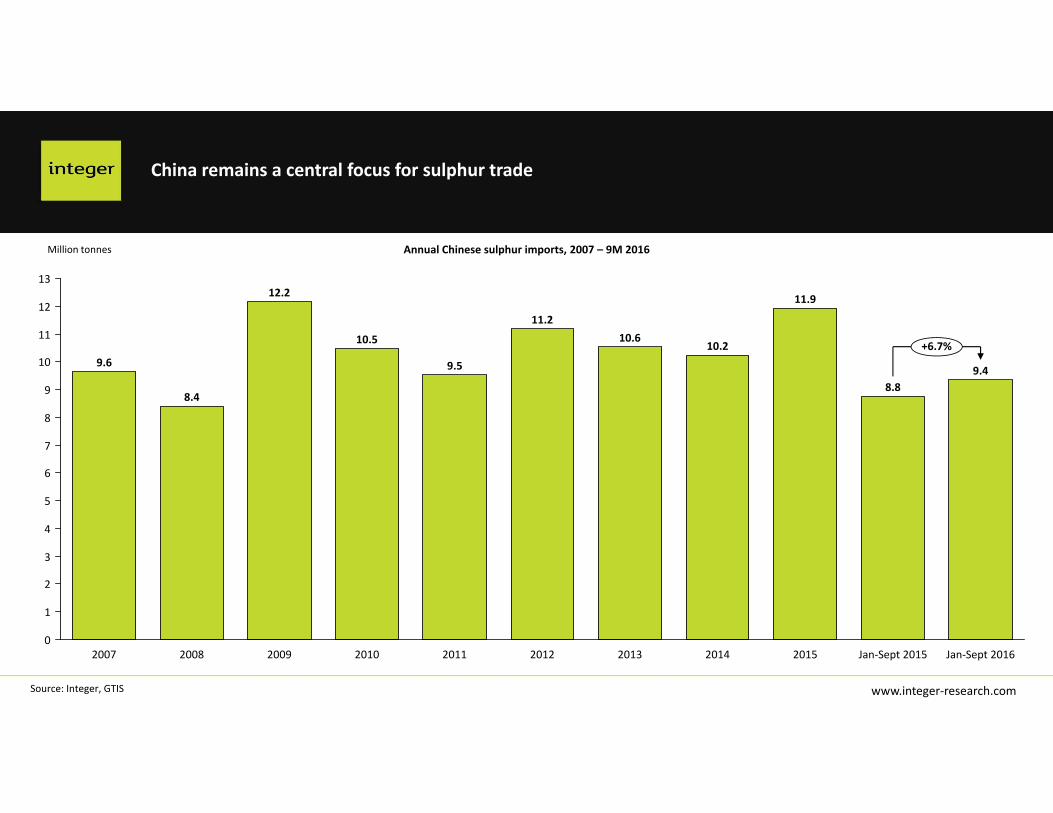
www.integer‐research.comSource: Integer, GTIS
China remains a central focus for sulphur trade
Million tonnes
10
8
9
12
1
0
11
13
7
6
5
4
3
2
2007 2008 2009
+6.7%9.6
12.2
Jan‐Sept 2016
9.5
2010
10.5 10.6
2012
11.2
2011
11.9
2014
10.2
2013
9.4
Jan‐Sept 2015
8.8
2015
8.4
Annual Chinese sulphur imports, 2007 – 9M 2016
www.integer‐research.comSource: Integer, GTIS
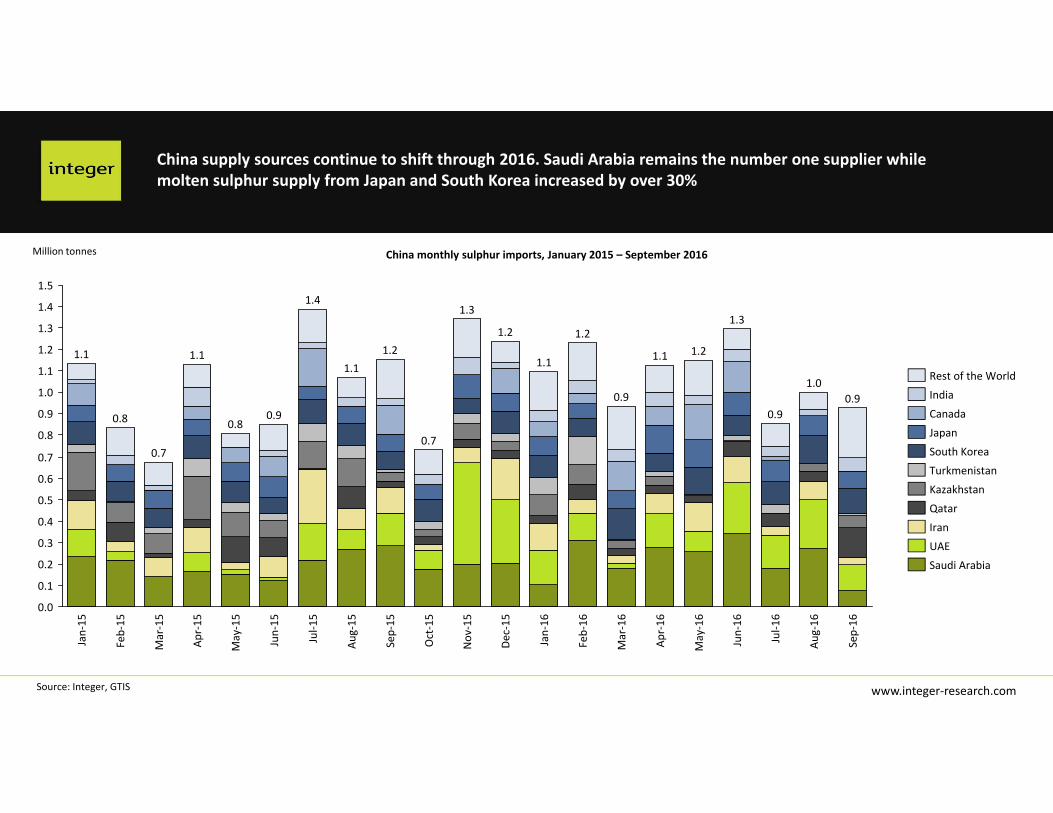
China supply sources continue to shift through 2016. Saudi Arabia remains the number one supplier while molten sulphur supply from Japan and South Korea increased by over 30%
Million tonnes
0.1
0.6
0.9
1.5
0.2
0.8
0.0
1.2
0.3
1.3
1.0
0.4
1.1
0.5
1.4
0.7
Aug‐16
1.0
Jul‐1
6
0.9
Jun‐16
Sep‐16
Aug‐15
Jan‐16
Dec‐15
1.2
0.9
Apr‐16
1.1
1.3Jul‐1
51.3
Mar‐16
Feb‐16
1.1
1.21.2
May‐16
1.2
Nov
‐15
Sep‐15
1.4
0.9
0.7
1.1
0.7
0.8
May‐15
0.8
1.1
Oct‐15
Feb‐15
Jan‐15
Mar‐15
1.1
Apr‐15
0.9
Jun‐15
Iran
Qatar
Saudi Arabia
UAE
Rest of the World
Canada
Turkmenistan
India
Kazakhstan
South Korea
Japan
China monthly sulphur imports, January 2015 – September 2016
www.integer‐research.comSource: Integer, GTIS
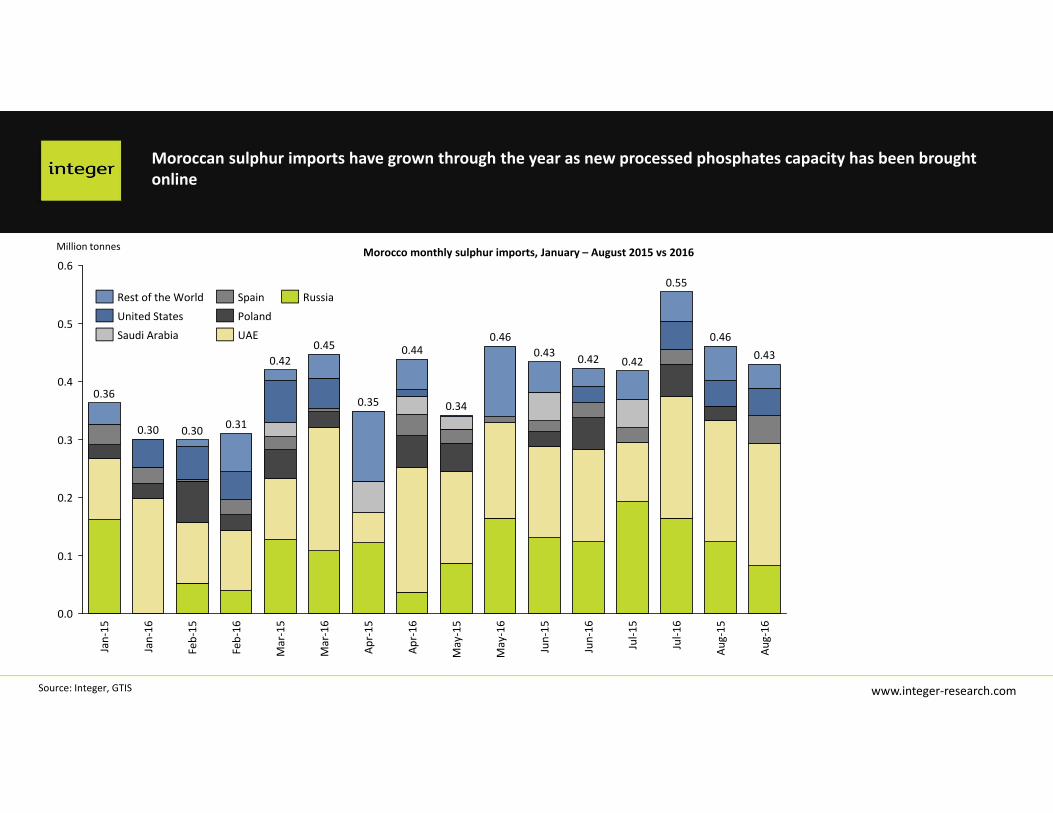
Moroccan sulphur imports have grown through the year as new processed phosphates capacity has been brought online
Million tonnes
0.4
0.1
0.6
0.5
0.3
0.2
0.0
Jan‐16
0.30
Jan‐15
0.36
Jul‐1
5
Jul‐1
6
Aug‐16
0.55
0.42 0.430.46
Aug‐15
Feb‐16
0.31
Feb‐15
0.34Ap
r‐16
0.44Ap
r‐15
0.35
Mar‐16
0.45
Mar‐15
0.42
0.30
Jun‐16
0.42
Jun‐15
0.43
May‐16
0.46
May‐15
Spain
Poland
Russia
United States
UAESaudi Arabia
Rest of the World
Morocco monthly sulphur imports, January – August 2015 vs 2016
www.integer‐research.comSource: Integer, GTIS
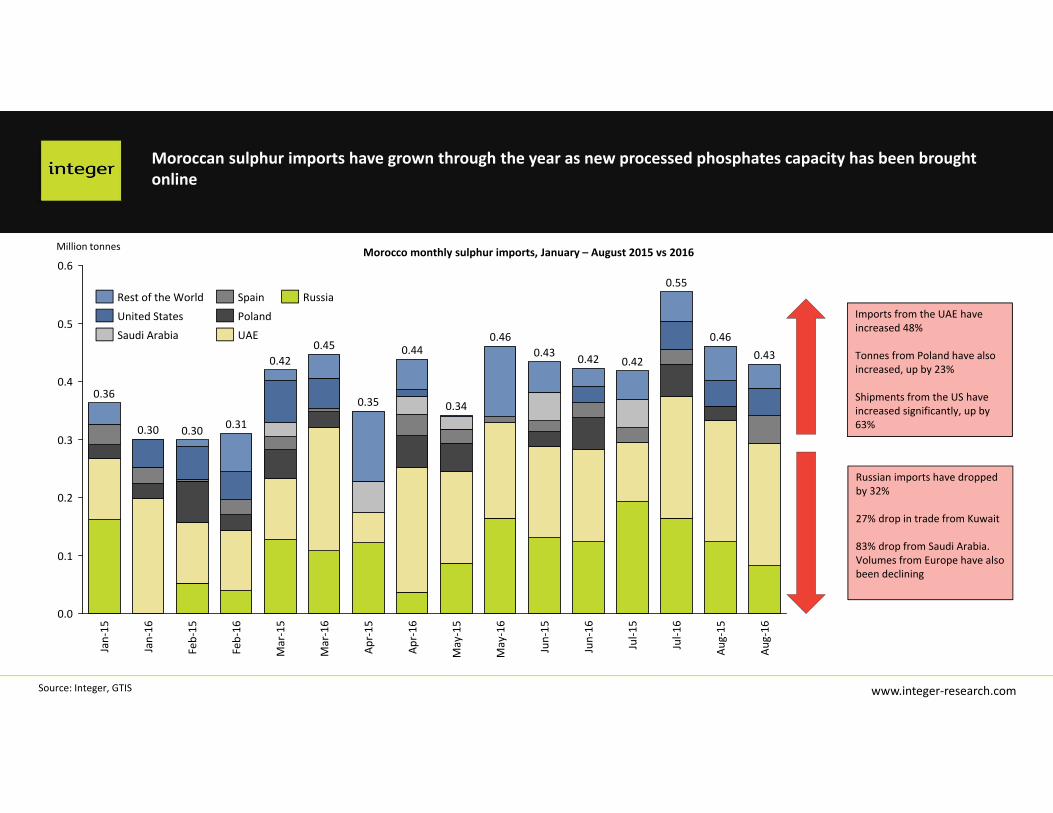
Moroccan sulphur imports have grown through the year as new processed phosphates capacity has been brought online
Million tonnes
0.4
0.1
0.6
0.5
0.3
0.2
0.0
Jan‐16
0.30
Jan‐15
0.36
Jul‐1
5
Jul‐1
6
Aug‐16
0.55
0.42 0.430.46
Aug‐15
Feb‐16
0.31
Feb‐15
0.34Ap
r‐16
0.44Ap
r‐15
0.35
Mar‐16
0.45
Mar‐15
0.42
0.30
Jun‐16
0.42
Jun‐15
0.43
May‐16
0.46
May‐15
Spain
Poland
Russia
United States
UAESaudi Arabia
Rest of the World
Morocco monthly sulphur imports, January – August 2015 vs 2016
Imports from the UAE have increased 48%
Tonnes from Poland have also increased, up by 23%
Shipments from the US have increased significantly, up by 63%
Russian imports have dropped by 32%
27% drop in trade from Kuwait
83% drop from Saudi Arabia.Volumes from Europe have also been declining
www.integer‐research.comSource: Integer, Port Metro
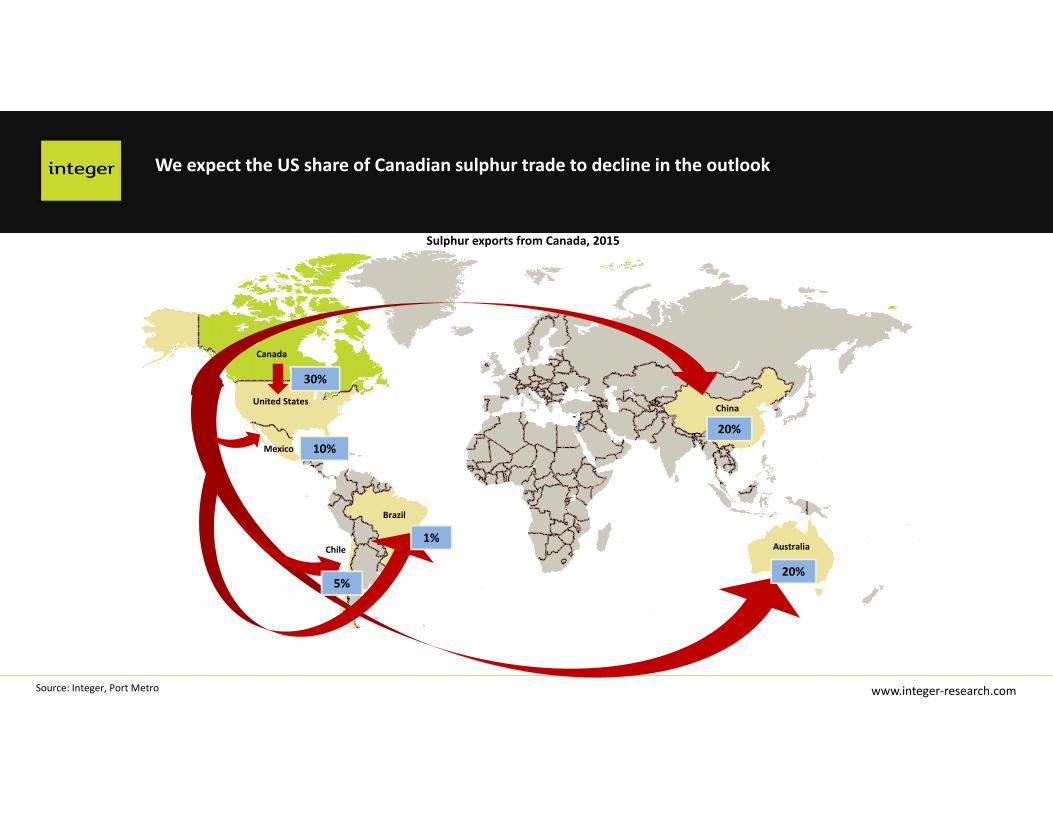
We expect the US share of Canadian sulphur trade to decline in the outlook
Sulphur exports from Canada, 2015
United States
Mexico
Brazil
Chile Australia
China
Canada
30%
10%
1%
5%20%
20%
www.integer‐research.com
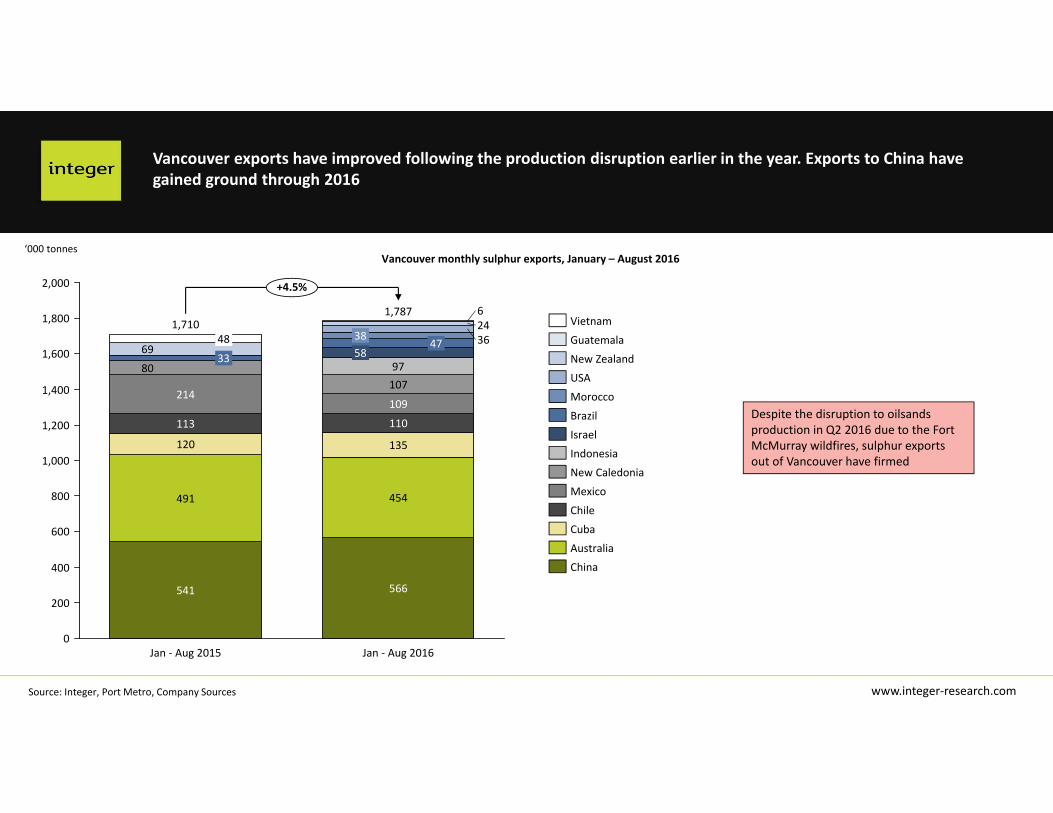
Vancouver monthly sulphur exports, January – August 2016
Source: Integer, Port Metro, Company Sources
Vancouver exports have improved following the production disruption earlier in the year. Exports to China have gained ground through 2016
‘000 tonnes
1,400
2,000
1,800
1,600
1,200
1,000
800
600
400
200
0
+4.5%
Jan ‐ Aug 2016
1,787
566
454
135
110
109
10797
5847
38 36246
Jan ‐ Aug 2015
1,710
541
491
120
113
214
8033
6948
China
Australia
Cuba
Chile
Mexico
New Caledonia
Indonesia
Israel
Brazil
Morocco
USA
New Zealand
Guatemala
Vietnam
Despite the disruption to oilsands production in Q2 2016 due to the Fort McMurray wildfires, sulphur exports out of Vancouver have firmed

Demand

www.integer‐research.com
Million tonnes
Source: Integer
Sulphur demand is set to grow by over 2% year on year in 2016, led by developments in Africa
55
5
0
65
60
50
45
40
35
30
25
20
15
10
1.3 1.3
+2.4%
2016
61.8
18.1
10.0
9.3
4.8
4.7
3.8
3.63.2
1.71.3 1.3
2015
60.4
18.0
10.0
8.4
4.8
4.5
3.73.6
3.11.7
East Asia
North America
Africa
FSU
Latin America
South Asia
West Europe
Middle East
Southeast Asia
Oceania
Central Europe
Sulphur demand by region, 2015‐2016
www.integer‐research.comSource: Integer
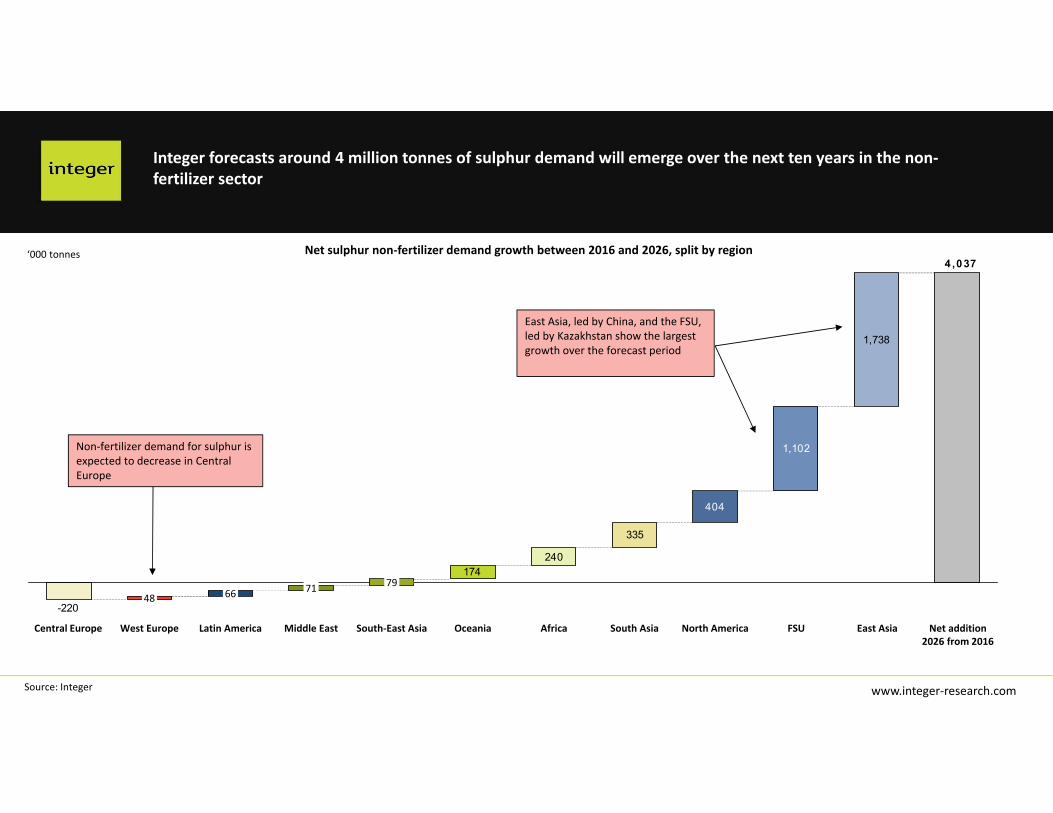
Integer forecasts around 4 million tonnes of sulphur demand will emerge over the next ten years in the non‐fertilizer sector
240
335
1,738
174
-220
4 ,037
1,102
404
Net addition 2026 from 2016
East AsiaFSUNorth AmericaSouth AsiaAfricaOceaniaSouth‐East Asia
79
Middle East
71
Latin America
66
West Europe
48
Central Europe
‘000 tonnes
Non‐fertilizer demand for sulphur is expected to decrease in Central Europe
Net sulphur non‐fertilizer demand growth between 2016 and 2026, split by region
East Asia, led by China, and the FSU, led by Kazakhstan show the largest growth over the forecast period
Global sulphur balance
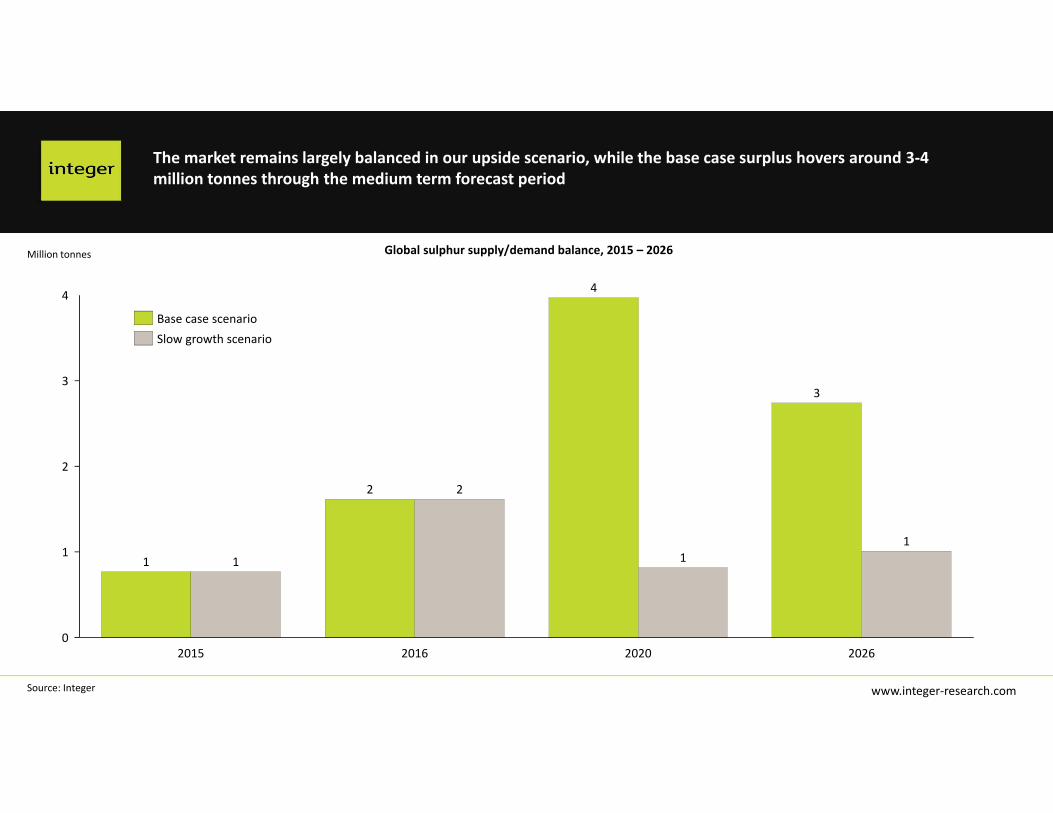
www.integer‐research.comSource: Integer
The market remains largely balanced in our upside scenario, while the base case surplus hovers around 3‐4 million tonnes through the medium term forecast period
Million tonnes Global sulphur supply/demand balance, 2015 – 2026
4
3
2
0
1
2020
11
2016 20262015
22
4
11
3
Slow growth scenarioBase case scenario

Conclusions
www.integer‐research.comSource: Integer
Key factors influencing long term sulphur market trends
• Utilization of long term sulphur storage
• Investment in energy sector – shifts in oil prices to impact
• Development in processed phosphates markets
• End user ability to switch between sulphur and sulphuric acid
• Metals markets and commodity pricing for non‐fertilizer demand
• Continued rise of new Middle East supply
• Domestic sulphur production in China

Thank you for your attentionAny questions?
All data in the presentation is taken from Integer’s Sulphur Market Dynamics Service
Meena ChauhanHead of Sulphur and Sulphuric AcidMeena.Chauhan@integer‐research.com+44 (0) 207 193 3990