summary - loreme
TRANSCRIPT

f) ENVrRor[r[E'TEct{tF T GROIJPE EMITECI{
RENV-rNN-1 9-400328- 1/A (oo)
MECHANICAL TEST REPORT
According to the standards:NF EN 60068-2-6 (2008)NF EN 60068-2-27 (2009)
Equipment under test:One BGL 136
One CPL 35-CMTCPOne RPL 23
One DSL 1-35-NUC
Company:LOREME
DISTRIBUTION: MT R.EPPERT Company: LOREME
Number of de pages: 50
Technical Verification &
Name. Function and Visa Name, Function and VisaKeryann ALLEGRET-PILOT
Mechanical Tests Technician30t04t2019 Rémi RAVAT
Duplication of lhis document is only permitted for an integral photographic facsimile. It includes tlrc number of poges relerenced herc aboveThis document is the result of fesfing a specimen or a sample of the prcduct submilted Il does not imply an assessment of the conformity of thewhole production ofthe tested sample.
49, boulevard du Pré Pommier - Z.A. du Champ Fleuri - 38300 BOURGOIN-JALLIEU - France - Siret : 350 435 632 00046Té1.:33(0)474938383-Fax:33(O},4744391 92-E-mail :[email protected]:www.environnetech.frS.A.S. au capital de 400 000 € - R.C.S. BOURGOIN 350 435 632- APETII2B
Creation

RENV-INN-19-400328-1/A (00)
Page 2 out of 50 DQS ENV 000 FOR 00016 (03)
EQUIPMENT UNDER TEST: One BGL 136
One CPL 35-CMTCP One RPL 23 One DSL 1-35-NUC
MANUFACTURER: LOREME CUSTOMER’S NAME AND ADDRESS: Company: LOREME Address: 12, Rue des Potiers d’Etain Actipôle BORNY BP 35014 57071 METZ Cedex 3 Contact: Mr REPPERT PURCHASE ORDER: N° E190570AMP TEST DATES: From 24th to 29th April, 2019 TEST LOCATION: Environne’Tech
49 Boulevard du pré pommier BOURGOIN-JALLIEU 38300
TESTER: Keryann ALLEGRET-PILOT

RENV-INN-19-400328-1/A (00)
Page 3 out of 50 DQS ENV 000 FOR 00016 (03)
SUMMARY
1. PURPOSE OF THE TESTS. 4
2. EQUIPMENT SUBMITTED FOR TESTING. 4
3. SPECIFICATIONS SHEET. 5 - 7 3.1. Reference documents: ................................................................................................... 5 3.2. Reminder of the main criteria of tests: ......................................................................... 5
3.2.1. Resonance frequency search, sine vibrations: 5 3.2.2. Endurance, sine vibrations: 6 3.2.3. Dwell, sine vibrations: 6 3.2.4. Shock tests: 6
3.3. Functional control verification: .................................................................................... 6 3.4. Representation of standard tolerances: ........................................................................ 7
4. EQUIPMENT USED. 7 - 8 4.1. Means of tests. ............................................................................................................... 7 4.2. Measurement Equipment. ............................................................................................. 8 4.3. Tools. ............................................................................................................................. 8
5. TEST LOG. 9 - 49 5.1. Z axis: ................................................................................................................... 10 - 21
5.1.1. Test set up for sine vibrations: 10 5.1.2. Sinus vibrations – RFR initial: 12 5.1.3. Sinus vibrations - Endurance: 14 5.1.4. Sinus vibrations – RFR final: 16 5.1.5. Test set up for shocks: 18 5.1.6. Shock tests: 20
5.2. X axis: .................................................................................................................. 22 - 35 5.2.1. Test set up for sine vibrations: 22 5.2.2. Sinus vibrations – RFR initial: 24 5.2.3. Sinus vibrations - Endurance: 27 5.2.4. Sinus vibrations – RFR final: 29 5.2.5. Test set up for shocks: 32 5.2.6. Shock tests: 34
5.3. Y axis: ................................................................................................................... 36 - 49 5.3.1. Test set up for sine vibrations: 36 5.3.2. Sinus vibrations – RFR initial: 38 5.3.3. Sinus vibrations - Endurance: 41 5.3.4. Sinus vibrations – RFR final: 43 5.3.5. Test set up for shocks: 46 5.3.6. Shock tests: 48
6. CONCLUSION. 50
RENV-INN-19-400328-1/A (00)
Page 4 out of 50 DQS ENV 000 FOR 00016 (03)
1. PURPOSE OF THE TESTS.
Test purpose was to certify one BGL 136, one CPL 35-CMTCP, one RPL 23 and one DSL 1-35-NUC under mechanical test conditions.
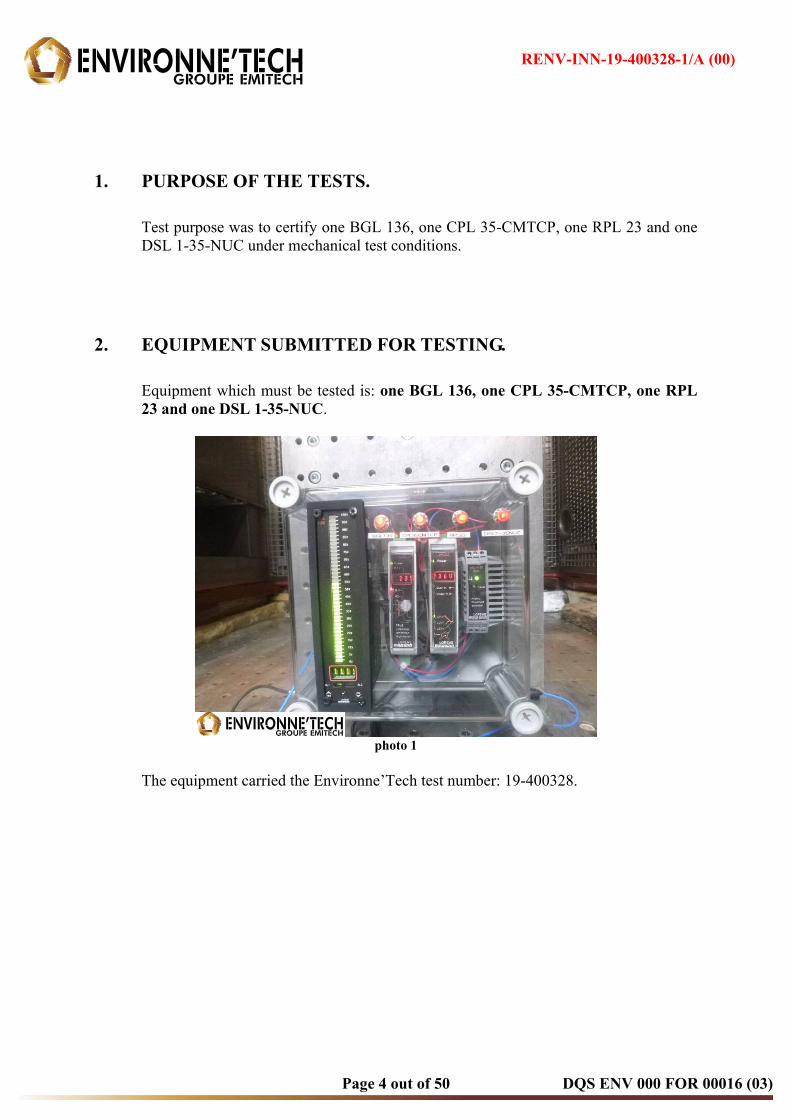
2. EQUIPMENT SUBMITTED FOR TESTING.
Equipment which must be tested is: one BGL 136, one CPL 35-CMTCP, one RPL 23 and one DSL 1-35-NUC.
photo 1
The equipment carried the Environne’Tech test number: 19-400328.
RENV-INN-19-400328-1/A (00)
Page 5 out of 50 DQS ENV 000 FOR 00016 (03)
3. SPECIFICATIONS SHEET.
The tests shall be conducted as per following document and as per Environne’Tech Offer N°DENV-INN-19-400328.
3.1. Reference documents:
- Environne’Tech Offer N° DENV-INN-19-400328-1 - The standards : NF EN 60068-2-6 (2008)
NF EN 60068-2-27 (2009)
3.2. Reminder of the main criteria of tests:
3.2.1. Resonance frequency search, sine vibrations: - Frequency range: 0.1 Hz to 50 Hz - Number of axis: along 3 axis - Control points : P1, P2 and P3 - Level: 25 mm peak from 0.1 Hz to 1 Hz
0.1g from 1 Hz to 5 Hz 1 mm peak from 5 Hz to 22Hz 2g from 22 Hz to 50 Hz
- Sweep rate: 1 oct/min - Number of cycle : 1 - State of equipment : ON

RENV-INN-19-400328-1/A (00)
Page 6 out of 50 DQS ENV 000 FOR 00016 (03)
3.2.2. Endurance, sine vibrations: - Frequency range: 0.1 Hz to 50 Hz - Number of axis: along 3 axis - Control points : P1, P2 and P3 - Level: 25 mm peak from 0.1 Hz to 1 Hz
0.1g from 1 Hz to 5 Hz 1 mm peak from 5 Hz to 22Hz 2g from 22 Hz to 50 Hz
- Sweep rate: 1 oct/min - Number of cycle : 5 - State of equipment : ON
3.2.3. Dwell, sine vibrations: - Frequency range: at the resonance frequency - Number of axis: along 3 axis - Control points : P1, P2 and P3 - Level: 25 mm peak from 0.1 Hz to 1 Hz
0.1g from 1 Hz to 5 Hz 1 mm peak from 5 Hz to 22Hz 2g from 22 Hz to 50 Hz
- Sweep rate: 1 oct/min - Time : 30 min by resonance - State of equipment : ON
3.2.4. Shock tests: - Type: shock half-sine - Number of axes: along 3 axes (Ox, Oy and Oz) - Number of shocks: 3/direction/axis - Control point: P - Level: 15g 11ms - State of equipment : ON
3.3. Functional control verification:
A visual inspection and verification test will be performed before and after each test by Environne’Tech Company. The verification consists in seeing that all the LEDs are lit as well as the bar graph.

RENV-INN-19-400328-1/A (00)
Page 7 out of 50 DQS ENV 000 FOR 00016 (03)
3.4. Representation of standard tolerances:
A summary table of graphical representations of normalized tolerances given below:
Type of test Curve lay-out:
Standard tolerances
Sinus vibration
Shocks
4. EQUIPMENT USED.
4.1. Means of tests.
Identity Designation Brand and Model Characteristics
MECA 306 Double stem cylinder, double
acting QUIRI HiFi-S A32-100
cylinder, double rod, double acting with hydrostatic bearings, displacement: 100mm, 31kN, 0.1Hz to 200Hz
MECA 283 Hydraulic vibration generator QUIRI HiFi-S A32-100 displacement: 100mm, 31kN, 0.1Hz to 200Hz static force
MECA 648 Electrodynamic vibrator LDS V8-440 HBT 600 5Hz to 2500Hz ; resonance at 2000Hz ; sine: 57.8kN ; random:
66kN; impact: 1/2sine 198kN

RENV-INN-19-400328-1/A (00)
Page 8 out of 50 DQS ENV 000 FOR 00016 (03)
4.2. Measurement Equipment.
Identity Designation Brand and Model Characteristics Metrological
confirmation valid until :
MECA 694 Accelerometer PCB 353B04 sensitivity: 10.20 mV/g at 160Hz 12/03/2019
MECA 688 Accelerometer PCB 3713B1110G X: 200.4 mV/g, Y: 201.3 mV/g, Z: 202.6 mV/g
at 160Hz 01/15/2020
MECA 759 Accelerometer PCB 353B03 sensitivity: 10.09mV/g at 160Hz 06/02/2020
MECA 661 Accelerometer PCB 3711B1150G sensitivity: 39.94 mV/g at 160Hz 06/11/2020
MECA 660 Accelerometer PCB 3711B1150G sensitivity: 39.68 mV/g at 160Hz 03/30/2020
MECA 723 Accelerometer PCB 356B21 X: 10.46 mV/g, Y: 10.50 mV/g, Z: 10.51 mV/g
at 160Hz 04/22/2020
MECA 744 Control generator SIEMENS/LMS SCL2E20V up to 32 measuring channels - sine, random, shocks, level limitation - 0.5Hz to 5000Hz - analysis 0.5Hz
to 40kHz - Test.Lab 13A/17 09/11/2020
4.3. Tools.
Tooling is provided by Environne’Tech

RENV-INN-19-400328-1/A (00)
Page 9 out of 50 DQS ENV 000 FOR 00016 (03)
5. TEST LOG.
Vibration tests are piloted on the points P1, P2 and P3. P1, P2 and P3 each control part of the test as a function of frequency:
P1 is the displacement sensor of the test bench, used to control the test in the lowest frequencies (0.1 to 3 Hz). P2 is an accelerometer used to control the test in the intermediate frequencies ( 3 to 10 Hz). P3 is an accelerometer used to control the test in the highest frequencies ( 10 to 50 Hz). M is a measure accelerometer on the module.
The tests occurred as follows:
Date Test performed Axis
24/04/2019 Initial resonance frequency search, sine vibrations Z
Endurance, sine vibrations Z Final resonance frequency search, sine vibrations Z
25/04/2019
Initial resonance frequency search, sine vibrations X Endurance, sine vibrations X
Final resonance frequency search, sine vibrations X Initial resonance frequency search, sine vibrations Y
Endurance, sine vibrations Y 26/04/2019 Final resonance frequency search, sine vibrations Y
29/04/2019 Shock tests X Shock tests Y Shock tests Z

RENV-INN-19-400328-1/A (00)
Page 10 out of 50 DQS ENV 000 FOR 00016 (03)
5.1. Z axis:
5.1.1. Test set up for sine vibrations:
photo 2
P1 is the displacement sensor of the bench Positioning of accelerometers P2 and P3 given below:
photo 3 photo 4
Excitation axis
P2 P3

RENV-INN-19-400328-1/A (00)
Page 11 out of 50 DQS ENV 000 FOR 00016 (03)
Positioning of accelerometer M given below:
photo 5

RENV-INN-19-400328-1/A (00)
Page 12 out of 50 DQS ENV 000 FOR 00016 (03)
5.1.2. Sinus vibrations – RFR initial:
Control curve recorded at test end given below:
50.000.10 1.00 10.000.20 0.30 0.40 0.50 0.70 2.00 3.00 4.00 5.00 7.00 20.00 30.00
Hz
10.00
0.10e-3
1.00e-3
0.01
0.10
1.00
0.20e-3
0.40e-3
2.00e-3
4.00e-3
0.02
0.04
0.20
0.40
2.00
4.00
Log
(Pea
k)
g
F Spectrum ReferenceF Spectrum UpAbortF Spectrum Low AbortF Spectrum UpAlarmF Spectrum Low AlarmF Spectrum AvgCtrl
curve 1
Acceleration measurement of P1, P2 and P3 points given below:
50.000.10 1.00 10.000.20 0.30 0.40 0.50 0.70 2.00 3.00 4.00 5.00 7.00 20.00 30.00
Hz
100.00
0.01
0.10
1.00
10.00
0.020.03
0.05
0.200.30
0.50
2.003.00
5.00
20.0030.00
50.00
Log
(Pea
k)
mm
F Spectrum ReferenceF Spectrum UpAbortF Spectrum Low AbortF Spectrum UpAlarmF Spectrum Low AlarmF Spectrum AvgCtrlF Harmonic Spectrum P1
curve 2

RENV-INN-19-400328-1/A (00)
Page 13 out of 50 DQS ENV 000 FOR 00016 (03)
50.000.10 1.00 10.000.20 0.30 0.40 0.50 0.70 2.00 3.00 4.00 5.00 7.00 20.00 30.00
Hz
10.00
0.10e-3
1.00e-3
0.01
0.10
1.00
0.20e-3
0.40e-3
2.00e-3
4.00e-3
0.02
0.04
0.20
0.40
2.00
4.00
Log
(Pea
k)
g
F Spectrum ReferenceF Spectrum UpAbortF Spectrum Low AbortF Spectrum UpAlarmF Spectrum Low AlarmF Spectrum AvgCtrlF Harmonic Spectrum P2F Harmonic Spectrum P3
curve 3
Measurements point given below:
50.000.10 1.00 10.000.20 0.30 0.40 0.50 0.70 2.00 3.00 4.00 5.00 7.00 20.00 30.00
Hz
10.00
0.10e-3
1.00e-3
0.01
0.10
1.00
0.20e-3
0.40e-3
2.00e-3
4.00e-3
0.02
0.04
0.20
0.40
2.00
4.00
Log
(Pea
k)
g
F Spectrum ReferenceF Spectrum UpAbortF Spectrum Low AbortF Spectrum UpAlarmF Spectrum Low AlarmF Spectrum AvgCtrlF Harmonic Spectrum M
curve 4
50.000.12 1.00 10.000.20 0.30 0.40 0.50 0.60 0.80 2.00 3.00 4.00 5.00 6.00 8.00 20.00 30.00
Hz
2.29
0.23
1.00
0.30
0.40
0.50
0.60
0.700.80
Log/
180.00
-180.00
Pha
se°
32.06
FRF (Harmonic) M/P3
curve 5
Results: No degradation was observed. There is no resonance frequency.
Saturation of P2 point (not used to control the test in the highest frequencies)

RENV-INN-19-400328-1/A (00)
Page 14 out of 50 DQS ENV 000 FOR 00016 (03)
5.1.3. Sinus vibrations - Endurance:
Control curve recorded at test end given below:
50.000.10 1.00 10.000.20 0.30 0.40 0.50 0.70 2.00 3.00 4.00 5.00 7.00 20.00 30.00
Hz
10.00
0.10e-3
1.00e-3
0.01
0.10
1.00
0.20e-3
0.40e-3
2.00e-3
4.00e-3
0.02
0.04
0.20
0.40
2.00
4.00
Log
(Pea
k)
g
F Spectrum ReferenceF Spectrum UpAbortF Spectrum Low AbortF Spectrum UpAlarmF Spectrum Low AlarmF Spectrum AvgCtrl
curve 6
Acceleration measurement of P1, P2 and P3 points given below:
50.000.10 1.00 10.000.20 0.30 0.40 0.50 0.70 2.00 3.00 4.00 5.00 7.00 20.00 30.00
Hz
100.00
0.01
0.10
1.00
10.00
0.020.03
0.05
0.200.30
0.50
2.003.00
5.00
20.0030.00
50.00
Log
(Pea
k)
mm
F Spectrum ReferenceF Spectrum UpAbortF Spectrum Low AbortF Spectrum UpAlarmF Spectrum Low AlarmF Spectrum AvgCtrlF Harmonic Spectrum P1
curve 7

RENV-INN-19-400328-1/A (00)
Page 15 out of 50 DQS ENV 000 FOR 00016 (03)
50.000.10 1.00 10.000.20 0.30 0.40 0.50 0.70 2.00 3.00 4.00 5.00 7.00 20.00 30.00
Hz
10.00
0.10e-3
1.00e-3
0.01
0.10
1.00
0.20e-3
0.40e-3
2.00e-3
4.00e-3
0.02
0.04
0.20
0.40
2.00
4.00
Log
(Pea
k)
g
F Spectrum ReferenceF Spectrum UpAbortF Spectrum Low AbortF Spectrum UpAlarmF Spectrum Low AlarmF Spectrum AvgCtrlF Harmonic Spectrum P2F Harmonic Spectrum P3
curve 8
Measurements point given below:
50.000.10 1.00 10.000.20 0.30 0.40 0.50 0.70 2.00 3.00 4.00 5.00 7.00 20.00 30.00
Hz
10.00
0.10e-3
1.00e-3
0.01
0.10
1.00
0.20e-3
0.40e-3
2.00e-3
4.00e-3
0.02
0.04
0.20
0.40
2.00
4.00
Log
(Pea
k)
g
F Spectrum ReferenceF Spectrum UpAbortF Spectrum Low AbortF Spectrum UpAlarmF Spectrum Low AlarmF Spectrum AvgCtrlF Harmonic Spectrum M
curve 9
Results: No degradation was observed.
Saturation of P2 point (not used to control the test in the highest frequencies)

RENV-INN-19-400328-1/A (00)
Page 16 out of 50 DQS ENV 000 FOR 00016 (03)
5.1.4. Sinus vibrations – RFR final:
Control curve recorded at test end given below:
50.000.10 1.00 10.000.20 0.30 0.40 0.50 0.70 2.00 3.00 4.00 5.00 7.00 20.00 30.00
Hz
10.00
0.10e-3
1.00e-3
0.01
0.10
1.00
0.20e-3
0.40e-3
2.00e-3
4.00e-3
0.02
0.04
0.20
0.40
2.00
4.00
Log
(Pea
k)
g
F Spectrum ReferenceF Spectrum UpAbortF Spectrum Low AbortF Spectrum UpAlarmF Spectrum Low AlarmF Spectrum AvgCtrl
curve 10
Acceleration measurement of P1, P2 and P3 points given below:
50.000.10 1.00 10.000.20 0.30 0.40 0.50 0.70 2.00 3.00 4.00 5.00 7.00 20.00 30.00
Hz
100.00
0.01
0.10
1.00
10.00
0.020.03
0.05
0.200.30
0.50
2.003.00
5.00
20.0030.00
50.00
Log
(Pea
k)
mm
F Spectrum ReferenceF Spectrum UpAbortF Spectrum Low AbortF Spectrum UpAlarmF Spectrum Low AlarmF Spectrum AvgCtrlF Harmonic Spectrum P1
curve 11

RENV-INN-19-400328-1/A (00)
Page 17 out of 50 DQS ENV 000 FOR 00016 (03)
50.000.10 1.00 10.000.20 0.30 0.40 0.50 0.70 2.00 3.00 4.00 5.00 7.00 20.00 30.00
Hz
10.00
0.10e-3
1.00e-3
0.01
0.10
1.00
0.20e-3
0.40e-3
2.00e-3
4.00e-3
0.02
0.04
0.20
0.40
2.00
4.00
Log
(Pea
k)
g
F Spectrum ReferenceF Spectrum UpAbortF Spectrum Low AbortF Spectrum UpAlarmF Spectrum Low AlarmF Spectrum AvgCtrlF Harmonic Spectrum P2F Harmonic Spectrum P3
curve 12
Measurements point given below:
50.000.10 1.00 10.000.20 0.30 0.40 0.50 0.70 2.00 3.00 4.00 5.00 7.00 20.00 30.00
Hz
10.00
0.10e-3
1.00e-3
0.01
0.10
1.00
0.20e-3
0.40e-3
2.00e-3
4.00e-3
0.02
0.04
0.20
0.40
2.00
4.00
Log
(Pea
k)
g
F Spectrum ReferenceF Spectrum UpAbortF Spectrum Low AbortF Spectrum UpAlarmF Spectrum Low AlarmF Spectrum AvgCtrlF Harmonic Spectrum M
curve 13
50.000.12 1.00 10.000.20 0.30 0.40 0.50 0.60 0.80 2.00 3.00 4.00 5.00 6.00 8.00 20.00 30.00
Hz
2.31
0.23
1.00
0.30
0.40
0.50
0.60
0.700.80
Log/
180.00
-180.00
Pha
se°
32.01
FRF (Harmonic) M/P3FRF (Harmonic) M/P3
curve 14
Results: No degradation was observed. There is no resonance frequency.
Saturation of P2 point (not used to control the test in the highest frequencies)

RENV-INN-19-400328-1/A (00)
Page 18 out of 50 DQS ENV 000 FOR 00016 (03)
5.1.5. Test set up for shocks:
photo 6
Positioning of accelerometers P1 and P2 given below:
photo 7 photo 8
Excitation axis
P1 P2

RENV-INN-19-400328-1/A (00)
Page 19 out of 50 DQS ENV 000 FOR 00016 (03)
Positioning of accelerometer M given below:
photo 9

RENV-INN-19-400328-1/A (00)
Page 20 out of 50 DQS ENV 000 FOR 00016 (03)
5.1.6. Shock tests:
Control was done at P1 point.
Curve of the third positive impact given below. Control curve with P1 and P2 are given below:
0.200.05 0.10 0.150.06 0.07 0.08 0.09 0.11 0.12 0.13 0.14 0.16 0.17 0.18 0.19
s
18.00
-4.00
0.00
10.00
-2.00
2.00
4.00
6.00
8.00
12.00
14.00
16.00
Rea
l
g
F Time ReferenceF Time Low ToleranceF Time Low AlarmF Time UpToleranceF Time UpAlarmF Time P1F Time P2
curve 15
Curve at M point given below:
0.200.05 0.10 0.150.06 0.07 0.08 0.09 0.11 0.12 0.13 0.14 0.16 0.17 0.18 0.19
s
18.00
-15.00
-10.00
0.00
10.00
-12.00
-8.00
-6.00
-4.00
-2.00
2.00
4.00
6.00
8.00
12.00
14.00
16.00
Rea
l
g
F Time ReferenceF Time Low ToleranceF Time Low AlarmF Time UpToleranceF Time UpAlarmF Time P1F Time MxF Time MyF Time Mz
curve 16

RENV-INN-19-400328-1/A (00)
Page 21 out of 50 DQS ENV 000 FOR 00016 (03)
Curve of the third negative impact given below. Control curve with P1 and P2 are given below:
0.200.05 0.10 0.150.06 0.07 0.08 0.09 0.11 0.12 0.13 0.14 0.16 0.17 0.18 0.19
s
4.00
-18.00
-10.00
0.00
-16.00
-14.00
-12.00
-8.00
-6.00
-4.00
-2.00
2.00
Rea
l
g
F Time ReferenceF Time Low ToleranceF Time Low AlarmF Time UpToleranceF Time UpAlarmF Time P1F Time P2
curve 17
Curve at M point given below:
0.200.05 0.10 0.150.06 0.07 0.08 0.09 0.11 0.12 0.13 0.14 0.16 0.17 0.18 0.19
s
19.00
-30.00
-20.00
-10.00
0.00
10.00
-25.00
-15.00
-5.00
5.00
15.00
-27.50
-22.50
-17.50
-12.50
-7.50
-2.50
2.50
7.50
12.50
Rea
l
g
F Time ReferenceF Time Low ToleranceF Time Low AlarmF Time UpToleranceF Time UpAlarmF Time P1F Time MxF Time MyF Time Mz
curve 18

RENV-INN-19-400328-1/A (00)
Page 22 out of 50 DQS ENV 000 FOR 00016 (03)
5.2. X axis:
5.2.1. Test set up for sine vibrations:
photo 10
P1 is the displacement sensor of the bench Positioning of accelerometers P2 and P3 given below:
photo 11 photo 12
Excitation axis
P2 P3

RENV-INN-19-400328-1/A (00)
Page 23 out of 50 DQS ENV 000 FOR 00016 (03)
Positioning of accelerometer M given below:
photo 13

RENV-INN-19-400328-1/A (00)
Page 24 out of 50 DQS ENV 000 FOR 00016 (03)
5.2.2. Sinus vibrations – RFR initial:
Control curve recorded at test end given below:
50.000.10 1.00 10.000.20 0.30 0.40 0.50 0.70 2.00 3.00 4.00 5.00 7.00 20.00 30.00
Hz
10.00
0.10e-3
1.00e-3
0.01
0.10
1.00
0.20e-30.30e-3
0.50e-3
2.00e-3
3.00e-3
5.00e-3
0.020.03
0.05
0.200.30
0.50
2.003.00
5.00
Log
(Pea
k)
g
F Spectrum ReferenceF Spectrum UpAbortF Spectrum Low AbortF Spectrum UpAlarmF Spectrum Low AlarmF Spectrum AvgCtrl
curve 19
Acceleration measurement of P1, P2 and P3 points given below:
50.000.10 1.00 10.000.20 0.30 0.40 0.50 0.70 2.00 3.00 4.00 5.00 7.00 20.00 30.00
Hz
100.00
0.01
0.10
1.00
10.00
0.02
0.03
0.050.07
0.20
0.30
0.50
0.70
2.00
3.004.00
6.00
20.00
30.0040.00
60.00
Log
(Pea
k)
mm
1.00
0.10
LogF Harmonic Spectrum P1
F Spectrum ReferenceF Spectrum UpAbortF Spectrum Low AbortF Spectrum UpAlarmF Spectrum Low AlarmF Spectrum AvgCtrl
curve 20

RENV-INN-19-400328-1/A (00)
Page 25 out of 50 DQS ENV 000 FOR 00016 (03)
50.000.10 1.00 10.000.20 0.30 0.40 0.50 0.70 2.00 3.00 4.00 5.00 7.00 20.00 30.00
Hz
10.00
0.10e-3
1.00e-3
0.01
0.10
1.00
0.20e-30.30e-3
0.50e-3
2.00e-3
3.00e-3
5.00e-3
0.020.03
0.05
0.200.30
0.50
2.003.00
5.00
Log
(Pea
k)
g
1.00
0.10
Log
F Spectrum ReferenceF Spectrum UpAbortF Spectrum Low AbortF Spectrum UpAlarmF Spectrum Low AlarmF Spectrum AvgCtrlF Harmonic Spectrum P2F Harmonic Spectrum P3
curve 21
Measurements point given below:
50.000.10 1.00 10.000.20 0.30 0.40 0.50 0.70 2.00 3.00 4.00 5.00 7.00 20.00 30.00
Hz
10.00
0.10e-3
1.00e-3
0.01
0.10
1.00
0.20e-30.30e-3
0.50e-3
2.00e-3
3.00e-3
5.00e-3
0.020.03
0.05
0.200.30
0.50
2.003.00
5.00
Log
(Pea
k)
g
F Spectrum ReferenceF Spectrum UpAbortF Spectrum Low AbortF Spectrum UpAlarmF Spectrum Low AlarmF Spectrum AvgCtrlF Harmonic Spectrum M
curve 22
Saturation of P2 point (not used to control the test in the highest frequencies)
RENV-INN-19-400328-1/A (00)
Page 26 out of 50 DQS ENV 000 FOR 00016 (03)
50.000.12 Hz
1.65
0.17
Log/
180.00
-180.00
Pha
se°
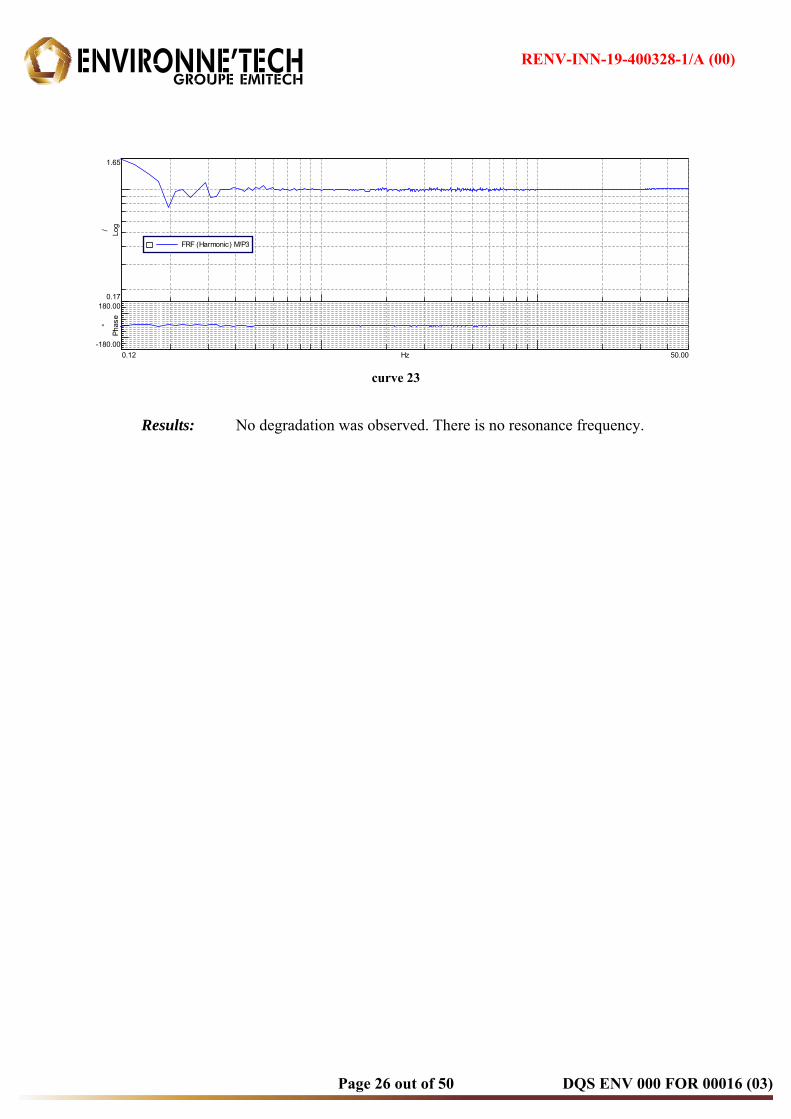
FRF (Harmonic) M/P3
curve 23
Results: No degradation was observed. There is no resonance frequency.

RENV-INN-19-400328-1/A (00)
Page 27 out of 50 DQS ENV 000 FOR 00016 (03)
5.2.3. Sinus vibrations - Endurance:
Control curve recorded at test end given below:
50.000.10 1.00 10.000.20 0.30 0.40 0.50 0.70 2.00 3.00 4.00 5.00 7.00 20.00 30.00
Hz
10.00
0.10e-3
1.00e-3
0.01
0.10
1.00
0.20e-3
0.40e-3
2.00e-3
4.00e-3
0.02
0.04
0.20
0.40
2.00
4.00
Log
(Pea
k)
g
F Spectrum ReferenceF Spectrum UpAbortF Spectrum Low AbortF Spectrum UpAlarmF Spectrum Low AlarmF Spectrum AvgCtrl
curve 24
Acceleration measurement of P1, P2 and P3 points given below:
50.000.10 1.00 10.000.20 0.30 0.40 0.50 0.70 2.00 3.00 4.00 5.00 7.00 20.00 30.00
Hz
100.00
0.01
0.10
1.00
10.00
0.02
0.03
0.05
0.20
0.30
0.50
2.00
3.00
5.00
20.00
30.00
50.00
Log
(Pea
k)
mm
F Spectrum ReferenceF Spectrum UpAbortF Spectrum Low AbortF Spectrum UpAlarmF Spectrum Low AlarmF Spectrum AvgCtrlF Harmonic Spectrum P1
curve 25

RENV-INN-19-400328-1/A (00)
Page 28 out of 50 DQS ENV 000 FOR 00016 (03)
50.000.10 1.00 10.000.20 0.30 0.40 0.50 0.70 2.00 3.00 4.00 5.00 7.00 20.00 30.00
Hz
10.00
0.10e-3
1.00e-3
0.01
0.10
1.00
0.20e-3
0.40e-3
2.00e-3
4.00e-3
0.02
0.04
0.20
0.40
2.00
4.00
Log
(Pea
k)
g
F Spectrum ReferenceF Spectrum UpAbortF Spectrum Low AbortF Spectrum UpAlarmF Spectrum Low AlarmF Spectrum AvgCtrlF Harmonic Spectrum P2F Harmonic Spectrum P3
curve 26
Measurements point given below:
50.000.10 1.00 10.000.20 0.30 0.40 0.50 0.70 2.00 3.00 4.00 5.00 7.00 20.00 30.00
Hz
10.00
0.10e-3
1.00e-3
0.01
0.10
1.00
0.30e-3
2.00e-3
4.00e-3
0.02
0.04
0.20
0.40
2.00
4.00
Log
(Pea
k)
g
F Spectrum ReferenceF Spectrum UpAbortF Spectrum Low AbortF Spectrum UpAlarmF Spectrum Low AlarmF Spectrum AvgCtrlF Harmonic Spectrum M
curve 27
Results: No degradation was observed.
Saturation of P2 point (not used to control the test in the highest frequencies)

RENV-INN-19-400328-1/A (00)
Page 29 out of 50 DQS ENV 000 FOR 00016 (03)
5.2.4. Sinus vibrations – RFR final:
Control curve recorded at test end given below:
50.000.10 1.00 10.000.20 0.30 0.40 0.50 0.70 2.00 3.00 4.00 5.00 7.00 20.00 30.00
Hz
10.00
0.10e-3
1.00e-3
0.01
0.10
1.00
0.20e-30.30e-3
0.50e-3
2.00e-3
3.00e-3
5.00e-3
0.020.03
0.05
0.200.30
0.50
2.003.00
5.00
Log
(Pea
k)
g
F Spectrum ReferenceF Spectrum UpAbortF Spectrum Low AbortF Spectrum UpAlarmF Spectrum Low AlarmF Spectrum AvgCtrl
curve 28
Acceleration measurement of P1, P2 and P3 points given below:
50.000.10 1.00 10.000.20 0.30 0.40 0.50 0.70 2.00 3.00 4.00 5.00 7.00 20.00 30.00
Hz
100.00
0.01
0.10
1.00
10.00
0.02
0.03
0.050.07
0.20
0.30
0.50
0.70
2.00
3.004.00
6.00
20.00
30.0040.00
60.00
Log
(Pea
k)
mm
1.00
0.10
LogF Harmonic Spectrum P1
F Spectrum ReferenceF Spectrum UpAbortF Spectrum Low AbortF Spectrum UpAlarmF Spectrum Low AlarmF Spectrum AvgCtrl
curve 29

RENV-INN-19-400328-1/A (00)
Page 30 out of 50 DQS ENV 000 FOR 00016 (03)
50.000.10 1.00 10.000.20 0.30 0.40 0.50 0.70 2.00 3.00 4.00 5.00 7.00 20.00 30.00
Hz
10.00
0.10e-3
1.00e-3
0.01
0.10
1.00
0.20e-30.30e-3
0.50e-3
2.00e-3
3.00e-3
5.00e-3
0.020.03
0.05
0.200.30
0.50
2.003.00
5.00
Log
(Pea
k)
g
1.00
0.10
Log
F Spectrum ReferenceF Spectrum UpAbortF Spectrum Low AbortF Spectrum UpAlarmF Spectrum Low AlarmF Spectrum AvgCtrlF Harmonic Spectrum P2F Harmonic Spectrum P3
curve 30
Measurements point given below:
50.000.10 1.00 10.000.20 0.30 0.40 0.50 0.70 2.00 3.00 4.00 5.00 7.00 20.00 30.00
Hz
10.00
0.10e-3
1.00e-3
0.01
0.10
1.00
0.20e-30.30e-3
0.50e-3
2.00e-3
3.00e-3
5.00e-3
0.020.03
0.05
0.200.30
0.50
2.003.00
5.00
Log
(Pea
k)
g
F Spectrum ReferenceF Spectrum UpAbortF Spectrum Low AbortF Spectrum UpAlarmF Spectrum Low AlarmF Spectrum AvgCtrlF Harmonic Spectrum M
curve 31
Saturation of P2 point (not used to control the test in the highest frequencies)
RENV-INN-19-400328-1/A (00)
Page 31 out of 50 DQS ENV 000 FOR 00016 (03)
50.000.12 1.00 10.000.20 0.30 0.40 0.50 0.60 0.80 2.00 3.00 4.00 5.00 6.00 8.00 20.00 30.00
Hz
1.65
0.17
1.00
0.30
0.40
0.50
0.600.70
Log/
180.00
-180.00
Pha
se°
32.06
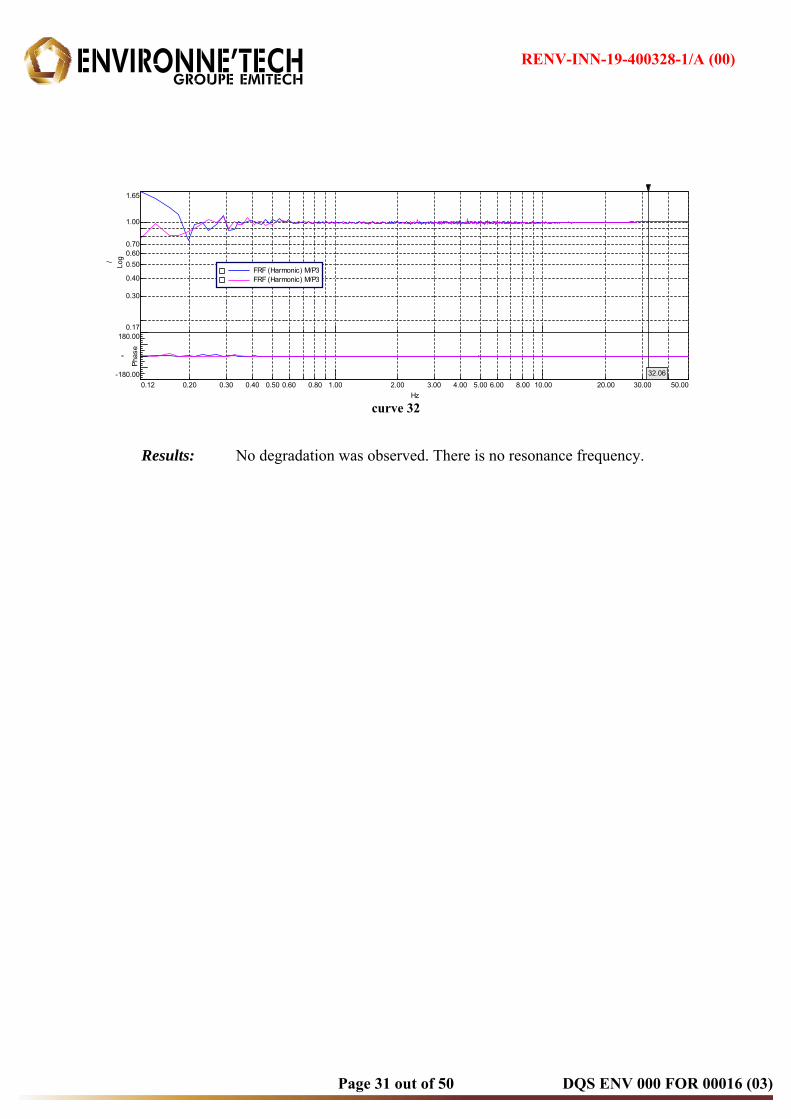
FRF (Harmonic) M/P3FRF (Harmonic) M/P3
curve 32
Results: No degradation was observed. There is no resonance frequency.

RENV-INN-19-400328-1/A (00)
Page 32 out of 50 DQS ENV 000 FOR 00016 (03)
5.2.5. Test set up for shocks:
photo 14
Positioning of accelerometers P1 and P2 given below:
photo 15 photo 16
Excitation axis
P1 P2

RENV-INN-19-400328-1/A (00)
Page 33 out of 50 DQS ENV 000 FOR 00016 (03)
Positioning of accelerometer M given below:
photo 17

RENV-INN-19-400328-1/A (00)
Page 34 out of 50 DQS ENV 000 FOR 00016 (03)
5.2.6. Shock tests:
Control was done at P1 point.
Curve of the third positive impact given below. Control curve with P1 and P2 are given below:
0.130.00 0.1000.0500.010 0.020 0.030 0.040 0.060 0.070 0.080 0.090 0.110 0.120
s
18.00
-3.75
0.00
10.00
-2.00
2.00
4.00
6.00
8.00
12.00
14.00
16.00
Rea
l
g
F Time ReferenceF Time Low AbortF Time Low AlarmF Time UpAbortF Time UpAlarmF Time P1F Time P2
curve 33
Curve at M point given below:
0.130.00 0.100.050.01 0.02 0.03 0.04 0.06 0.07 0.08 0.09 0.11 0.12
s
18.00
-17.75
-10.00
0.00
10.00
-16.00
-14.00
-12.00
-8.00
-6.00
-4.00
-2.00
2.00
4.00
6.00
8.00
12.00
14.00
16.00
Rea
l
g
F Time ReferenceF Time Low AbortF Time Low AlarmF Time UpAbortF Time UpAlarmF Time P1F Time MxF Time MyF Time Mz
curve 34

RENV-INN-19-400328-1/A (00)
Page 35 out of 50 DQS ENV 000 FOR 00016 (03)
Curve of the third negative impact given below. Control curve with P1 and P2 are given below:
0.130.00 0.1000.0500.010 0.020 0.030 0.040 0.060 0.070 0.080 0.090 0.110 0.120
s
4.00
-18.00
-10.00
0.00
-16.00
-14.00
-12.00
-8.00
-6.00
-4.00
-2.00
2.00
Rea
l
g
F Time ReferenceF Time Low AbortF Time Low AlarmF Time UpAbortF Time UpAlarmF Time P1F Time P2
curve 35
Curve at M point given below:
0.130.00 0.100.050.01 0.02 0.03 0.04 0.06 0.07 0.08 0.09 0.11 0.12
s
18.00
-18.00
-10.00
0.00
10.00
-16.00
-14.00
-12.00
-8.00
-6.00
-4.00
-2.00
2.00
4.00
6.00
8.00
12.00
14.00
16.00
Rea
l
g
F Time ReferenceF Time Low AbortF Time Low AlarmF Time UpAbortF Time UpAlarmF Time P1F Time MxF Time MyF Time Mz
curve 36

RENV-INN-19-400328-1/A (00)
Page 36 out of 50 DQS ENV 000 FOR 00016 (03)
5.3. Y axis:
5.3.1. Test set up for sine vibrations:
photo 18
P1 is the displacement sensor of the bench Positioning of accelerometers P2 and P3 given below:
photo 19 photo 20
Excitation axis
P2
P3

RENV-INN-19-400328-1/A (00)
Page 37 out of 50 DQS ENV 000 FOR 00016 (03)
Positioning of accelerometer M given below:
photo 21

RENV-INN-19-400328-1/A (00)
Page 38 out of 50 DQS ENV 000 FOR 00016 (03)
5.3.2. Sinus vibrations – RFR initial:
Control curve recorded at test end given below:
50.000.10 1.00 10.000.20 0.30 0.40 0.50 0.70 2.00 3.00 4.00 5.00 7.00 20.00 30.00
Hz
10.00
0.10e-3
1.00e-3
0.01
0.10
1.00
0.20e-3
0.40e-3
2.00e-3
4.00e-3
0.02
0.04
0.20
0.40
2.00
4.00
Log
(Pea
k)
g
F Spectrum ReferenceF Spectrum UpAbortF Spectrum Low AbortF Spectrum UpAlarmF Spectrum Low AlarmF Spectrum AvgCtrl
curve 37
Acceleration measurement of P1, P2 and P3 points given below:
50.000.10 1.00 10.000.20 0.30 0.40 0.50 0.70 2.00 3.00 4.00 5.00 7.00 20.00 30.00
Hz
100.00
0.01
0.10
1.00
10.00
0.02
0.03
0.05
0.20
0.30
0.50
2.00
3.00
5.00
20.00
30.00
50.00
Log
(Pea
k)
mm
F Spectrum ReferenceF Spectrum UpAbortF Spectrum Low AbortF Spectrum UpAlarmF Spectrum Low AlarmF Spectrum AvgCtrlF Harmonic Spectrum P1
curve 38

RENV-INN-19-400328-1/A (00)
Page 39 out of 50 DQS ENV 000 FOR 00016 (03)
50.000.10 1.00 10.000.20 0.30 0.40 0.50 0.70 2.00 3.00 4.00 5.00 7.00 20.00 30.00
Hz
10.00
0.10e-3
1.00e-3
0.01
0.10
1.00
0.20e-3
0.40e-3
2.00e-3
4.00e-3
0.02
0.04
0.20
0.40
2.00
4.00
Log
(Pea
k)
g
F Spectrum ReferenceF Spectrum UpAbortF Spectrum Low AbortF Spectrum UpAlarmF Spectrum Low AlarmF Spectrum AvgCtrlF Harmonic Spectrum P2F Harmonic Spectrum P3
curve 39
Measurements point given below:
50.000.10 1.00 10.000.20 0.30 0.40 0.50 0.70 2.00 3.00 4.00 5.00 7.00 20.00 30.00
Hz
10.00
0.10e-3
1.00e-3
0.01
0.10
1.00
0.20e-3
0.40e-3
2.00e-3
4.00e-3
0.02
0.04
0.20
0.40
2.00
4.00
Log
(Pea
k)
g
F Spectrum ReferenceF Spectrum UpAbortF Spectrum Low AbortF Spectrum UpAlarmF Spectrum Low AlarmF Spectrum AvgCtrlF Harmonic Spectrum M
curve 40
Saturation of P2 point (not used to control the test in the highest frequencies)

RENV-INN-19-400328-1/A (00)
Page 40 out of 50 DQS ENV 000 FOR 00016 (03)
50.000.12 1.00 10.000.20 0.30 0.40 0.50 0.60 0.80 2.00 3.00 4.00 5.00 6.00 8.00 20.00 30.00
Hz
1.34
0.13
1.00
0.20
0.30
0.40
0.50
0.60
0.70
0.80
Log/
180.00
-180.00
Pha
se°
32.06
FRF (Harmonic) M/P3
curve 41
Results: No degradation was observed. There is no resonance frequency.

RENV-INN-19-400328-1/A (00)
Page 41 out of 50 DQS ENV 000 FOR 00016 (03)
5.3.3. Sinus vibrations - Endurance:
Control curve recorded at test end given below:
50.000.10 1.00 10.000.20 0.30 0.40 0.50 0.70 2.00 3.00 4.00 5.00 7.00 20.00 30.00
Hz
10.00
0.10e-3
1.00e-3
0.01
0.10
1.00
0.20e-3
0.40e-3
2.00e-3
4.00e-3
0.02
0.04
0.20
0.40
2.00
4.00
Log
(Pea
k)
g
F Spectrum ReferenceF Spectrum UpAbortF Spectrum Low AbortF Spectrum UpAlarmF Spectrum Low AlarmF Spectrum AvgCtrl
curve 42
Acceleration measurement of P1, P2 and P3 points given below:
50.000.10 1.00 10.000.20 0.30 0.40 0.50 0.70 2.00 3.00 4.00 5.00 7.00 20.00 30.00
Hz
100.00
0.01
0.10
1.00
10.00
0.02
0.03
0.05
0.20
0.30
0.50
2.00
3.00
5.00
20.00
30.00
50.00
Log
(Pea
k)
mm
F Spectrum ReferenceF Spectrum UpAbortF Spectrum Low AbortF Spectrum UpAlarmF Spectrum Low AlarmF Spectrum AvgCtrlF Harmonic Spectrum P1
curve 43
RENV-INN-19-400328-1/A (00)
Page 42 out of 50 DQS ENV 000 FOR 00016 (03)
50.000.10 1.00 10.000.20 0.30 0.40 0.50 0.70 2.00 3.00 4.00 5.00 7.00 20.00 30.00
Hz
10.00
0.10e-3
1.00e-3
0.01
0.10
1.00
0.20e-3
0.40e-3
2.00e-3
4.00e-3
0.02
0.04
0.20
0.40
2.00
4.00
Log
(Pea
k)
g
F Spectrum ReferenceF Spectrum UpAbortF Spectrum Low AbortF Spectrum UpAlarmF Spectrum Low AlarmF Spectrum AvgCtrlF Harmonic Spectrum P2F Harmonic Spectrum P3
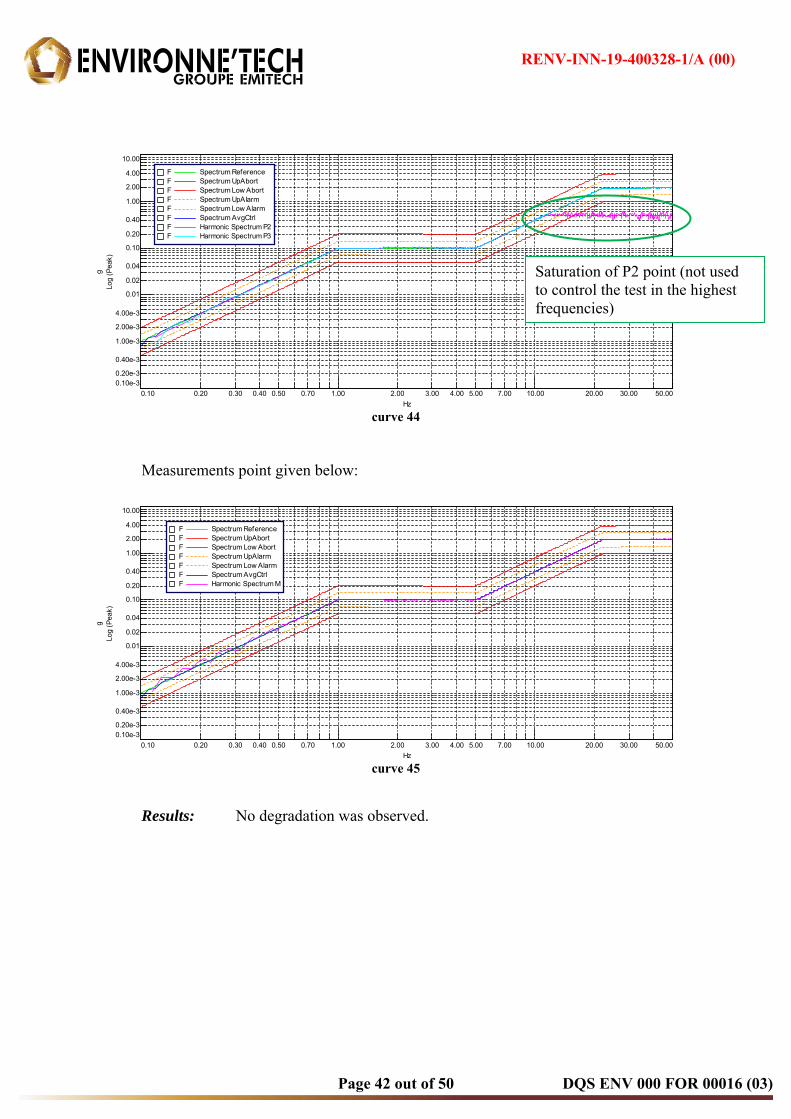
curve 44
Measurements point given below:
50.000.10 1.00 10.000.20 0.30 0.40 0.50 0.70 2.00 3.00 4.00 5.00 7.00 20.00 30.00
Hz
10.00
0.10e-3
1.00e-3
0.01
0.10
1.00
0.20e-3
0.40e-3
2.00e-3
4.00e-3
0.02
0.04
0.20
0.40
2.00
4.00
Log
(Pea
k)
g
F Spectrum ReferenceF Spectrum UpAbortF Spectrum Low AbortF Spectrum UpAlarmF Spectrum Low AlarmF Spectrum AvgCtrlF Harmonic Spectrum M
curve 45
Results: No degradation was observed.
Saturation of P2 point (not used to control the test in the highest frequencies)

RENV-INN-19-400328-1/A (00)
Page 43 out of 50 DQS ENV 000 FOR 00016 (03)
5.3.4. Sinus vibrations – RFR final:
Control curve recorded at test end given below:
50.000.10 1.00 10.000.20 0.30 0.40 0.50 0.70 2.00 3.00 4.00 5.00 7.00 20.00 30.00
Hz
10.00
0.10e-3
1.00e-3
0.01
0.10
1.00
0.20e-30.30e-3
0.50e-3
2.00e-3
3.00e-3
5.00e-3
0.020.03
0.05
0.200.30
0.50
2.003.00
5.00
Log
(Pea
k)
g
F Spectrum ReferenceF Spectrum UpAbortF Spectrum Low AbortF Spectrum UpAlarmF Spectrum Low AlarmF Spectrum AvgCtrl
curve 46
Acceleration measurement of P1, P2 and P3 points given below:
50.000.10 1.00 10.000.20 0.30 0.40 0.50 0.70 2.00 3.00 4.00 5.00 7.00 20.00 30.00
Hz
100.00
0.01
0.10
1.00
10.00
0.02
0.03
0.050.07
0.20
0.30
0.50
0.70
2.00
3.004.00
6.00
20.00
30.0040.00
60.00
Log
(Pea
k)
mm
1.00
0.10
LogF Harmonic Spectrum P1
F Spectrum ReferenceF Spectrum UpAbortF Spectrum Low AbortF Spectrum UpAlarmF Spectrum Low AlarmF Spectrum AvgCtrl
curve 47

RENV-INN-19-400328-1/A (00)
Page 44 out of 50 DQS ENV 000 FOR 00016 (03)
50.000.10 1.00 10.000.20 0.30 0.40 0.50 0.70 2.00 3.00 4.00 5.00 7.00 20.00 30.00
Hz
10.00
0.10e-3
1.00e-3
0.01
0.10
1.00
0.20e-30.30e-3
0.50e-3
2.00e-3
3.00e-3
5.00e-3
0.020.03
0.05
0.200.30
0.50
2.003.00
5.00
Log
(Pea
k)
g
1.00
0.10
Log
F Spectrum ReferenceF Spectrum UpAbortF Spectrum Low AbortF Spectrum UpAlarmF Spectrum Low AlarmF Spectrum AvgCtrlF Harmonic Spectrum P2F Harmonic Spectrum P3
curve 48
Measurements point given below:
50.000.10 1.00 10.000.20 0.30 0.40 0.50 0.70 2.00 3.00 4.00 5.00 7.00 20.00 30.00
Hz
10.00
0.10e-3
1.00e-3
0.01
0.10
1.00
0.20e-30.30e-3
0.50e-3
2.00e-3
3.00e-3
5.00e-3
0.020.03
0.05
0.200.30
0.50
2.003.00
5.00
Log
(Pea
k)
g
F Spectrum ReferenceF Spectrum UpAbortF Spectrum Low AbortF Spectrum UpAlarmF Spectrum Low AlarmF Spectrum AvgCtrlF Harmonic Spectrum M
curve 49
Saturation of P2 point (not used to control the test in the highest frequencies)

RENV-INN-19-400328-1/A (00)
Page 45 out of 50 DQS ENV 000 FOR 00016 (03)
50.000.12 1.00 10.000.20 0.30 0.40 0.50 0.60 0.80 2.00 3.00 4.00 5.00 6.00 8.00 20.00 30.00
Hz
1.85
0.18
1.00
0.30
0.40
0.50
0.60
0.700.80
Log/
180.00
-180.00
Pha
se°
32.06
FRF (Harmonic) M/P3FRF (Harmonic) M/P3
curve 50
Results: No degradation was observed. There is no resonance frequency.
RENV-INN-19-400328-1/A (00)
Page 46 out of 50 DQS ENV 000 FOR 00016 (03)
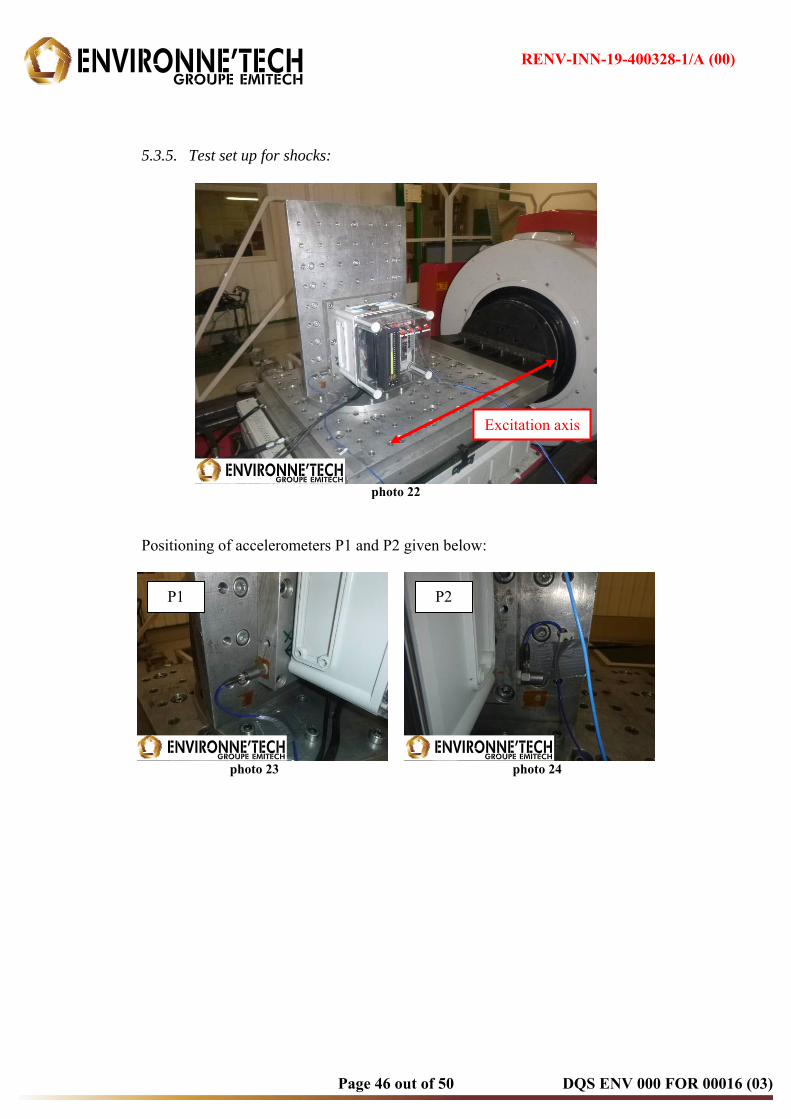
5.3.5. Test set up for shocks:
photo 22
Positioning of accelerometers P1 and P2 given below:
photo 23 photo 24
Excitation axis
P1 P2
RENV-INN-19-400328-1/A (00)
Page 47 out of 50 DQS ENV 000 FOR 00016 (03)
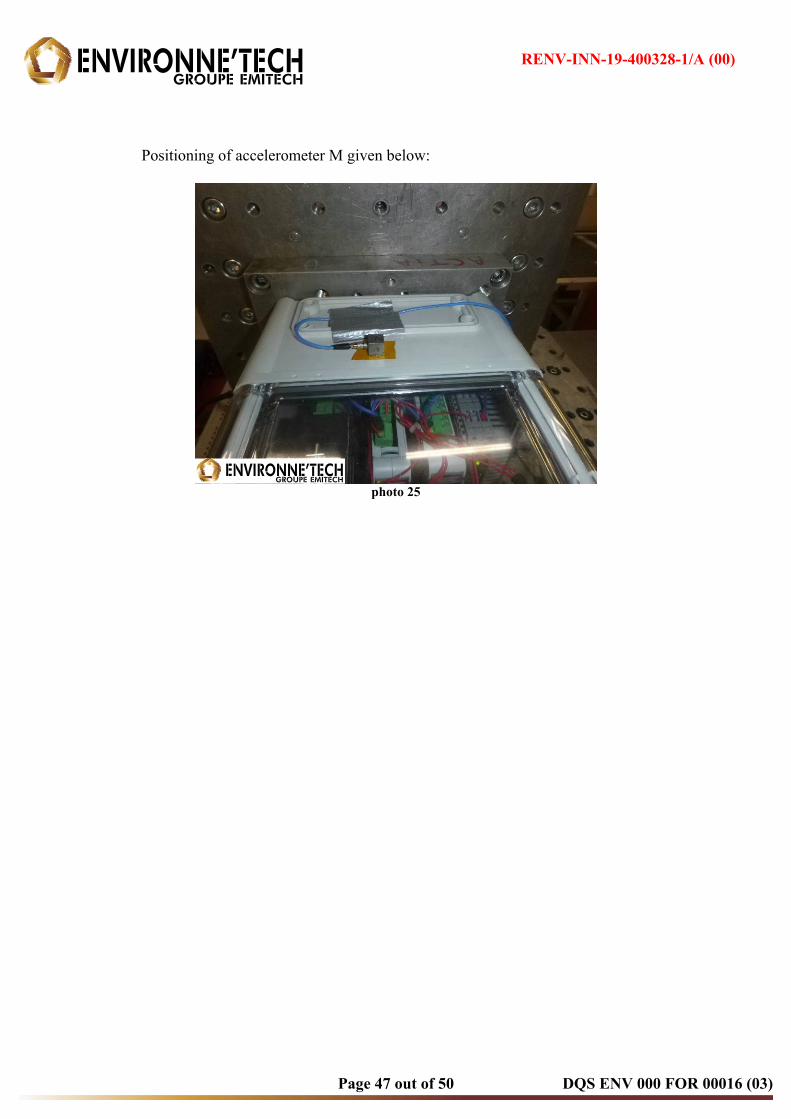
Positioning of accelerometer M given below:
photo 25

RENV-INN-19-400328-1/A (00)
Page 48 out of 50 DQS ENV 000 FOR 00016 (03)
5.3.6. Shock tests:
Control was done at P1 point.
Curve of the third positive impact given below. Control curve with P1 and P2 are given below:
0.200.05 0.10 0.150.06 0.07 0.08 0.09 0.11 0.12 0.13 0.14 0.16 0.17 0.18 0.19
s
18.00
-15.00
-10.00
0.00
10.00
-12.00
-8.00
-6.00
-4.00
-2.00
2.00
4.00
6.00
8.00
12.00
14.00
16.00
Rea
l
g
F Time ReferenceF Time Low ToleranceF Time Low AlarmF Time UpToleranceF Time UpAlarmF Time P1F Time P2
curve 51
Curve at M point given below:
0.200.05 0.10 0.150.06 0.07 0.08 0.09 0.11 0.12 0.13 0.14 0.16 0.17 0.18 0.19
s
18.00
-16.00
-10.00
0.00
10.00
-14.00
-12.00
-8.00
-6.00
-4.00
-2.00
2.00
4.00
6.00
8.00
12.00
14.00
16.00
Rea
l
g
F Time ReferenceF Time Low ToleranceF Time Low AlarmF Time UpToleranceF Time UpAlarmF Time P1F Time MxF Time MyF Time Mz
curve 52

RENV-INN-19-400328-1/A (00)
Page 49 out of 50 DQS ENV 000 FOR 00016 (03)
Curve of the third negative impact given below. Control curve with P1 and P2 are given below:
0.200.05 0.10 0.150.06 0.07 0.08 0.09 0.11 0.12 0.13 0.14 0.16 0.17 0.18 0.19
s
16.00
-18.00
-10.00
0.00
10.00
-16.00
-14.00
-12.00
-8.00
-6.00
-4.00
-2.00
2.00
4.00
6.00
8.00
12.00
14.00
Rea
l
g
F Time ReferenceF Time Low ToleranceF Time Low AlarmF Time UpToleranceF Time UpAlarmF Time P1F Time P2
curve 53
Curve at M point given below:
0.200.05 0.10 0.150.06 0.07 0.08 0.09 0.11 0.12 0.13 0.14 0.16 0.17 0.18 0.19
s
29.00
-28.00
-20.00
-10.00
0.00
10.00
20.00
-25.00
-15.00
-5.00
5.00
15.00
25.00
Rea
l
g
F Time ReferenceF Time Low ToleranceF Time Low AlarmF Time UpToleranceF Time UpAlarmF Time P1F Time MxF Time MyF Time Mz
curve 54

RENV-INN-19-400328-1/A (00)
Page 50 out of 50 DQS ENV 000 FOR 00016 (03)
6. CONCLUSION.
Specimen has been tested in accordance with the specifications described in section 3 of this report. At the end of tests, no degradation was observed.
Specimen is returned to the LOREME Company for final expertise.
End of report