summary of gsr acea s19 collision landscape analyses
TRANSCRIPT

© 2019 TRL Ltd
VRU-Proxi-08-02-R1 Summary of Previous GSR/ACEA and Current STATS19 Collision Landscape Analyses (Revision 1)
February 2019
the future of transport. © 2019 TRL Ltd
Click to add text
TRL Background
Previous Research
GSR/ACEA Background
Summary of GSR Approach
Summary of ACEA Analysis
Summary of Relevant GSR Outcomes
In-Progress STATS19 Research
STATS19 Analysis Approach
Definition of Total Populations
Specific Target Populations
Next Steps
Contents

© 2019 TRL Ltd
TRL Background
© 2017 TRL Ltd
the future of transport. © 2019 TRL Ltd
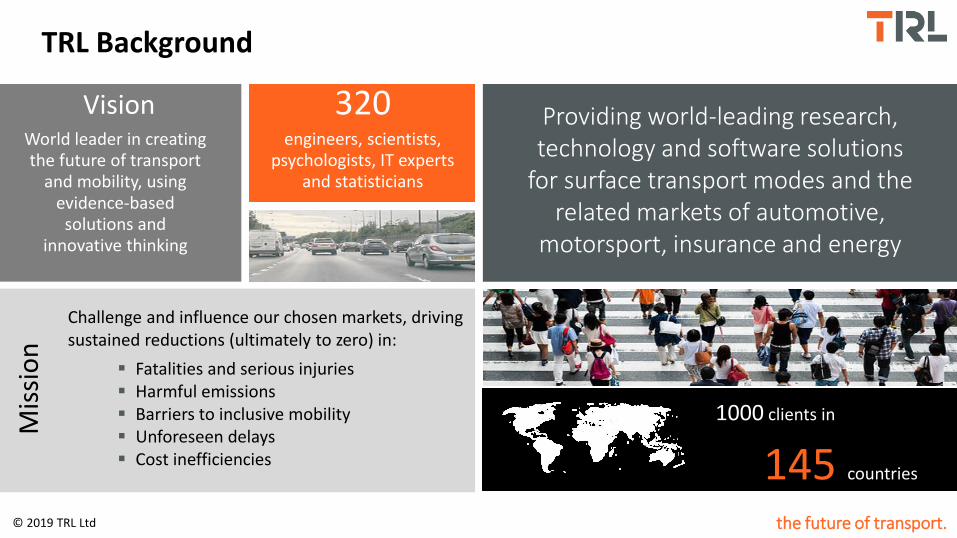
World leader in creating the future of transport
and mobility, using evidence-based
solutions and innovative thinking
Vision
Challenge and influence our chosen markets, driving sustained reductions (ultimately to zero) in:
Mis
sio
n
Fatalities and serious injuries Harmful emissions Barriers to inclusive mobility Unforeseen delays Cost inefficiencies
Providing world-leading research, technology and software solutions
for surface transport modes and the related markets of automotive,
motorsport, insurance and energy
320 engineers, scientists,
psychologists, IT experts and statisticians
1000 clients in
145 countries
TRL Background

the future of transport. © 2019 TRL Ltd
TRL Background…delivering impactful innovation
1969
The self-driving Citroën DS19
2018
London Smart Mobility Living Lab
2015
Gateway driverless shuttles
1972
The magic round- about, Swindon
1950's/70's
The UK Motorway network
1997
NCAP launched
1980's
Deflectometer
2016
Electric double decker bus
2014
TRL cycle infrastructure development
1960s
Early simulator
2012
London Summer Olympics
2017
HGV Truck Platooning

© 2019 TRL Ltd
Previous Research: ACEA/GSR Background
© 2017 TRL Ltd

the future of transport. © 2019 TRL Ltd
SFS
RFT
ALC
EDR
TPM
VIS
RUR
LAT
BFS-CNG
BFS-AFE
HED
REV
ACEA/GSR Background
AEB
AEB-PCD
LKA
ESS
ISA
DDR
SBR
F94
FFW
FSO
S95
PSI
Published research (GSR2 systematic review)
Extensive stakeholder consultation (GSR2 report)
ACEA Accidentology Results feed into GSR2 impact assessment
European Policy impact assessment (GSR2 technical annex)
How do GSR and ACEA fit together?
the future of transport. © 2019 TRL Ltd
Click to add text
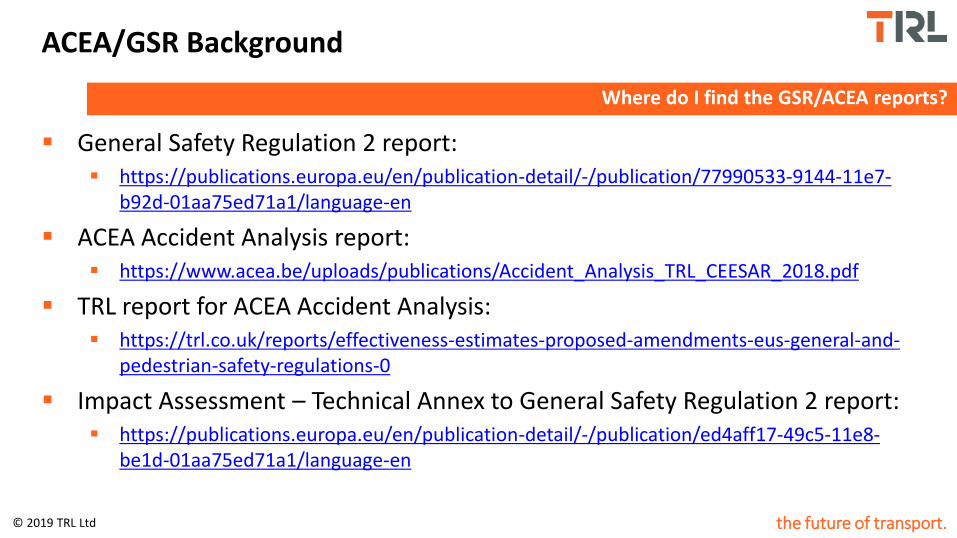
General Safety Regulation 2 report: https://publications.europa.eu/en/publication-detail/-/publication/77990533-9144-11e7-
b92d-01aa75ed71a1/language-en
ACEA Accident Analysis report: https://www.acea.be/uploads/publications/Accident_Analysis_TRL_CEESAR_2018.pdf
TRL report for ACEA Accident Analysis: https://trl.co.uk/reports/effectiveness-estimates-proposed-amendments-eus-general-and-
pedestrian-safety-regulations-0
Impact Assessment – Technical Annex to General Safety Regulation 2 report: https://publications.europa.eu/en/publication-detail/-/publication/ed4aff17-49c5-11e8-
be1d-01aa75ed71a1/language-en
ACEA/GSR Background
Where do I find the GSR/ACEA reports?

© 2019 TRL Ltd
Previous Research: Summary of GSR Approach
© 2017 TRL Ltd

the future of transport. © 2019 TRL Ltd
Click to add text
Objective:
To calculate concrete cost-effectiveness indicators and numbers of road casualties that could be prevented at an EU-28 level for sets of safety measures proposed by the European Commission and considered for mandatory implementation in new vehicles.
Summary of GSR Approach
GSR Objectives

the future of transport. © 2019 TRL Ltd
Click to add text
The specific scope of the study was defined as:
Geographic scope: EU-28
Vehicle categories covered: Cars (M1), Buses (M2&M3), Vans (N1), Trucks (N2&N3)
Evaluation period: 2021–2037
Baseline scenario: No further policy intervention in the transport sector, but voluntary improvements and effects of already implemented policies continue: Continued dispersion of mandatory vehicle safety measures into the legacy fleet and continued voluntary uptake of the safety measures under consideration.
Action scenario: 17 safety technologies made mandatory according to Commission proposal.
Summary of GSR Approach
GSR Scope

© 2019 TRL Ltd
Measure Description Applicable vehicle categories
AEB-VEH Autonomous emergency braking for vehicles (moving and stationary targets) M1 N1
AEB-PCD Autonomous emergency braking for pedestrians and cyclists M1 N1
ALC Alcohol interlock installation document M1 M2&M3 N1 N2&N3
DDR-DAD Drowsiness and attention detection M1 M2&M3 N1 N2&N3
DDR-ADR Advanced distraction recognition M1 M2&M3 N1 N2&N3
EDR Event data recorder M1 N1
ESS Emergency stop signal M1 M2&M3 N1 N2&N3
FFW-137 Full-width frontal occupant protection (current R137 configuration with Hybrid III ATDs)
M1 N1
FFW-THO Full-width frontal occupant protection (introduction of THOR-M ATDs and lower appropriate injury criteria thresholds to encourage adaptive restraints)
M1 N1
HED-MGI Adult head-to-windscreen impact (mandatory HIC limit in headform-to-glass impact tests; no mandatory A-pillar impact)
M1 N1
ISA-VOL Intelligent speed assistance (voluntary type system; can be overridden by driver and switched off for the rest of journey)
M1 M2&M3 N1 N2&N3
LKA-ELK Lane keeping assist (emergency lane keeping system that intervenes only in case of an imminent threat such as leaving the road, or leaving the lane with oncoming traffic)
M1 N1
PSI Pole side impact occupant protection M1 N1
REV Reversing camera system M1 M2&M3 N1 N2&N3
TPM Tyre pressure monitoring system M2&M3 N1 N2&N3
VIS-DET Front and side vulnerable road user detection and warning (no auto braking) M2&M3 N2&N3
VIS-DIV Minimum direct vision requirement (best-in-class approach) M2&M3 N2&N3

the future of transport. © 2019 TRL Ltd
Click to add text
VIS-DIV VIS-DET REV
Functionality: Improving the drivers situational awareness of VRU’s in close proximity to the vehicle
Best in class direct vision requirements for what
the driver can see through windscreen,
side windows and any additional windows
Sensor-based detection systems for alerting the driver to VRUs that are
manoeuvring around the vehicle.
Camera Monitoring Systems (CMS) for
increasing the driver’s field of vision while
reversing.
No automated braking
Front and sides of the vehicle Rear
Summary of GSR Approach
GSR Definitions of Relevant Safety Measure Functionality

the future of transport. © 2019 TRL Ltd
Click to add text
Approach of the study
Benefits considered: Monetary values of casualties prevented/mitigated (fatal, serious, slight) by safety measures
Costs considered: Cost to vehicle manufacturers (OEMs) of fitment of safety measures to new vehicles
Treatment of uncertainty: Interval, scenario and sensitivity analysis
Results: Benefit-to-cost ratios (BCRs) and numbers of casualties prevented. All results are in comparison to the baseline scenario.
Summary of GSR Approach
GSR Approach

the future of transport. © 2019 TRL Ltd
Click to add text
Note that the model takes into account:
The interactions of all measures when implemented together (to avoid double-counting of casualties prevented by different measures)
The voluntary uptake of the proposed measures expected to happen without policy intervention (baseline scenario)
The effects of already existing mandatory measures, which are still dispersing into the fleet (AEBS and LDWS for trucks and buses, ESC for all categories)
Discounting and inflation of monetary values
Summary of GSR Approach
GSR Approach

© 2019 TRL Ltd
Vehicle fleet calculation
Fleet dispersion model of safety measures for baseline and action
Proportion of new vehicles and fleet equipped
Cost estimates for safety measures per vehicle
Cost of fitment EU-28 per annum
Accident analysis
Stats19 and CARE
Target populations for safety measures
Measure effectiveness
Casualties prevented by measure
Monetary casualty unit values
Monetary benefit
EU-28 per annum
Remove casualties prevented from target population for
subsequent safety measures
Benefit simulation Cost calculation
Inflation and discounting
Net present value of benefits and costs
Subtract baseline scenario benefits and costs
Calculate benefit-to-cost ratios compared to baseline
BCR
Economic calculation

the future of transport. © 2019 TRL Ltd
Click to add text
Summary of GSR Approach
Clustering of Safety Measures – Passenger Cars (M1) and Vans (N1)
Driver Assistance DDR, ISA, ALC, TPM, EDR
Proportion of casualties prevented by reducing speed, distraction,
drink driving, better tyre maintenance…
Active Safety AEB, LKA, ESS, AEB-PCD, REV
Proportion of casualties prevented in front-to-rear shunts, run-off-
road, side swipe…
Passive Safety Front FFW
Passive Safety Rear
-
Passive Safety Side PSI
Passive Safety VRU HED
Proportion of casualties prevented in front, side, rear and
pedestrian/cyclist collisions
Remaining target population for active safety
Remaining target population for front collisions
Remaining EU Road Casualties
ESC
Target populations x Measure effectiveness
EU Road Casualties

the future of transport. © 2019 TRL Ltd
Click to add text
Summary of GSR Approach
Clustering of Safety Measures – Buses/Coaches (M2/M3) and Trucks (N2/N3)
Driver Assistance DDR, ISA, ALC, TPM, VIS-DIV
Proportion of casualties prevented by reducing speed, distraction,
drink driving, better tyre maintenance…
Active Safety ESS, REV, VIS-DET
Proportion of casualties prevented in reversing, turning left, run off
road…
Passive Safety Front
-
Passive Safety Rear
-
Passive Safety Side
-
Passive Safety VRU
-
Remaining target population for active safety
Remaining target population for front collisions
Remaining EU Road Casualties
Target populations x Measure effectiveness
EU Road Casualties
ESC LDW AEB

© 2019 TRL Ltd
Previous Research: ACEA Analysis
© 2017 TRL Ltd

the future of transport. © 2019 TRL Ltd
ACEA Analysis
• Sensing systems to increase driver’s view or warn of persons or obstacles when reversing
• Preference between camera and/or detection with visual/acoustic warning to be determined
VIS Forward and Side VRU detection and
cameras specifications
VIS: Warning VIS: Automated
Emergency Braking
• Detection and warning of VRU’s ahead and at side of vehicle
• Detection, warning and auto braking to avoid/mitigate collisions of VRU’s ahead and at side of vehicle
• Benefits less dependent on driver actions • Additional benefit in higher speed traffic scenarios • Includes crossing pedestrians • All speeds including pulling away from stationery and
very low speeds
Direct Vision
VIS: Best-in-Class Vision
• Remove highest chassis and adopt new cabs
• Improved direct vision through wind shield, passenger door and side windows
VIS: High Direct Vision
• Low forward position cab
• Much improved direct vision through wind shield and passenger door and side windows
• Benefits dependent on driver who needs to look at right time and take correct actions
• Beneficial when driving ahead and turning in low speeds, in dense traffic environment
REV
Reversing Detection or
cameras specifications
ACEA Definitions of Relevant Safety Measure Functionality

the future of transport. © 2019 TRL Ltd
ACEA Analysis
All Casualties • Includes casualties for other measures
Target Population • For a given measure • Phase 1 / RQ1 Pool of relevant casualties • Includes casualties for other measures
Refined Target Population • Phase 2 / RQ2 • Refined to account for effect of other
measures
Effectiveness Estimate • Phase 2 / RQ2 • More detailed assessment of effect of the
measure
France • BAAC • VOIESUR
Germany • GIDAS
UK • STATS19 • RAIDS
Pooled Research
ACEA Data Sources

the future of transport. © 2019 TRL Ltd
Safety Measure Casualty type TP source Vehicle type
TP casualties who benefit from measure
Fatal Seriously injured Slightly injured Total
VIS – improved front end design for direct and indirect driver vision
Pedestrians & pedal cyclists S19
N2 36 232 825 1,093 N3 275 564 1,015 1,854
ISA – Intelligent Speed Assistance All vehicle users & VRUs S19
M1 1,470 7,691 44,078 53,239 M2 0 27 109 136 M3 9 18 86 113 N1 18 190 1,551 1,759 N2 0 14 90 104 N3 54 68 321 443
FSO – Frontal impact Small Overlap crash test * M1 occupants S19+RAIDS M1 72 855 13,175 14,102 SFS – Side impact Far Side occupant crash test *† M1 occupants S19+RAIDS M1 133 - 181 896 – 1,713 10,723 -28,671 11,752 – 30,565
F94 – Frontal Impact Crash Test (removal of exemptions from Regulation 94)
M1 & N1 occupants S19
M1 49 661 7,214 7,924 N1 56 576 5,483 6,115
S95 – Side Impact Crash Test (removal of exemptions from Regulation 95)
M1 & N1 occupants S19
M1 13 156 2,382 2,551 N1 15 148 2,460 2,623
HED – Adult Head to Windscreen Area †‡ Pedestrians S19+RAIDS M1 107 – 269 1218 – 3046 - (1325 – 3315)
Cyclists S19+RAIDS M1 18 534 - (552) REV – Reversing Detection Note: Stats19 only includes collisions on the public highway and excludes those occurring in car parks, service yards and private workplace sites.
Pedestrians & pedal cyclists S19
N2, N3, O3+O4
7 41 136 177
ACEA Analysis
ACEA GB Target Population Estimations (5 year total)

the future of transport. © 2019 TRL Ltd
ACEA Analysis
VIS Killed Seriously Injured
Slightly Injured
Total Casualties
N2 TP (RQ1) 36 232 825 1,093
CS (RQ2) 1 7 25 33
N3 TP (RQ1) 275 564 1,016 1,855
CS (RQ2) 8 17 30 55
Nunknown TP (RQ1) 1 14 56 71
CS (RQ2) 0 0 2 2
Total TP (RQ1) 312 810 1,897 3,019
CS (RQ2) 9 24 57 90
Not affected Upper CS estimate Predicted CS estimate Lower CS estimate
ACEA Casualty Savings (5 year total) and Effectiveness: Best-in-Class Vision
Overall effectiveness value for requiring “best-in-class vision”: 3% (1%-36%) Based on STATS19/RAIDS data only

the future of transport. © 2019 TRL Ltd
ACEA Analysis
VIS Best in Class: Savings over a 5 year period 2011-2015
VIS Killed Seriously Injured
Slightly Injured
Total Casualties
N2 TP (RQ1) 36 232 825 1,093
CS (RQ2) 10 63 223 296
N3 TP (RQ1) 275 564 1,016 1,855
CS (RQ2) 74 153 274 501
Nunknown TP (RQ1) 1 14 56 71
CS (RQ2) 0 4 15 19
Total TP (RQ1) 312 810 1,897 3,019
CS (RQ2) 84 220 512 816
Not affected Upper CS estimate Predicted CS estimate Lower CS estimate
Overall effectiveness value for requiring “high direct vision”: 27% (1%-48%) Based on STATS19/RAIDS data only
ACEA Casualty Savings (5 year total) and Effectiveness: High Direct Vision

the future of transport. © 2019 TRL Ltd
VIS Killed Seriously Injured
Slightly Injured
Total Casualties
N2 TP (RQ1) 36 232 825 1,093
CS (RQ2) 14 93 330 437
N3 TP (RQ1) 275 564 1,016 1,855
CS (RQ2) 110 226 407 743
Nunknown TP (RQ1) 1 14 56 71
CS (RQ2) 0 5 23 28
Total TP (RQ1) 312 810 1,897 3,019
CS (RQ2) 124 324 760 1,208
ACEA Analysis
Not affected Upper CS estimate Predicted CS estimate Lower CS estimate
Overall effectiveness value for requiring “VRU detection”: 40% (6%-47%) Based on STATS19/RAIDS data only
ACEA Casualty Savings (5 year total) and Effectiveness: VRU Detection

the future of transport. © 2019 TRL Ltd
ACEA Analysis
VIS Killed Seriously Injured
Slightly Injured
Total Casualties
N2 TP (RQ1) 36 232 825 1,093
CS (RQ2) 15 102 363 480
N3 TP (RQ1) 275 564 1,016 1,855
CS (RQ2) 121 248 448 817
Nunknown TP (RQ1) 1 14 56 71
CS (RQ2) 0 7 25 32
Total TP (RQ1) 312 810 1,897 3,019
CS (RQ2) 136 357 836 1,329
Not affected Upper CS estimate Predicted CS estimate Lower CS estimate
Overall effectiveness value for requiring “VRU AEB”: 44% (25%-71%) Based on STATS19/RAIDS data only
ACEA Casualty Savings (5 year total) and Effectiveness: VRU AEB

the future of transport. © 2019 TRL Ltd
ACEA Analysis
Overall effectiveness value for requiring reversing detection & camera systems: ACEA – no evaluation of the potential benefits possible as sample size was too small
GSR adopted the below: M1/N1:
41% (95% confidence interval: 12% to 61%), based on Keall et al. (2017).
M2/M3/N2/N3: Assumed 33% effective – based on ACEA consultation
ACEA Casualty Savings (5 year total) and Effectiveness: Reversing Detection/Camera Systems
© 2019 TRL Ltd
Previous Research: Summary of GSR Outcomes
© 2017 TRL Ltd

the future of transport. © 2019 TRL Ltd
Click to add text
Summary of GSR Outcomes
Values greater than 1 indicate that the benefits are greater than the costs
Cost-effectiveness Benefit-to-cost ratios (BCR) of the Commission Proposal
Years: 2021–2037 EU-28 Compared to baseline scenario
Overall Cost-Effectiveness Outcomes

the future of transport. © 2019 TRL Ltd
Click to add text
Cars Buses Vans Trucks
Fatalities 21,337 227 1,283 1,947
Serious casualties 126,390 2,410 6,917 5,023
Slight casualties 470,747 8,174 23,486 13,274
Number of casualties prevented by the Commission Proposal split by vehicle categories over the 2021–2037
evaluation period across EU-28 compared to baseline scenario
Overall Casualty Saving Benefit Outcomes
Summary of GSR Outcomes

the future of transport. © 2019 TRL Ltd
Summary of GSR Outcomes
VIS-DET
M2/M3: 40% N2/N3: 40%
No preceding safety measure interactions Other measures
VIS-DIV
M2/M3: Pedestrian/cyclist in front/side impact. Blind spot as a contributory factor. N2/N3: Pedestrian/cyclist in front/side impact. Adjusted to average population in France/Germany/UK
M2/M3: 24% N2/N3: 3%
Target Population Description
Potential Benefit %
REV
M1/N1: 41% M2/M3/N2/N3: 33%
Vehicle type
Pedestrian/cyclist collision with reversing vehicle. Adjusted for off-road collisions and populations
M2, M3, N2, N3 M1, M2, M3, N1, N2, N3
Front and Side Detection System
Best-in-Class DV Proposed
Requirement Reversing Cameras
Summary of Relevant GSR Input Information

© 2019 TRL Ltd
In-Progress STATS19 Research: STATS19 Analysis Approach
© 2017 TRL Ltd

the future of transport. © 2019 TRL Ltd
Click to add text
All vehicles categorised into Dir. 2007/46/EC categories using STATS19 data
STATS19 variables used to define total population of casualties
Further criteria to define target populations for each safety measure
Target populations split by vehicle category to determine regulation scope
Target populations presented as the number of casualties per annum and monetised cost to society per annum
Target populations due to be scaled to European/global level
Monetised cost to society figures used: Fatal - €1.87million
Serious - €243,100
Slight - €18,700
STATS19 Analysis Approach
Introduction to STATS19 Analysis Approach

the future of transport. © 2019 TRL Ltd
Click to add text
STATS19 is a national database of reported injury collisions on public roads in Great Britain
Data for 2011-2015 has been used for this analysis
Data is recorded at four levels
Collision details e.g. location, road type, weather/lighting conditions
Vehicle details e.g. vehicle type, vehicle manoeuvre, vehicle location
Casualty details e.g. casualty class, casualty location/movement (if pedestrian)
Contributory factors – factors which the police felt contributed to the collision e.g. ‘failed to look properly’
Enhanced vehicle data is also recorded for c.76% of vehicles, including max. gross vehicle weight, body type and wheelplan
STATS19 Analysis Approach
Introduction to STATS19

the future of transport. © 2019 TRL Ltd
Click to add text
STATS19 Analysis Approach
Categorisation of Vehicles using STATS19
Category European definition S19 definition used if enhanced vehicle data available1
S19 definition used if enhanced vehicle data not available
M1 Passenger car not more than 8 passenger seats
Vehicle type = car or taxi Passenger seats: 8 or less TRL vehicle segment not equal to van2
Vehicle type = car or taxi
M2 Passenger vehicle with more than 8 passenger seats and maximum mass not exceeding 5t
Vehicle type = minibus or bus/coach Max gross vehicle weight ≤ 5t.
Vehicle type = minibus
M3 Passenger vehicle with more than 8 passenger seats and maximum mass exceeding 5t
Vehicle type = minibus or bus/coach Max gross vehicle weight > 5t.
Vehicle type = bus/coach
N1 Goods vehicles not exceeding 3.5t Vehicle type = any goods vehicle category Max gross vehicle weight ≤ 3.5t M1 vehicles with TRL vehicle segment equal to van
Vehicle type = goods vehicles ≤ 3.5t
N2 Goods vehicles between 3.5t and 12t Vehicle type = any goods vehicle category Max gross vehicle weight > 3.5t and ≤ 12t.
Vehicle type = goods vehicles > 3.5t and <7.5t
N3 Goods vehicles having a maximum mass exceeding 12t
Vehicle type = any goods vehicle category Max gross vehicle weight >12t.
Vehicle type = goods vehicles ≥ 7.5t
Nunknown NA Vehicle type = goods vehicle unknown weight
1For M1 the required enhanced vehicle data was seat capacity and for all other categories the required enhanced vehicle data was max gross vehicle weight 2TRL segment criteria only applies to those vehicles with make and model vehicle data available

© 2019 TRL Ltd
In-Progress STATS19 Research: Total Population
© 2017 TRL Ltd

the future of transport. © 2019 TRL Ltd
Click to add text
VRU casualties 2011-2015: 320,638 (64,127.6 per annum)
VRU casualties involved in ‘single vehicle’1 collisions with an M/N vehicle per annum: 53,180.4 (83% of all)
VRU casualties involved in ‘single vehicle’ collisions with an M/N vehicle attended by a police officer: 40,846.4 (77% of all ‘single vehicle’)
‘Police officer attended’ criteria only needed for analysis of contributory factor data therefore not included in definition of total population
VRU casualties involved in ‘single vehicle’ collisions on roads with speed limit ≤20mph: 1,766.8 (3% of all ‘single vehicle’)
VRU casualties involved in ‘single vehicle’ collisions on roads with speed limit ≤30mph: 45,914.4 (86% of all ‘single vehicle’)
Total Population
Refinement of Total Population
1 'Single vehicle' collision defined as collision involving either one vehicle and a pedestrian, or a pedal cyclist/PTW and one other vehicle

the future of transport. © 2019 TRL Ltd
Click to add text
Collision landscapes for ≤20 mph/≤30 mph speed limit filters compared for different vehicle categories during relevant collision scenarios:
M1/M2/M3/N1/N2/N3
Left Turn, Moving Off, Slowing/Stopping
Comparison of % differences in proportions of all collisions on roads with speed limit for different casualties, severities and vehicle categories
Differences between all collisions and ≤20 mph speed limit
Left turn: 15.9%; Moving Off: 5.3%; Slowing/Stopping: 13.9% - NB: large variance
Differences between all collisions and ≤30 mph speed limit
Left turn: 5.3%; Moving Off: 1.0%; Slowing/Stopping: 2.5%
Considerable difference in collision landscape demography
Total Population
Refinement of Total Population – Speed Limit Criteria

the future of transport. © 2019 TRL Ltd
Click to add text
RAIDS case-by-case analysis of 26 cases of N2/N3 vs. VRU collisions shows:
Of the 14 collisions with low/very low vehicle impact speeds (i.e. 0-29 kph), 64% occurred on a road with a speed limit of ≥40 mph
Low speed manoeuvres still occur on roads with speed limits of ≥40 mph
E.g. vehicle turning left/moving off after having been stopped at traffic lights on a road with a posted 40 mph speed limit
It is proposed that no speed limit filter is applied to the total population
Total Population
Final total population definition: Annual number of VRU casualties1 from ‘single vehicle’ collisions
with M/N category vehicles between 2011 and 2015
Refinement of Total Population – Speed Limit Criteria
1 Casualties currently calculated for GB only

the future of transport. © 2019 TRL Ltd
Click to add text
Vehicle Category
Pedestrian Cyclist PTW Societal Cost (€M) Fatal Serious Slight Fatal Serious Slight Fatal Serious Slight
M1 236.4 3,862.6 14,601.0 46.4 2,292.8 13,105.8 136.6 2,816.6 9,383.2 3,659.0
M2 1.8 19.2 63.0 0.2 8.0 34.6 1.0 8.0 26.0 16.5
M3 28.2 216.8 822.0 4.0 55.0 282.2 5.0 28.6 102.2 165.2
N1 30.4 304.4 1,134.8 6.2 232.8 1,123.4 19.2 258.4 858.6 356.0
N2 6.0 32.6 112.0 2.4 23.6 94.2 3.0 22.0 66.0 45.4
N3 41.6 71.6 121.8 17.0 62.0 143.8 12.0 57.8 110.8 185.6
Nunknown 0.2 1.6 8.4 0.0 2.4 7.4 0.0 1.8 3.0 2.1
Total 344.6 4,508.8 16,863.0 76.2 2,676.6 14,791.4 176.8 3,193.2 10,549.8 4,429.8
Total Population
Total annual number of VRU casualties (GB)

the future of transport. © 2019 TRL Ltd
Click to add text
Total Population
Total annual societal costs of VRU casualties (GB)
Total annual societal cost to GB of €4.43bn
Collisions between M1 vehicles and VRUs have highest occurrence and societal costs
Ranking of societal costs:
M1>N1>N3>M3>N2>M2
Specific target populations (TP) derived from top-level total population

© 2019 TRL Ltd
In-Progress STATS19 Research: Specific Target Populations
© 2017 TRL Ltd
the future of transport. © 2019 TRL Ltd
Click to add text
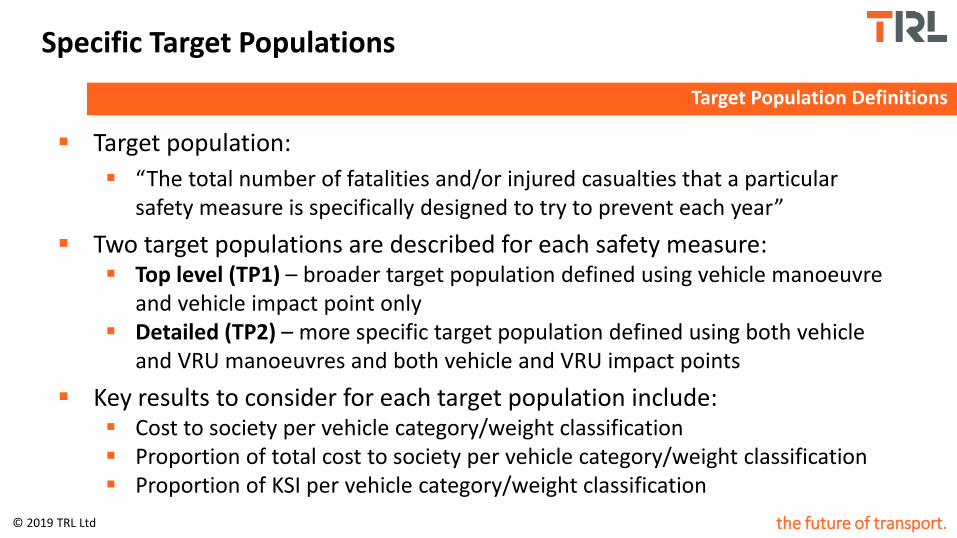
Target population:
“The total number of fatalities and/or injured casualties that a particular safety measure is specifically designed to try to prevent each year”
Two target populations are described for each safety measure: Top level (TP1) – broader target population defined using vehicle manoeuvre
and vehicle impact point only Detailed (TP2) – more specific target population defined using both vehicle
and VRU manoeuvres and both vehicle and VRU impact points
Key results to consider for each target population include: Cost to society per vehicle category/weight classification Proportion of total cost to society per vehicle category/weight classification Proportion of KSI per vehicle category/weight classification
Specific Target Populations
Target Population Definitions

© 2019 TRL Ltd
Blind-Spot Information System (BSIS)
© 2017 TRL Ltd

the future of transport. © 2019 TRL Ltd
Click to add text
Specific Target Populations: BSIS
BSIS Target Population Definitions
Top level target population (TP1): Vehicle manoeuvre = left turn Vehicle impact = front or nearside
Detailed target population (TP2):
Pedestrian Cyclist/PTW Vehicle
manoeuvre VRU manoeuvre Vehicle manoeuvre
Vehicle impact
VRU manoeuvre VRU impact
Left turn
Crossing from driver’s n/s In carriageway, not crossing Walking along back to traffic Walking along facing traffic
Left turn Nearside Front
Going ahead LH bend/RH bend/other Moving off Overtaking on n/s Slowing or stopping Left turn Waiting to go ahead Waiting to turn left/right
Offside
OR
Going ahead LH bend/RH bend/other Overtaking moving vehicle on its o/s Changing lane to left
Nearside
Going ahead LH bend/RH bend/other Moving off Overtaking on n/s Slowing or stopping Left turn Waiting to go ahead Waiting to turn left/right
Offside

the future of transport. © 2019 TRL Ltd
Click to add text
Vehicle Category
Target Population
Pedestrian Cyclist PTW Societal Cost (€M)
% of Total Cost (%) Fatal Serious Slight Fatal Serious Slight Fatal Serious Slight
M1 TP1 2.4 114.2 591.2 0.8 188.2 1,513.6 0.8 49.6 317.4 138.3 3.8%
TP2 1.6 68.6 345.8 1.8 153.6 1,034.0 0.8 50.6 324.0 106.0 2.9%
M2 TP1 0.0 0.4 3.4 0.0 0.2 4.6 0.0 0.2 0.6 0.4 2.2%
TP2 0.0 0.2 1.6 0.0 0.4 2.6 0.0 0.0 1.8 0.3 1.6%
M3 TP1 2.8 12.6 34.0 1.0 2.0 14.8 0.0 0.8 3.0 11.8 7.2%
TP2 1.8 9.6 21.6 0.6 10.2 62.0 0.0 1.0 5.0 11.2 6.8%
N1 TP1 1.2 10.0 50.6 0.2 23.6 171.4 0.0 6.0 41.4 17.2 4.8%
TP2 0.8 6.4 31.4 0.4 24.0 157.2 0.0 4.4 41.8 15.0 4.2%
N2 TP1 1.0 2.6 7.6 0.2 3.2 12.6 0.0 0.0 3.2 4.1 9.0%
TP2 0.8 2.0 4.6 0.4 5.6 22.8 0.0 0.4 3.8 4.8 10.5%
N3 TP1 2.0 5.8 10.8 5.8 14.4 21.0 0.4 2.0 7.4 21.5 11.6%
TP2 1.8 4.2 6.8 5.0 14.2 38.6 1.2 2.4 9.8 21.0 11.3%
Nunknown
TP1 0.0 0.2 0.2 0.0 0.2 1.2 0.0 0.0 0.0 0.1 5.8%
TP2 0.0 0.0 0.2 0.0 0.4 1.0 0.0 0.4 0.0 0.2 10.2%
Total TP1 9.4 145.8 697.8 8.0 231.8 1,739.2 1.2 58.6 373.0 193.4 4.4%
TP2 6.8 91.0 412.0 8.2 208.4 1,318.2 2.0 59.2 386.2 158.5 3.6%
Specific Target Populations: BSIS
Annual Target Populations for BSIS VRU casualties (GB)

the future of transport. © 2019 TRL Ltd
Click to add text
Specific Target Populations: BSIS
Total annual societal costs of BSIS VRU casualties (GB): TP1
BSIS Target Population 1
Total annual societal cost to GB of €193M
Collisions between M1 vehicles and VRUs have highest occurrence and societal costs
Cyclists most affected casualty (apart from M3)
Ranking of societal costs:
M1>N3>N1>M3>N2>M2

the future of transport. © 2019 TRL Ltd
Click to add text
Specific Target Populations: BSIS
Total annual societal costs of BSIS VRU casualties (GB): TP2
BSIS Target Population 2
Total annual societal cost to GB of €159M
Collisions between M1 vehicles and VRUs have highest occurrence and societal costs
Cyclists most affected casualty (apart from M3)
Ranking of societal costs:
M1>N3>N1>M3>N2>M2

the future of transport. © 2019 TRL Ltd
Click to add text
Vehicle Category
Target Population
Pedestrian Cyclist PTW Societal Cost (€M)
% of Total Cost (%) Fatal Serious Slight Fatal Serious Slight Fatal Serious Slight
N2 ≤7.5T TP1 0.4 1.8 5.4 0.2 1.4 8.6 0.0 0.0 2.2 2.2 7.3%
TP2 0.2 1.2 3.2 0.0 2.8 11.0 0.0 0.2 2.4 1.7 5.6%
N2 >7.5T TP1 0.0 0.2 0.6 0.0 0.6 0.4 0.0 0.0 0.4 0.2 4.4%
TP2 0.0 0.2 0.6 0.4 0.2 0.8 0.0 0.0 0.0 0.9 19.6%
N2un_GVW
TP1 0.6 0.6 1.6 0.0 1.2 3.6 0.0 0.0 0.6 1.7 16.2%
TP2 0.6 0.6 0.8 0.0 2.6 11.0 0.0 0.2 1.4 2.2 21.0%
N3 ≤18T TP1 0.8 0.8 3.2 1 5.2 4.8 0.0 0.6 1.8 5.2 16.0%
TP2 0.8 0.8 2.2 1.4 2.8 4.0 0.0 0.6 1.6 5.3 16.3%
N3 >18T TP1 1.2 3.4 5.6 4.6 7.8 10.6 0.2 0.6 4.2 14.5 11.5%
TP2 1.0 2.4 3.2 3.0 7.8 20.8 0.8 0.4 5.2 12.1 9.6%
N3un_GVW
TP1 0.0 0.8 2 0.2 1 4.2 0.2 0.8 1 0.3 1.1%
TP2 0.0 0.6 1.4 0.6 3.2 12.2 0.4 1.4 3.0 3.4 12.5%
Specific Target Populations: BSIS
Annual Target Populations for BSIS VRU casualties (GB): N2/N3 Weights

the future of transport. © 2019 TRL Ltd
Click to add text
Specific Target Populations: BSIS
Total annual societal costs of BSIS VRU Casualties (GB): N2/N3 Weights

the future of transport. © 2019 TRL Ltd
Click to add text
Specific Target Populations: BSIS
Injury severity as a proportion of BSIS VRU casualties for each vehicle category (GB)
the future of transport. © 2019 TRL Ltd
Click to add text
Specific Target Populations: BSIS
BSIS Proposed Regulation Scope
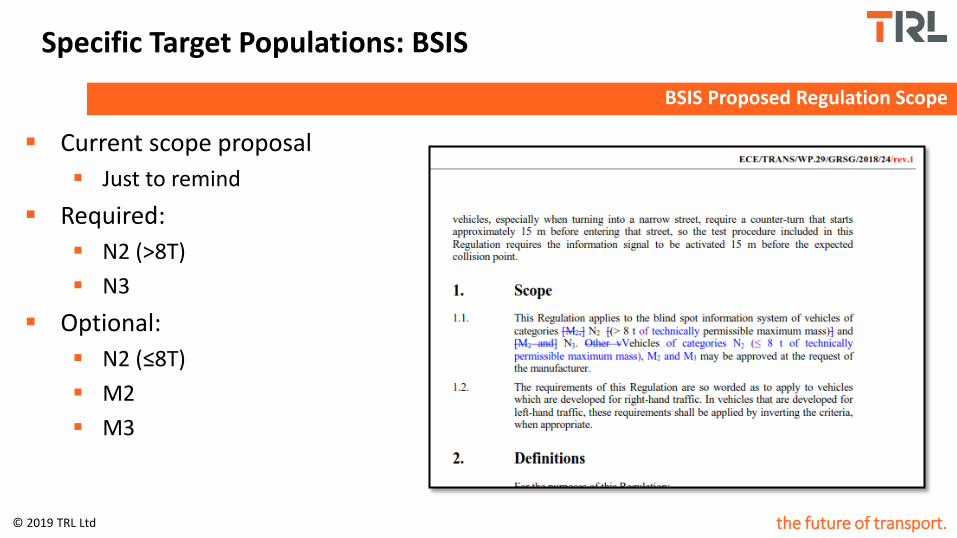
Current scope proposal
Just to remind
Required:
N2 (>8T)
N3
Optional:
N2 (≤8T)
M2
M3

the future of transport. © 2019 TRL Ltd
Click to add text
VRU collisions relevant to BSIS dominated by collisions with M1 vehicles: Should M1/N1 vehicles be considered in scope?
Ranking of vehicle category priority: Societal costs: M1>N3>N1>M3>N2>M2 Proportion of total societal costs for category: N3>N2>M3>N1>M1>M2 If N2/N3 in scope, should M3 be considered in scope?
Considering N2/N3 scope exclusions based on GVW: N2≤7.5T has larger TP than N2>7.5T should N2≤7.5T be considered in scope? N3≤18T and N3>18T both have larger TP than all N2 category vehicles
Considering injury severities: N3, N2, M3 all have greater proportion of KSI cost than M1
Conclusions not affected by selection of target population definition (TP1/TP2)
Specific Target Populations: BSIS
BSIS Collision Landscape Conclusions Relating to Vehicle Categories

the future of transport. © 2019 TRL Ltd
Click to add text
Specific Target Populations: BSIS
BSIS Regulatory Scope: Selection of Applicable Vehicle Categories
Vehicle Category
Societal Cost % of Total
Cost Injury
Severity In Scope of GSR Policy
Proposed BSIS Scope?
M1
M2
M3
N1
N2≤8T
N2>8T
N3≤18T
N3>18T
Legend Societal Cost Green: >€10M Orange: >€1M Red: <€1M % Total Cost: Green: >5% Orange: >2% Red: <2% Injury Severity: M1: Baseline Green: >M1 %KSI Orange: ~M1 %KSI Red: <M1 %KSI BSIS Scope: Green: 1+ green Orange: 1+ orange Red: 0 orange

© 2019 TRL Ltd
Reversing Camera & Detection System (REV)
© 2017 TRL Ltd

the future of transport. © 2019 TRL Ltd
Click to add text
Specific Target Populations: REV
REV Target Population Definitions
Top level target population (TP1): Vehicle manoeuvre = reversing Vehicle impact = rear
Detailed target population (TP2):
Pedestrian Cyclist/PTW Vehicle
manoeuvre VRU manoeuvre Vehicle manoeuvre
Vehicle impact
VRU manoeuvre VRU impact
Reversing
Crossing from driver’s n/s Crossing from driver’s o/s In carriageway, not crossing Walking along back to traffic Walking along facing traffic
Reversing Rear
Moving off Slowing or stopping Waiting to go ahead Waiting to turn left/right
-
OR
Reversing Rear Going ahead LH bend/RH bend/other Offside Nearside
??

the future of transport. © 2019 TRL Ltd
Click to add text
Vehicle Category
Target Population
Pedestrian Cyclist PTW Societal Cost (€M)
% of Total Cost (%) Fatal Serious Slight Fatal Serious Slight Fatal Serious Slight
M1 TP1 6.6 185.0 1,119.2 0.0 12.6 133.0 0.0 8.4 83.2 87.4 2.4%
TP2 2.6 103.0 617.2 0.0 5.8 62.8 0.0 2.8 48.6 45.6 1.2%
M2 TP1 0.0 2.6 7.6 0.0 0.0 0.2 0.0 0.0 1.2 0.8 4.9%
TP2 0.0 1.4 5.4 0.0 0.0 0.2 0.0 0.0 0.8 0.5 2.8%
M3 TP1 0.2 0.8 4.6 0.0 0.0 0.0 0.0 0.0 2.0 0.7 0.4%
TP2 0.2 0.4 2.4 0.0 0.0 0.0 0.0 0.0 1.0 0.5 0.3%
N1 TP1 3.2 42.6 189.2 0.0 1.4 23.4 0.0 4.4 49.6 22.7 6.4%
TP2 1.0 26.0 103.4 0.0 0.4 12.6 0.0 2.8 36.4 11.8 3.3%
N2 TP1 0.6 3.2 10.0 0.0 0.0 0.6 0.0 0.6 4.2 2.3 5.1%
TP2 0.4 1.8 4.8 0.0 0.0 0.4 0.0 0.6 4.0 1.5 3.3%
N3 TP1 0.6 2.0 9.0 0.0 0.0 0.8 0.0 0.6 4.8 2.0 1.1%
TP2 0.2 1.6 4.2 0.0 0.0 0.2 0.0 0.4 3.0 1.0 0.5%
Nunknown
TP1 0.0 0.0 1.0 0.0 0.0 0.2 0.0 0.0 0.0 0.0 1.1%
TP2 0.0 0.0 0.2 0.0 0.0 0.0 0.0 0.0 0.0 0.0 0.2%
Total TP1 11.2 236.2 1,340.6 0.0 14.0 158.2 0.0 14.0 145.0 115.9 2.6%
TP2 4.4 134.2 737.6 0.0 6.2 76.2 0.0 6.6 93.8 60.9 1.4%
Specific Target Populations: REV
Annual Target Populations for REV VRU casualties (GB)

the future of transport. © 2019 TRL Ltd
Click to add text
Specific Target Populations: REV
Total annual societal costs of REV VRU casualties (GB): TP1
REV Target Population 1
Total annual societal cost to GB of €116M
Collisions between M1 vehicles and VRUs have highest occurrence and societal costs
Pedestrians most affected casualty
Ranking of societal costs:
M1>N1>N2>N3>M2>M3
the future of transport. © 2019 TRL Ltd
Click to add text
Specific Target Populations: REV
Total annual societal costs of REV VRU casualties (GB): TP2
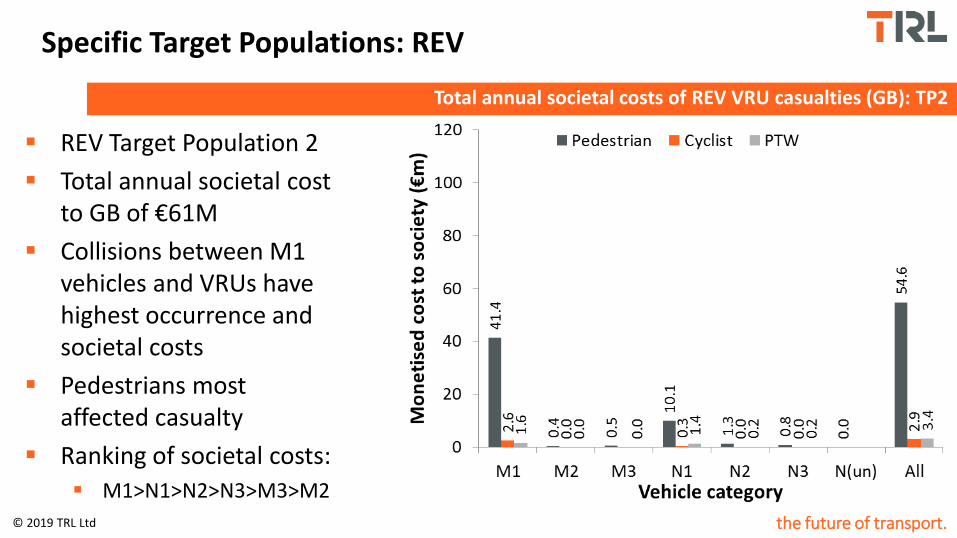
REV Target Population 2
Total annual societal cost to GB of €61M
Collisions between M1 vehicles and VRUs have highest occurrence and societal costs
Pedestrians most affected casualty
Ranking of societal costs:
M1>N1>N2>N3>M3>M2

the future of transport. © 2019 TRL Ltd
Click to add text
Vehicle Category
Target Population
Pedestrian Cyclist PTW Societal Cost (€M)
% of Total Cost (%) Fatal Serious Slight Fatal Serious Slight Fatal Serious Slight
N2 ≤7.5T TP1 0.6 2.0 5.4 0.0 0.0 0.2 0.0 0.4 2.6 1.9 6.3%
TP2 0.4 1.2 2.8 0.0 0.0 0.0 0.0 0.4 2.6 1.2 4.0%
N2 >7.5T TP1 0.0 0.0 0.6 0.0 0.0 0.0 0.0 0.0 0.6 0.0 0.0%
TP2 0.0 0.0 0.2 0.0 0.0 0.0 0.0 0.0 0.4 0.0 0.0%
N2un_GVW
TP1 0.0 1.2 4.0 0.0 0.0 0.4 0.0 0.2 1.0 0.4 3.8%
TP2 0.0 0.6 1.8 0.0 0.0 0.4 0.0 0.2 1.0 0.3 2.9%
N3 ≤18T TP1 0.2 0.4 2.4 0.0 0.0 0.2 0.0 0.2 1.2 0.6 1.9%
TP2 0.2 0.4 0.8 0.0 0.0 0.2 0.0 0.2 1.0 0.6 1.9%
N3 >18T TP1 0.4 0.6 3.6 0.0 0.0 0.4 0.0 0.4 2.6 1.1 0.9%
TP2 0.0 0.4 1.8 0.0 0.0 0.0 0.0 0.2 1.4 0.2 0.2%
N3un_GVW
TP1 0.0 1.0 2.4 0.0 0.0 0.0 0.0 0.0 0.8 0.3 1.1%
TP2 0.0 0.8 1.4 0.0 0.0 0.0 0.0 0.0 0.4 0.2 0.7%
Specific Target Populations: REV
Annual Target Populations for REV VRU casualties (GB): N2/N3 Weights

the future of transport. © 2019 TRL Ltd
Click to add text
Specific Target Populations: REV
Total annual societal costs of REV VRU Casualties (GB): N2/N3 Weights

the future of transport. © 2019 TRL Ltd
Click to add text
Specific Target Populations: REV
Injury severity as a proportion of REV VRU casualties for each vehicle category (GB)
the future of transport. © 2019 TRL Ltd
Click to add text
Specific Target Populations: REV
REV Proposed Regulation Scope
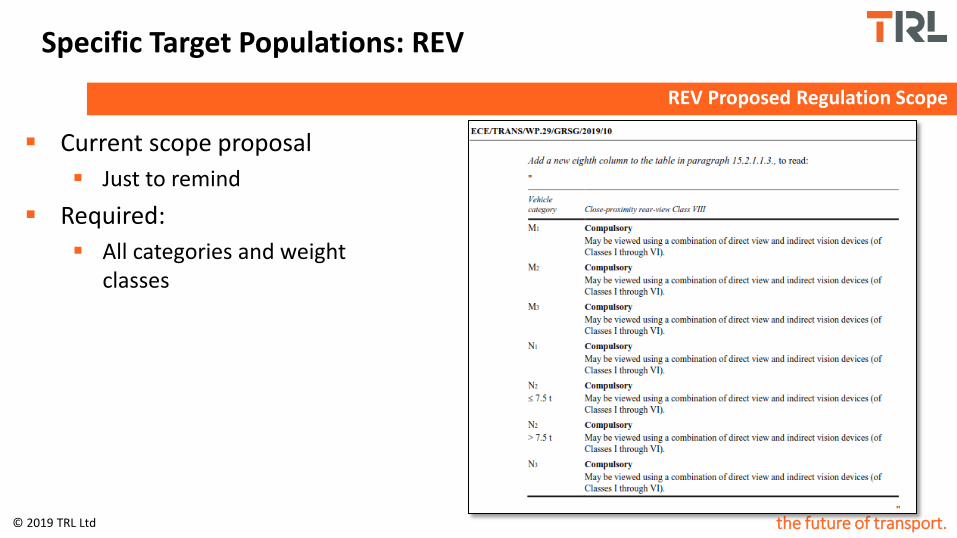
Current scope proposal
Just to remind
Required:
All categories and weight classes

the future of transport. © 2019 TRL Ltd
Click to add text
VRU collisions relevant to REV dominated by M1/N1 vehicles: <5% societal cost of casualties for all other vehicle categories combined <6.5% of total societal costs for any vehicle category Primarily involved in collisions with pedestrians (>89%) Should other vehicle categories be considered in scope? Off-road collisions?
Considering N2/N3 scope exclusions based on GVW: N2≤7.5T has larger TP than N2>7.5T, with N2>7.5T ≈ 0 N3≤18T and N3>18T have similar TP, but smaller than N2≤7.5T
Considering injury severities: All categories have greater proportion of KSI cost than M1, while only N2/N3 have greater
proportion of KSI than N1
Conclusions not affected by selection of target population definition (TP1/TP2)
Specific Target Populations: REV
REV Collision Landscape Conclusions Relating to Vehicle Categories

the future of transport. © 2019 TRL Ltd
Click to add text
Specific Target Populations: REV
REV Regulatory Scope: Selection of Applicable Vehicle Categories
Vehicle Category
Societal Cost
% of Total Cost
Injury Severity
In Scope of GSR Policy
Proposed REV Scope?
M1
M2
M3
N1
N2≤8T
N2>8T
N3≤18T
N3>18T
Legend Societal Cost Green: >€10M Orange: >€1M Red: <€1M % Total Cost: Green: >5% Orange: >2% Red: <2% Injury Severity: M1: Baseline Green: >M1 %KSI Orange: ~M1 %KSI Red: <M1 %KSI BSIS Scope: Green: 1+ green Orange: 1+ orange Red: 0 orange

© 2019 TRL Ltd
Moving-Off Information System (MOIS)
© 2017 TRL Ltd

the future of transport. © 2019 TRL Ltd
Click to add text
Specific Target Populations: MOIS
MOIS Target Population Definitions
Top level target population (TP1): Vehicle manoeuvre = moving off or slowing/stopping Vehicle impact = front
Detailed target population (TP2):
Pedestrian Cyclist/PTW
Vehicle manoeuvre VRU manoeuvre Vehicle manoeuvre Vehicle impact
VRU manoeuvre VRU impact
Moving off Slowing or stopping
Crossing from driver’s n/s Crossing from driver’s o/s In carriageway, not crossing Walking along back to traffic Walking along facing traffic
Moving off Slowing or stopping
Front
Moving off Slowing or stopping Waiting to go ahead Waiting to turn left/right
-
OR
Moving off Slowing or stopping
Front Going ahead LH bend/RH bend/other Offside Nearside
the future of transport. © 2019 TRL Ltd
Click to add text
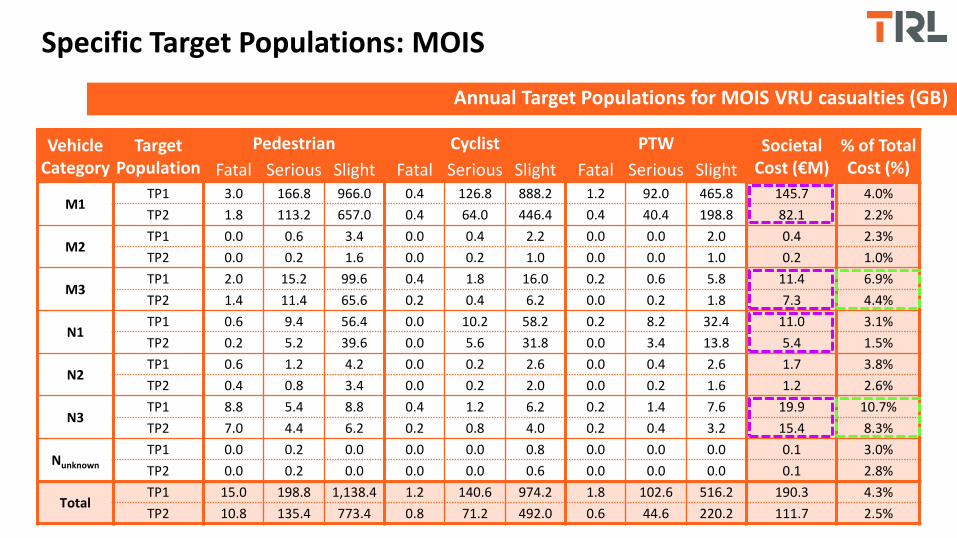
Vehicle Category
Target Population
Pedestrian Cyclist PTW Societal Cost (€M)
% of Total Cost (%) Fatal Serious Slight Fatal Serious Slight Fatal Serious Slight
M1 TP1 3.0 166.8 966.0 0.4 126.8 888.2 1.2 92.0 465.8 145.7 4.0%
TP2 1.8 113.2 657.0 0.4 64.0 446.4 0.4 40.4 198.8 82.1 2.2%
M2 TP1 0.0 0.6 3.4 0.0 0.4 2.2 0.0 0.0 2.0 0.4 2.3%
TP2 0.0 0.2 1.6 0.0 0.2 1.0 0.0 0.0 1.0 0.2 1.0%
M3 TP1 2.0 15.2 99.6 0.4 1.8 16.0 0.2 0.6 5.8 11.4 6.9%
TP2 1.4 11.4 65.6 0.2 0.4 6.2 0.0 0.2 1.8 7.3 4.4%
N1 TP1 0.6 9.4 56.4 0.0 10.2 58.2 0.2 8.2 32.4 11.0 3.1%
TP2 0.2 5.2 39.6 0.0 5.6 31.8 0.0 3.4 13.8 5.4 1.5%
N2 TP1 0.6 1.2 4.2 0.0 0.2 2.6 0.0 0.4 2.6 1.7 3.8%
TP2 0.4 0.8 3.4 0.0 0.2 2.0 0.0 0.2 1.6 1.2 2.6%
N3 TP1 8.8 5.4 8.8 0.4 1.2 6.2 0.2 1.4 7.6 19.9 10.7%
TP2 7.0 4.4 6.2 0.2 0.8 4.0 0.2 0.4 3.2 15.4 8.3%
Nunknown
TP1 0.0 0.2 0.0 0.0 0.0 0.8 0.0 0.0 0.0 0.1 3.0%
TP2 0.0 0.2 0.0 0.0 0.0 0.6 0.0 0.0 0.0 0.1 2.8%
Total TP1 15.0 198.8 1,138.4 1.2 140.6 974.2 1.8 102.6 516.2 190.3 4.3%
TP2 10.8 135.4 773.4 0.8 71.2 492.0 0.6 44.6 220.2 111.7 2.5%
Specific Target Populations: MOIS
Annual Target Populations for MOIS VRU casualties (GB)

the future of transport. © 2019 TRL Ltd
Click to add text
Specific Target Populations: MOIS
Total annual societal costs of MOIS VRU casualties (GB): TP1
MOIS Target Population 1
Total annual societal cost to GB of €190M
Collisions between M1 vehicles and VRUs have highest occurrence and societal costs
Pedestrians most affected casualty
Ranking of societal costs:
M1>N3>M3>N1>N2>M2

the future of transport. © 2019 TRL Ltd
Click to add text
Specific Target Populations: MOIS
Total annual societal costs of MOIS VRU casualties (GB): TP2
MOIS Target Population 2
Total annual societal cost to GB of €112M
Collisions between M1 vehicles and VRUs have highest occurrence and societal costs
Pedestrians most affected casualty
Ranking of societal costs:
M1>N3>M3>N1>N2>M2

the future of transport. © 2019 TRL Ltd
Click to add text
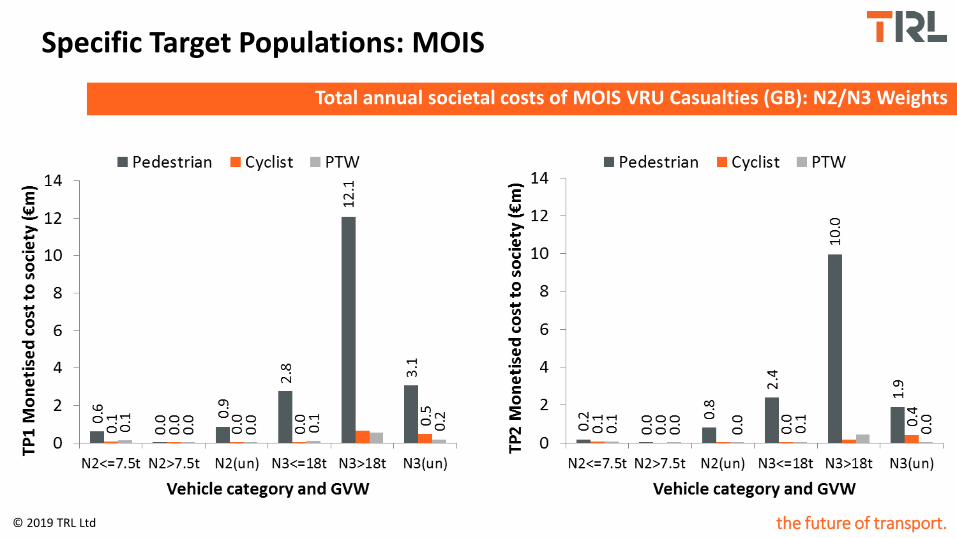
Vehicle Category
Target Population
Pedestrian Cyclist PTW Societal Cost (€M)
% of Total Cost (%) Fatal Serious Slight Fatal Serious Slight Fatal Serious Slight
N2 ≤7.5T TP1 0.2 0.8 2.6 0.0 0.2 1.4 0.0 0.4 2.0 0.8 2.6%
TP2 0.0 0.6 2.0 0.0 0.2 1.0 0.0 0.2 1.0 0.3 1.0%
N2 >7.5T TP1 0.0 0.0 0.4 0.0 0.0 0.2 0.0 0.0 0.2 0.0 0.0%
TP2 0.0 0.0 0.2 0.0 0.0 0.0 0.0 0.0 0.2 0.0 0.0%
N2un_GVW
TP1 0.4 0.4 1.2 0.0 0.0 1.0 0.0 0.0 0.4 0.9 8.6%
TP2 0.4 0.2 1.2 0.0 0.0 1.0 0.0 0.0 0.4 0.8 7.6%
N3 ≤18T TP1 1.4 0.6 0.6 0.0 0.0 1.4 0.0 0.4 0.8 2.9 8.9%
TP2 1.2 0.6 0.6 0.0 0.0 1.2 0.0 0.2 0.4 2.5 7.7%
N3 >18T TP1 5.8 4.6 6.0 0.2 0.8 4.0 0.2 0.4 4.6 13.3 10.6%
TP2 4.8 3.8 4.0 0.0 0.6 2.6 0.2 0.2 2.0 10.6 8.4%
N3un_GVW
TP1 1.6 0.2 1.8 0.2 0.4 0.8 0.0 0.6 2.2 3.7 13.6%
TP2 1.0 0.0 1.4 0.2 0.2 0.2 0.0 0.0 0.8 2.3 8.4%
Specific Target Populations: MOIS
Annual Target Populations for MOIS VRU casualties (GB): N2/N3 Weights
the future of transport. © 2019 TRL Ltd
Click to add text
Specific Target Populations: MOIS
Total annual societal costs of MOIS VRU Casualties (GB): N2/N3 Weights

the future of transport. © 2019 TRL Ltd
Click to add text
Specific Target Populations: MOIS
Injury severity as a proportion of MOIS VRU casualties for each vehicle category (GB)
the future of transport. © 2019 TRL Ltd
Click to add text
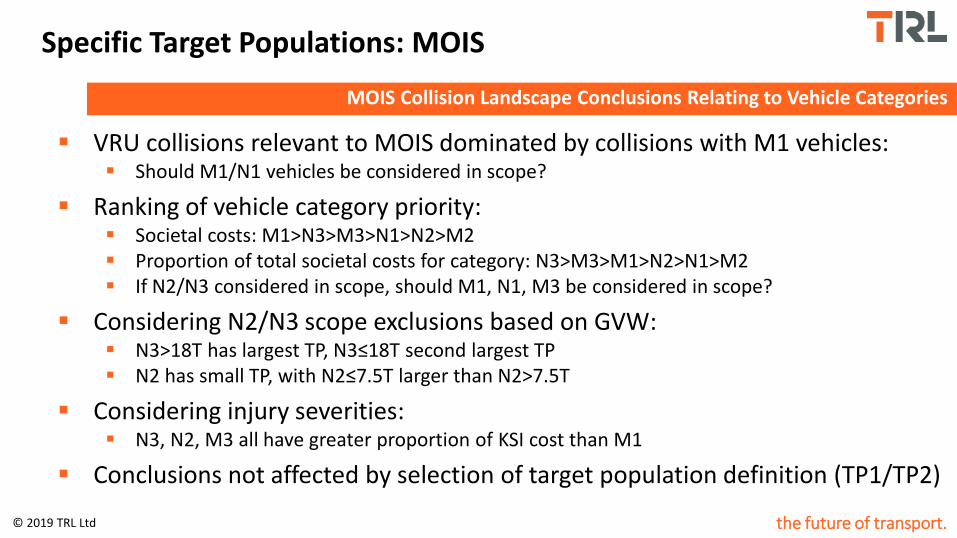
VRU collisions relevant to MOIS dominated by collisions with M1 vehicles: Should M1/N1 vehicles be considered in scope?
Ranking of vehicle category priority: Societal costs: M1>N3>M3>N1>N2>M2 Proportion of total societal costs for category: N3>M3>M1>N2>N1>M2 If N2/N3 considered in scope, should M1, N1, M3 be considered in scope?
Considering N2/N3 scope exclusions based on GVW: N3>18T has largest TP, N3≤18T second largest TP N2 has small TP, with N2≤7.5T larger than N2>7.5T
Considering injury severities: N3, N2, M3 all have greater proportion of KSI cost than M1
Conclusions not affected by selection of target population definition (TP1/TP2)
Specific Target Populations: MOIS
MOIS Collision Landscape Conclusions Relating to Vehicle Categories

the future of transport. © 2019 TRL Ltd
Click to add text
Specific Target Populations: MOIS
MOIS Regulatory Scope: Selection of Applicable Vehicle Categories
Vehicle Category
Societal Cost
% of Total Cost
Injury Severity
In Scope of GSR Policy
Proposed MOIS Scope?
M1
M2
M3
N1
N2≤8T
N2>8T
N3≤18T
N3>18T
Legend Societal Cost Green: >€10M Orange: >€1M Red: <€1M % Total Cost: Green: >5% Orange: >2% Red: <2% Injury Severity: M1: Baseline Green: >M1 %KSI Orange: ~M1 %KSI Red: <M1 %KSI BSIS Scope: Green: 1+ green Orange: 1+ orange Red: 0 orange
© 2019 TRL Ltd
Direct Vision (DIR)
© 2017 TRL Ltd
the future of transport. © 2019 TRL Ltd
Click to add text
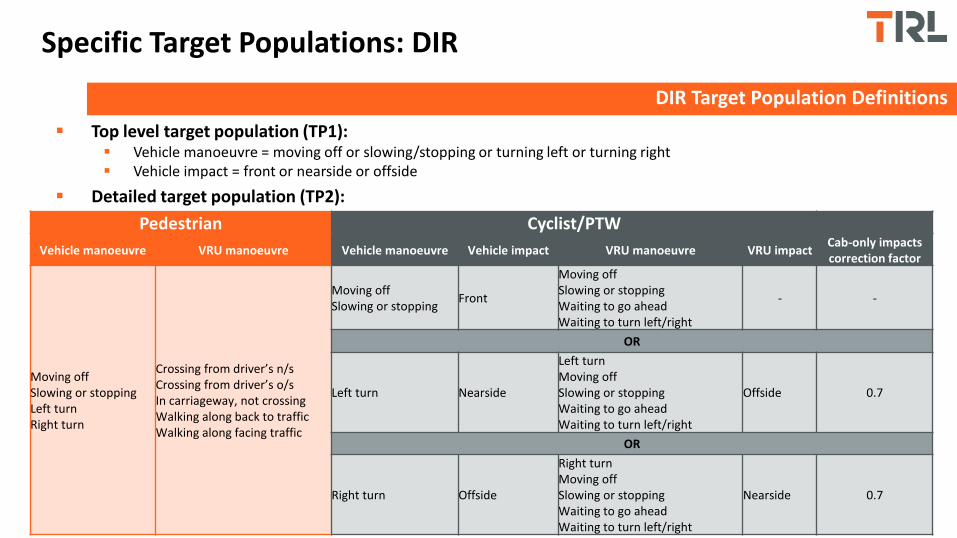
Specific Target Populations: DIR
DIR Target Population Definitions
Top level target population (TP1): Vehicle manoeuvre = moving off or slowing/stopping or turning left or turning right Vehicle impact = front or nearside or offside
Detailed target population (TP2):
Pedestrian Cyclist/PTW
Vehicle manoeuvre VRU manoeuvre Vehicle manoeuvre Vehicle impact VRU manoeuvre VRU impact Cab-only impacts correction factor
Moving off Slowing or stopping Left turn Right turn
Crossing from driver’s n/s Crossing from driver’s o/s In carriageway, not crossing Walking along back to traffic Walking along facing traffic
Moving off Slowing or stopping
Front
Moving off Slowing or stopping Waiting to go ahead Waiting to turn left/right
- -
OR
Left turn Nearside
Left turn Moving off Slowing or stopping Waiting to go ahead Waiting to turn left/right
Offside 0.7
OR
Right turn Offside
Right turn Moving off Slowing or stopping Waiting to go ahead Waiting to turn left/right
Nearside 0.7
the future of transport. © 2019 TRL Ltd
Click to add text
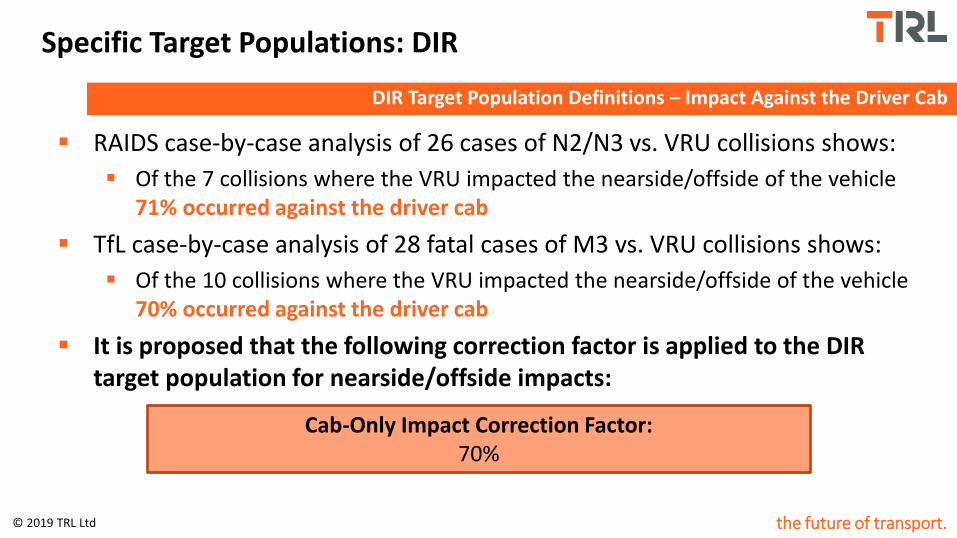
RAIDS case-by-case analysis of 26 cases of N2/N3 vs. VRU collisions shows:
Of the 7 collisions where the VRU impacted the nearside/offside of the vehicle 71% occurred against the driver cab
TfL case-by-case analysis of 28 fatal cases of M3 vs. VRU collisions shows:
Of the 10 collisions where the VRU impacted the nearside/offside of the vehicle 70% occurred against the driver cab
It is proposed that the following correction factor is applied to the DIR target population for nearside/offside impacts:
Specific Target Populations: DIR
Cab-Only Impact Correction Factor: 70%
DIR Target Population Definitions – Impact Against the Driver Cab

the future of transport. © 2019 TRL Ltd
Click to add text
Vehicle Category
Target Population
Pedestrian Cyclist PTW Societal Cost (€M)
% of Total Cost (%) Fatal Serious Slight Fatal Serious Slight Fatal Serious Slight
M1 TP1 17.6 691.0 3,442.2 4.0 906.0 5,990.8 51.6 1,359.6 4,363.0 1,113.6 30.4%
TP2 12.4 523.2 2,529.4 0.0 21.0 174.4 0.0 25.4 258.2 217.0 5.9%
M2 TP1 0.2 3.0 15.4 0.0 2.6 16.2 0.4 3.6 12.2 4.2 25.3%
TP2 0.2 1.8 8.8 0.0 0.4 0.8 0.0 0.0 1.6 1.1 6.8%
M3 TP1 7.8 62.4 291.0 1.6 10.7 70.9 1.6 9.2 34.0 48.0 29.0%
TP2 5.4 40.0 161.2 0.0 0.5 10.5 0.0 0.6 4.6 23.4 14.2%
N1 TP1 4.6 55.8 255.6 0.4 86.6 520.4 7.4 111.6 356.2 106.1 29.8%
TP2 2.8 40.0 184.8 0.0 2.0 19.4 0.0 1.8 22.0 20.1 5.6%
N2 TP1 2.0 7.2 22.2 0.2 6.3 30.1 1.2 6.6 21.5 12.6 27.8%
TP2 1.4 5.0 14.8 0.0 0.5 2.1 0.0 0.2 2.7 4.4 9.6%
N3 TP1 13.6 19.2 37.4 7.8 21.8 45.4 3.6 17.9 37.8 63.4 34.1%
TP2 11.0 13.6 23.2 0.8 1.0 5.8 0.2 0.9 6.6 26.9 14.5%
Nunknown
TP1 0.2 0.4 0.6 0.0 0.4 3.2 0.0 0.0 0.8 0.7 30.6%
TP2 0.0 0.2 0.4 0.0 0.0 0.2 0.0 0.0 0.0 0.1 2.8%
Total TP1 46.0 839.0 4,064.4 14.0 1,034.4 6,676.9 65.8 1,508.4 4,825.4 1,348.5 30.4%
TP2 33.2 623.8 2,922.6 0.8 25.4 213.1 0.2 28.8 295.6 293.0 6.6%
Specific Target Populations: DIR
Annual Target Populations for DIR VRU casualties (GB)

the future of transport. © 2019 TRL Ltd
Click to add text
Specific Target Populations: DIR
Total annual societal costs of DIR VRU casualties (GB): TP1
DIR Target Population 1
Total annual societal cost to GB of €1.35bn
Collisions between M1 vehicles and VRUs have highest occurrence and societal costs
PTWs most affected casualty (apart from M3/N3 - peds)
Ranking of societal costs:
M1>N1>N3>M3>N2>M2

the future of transport. © 2019 TRL Ltd
Click to add text
Specific Target Populations: DIR
Total annual societal costs of DIR VRU casualties (GB): TP2
DIR Target Population 2
Total annual societal cost to GB of €293M
Collisions between M1 vehicles and VRUs have highest occurrence and societal costs
Pedestrians most affected casualty
Ranking of societal costs:
M1>N3>M3>N1>N2>M2

the future of transport. © 2019 TRL Ltd
Click to add text
Vehicle Category
Target Population
Pedestrian Cyclist PTW Societal Cost (€M)
% of Total Cost (%) Fatal Serious Slight Fatal Serious Slight Fatal Serious Slight
N2 ≤7.5T TP1 1.0 4.0 14.0 0.2 3.8 19.8 0.8 4.6 16.9 7.7 25.4%
TP2 0.4 3.0 9.8 0.0 0.0 0.8 0.0 0.2 1.9 1.8 5.9%
N2 >7.5T TP1 0.0 0.6 2.2 0.0 0.6 1.8 0.2 0.4 0.8 0.9 19.6%
TP2 0.0 0.4 1.6 0.0 0.0 0.2 0.0 0.0 0.2 0.1 2.2%
N2un_GVW
TP1 1.0 2.6 6.0 0.0 1.9 8.5 0.2 1.6 3.8 4.1 39.1%
TP2 1.0 1.6 3.4 0.0 0.5 1.1 0.0 0.0 0.6 2.5 23.8%
N3 ≤18T TP1 2.6 2.6 7.0 1.6 6.7 9.7 0.2 2.4 6.2 11.5 35.5%
TP2 2.4 2.0 5.2 0.0 0.5 1.3 0.0 0.2 0.2 5.3 16.3%
N3 >18T TP1 9.2 13.6 21.4 5.6 12.6 24.8 2.6 9.8 22.0 42.6 33.8%
TP2 7.4 10.0 13.6 0.6 0.0 3.2 0.2 0.2 4.0 18.2 14.5%
N3unknown_GV
W
TP1 1.6 2.2 8.4 0.6 2.0 9.0 0.8 4.5 7.8 8.2 30.1%
TP2 1.0 1.2 4.0 0.2 0.4 1.2 0.0 0.5 2.4 2.9 10.6%
Specific Target Populations: DIR
Annual Target Populations for DIR VRU casualties (GB): N2/N3 Weights

the future of transport. © 2019 TRL Ltd
Click to add text
Specific Target Populations: DIR
Total annual societal costs of DIR VRU Casualties (GB): N2/N3 Weights

the future of transport. © 2019 TRL Ltd
Click to add text
Specific Target Populations: DIR
Injury severity as a proportion of DIR VRU casualties for each vehicle category (GB)

the future of transport. © 2019 TRL Ltd
Click to add text
VRU collisions relevant to DIR dominated by collisions with M1 vehicles: Should M1/N1 vehicles be considered in scope?
Ranking of vehicle category priority: Societal costs: M1>N3>M3>N1>N2>M2 Proportion of total societal costs for category: N3>M3>N2>M2>M1>N1 If N2/N3 in scope, should M3 be considered in scope?
Considering N2/N3 scope exclusions based on GVW: N2≤7.5T has larger TP than N2>7.5T should N2≤7.5T be considered in scope? N3≤18T and N3>18T both have larger TP than all N2 category vehicles
Considering injury severities: All vehicle categories have greater proportion of KSI cost than M1 Particularly evident for N3, N2, M3 vehicles
Conclusions partially affected by selection of TP definition (TP1/TP2) Most affected casualty type varies based on TP definition
Specific Target Populations: DIR
DIR Collision Landscape Conclusions Relating to Vehicle Categories

the future of transport. © 2019 TRL Ltd
Click to add text
Specific Target Populations: DIR
DIR Regulatory Scope: Selection of Applicable Vehicle Categories
Vehicle Category
Societal Cost
% of Total Cost
Injury Severity
In Scope of GSR Policy
Proposed DIR Scope?
M1
M2
M3
N1
N2≤8T
N2>8T
N3≤18T
N3>18T
Legend Societal Cost Green: >€10M Orange: >€1M Red: <€1M % Total Cost: Green: >5% Orange: >2% Red: <2% Injury Severity: M1: Baseline Green: >M1 %KSI Orange: ~M1 %KSI Red: <M1 %KSI BSIS Scope: Green: 1+ green Orange: 1+ orange Red: 0 orange

© 2019 TRL Ltd
In-Progress STATS19 Research: Next Steps
© 2017 TRL Ltd

the future of transport. © 2019 TRL Ltd
Click to add text
Scaling of results Investigate potential for scaling to EU and/or global level
Investigation of effect of other important STATS19 factors: Causation factors Urban/rural Towing and articulation Body types Wheel plan x engine capacity (VECTO categories) Year first registered Casualty age Light conditions Weather conditions
Next Steps
Remaining Collision Landscape Analyses
the future of transport. © 2019 TRL Ltd
Questions?
Dr Phil Martin Senior Researcher [email protected] +44 [0]1344 770 326 TRL | Crowthorne House | Nine Mile Ride | Wokingham Berkshire | RG40 3GA | United Kingdom