summary of losses from insect damage and cost of control in
TRANSCRIPT

Summary of Losses from Insect Damageand Cost of Control in Georgia
2006
Editors
Paul Guillebeau, Nancy Hinkle & Phillip Roberts

Contents
Subcommittee Chair & Members . . . . . . . . . . . . . . . . . . . . . . . . . . . . . . . . . . . . . . . . . . . . . . . . iii
Introduction . . . . . . . . . . . . . . . . . . . . . . . . . . . . . . . . . . . . . . . . . . . . . . . . . . . . . . . . . . . . . . . . . iv
Acknowledgments . . . . . . . . . . . . . . . . . . . . . . . . . . . . . . . . . . . . . . . . . . . . . . . . . . . . . . . . . . . . iv
Subcommittee Reports . . . . . . . . . . . . . . . . . . . . . . . . . . . . . . . . . . . . . . . . . . . . . . . . . . . . . . . . . . 1Apiculture . . . . . . . . . . . . . . . . . . . . . . . . . . . . . . . . . . . . . . . . . . . . . . . . . . . . . . . . . . . . . 1Cotton Insects . . . . . . . . . . . . . . . . . . . . . . . . . . . . . . . . . . . . . . . . . . . . . . . . . . . . . . . . . . . 2Field Corn Insects . . . . . . . . . . . . . . . . . . . . . . . . . . . . . . . . . . . . . . . . . . . . . . . . . . . . . . . 5Grain Sorghum Insects . . . . . . . . . . . . . . . . . . . . . . . . . . . . . . . . . . . . . . . . . . . . . . . . . . . . 7Household and Structural Insects . . . . . . . . . . . . . . . . . . . . . . . . . . . . . . . . . . . . . . . . . . . . 9Livestock and Poultry Insects . . . . . . . . . . . . . . . . . . . . . . . . . . . . . . . . . . . . . . . . . . . . . 13Ornamental, Lawn and Turf Insects . . . . . . . . . . . . . . . . . . . . . . . . . . . . . . . . . . . . . . . . . 15Pasture and Forage Insects . . . . . . . . . . . . . . . . . . . . . . . . . . . . . . . . . . . . . . . . . . . . . . . . 18Peanut Insects . . . . . . . . . . . . . . . . . . . . . . . . . . . . . . . . . . . . . . . . . . . . . . . . . . . . . . . . . . 20Pecan Insects . . . . . . . . . . . . . . . . . . . . . . . . . . . . . . . . . . . . . . . . . . . . . . . . . . . . . . . . . . 22Public Health and Recreational Area Insects . . . . . . . . . . . . . . . . . . . . . . . . . . . . . . . . . . 24Small Grain Insects . . . . . . . . . . . . . . . . . . . . . . . . . . . . . . . . . . . . . . . . . . . . . . . . . . . . . 31Soybean Insects . . . . . . . . . . . . . . . . . . . . . . . . . . . . . . . . . . . . . . . . . . . . . . . . . . . . . . . . 33Tobacco Insects . . . . . . . . . . . . . . . . . . . . . . . . . . . . . . . . . . . . . . . . . . . . . . . . . . . . . . . . 36Vegetable Insects . . . . . . . . . . . . . . . . . . . . . . . . . . . . . . . . . . . . . . . . . . . . . . . . . . . . . . . 38
Summary of Losses Resulting from Insect Damage and Control Costs in Georgia in 2006 byCommodity or Other Category . . . . . . . . . . . . . . . . . . . . . . . . . . . . . . . . . . . . . . . . . . . . . 44
Scientific Names or Other Taxonomic Classifications of the Insect Species or Insect Complexedfor Which Economic Loss Estimates Have Been Made In Georgia . . . . . . . . . . . . . . . . 45
References . . . . . . . . . . . . . . . . . . . . . . . . . . . . . . . . . . . . . . . . . . . . . . . . . . . . . . . . . . . . . . . . . . 52

iii
DEPARTMENT OF ENTOMOLOGYSPECIAL COMMITTEE ON INSECT SURVEY AND LOSSES
FOR 2006
Paul Guillebeau, Phillip Roberts & Nancy HinkleCo-Chairs
Subcommittee Subcommittee Chair & Members
Apiculture K. Delaplane, (chair)
Cotton P. Roberts (chair), J. Ruberson
Field Corn D. Buntin (chair), J. All
Grain Sorghum D. Buntin (chair), J. All
Household & Structural D. Suiter (chair), B. Forschler
Livestock & Poultry N. Hinkle (chair)
Ornamental, Lawn & Turf R. Oetting (chair), W. Hudson, K. Braman
Pasture & Forage W. Hudson (chair), D. Buntin, W. Gardner
Peanut S. Brown (chair)
Pecan W. Hudson (chair), J. Dutcher
Public Health & Recreational Area E. Gray (chair)
Small Grain D. Buntin (chair), J. All
Soybean P. Roberts (chair), B. McPherson
Tobacco B. McPherson (chair)
Vegetables A. Sparks (chair), D. Riley

iv
Introduction
This publication summarizes the economic losses resulting from insect damage and cost of theircontrol in 2006. The loss estimates are prepared by subcommittees of The University of Georgia,College of Agriculture and Environmental Sciences, Department of Entomology SpecialCommittee on Insect Surveys and Losses. The estimates of yield loss on units treated anduntreated for a given insect pest can vary greatly between commodities. This reflects differencesin pest populations pressure, efficacy of control, management practices, etc., and the loss is notalways lower for the treated units.
Acknowledgments
Many people other than the members of The University of Georgia Department of EntomologySpecial Committee on Insect Surveys and Losses have contributed significantly in thispublication. Committee members had considerable aid from representatives of agribusiness, theUnited States Department of Agriculture, research and extension workers in other states, andCounty Extension Coordinators and Agents of The University of Georgia Cooperative ExtensionService, the Committee thanks them all. We sincerely thank Ms. Detsy Bridges and Terry All inthe Entomology Unit in Athens for their assistance in compiling, typing, proofreading andpreparing the web version of this report.
1
Subcommittee Reports
Apiculture
K. Delaplane
The number of managed bee hives in Georgia increased from 59,000 to 63,000 between2005 and 20061. This change is within the normal range of vacillation for the state’s beekeepingindustry the last five years. Beekeepers continued to sustain colony losses and control costsassociated with chemical-resistant Varroa mites, antibiotic-resistant American foulbrood disease,and hive-scavenging small hive beetles. Beekeepers report locally high nuisance levels of smallhive beetles in honey houses and stored equipment. A few operations sustain damaging levels ofbeetles in apiaries, especially queen mating yards. Queen performance, measured by egg outputand longevity, continues to be a problem with many queens not surviving past six months.
In 2006 the summed production of beekeepers with five or more hives was 4,662,000pounds of honey, up from 2,891,000 in 2005. Production per hive (63 pounds) was up from 59 in2005, paralleling the trend for increasing hive numbers. Production increases along withsignificant increases in price received per pound in 2006 ($1.16 from 0.89) combined to morethan double the value of the 2006 crop over 2005 ($5,408,000 vs. $2,573,000).
Extension programs reached an estimated 340 people in local educational efforts aimed athoney bee parasite biology and control, optimum bee management, and public awareness of thevalue of bee pollinators. State-oriented educational programs reached an additional 450 persons.The fifteenth annual Young Harris College/University of Georgia Beekeeping Institute drewaround 115 participants. UGA research focused on Varroa mite and small hive beetle control andpollination of rabbiteye blueberry and watermelon._____________________________1Georgia Farm Report 07(03), Mar. 30, 2007
2
Cotton Insects
P. Roberts and J. Ruberson
Approximately 1.37 million acres of cotton were harvested in Georgia during 2006. Growing conditions were highly variable during the season. Drought conditions persisted inmany areas early and mid season, below average yields were anticipated. However, timely rainswere received in late summer and some dryland acres recovered and made a late crop. Harvestconditions were generally favorable. Dryland yields were highly variable (generally better thanexpected) and irrigated yields tended to be above average in many areas; the average yield forGeorgia during 2006 was 818 lbs lint per acre. Insect populations were generally light with theexception of aphids. The primary insect pests which required treatment included stink bugs, cornearworm, thrips, and aphids.
Thrips populations were moderate but plant injury was excessive in some areas due inlarge part to slow seedling growth. As a whole a greater percentage of acres were treated forthrips with foliar sprays than during recent years. Other seedling pests such as cutworms andgrasshoppers were rarely an economic concern.
Aphid populations built to high numbers during June and July. The naturally occurringfungus which causes populations to crash was first observed in south Georgia during late June(normal), but was slow to spread across the state. Aphids remained in some areas until the latterpart of July. More acres were treated for aphids than in recent years. Most growers were pleasedwith the results of treating aphids. Yields were most likely impacted in fields with highpopulations which were not treated with insecticides.
Spider mites infested many fields and were first observed on squaring cotton. Thesepopulations tended to linger season long but failed to build to high numbers. However, thepresence of spider mites tended to influence management of other pests. Fortunately other pestproblems were minimal and natural controls for spider mites were not routinely disrupted.
Corn earworm and tobacco budworm populations were moderate to heavy during July butextremely low during August and September. Control of corn earworm with pyrethroids wasgenerally good. However, concern remains on changes in the susceptibility of corn earworm topyrethroids. Fall armyworm infestations were occasional and sporadic. Beet armyworm andsoybean looper populations were generally low.
Stink bug populations were generally low to moderate but were the most common pesttreated with insecticide. Stink bug populations did not build to high numbers in August andSeptember and afforded late cotton to mature with minimal insecticide input.
No boll weevils were captured in Georgia during 2006.
3
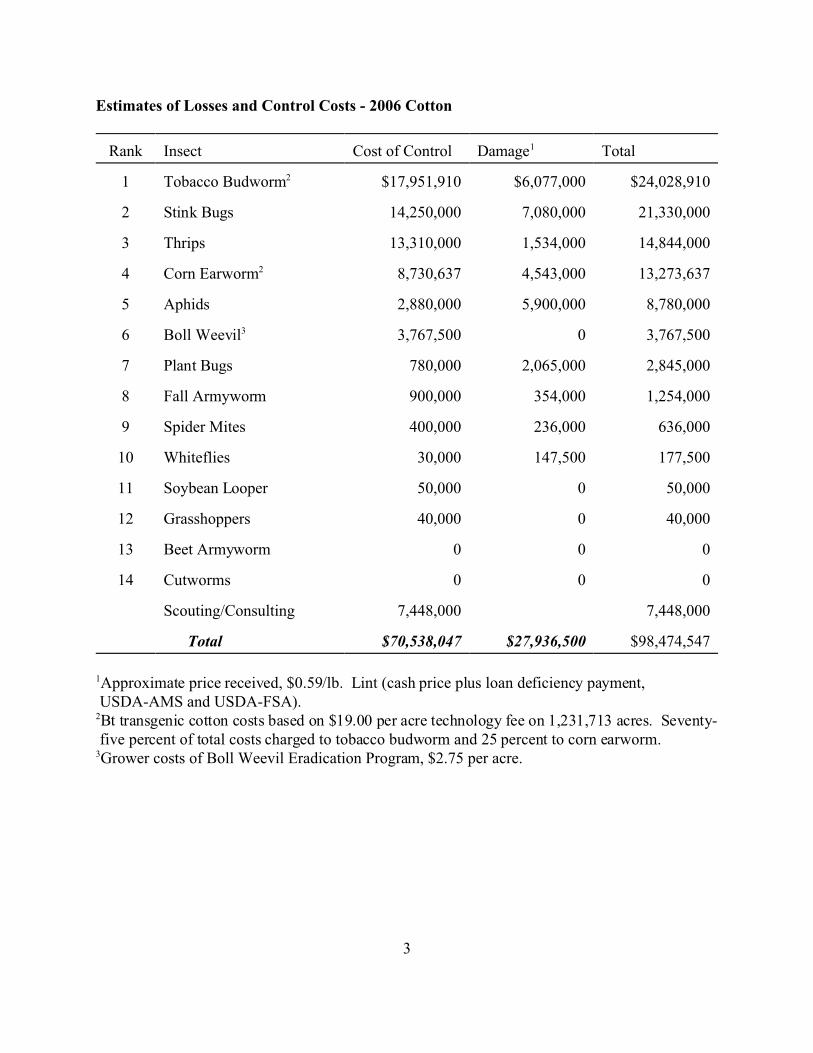
Estimates of Losses and Control Costs - 2006 Cotton
Rank Insect Cost of Control Damage1 Total
1 Tobacco Budworm2 $17,951,910 $6,077,000 $24,028,910
2 Stink Bugs 14,250,000 7,080,000 21,330,000
3 Thrips 13,310,000 1,534,000 14,844,000
4 Corn Earworm2 8,730,637 4,543,000 13,273,637
5 Aphids 2,880,000 5,900,000 8,780,000
6 Boll Weevil3 3,767,500 0 3,767,500
7 Plant Bugs 780,000 2,065,000 2,845,000
8 Fall Armyworm 900,000 354,000 1,254,000
9 Spider Mites 400,000 236,000 636,000
10 Whiteflies 30,000 147,500 177,500
11 Soybean Looper 50,000 0 50,000
12 Grasshoppers 40,000 0 40,000
13 Beet Armyworm 0 0 0
14 Cutworms 0 0 0
Scouting/Consulting 7,448,000 7,448,000
Total $70,538,047 $27,936,500 $98,474,547
1Approximate price received, $0.59/lb. Lint (cash price plus loan deficiency payment, USDA-AMS and USDA-FSA).2Bt transgenic cotton costs based on $19.00 per acre technology fee on 1,231,713 acres. Seventy- five percent of total costs charged to tobacco budworm and 25 percent to corn earworm.3Grower costs of Boll Weevil Eradication Program, $2.75 per acre.

4
Information Pertaining to Control of Major Cotton Insect Pests in Georgia - 2006
Insect
No. Acres
Needing
Control
No. Acres
Treated
No. of
Applic.
Avg. Cost
Per Unit
Treated1
Yield Loss
on Units
Treated2
Yield Loss
on Units
Untreated2
Tobacco Budworm3 100,000 20,000 2.0 $10.00 300,000 10,000,000
Stink Bugs 1,000,000 950,000 2.0 7.50 7,000,000 5,000,000
Thrips 1,250,000 1,210,000 1.1 10.00 0 2,600,000
Corn Earworm3 350,000 300,000 1.2 8.00 3,000,000 4,700,000
Aphids 600,000 360,000 1.0 8.00 3,000,000 7,000,000
Boll Weevil4 0 0 0.0 0.00 0 0
Plant Bugs 140,000 120,000 1.0 6.50 1,200,000 2,300,000
Fall Armyworm 100,000 100,000 1.0 9.00 300,000 300,000
Spider Mites 45,000 40,000 1.0 10.00 100,000 300,000
Whiteflies 3,000 2,500 1.0 15.00 50,000 200,000
Soybean Looper 5,000 5,000 1.0 10.00 0 0
Grasshoppers 5,000 5,000 1.0 7.50 0 0
Beet Armyworm 0 0 0.0 9.00 0 0
Cutworms 0 0 0.0 6.50 0 0
1Includes application costs.2Yield units measured in pounds of lint.3Does not include costs of Bt transgenic cotton; foliar insecticides only.4Grower costs of Boll Weevil Eradication Program (BWEP). All cotton produced in Georgia is required to participate in BWEP. The annual per acre assessment for participation was $2.75 per acre during 2006.5Some acreage not treated due to Bt cotton insect resistance management programs.

5
Field Corn Insects
G. Buntin and J. All
Corn was planted on 280,000 acres and harvested from 225,000 acres in 2006. Yieldsaveraged 112 bushels per acre, and the average price was $2.80 per bushel. About 40,000 acresof corn was harvested for silage with an average yield of 17 tons per acre.
Soil insects as a group were the number one insect pest of field corn in Georgia.Historically about 25-30% of acreage was treated with a conventional at-planting insecticide forsoil insect control. In 2006 the neonicotinoid seed treatment, Poncho 250, was used on about50% of the acreage, replacing some of the conventional at-planting insecticides. This seedtreatment cost about $6.50 per acre compared with $12 per acre for conventional treatments. Fallarmyworm populations were large later in the season which damaged late-planted corn.Generally, corn earworm numbers were moderate and mainly damaged late-planted corn. Stinkbugs populations were very low in 2006 with little damage occurring. Chinch bugs damageseedling stand and infested field during grain fill in some areas. Cereal leaf beetles defoliatedsome whorl-stage corn mostly along field edges, which rarely reduced grain yield.
Estimated Losses and Control Costs in 2006
Rank Insect Cost of Control Damage Total
1 Soil insects1 $728,000 $ 439,000 $1,167,000
2 Fall armyworm 90,000 526,000 616,000
3 Corn earworm 0 219,000 219,000
4 Stink bugs 28,000 105,000 133,000
5 Chinch bugs 34,000 140,000 174,000
6 Cereal leaf beetle 56,000 0 56,000
Total $936,000 $1,429,000 $2,365,000
1Includes wireworms, southern corn rootworm, western corn rootworm, lesser cornstalk borer, billbugs, sugarcane beetles and white grubs.

6
Information Pertaining to Control of Major Field Corn Insect Pests in Georgia in 2006
Insect
No. AcresNeedingControl
No.AcresTreated
No. ofAcresApplic.
Avg. CostPer UnitTreated1
Yield Losson UnitsTreated
Yield Losson UnitsUntreated
Soil insects2 56,000 112,000 1 6.00 0 157,000
Fall armyworm 28,000 11,000 1 8.00 0 188,000
Corn earworm 14,000 0 1 -- 0 78,000
Stink bugs 8,000 6,000 1 5.00 36,000 38,000
Chinch bugs 11,000 6,000 1 6.00 0 50,000
Cereal leaf beetle 2,000 11,000 1 5.00 0 0
1Application cost not included; corn earworm control not feasible in field corn.2Includes wireworms, southern corn rootworm, western corn rootworm, lesser cornstalk borer, billbugs, sugarcane beetles and white grubs.

7
Grain Sorghum Insects
D. Buntin and J. All
A total of 40,000 acres of grain sorghum was planted in 2006 with 26,000 acres beingharvested for grain and 11,000 acres being harvested for silage. Grain yields averaged 45 bushelsper acre with an average price of $2.52 per bushel. Dry conditions resulted in grain sorghumbeing planted late which reduced yield potential, but average commodity price was higher than inrecent years.
Chinch bug and sorghum midge were the most important insect pests of grain sorghum inGeorgia in 2006. Sorghum midge caused losses mainly in late-planted sorghum. Swarming birdsalso eat grain especially along field margins and in smaller fields. Head worms, including cornearworm, sorghum webworm and fall armyworm, in grain heads are managed together, butpopulations were moderate in 2006. Stink bug populations were very small and did not causemuch damage during grain fill in 2006. Soil insects, mostly lesser cornstalk borer at planting,caused sporadic damage in some fields.
Estimated Losses and Control Costs in 2006
Rank Insect Cost of Control Damage Total
1 Chinch bug $15,000 $ 42,000 $ 57,000
2 Sorghum midge 13,000 15,000 28,000
3 Bird damage2 0 29,000 29,000
4 Head worms1 andstink bugs
6,000 6,000 12,000
5 Soil insects 12,000 8,000 20,000
Total $46,000 $100,000 $146,000
1Includes corn earworm, sorghum webworm and fall armyworm.

8
Information Pertaining to Control of Major Grain Sorghum Insect Pests in Georgia in 2006
Insect
No. AcresNeedingControl
No. AcresTreated
No. ofAcres
Applic.
Avg. CostPer UnitTreated1
Yield Losson UnitsTreated
Yield Losson Units
Untreated
Chinch bugs 5,500 1,850 1 8.00 0 17,000
Sorghum midge 3,900 2,600 1 5.00 0 6,000
Bird damage2 2,600 0 –2 –2 0 12,000
Head wormsand stink bugs
2,080 1,040 1 6.00 0 3,000
Soil insects 2,960 1,480 1 8.00 0 3,000
1Application cost not included.2Not legal to control birds with pests.

9
Household and Structural Insects
D. Suiter and B. Forschler
Georgia is the second most populated state in the Southeast. During the 1990s it was thefastest growing state east of Colorado and the sixth fastest growing state in the U.S. As of 2005,12 of the 100 fastest growing counties in the U.S. were in Georgia—only Florida had more (14).During the 1990s, Georgia’s population grew by 1.7 million (26.4% increase) to 8.2 million. TheAtlanta metropolitan statistical area (MSA) grew by 1.1 million, accounting for 68% of thestate’s growth. Half of Georgia’s residents currently live in the Atlanta MSA, and by 2010 theAtlanta area is projected to have grown by another 687,000. From 2005 to 2006 Georgia was thefourth-fastest growing state in the U.S. During that one year period, 231,388 people moved intothe state, bringing Georgia’s population to 9,363,941. From 2000 to 2006, Georgia’s populationgrew by about 1.2 million; during the same period, only Arizona and Nevada grew faster!Urbanization often leads to problems directly associated with insects and other pests. A 2003University of Georgia Survey Research Center poll of 500 Georgians found that:
• 26% of respondents had hired a pest control company in the past two years to treat fortermites. The response was statistically independent of whether the respondent was aGeorgia native or not, age, ethnicity, gender, and marital status, but was dependent uponeducation, income, whether the respondent lived in a MSA or not, and whether therespondent rented or owned their home.
• 36% of respondents had hired a pest control company in the past two years to treat forpests other than termites. The response was statistically independent of whether therespondent was a Georgia native or not, age, ethnicity, gender, income, and whether therespondent rented or owned their home, but was dependent upon marital status,education, and whether the respondent lived in a MSA or not.
A 2005 nationwide survey indicated that pest management firms in the U.S. amassed anestimated $6.76 billion in revenue from residential (general insect control and termites) andcommercial services, representing a 4% increase over 2004. Because some pest species are aproblem anywhere that food is manufactured, prepared, cooked, served, or stored, commercialbusinesses serviced by pest management firms often include restaurants, service stations,schools, daycares, hospitals, grocery stores, nursing homes, food processing and manufacturingplants, food storage facilities and warehouses, etc.
Each year, over 1,000 pest management firms in Georgia serve the diverse needs ofGeorgia homeowners and businesses. In 2006, for instance, 1,229 pest management firms inGeorgia employed 7,868 licensed individuals (2,058 certified operators and 5,810 technicians),excluding secretaries and other office personnel; 75 new pest management firms were started inGeorgia in 2006. The Georgia Department of Agriculture (GDA) regulates Georgia’s 1,200+termite and pest control businesses. Each year the GDA inspects (at consumer request)approximately 3,000 treatments performed by pest management professionals to ensure thatGeorgia consumers receive treatments that meet established state standards and provideprotection for attack by termites.

10
The total dollar value (i.e., revenues and expenditures) associated with pests and theircontrol and prevention comes from a wide variety of sources—not just service fees garnered bypest management firms. For instance, in addition to the service fees paid by Georgians to pestmanagement firms to control and prevent pests of homes, homeowners also spend untold dollarsto repair damage to homes caused by pests and to pay for expenses related to the treatment ofmedical conditions that are a direct result of bites, stings, or allergies caused by some pests foundin and around the home. Fire ants, yellow jackets, wasps, hornets, and some stinging caterpillarsand biting spiders are annually responsible for a number of human deaths, emergency roomvisits, and hospitalizations. Financial costs associated with these events are unknown, butprobably significant. Furthermore, house dust mites and German cockroaches are commoncauses of asthma in inner city children. Cockroach allergies are reportedly the #1 reason foremergency room visits by inner city children. Many arthropods create real anxieties, known asentomophobias, in an unknown number of individuals. Some entomophobias are extreme,resulting in a mental state known as Delusory Parasitosis (DP), wherein delusions of insectinfestation of the body dominate one’s thoughts and actions to the detriment of living a normallife. Cases involving DP sometimes require professional medical (e.g., for treatment of infectedsores caused by excessive scratching, or in some cases self-mutilation, caused by the patient’sneed to ‘remove the bugs’ from the skin) and psychological care. The costs of both forms of careare unknown. Finally, many industries and businesses peripheral to the pest management industry(e.g., pesticide product manufacturers, equipment manufacturers, insurers, regulators, productdistributors, professional organizations and associations, etc.) add thousands of jobs and generatetens of millions of dollars in revenue for their U.S. and Georgia-based companies.
2006 Topics Important Nationally and Regionally• The Evolution of the Bed Bug Problem: Insecticide Resistance, Liability, Bed Bug Spread
(nationally), Lack of Reliable Control Options• Regulatory Issues and Pest Management in Schools (GA)• The Evolution of Green Pest Control Services (both nationally and in GA)• Borate-Based Pre-Treats (regionally and in GA)• Formosan Termites (regionally and in GA)• Softening Termite Control Market: lack of termite swarms and a weak housing market• Price of Gas: in an industry that is driving-intensive.
Non-Termite Pests: Ants are King! In 2006, a nationwide survey (Pest Control Technology[PCT] magazine) of 378 pest control companies asked the following questions:• Which ONE of these services represented your company’s largest growth market in
2006? As in previous years, ant control was the fastest growing segment of pestmanagement services—reported by 29% of companies as their best growth area in 2006.Responses for other segments of business growth were 21% for termites; 16% perimeterpest control; 8% IPM; 4% for lawn care, bed bug control, and rodent control; 3% forwildlife management, flying insects, and others; and 1-2% for fleas, fumigation, birds,and mosquitoes.
• Which of the following services does your company offer? 90% of the 378 companiesoffered ant control services, more than any other type of service offered. The response forother categories included 89% rodent control; 86% perimeter pest control; 84% fleacontrol; 66% IPM; 65% termite control; 57% flying insect control; 56% bed bug control;

11
30% bird control; 24% mosquito control; 23% vertebrate/wildlife control; 16% lawn care;15% moisture control; 11% fumigation; and 7% other.
• Ants were overwhelmingly considered the most difficult pest to control. When askedWhat pest is proving to be the hardest to control in your market? 45% of respondingcompanies answered “ants”, followed by 16% for bed begs; 12% fleas; 9% cockroaches;6% other; 5% or less for rodents, birds, and wildlife. Notably, just 2% of the 378companies responding to the survey indicated that termites were their most difficult pestto control!
• In summary, ants and their control are a very important component of pest control. In2006, ant control services were the greatest segment of business growth. Although 90%of companies offer ant control services, ants were considered the most difficult pest tocontrol—even more difficult than termites.
In the same 2003 UGA Survey Research Center poll of 500 Georgians mentioned above,33% of respondents had been troubled by an ant infestation in their home in the past two years.The response was statistically independent of whether the respondent was a Georgia native ornot, age, gender, marital status, income, education, whether the respondent rented or owned theirhome, and whether the respondent lived in a MSA or not. The response was, however, dependentupon ethnicity. In Georgia, the most important group of non-termite pests are theants—Argentine ants (known to Georgians as ‘sugar ants’), fire ants, carpenter ants, and odoroushouse ants.
Other pests important in Georgia include cockroaches (German, Asian, smokybrown,American), flies (houseflies, moth flies, fruit flies), biting and stinging pests (spiders, fleas, ticks,yellow jackets, hornets, bees, stinging caterpillars, mosquitoes), pantry and fabric pests(Indianmeal moths, cowpea weevils, drugstore and cigarette beetles, and carpet beetles), andvarious occasional invaders (millipedes, earwigs, centipedes, crickets, camel crickets, groundbeetles, pillbugs and sowbugs, and springtails).
Wood-Destroying Organisms. Subterranean termites are the most economicallyimportant structural insect pest encountered by Georgia homeowners. In Georgia, subterraneantermites account for tens of millions of dollars in pest control industry revenue and homeownerexpenditures to repair termite-damaged homes. In the same PCT survey noted above of 378companies, termite control services represented the #2 growth market for pest control companiesin 2006 (ants were #1); 21% of responding companies answered “termites” (compared to 29%for “ants”) when asked the question Which ONE of these services represented your company’slargest growth market in 2006? Furthermore, 65% of the 378 companies surveyed offered termite control services, compared to 90% who offer ant control services. Termites were notconsidered that difficult to control. When asked the question What pest is proving to be thehardest to control in your market, just 2% of responding companies answered “termites”, while45% of responding companies answered “ants”. Bed bugs, fleas, cockroaches, and rodents wereconsidered more difficult to control than were termites. In 2006, 28% of companies that offersubterranean termite control services use both baits and liquid termiticides; 42% use only liquids;22% use wood treatments and soil treatments combined; and just 3% use only baits. Drywoodtermites are less important, and largely a regional pest along Georgia’s coastline and in southGeorgia. Other, less important, wood-destroying insect pests encountered by the structural pest

12
control industry include powderpost beetles, old house borers, carpenter ants, and carpenter bees.Wood-rotting fungi, associated with persistently wet wood, is responsible for unknown costsrelated to control and damage repair (i.e., mainly wood replacement). Collectively, though,drywood termites and all wood-infesting beetles likely account for a fraction of the economicimpact of either subterranean termites or wood-rotting fungi.
The Formosan subterranean termite (FST) is a unique species of subterranean termitethat deserves special mention because of its potential negative impact on Georgians. It is nativeto China, was accidentally introduced into the southern U.S. by maritime traffic over 50 yearsago, and has since been found in nine southern states. From 1993 to 2006, 30 infestations havebeen identified in Georgia (see graph below). Four sites were found in 2006 alone. Additional,undiscovered sites certainly exist throughout the state.
The FST is the most destructive termite pest in the U.S., and arguably the world. It cancause extensive structural damage. In extreme cases, damage can even be catastrophic. Ahomeowner in Marietta, GA sustained, by his own estimate, $200,000 in Formosan termitedamage (see quote below); we can cite several other damage estimates of homes in Georgia inthe $10,000-$70,000 range. Prior to hurricane Katrina, the FST was annually responsible for anestimated $100 million in damage to homes and businesses in the New Orleans area.
In the U.S., the Formosan termite is most commonly spread by movement oftermite-infested railroad crossties. As railroad companies replace crossties, some of the used onesare sold and re-used to build retaining walls and other landscape features around homes andbusinesses. Some of the used crossties are infested with Formosan termites. The termites survivetransport and become established in previously un-infested areas when the crossties are installed.Unfortunately, movement of termite-infested crossties into un-infested, growing communitieswill likely continue for the foreseeable future. “If you add in demolition associated costs to the costs of labor and replacem ent, I think $200 ,000 is a fair
estimate… just to “get back” what was already there in a 1970s brick ranch. This has become a life-changing
event”.
---This is a 2003 email quote from a Marietta, GA homeowner regard ing out-of-pocket costs directly associated with
a Formosan termite infestation of his home.
Since 1993, 30 Formosan termite sites have been discovered in Georgia, including four in 2006.
13
Livestock and Poultry Insects
N. Hinkle
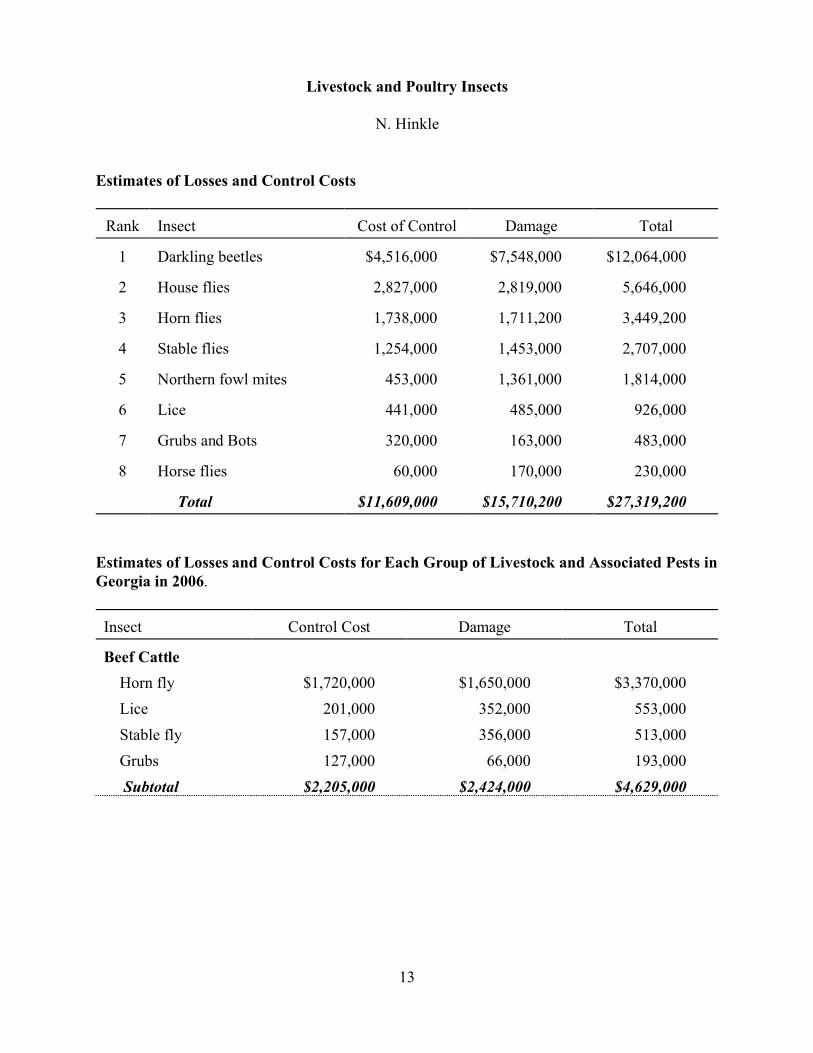
Estimates of Losses and Control Costs
Rank Insect Cost of Control Damage Total
1 Darkling beetles $4,516,000 $7,548,000 $12,064,000
2 House flies 2,827,000 2,819,000 5,646,000
3 Horn flies 1,738,000 1,711,200 3,449,200
4 Stable flies 1,254,000 1,453,000 2,707,000
5 Northern fowl mites 453,000 1,361,000 1,814,000
6 Lice 441,000 485,000 926,000
7 Grubs and Bots 320,000 163,000 483,000
8 Horse flies 60,000 170,000 230,000
Total $11,609,000 $15,710,200 $27,319,200
Estimates of Losses and Control Costs for Each Group of Livestock and Associated Pests inGeorgia in 2006.
Insect Control Cost Damage Total
Beef Cattle
Horn fly $1,720,000 $1,650,000 $3,370,000
Lice 201,000 352,000 553,000
Stable fly 157,000 356,000 513,000
Grubs 127,000 66,000 193,000
Subtotal $2,205,000 $2,424,000 $4,629,000

Insect Control Cost Damage Total
14
Dairy Cattle
Horn fly $18,000 $61,200 $79,200
Lice 27,000 55,000 82,000
Stable fly 99,000 997,000 1,096,000
Grubs 94,000 12,000 106,000
Horse fly 187,000 950,000 1,137,000
Subtotal $425,000 $2,075,200 $2,500,200
Horses
Lice $74,000 $10,000 $84,000
Stable fly 998,000 100,000 1,098,000
House fly 800,000 78,000 878,000
Horse fly 60,000 170,000 230,000
Bots 99,000 85,000 184,000
Subtotal $2,031,000 $443,000 $2,474,000
Poultry (Layers)
Lice $22,000 $20,000 $42,000
House fly 380,000 299,000 679,000
Darkling beetle 47,000 94,000 141,000
Mites 153,000 362,000 515,000
Subtotal $602,000 $775,000 $1,377,000
Poultry (Breeders)
Lice $39,000 $16,000 $55,000
House fly 440,000 590,000 1,030,000
Darkling beetle 42,000 230,000 272,000
Mites 300,000 999,000 1,299,000
Subtotal $821,000 $1,835,000 $2,656,000
Poultry (Broilers)
House fly $1,020,000 $902,000 $1,922,000
Darkling beetle 4,427,000 7,224,000 11,651,000
Subtotal $5,447,000 $8,126,000 $13,573,000
Grand Total $23,140,000 $31,388,400 $54,528,400

15
Ornamental, Lawn and Turf Insects
R. Oetting, W. Hudson and K. Braman
The ornamentals, lawn, and turf section covers estimates for both the production andmaintenance industries. The economic impact is inflated more by the maintenance industry thanproduction industry. The use of pesticides by homeowners and professional pest controloperators for control of pests around public areas (schools, industrial sites, hotels and motels,financial institutions, hospitals, municipal and private parks, shopping centers, higher educationinstitutions, churches, cemeteries, golf courses) contribute to determining the costs of control anddamage.
Ornamental production of floricultural crops is primarily under greenhouse culture andhas spring and fall pest problems. Field production has been on a decline and there are only afew commercial field production operations left. There is a substantial amount of outdoorproduction of bedding plants near greenhouses as part of the overall production. Populations ofwhiteflies, including the resistant Q-strain of Bemesia tobacci, were down slightly but costs oftreatment were up due to the more costly materials used by many growers. Mealybugs and spidermites were generally manageable. Leafminers were serious pests for those few growers who hadthem; they were essentially uncontrollable where the problem is longstanding.
Approximately 24% of Georgia homeowners purchase lawn care and landscapemaintenance services (Jordan et al., 1999) and the Atlanta Metro Area is consistently one of thelargest lawn care markets in the United States. The number of landscape installation andmaintenance firms in Georgia exceeded 2,300 and provided employment for over 42,000 individuals. The majority of these firms (63%) serviced at least 100 acres of lawns andlandscapes, and it is estimated that all firms together serviced approximately 225,000 landscapeacres.
In 2006, the major insect problems on woody ornamentals, both in home landscapes andcommercial landscape maintenance, included various species of scale insects, mealybugs, mites,aphids, whiteflies, various caterpillars, foliage feeding beetles, borers, and lace bugs. Scaleproblems, in particular, have become much more manageable with the introduction over the lastfew years of new insecticides with excellent efficacy on these pests. This has reduced the damageassociated with scales and mealybugs, but the costs have dropped more slowly as these materialsare relatively expensive.
The turf industry in Georgia, including production, sales, installation and maintenance, isestimated to be worth over $1.6 billion annually. There are currently 445 golf courses inoperation in the state, with more under construction or in planning. There are over 750 footballfields, thousands of acres of turf on school grounds (public and private), and more than 25,000acres of turf in parks. In total, there are almost 2 million acres of turf grass in the state. TheAtlanta metro area has been the strongest housing market and largest lawn care market in thecountry. Continued demand for quality sod has fueled an expansion of the state’s sod productionindustry to over 38,000 acres, more than double the acreage in 1998.

16
Although mole crickets are found only in the coastal plain region, they are so destructiveand difficult to control that a significant proportion of the losses and control costs due to insectsstatewide are due to these pests. The damage done by mole crickets in well managed turf hasbeen dropping over the last few seasons, as newer insecticides have become widely available. These materials are expensive but very effective and once mole crickets are controlled in a givenarea, they may take several seasons to build back up to destructive population levels. Whitegrubs and billbugs in zoysiagrass production continue to cause significant losses, although whitegrubs are also more manageable with newer insecticides.
Private units considered in preparing the loss estimates for 2006.
Households 3,006,000
Floriculture (18.4 million ft2) 1,025
Nurseries (3,600 acres containers) 1,285
Nurseries (5,825 acres field) 1,800
Sod farms (38,000 acres) 100
Estimates of Losses and Control Costs
Insect Cost of Control Damage Total
Ornamentals
Scale insects & mealybugs $25,500,000 $20,000,000 $45,500,000
Mites 24,750,000 22,300,000 47,050,000
Aphids 8,370,000 2,000,000 10,370,000
Whiteflies 9,000,000 4,235,000 13,235,000
Thrips 7,745,000 7,500,000 15,245,000
Caterpillars1 1,850,000 1,300,000 3,150,000
Slugs and snails 2,000,000 850,000 2,850,000

Insect Cost of Control Damage Total
17
Beetles2 1,650,000 2,700,000 4,350,000
Lace bugs 1,750,000 300,000 2,050,000
Spittle bugs 400,000 90,000 490,000
Miscellaneous3 5,465,000 2,850,000 8,315,000
Subtotal $88,480,000 $64,125,000 $152,605,000
Lawns and Turf
Mole crickets $ 11,855,000 $3,000,000 $14,855,000
Caterpillars4 3,600,000 2,300,000 5,900,000
White grubs 3,350,000 1,850,000 5,200,000
Cinch bugs 1,150,000 1,500,000 2,650,000
Spittle bugs 900,000 1,710,000 2,610,000
Miscellaneous5 2,835,000 2,835,000 5,670,000
Subtotal $23,690,000 $13,195,000 $36,885,000
Grand Total $112,170,000 $77,320,000 $189,490,000
1Primarily bagworm, cutworms, corn earworms, loopers, azalea caterpillars, tent caterpillars, webworms, and leaf rollers.2Primarily leaf beetles, Japanese weevils, Fuller Rose weevils, Japanese beetles, whitefringed beetles, and borers.3Includes grasshoppers, fungus gnats, millipedes, sowbugs, psocids, springtails, ants, earwigs, and leafminers.4Sodwebworms, armyworms, cutworms.5Ants (fire ants are included in a separate report), billbugs, leafhoppers, bermudagrass mites and stunt mites.
18
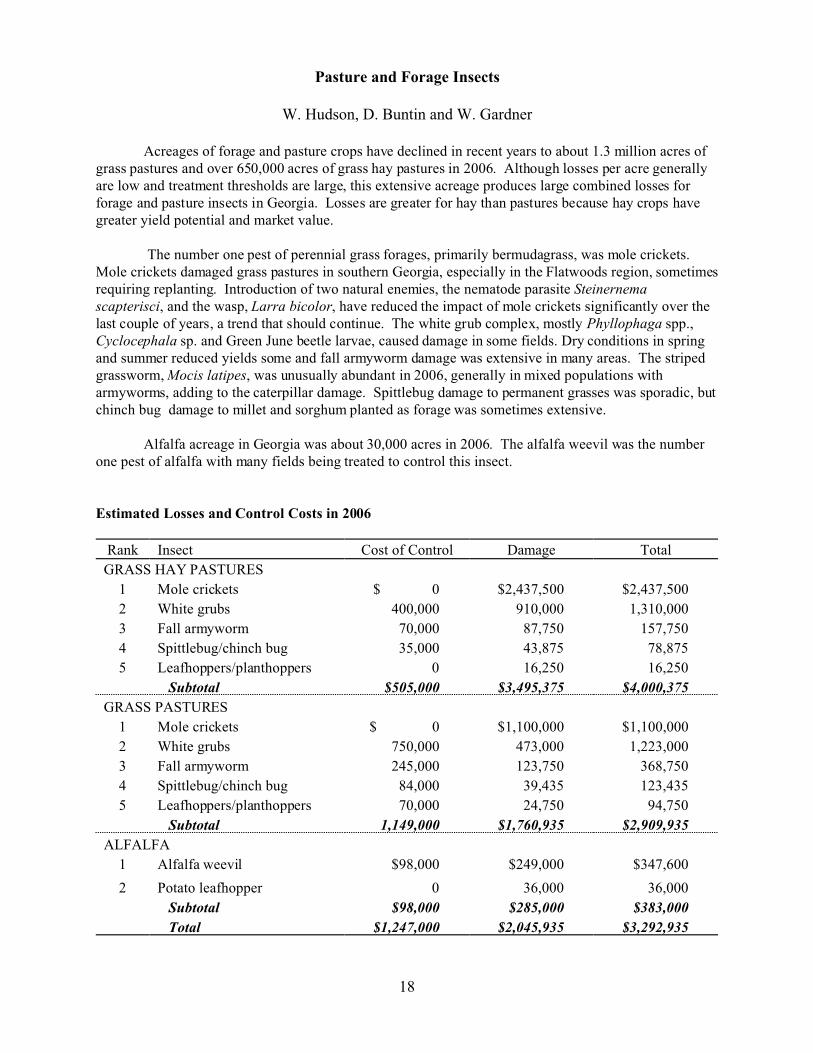
Pasture and Forage Insects
W. Hudson, D. Buntin and W. Gardner
Acreages of forage and pasture crops have declined in recent years to about 1.3 million acres ofgrass pastures and over 650,000 acres of grass hay pastures in 2006. Although losses per acre generallyare low and treatment thresholds are large, this extensive acreage produces large combined losses forforage and pasture insects in Georgia. Losses are greater for hay than pastures because hay crops havegreater yield potential and market value.
The number one pest of perennial grass forages, primarily bermudagrass, was mole crickets. Mole crickets damaged grass pastures in southern Georgia, especially in the Flatwoods region, sometimesrequiring replanting. Introduction of two natural enemies, the nematode parasite Steinernemascapterisci, and the wasp, Larra bicolor, have reduced the impact of mole crickets significantly over thelast couple of years, a trend that should continue. The white grub complex, mostly Phyllophaga spp.,Cyclocephala sp. and Green June beetle larvae, caused damage in some fields. Dry conditions in springand summer reduced yields some and fall armyworm damage was extensive in many areas. The stripedgrassworm, Mocis latipes, was unusually abundant in 2006, generally in mixed populations witharmyworms, adding to the caterpillar damage. Spittlebug damage to permanent grasses was sporadic, butchinch bug damage to millet and sorghum planted as forage was sometimes extensive.
Alfalfa acreage in Georgia was about 30,000 acres in 2006. The alfalfa weevil was the numberone pest of alfalfa with many fields being treated to control this insect.
Estimated Losses and Control Costs in 2006
Rank Insect Cost of Control Damage Total
GRASS HAY PASTURES
1 Mole crickets $ 0 $2,437,500 $2,437,500
2 White grubs 400,000 910,000 1,310,000
3 Fall armyworm 70,000 87,750 157,750
4 Spittlebug/chinch bug 35,000 43,875 78,875
5 Leafhoppers/planthoppers 0 16,250 16,250
Subtotal $505,000 $3,495,375 $4,000,375
GRASS PASTURES
1 Mole crickets $ 0 $1,100,000 $1,100,000
2 White grubs 750,000 473,000 1,223,000
3 Fall armyworm 245,000 123,750 368,750
4 Spittlebug/chinch bug 84,000 39,435 123,435
5 Leafhoppers/planthoppers 70,000 24,750 94,750
Subtotal 1,149,000 $1,760,935 $2,909,935
ALFALFA
1 Alfalfa weevil $98,000 $249,000 $347,600
2 Potato leafhopper 0 36,000 36,000
Subtotal $98,000 $285,000 $383,000
Total $1,247,000 $2,045,935 $3,292,935

19
Information Pertaining to Control of Major Pasture and Forage Insect Pests in Georgia in2006.
Insect
No. Acres
Needing
Control
No. Acres
Treated
No. of
Acres
Applic.
Avg. Cost Per
Unit Treated1
Ton Loss on
Units Treated
Tons Loss on
Units
Untreated
GRASS HAY PASTURES
Mole crickets 100,000 N/A 0 37,500
White grubs 60,000 40,000 1 10.00 4,000 10,000
Fall armyworm 25,000 10,000 1 7.00 250 1,100
Spittlebug 10,000 5,000 1 7.00 50 625
Leafhoppers/
plantbugs
2,000 0 0 N/A 250
GRASS PASTURES
Mole crickets 75,00 0 12.00 0 37,500
White grubs 100,000 75,000 1 10.00 3,000 5,600
Fall armyworm 75,000 35,000 1 7.00 350 1,900
Spittlebug 24,000 12,000 1 7.00 140 577
Hoppers 20,000 10,000 1 7.00 75 375
ALFALFA HAY
Alfalfa weevil 15,000 14,000 1 7.00 1,120 800
Potato leafhopper 1,500 0 0 N/A 0 300
NOTE: Hay crops consisted of 650,000 acres of grasses (hybrid bermudagrass 75%; tall fescue 20%;and other grasses 5%), with an average yield of 1.8 tons per acre. Alfalfa acreage was 30,000 acres withan average yield of 3.5 tons per acre. Grass and clover hay were valued at $65 per ton and alfalfa haywas worth $130 per ton. Permanent pasture consisted of 500,000 acres of bahiagrass and 800,000 acresof fescue, fescue/clover mixtures and fescue/common bermudagrass. Average yield was estimated at0.75 ton per acre with a value of $55 per ton. An additional 400,000 acres of temporary pasture (mostlysmall grains and sorghum) was grazed. There were 150,000 acres of sorghum and millet silageharvested. Silage and temporary pasture crops were included as pasture grasses.
1 Application cost not included.
20
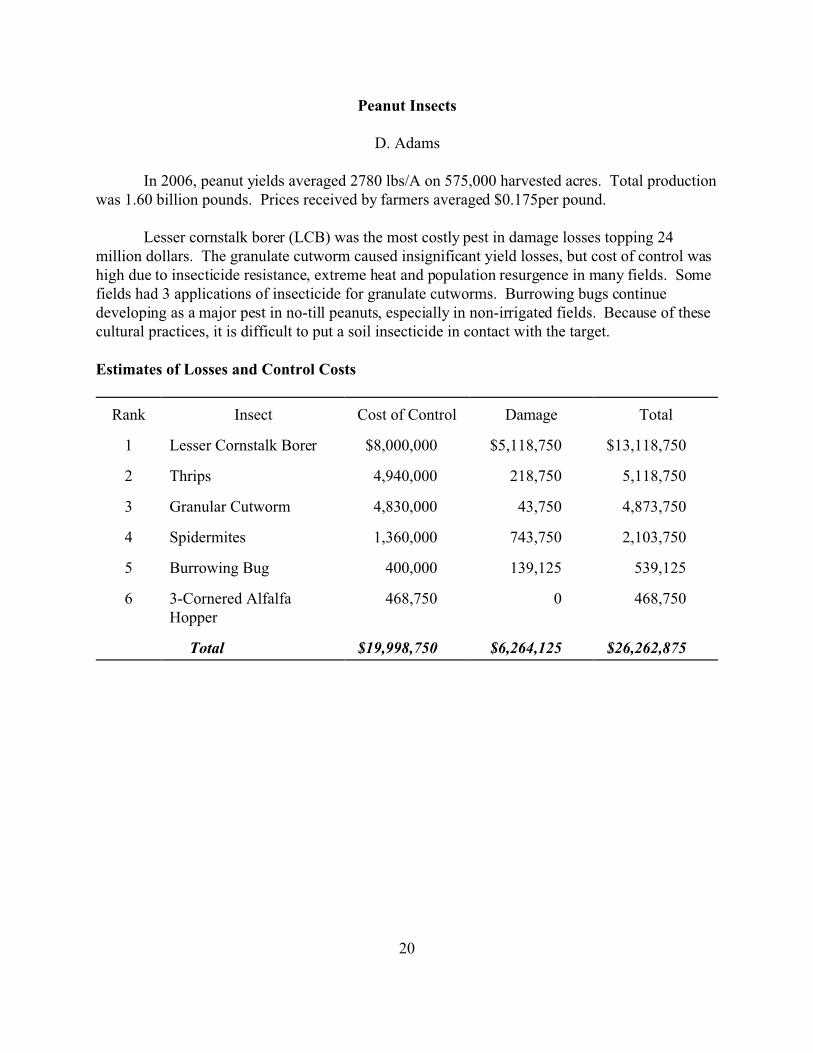
Peanut Insects
D. Adams
In 2006, peanut yields averaged 2780 lbs/A on 575,000 harvested acres. Total productionwas 1.60 billion pounds. Prices received by farmers averaged $0.175per pound.
Lesser cornstalk borer (LCB) was the most costly pest in damage losses topping 24million dollars. The granulate cutworm caused insignificant yield losses, but cost of control washigh due to insecticide resistance, extreme heat and population resurgence in many fields. Somefields had 3 applications of insecticide for granulate cutworms. Burrowing bugs continuedeveloping as a major pest in no-till peanuts, especially in non-irrigated fields. Because of thesecultural practices, it is difficult to put a soil insecticide in contact with the target.
Estimates of Losses and Control Costs
Rank Insect Cost of Control Damage Total
1 Lesser Cornstalk Borer $8,000,000 $5,118,750 $13,118,750
2 Thrips 4,940,000 218,750 5,118,750
3 Granular Cutworm 4,830,000 43,750 4,873,750
4 Spidermites 1,360,000 743,750 2,103,750
5 Burrowing Bug 400,000 139,125 539,125
6 3-Cornered AlfalfaHopper
468,750 0 468,750
Total $19,998,750 $6,264,125 $26,262,875

21
Information Pertaining to Control of Major Peanut Insect Pests in Georgia in 2006.
Insect
No. Acres
Needing
Control
No. Units
Treated
No. of Unit
Applic.
Avg. Cost
per Unit
Treated1
Yield Loss
on Units
Treated2
(Avg/A)
Yield Loss
on Units
Untreated2
(Avg/A)
Lesser Cornstalk
Borer
225,000 400,000 1 20.00 24,750,000
(110)
4,500,000
(500)
Thrips3 480,000 520,000 1 9.50 0 1,250,000
(250)
Granulate Cutworm 230,000 300,000 1.85 12.00 0 250,000
(125)
Spidermites 85,000 85,000 1 16.00 4,250,000
(50)
0
Burrowing Bugs 8,000 20,000 1 20.00 720,000
(90)
75,000
(150)
3-Cornered alfalfa
hopper
70,000 75,000 1 6.25 0 0
1Includes application costs.2Yield units measured in pounds.3Losses due to Tomato Spotted Wilt Virus (TSW V) are not included.

22
Pecan Insects
W. Hudson and J. Dutcher
Extreme drought in late-season 2005, coupled with an extremely dry spring, stressed treesand reduced the crop in what was already an “off” year to just 42 million lbs. Prices were strong,so overall value of the crop was $66 million, about 2/3 of 2005 value.
Pecan nut casebearer control costs were higher in 2006 than in recent years. Theemergence of moths began earlier than usual by as much as 2 - 3 weeks, and moths were activefor a longer time. Some areas experienced two peaks of flight and egg-laying activity. For someof the major production areas, a single insecticide application was not sufficient even if timingwas right for the first part of the casebearer flight. Damage to newly-set nuts was as high as 60%in some orchards. The trees proved flexible in responding to such early damage, and effect onyield was no larger than normal, but control costs were up significantly. Aphid and mitepopulations, and damage and control costs associated with these pests, were down slightly from2005.
Estimate of Losses and Control Costs
Rank Insect Cost of Control Damage Total
1 Pecan weevil $4,050,000 $2,471,299 $6,521,229
2 Black pecan aphids 1,999,500 1,797,991 3,797,491
3 Mites3 1,800,000 210,527 2,010,527
4 Hickory shuckworm 650,000 283,092 933,092
5 Yellow aphids1,2 600,000 92,231 692,231
6 Pecan nut casebearer 520,000 0 520,000
7 Spittlebugs 50,000 0 50,000
8 Kernel feedinghemipterans
45,000 276,500 321,500
9 Others4 120,000 102,068 222,068
Total $9,834,500 $5,233,638 $15,068,138
1“Yellow aphids” include the yellow pecan aphid and the blackmargined aphid.2The cost of control of yellow aphids includes $60 per acre for application of aldicarb or imidacloprid and $10 per
acre for foliar sprays.3“Mites” refers primarily to the pecan leaf scorch mite. 4“Others” include the pecan bud moth, casebearers, leaf miners, fall webworm, phylloxeras, walnut caterpillar,
boring insects, Prionus spp., hickory nut curculio, and hickory shoot curculio.

23
Information Pertaining to Control of Major Pecan Insect Pests in Georgia in 2006.
Insect
No. Units
Needing
Control
No. Units
Treated
No. of
Unit
Applic.1
Avg. Cost
Per Units
Treated
Yield Loss
on Units
Treated2
Yield Loss
on Units
Untreated3
Pecan weevil 113,000 90,000 3.0 $15.00 285,768 1,278,301
Black pecan aphids 75,000 100,000 1.5 13.33 822,150 315,819
Hickory shuckworm 75,000 50,000 2.0 6.50 56,700 122,472
Yellow pecan aphids4 25,000 40,000 1.5 10.00 31,300 27,074
Mites5 10,000 60,000 1.5 20.00 104,895 28,350
Pecan nut casebearer 75,000 80,000 1.0 6.50 0 0
Spittlebugs 0 5,000 1.0 10.00 0 0
Kernel feeding
hemipterans6
10,000 5,000 1. 9.00 115,000 60,000
Others7 20,000 10,000 1.0 12.00 26,400 38,200
1Some app lications contro l more than one pest and the number of applications indicated were not made in all
orchards.2Excluding application costs.3Yield units measured in pounds.4“Yellow aphids” include the yellow pecan aphid and the black-margined aphid.5“Mites” refers primarily to the pecan leaf scorch mite.6“kernel feeding hemipteran” include the southern green stink bug, the brown stink bug, the leaf-footed bug and
others 7“Others” include the pecan bud moth, pecan leaf casebearer, leaf miners, fall webworm, walnut caterpillar,
phylloxeras, boring insects, Prionus spp., hickory nut curculio, and hickory shoot curculio.

24
Public Health and Recreational Area Insects
E. Gray
In 2006, mosquitoes were the most important and expensive public health pests. Mosquito control and
surveillance continued to receive more emphasis as a result of WN V awareness; however support from the Centers
for Disease Control for viral testing has begun to decline. Likewise, funding at most of the state’s mosquito control
programs has stabilized as interest in W NV subsided. Coastal areas with continued population growth continue to
increase support for organized mosquito control. Surveillance for all types of mosquito borne encephalitis has been
greatly expanded and the Georgia Department of Human Resources continues to provide leadership in this area.
However, decreased CDC funding has begun restricting how many and what type of mosquitoes and birds were
tested.
In 2006, there were 9 confirmed human cases of West Nile virus causing 1 death. Mosquito surveillance
continues to indicate that the Southern House mosquito, Culex quinquefasciatus appears to be our primary vector of
WNV in Georgia. This species prefers to breed in polluted waters contaminated with organic matter and is often
found in the storm drains in cities and towns. M ost areas with significant storm drain systems continue to treat these
areas extensively with mosquito larvicides.
In general, mosquito numbers were normal throughout most of the season. Limited hurricane activity did
not produce any significant flooding events. Only one case of eastern equine encephalitis was reported in both 2006
as well as 2005. Similarly, only one case of LaCrosse encephalitis was reported in both 2006 and 2005 . No St. Louis
encephalitis was reported during either of these seasons. Imported malaria continues to be relatively common with 88
cases being reported in 2006 and 50 cases in 2005. Another significant international disease that is imported into
Georgia is Dengue. In 2006 one case was observed with five cases occurring in 2005.
Houseflies also continue to be significant pests with the primary concerns being garbage management and
exclusion aspects. Ticks, primarily lone star ticks, American dog ticks and blacklegged ticks were present in many
sections of the state. Their bite and their ability to serve as vectors of Lyme disease and Rocky Mountain Spotted
Fever (RMSF) made them important public health arthropods. There were 7 cases of Lyme disease in 2006, down
from 10 cases in 2005 and 13 cases in 2004. T here were 10 cases in 2003 and the 5 cases in 2002. Rocky Mountain
Spotted Fever continues to be the most common tick borne disease in the state with 48 cases in 2006, down from the
83 cases in 2005 and 73 cases reported in 2004 and 65 cases reported in 2003. The Georgia Department of Human
Resources, Epidemiology and Prevention Branch has completed an extensive tick attachment survey that will shed
additional light on our tick/host/disease situation in Georgia. Results should be available in 2007. (Data on vector
borne disease provided by the Office of Epidemiology and Prevention Branch, Georgia Department of Human
Resources).
Estimates of Losses and Control Costs
Rank Insect Cost of Control
1 Mosquitoes $126,965,513
2 Flies (non-biting) 58,250,234
3 Others1 20,837,352
4 Ticks and Chiggers 7,244,712
5 Headlice 6,534,552
25
6 Yellow Jackets 5,581,771
Total $225,414,134
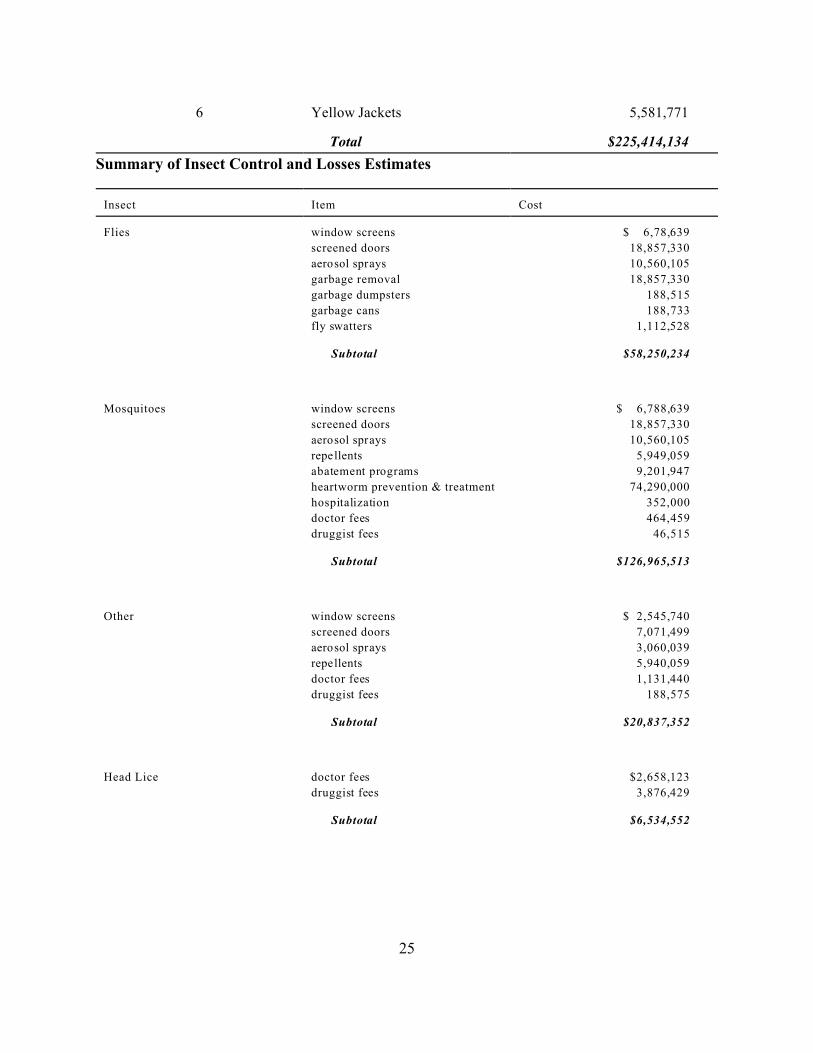
Summary of Insect Control and Losses Estimates
Insect Item Cost
Flies window screens
screened doors
aerosol sprays
garbage removal
garbage dumpsters
garbage cans
fly swatters
$ 6,78,639
18,857,330
10,560,105
18,857,330
188,515
188,733
1,112,528
Subtotal $58,250,234
Mosquitoes window screens
screened doors
aerosol sprays
repellents
abatement programs
heartworm prevention & treatment
hospitalization
doctor fees
druggist fees
$ 6,788,639
18,857,330
10,560,105
5,949,059
9,201,947
74,290,000
352,000
464,459
46,515
Subtotal $126,965,513
Other window screens
screened doors
aerosol sprays
repellents
doctor fees
druggist fees
$ 2,545,740
7,071,499
3,060,039
5,940,059
1,131,440
188,575
Subtotal $20,837,352
Head Lice doctor fees
druggist fees
$2,658,123
3,876,429
Subtotal $6,534,552
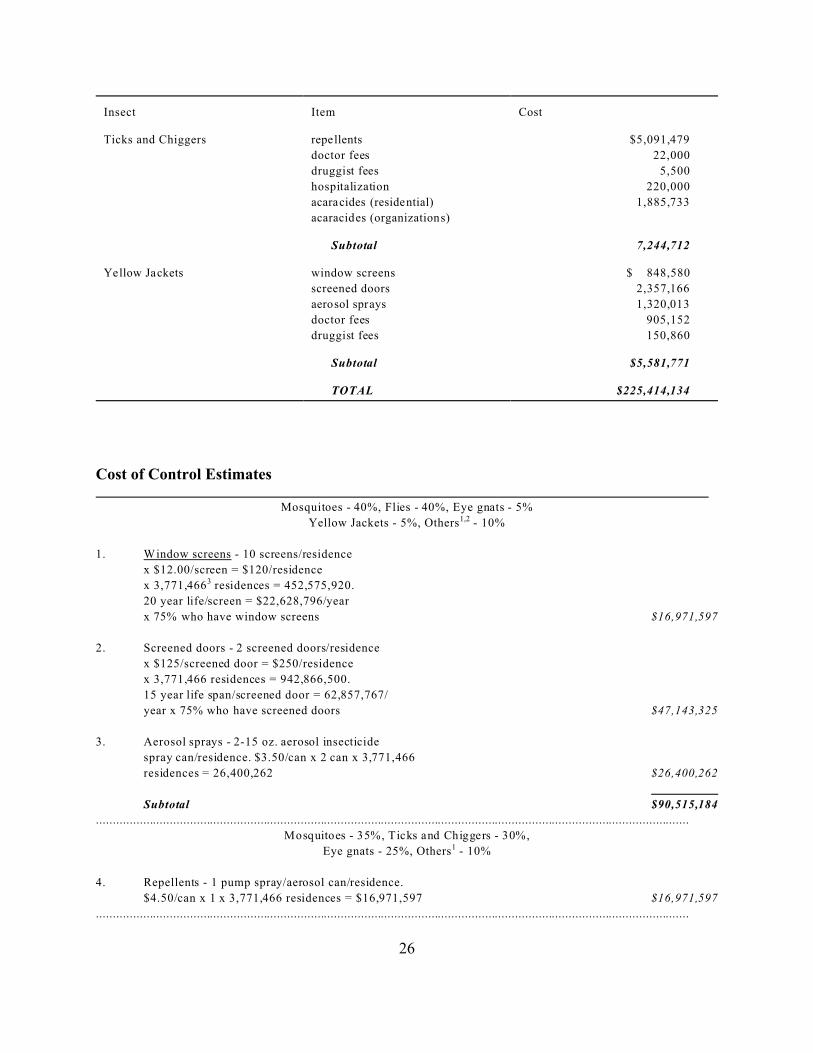
Insect Item Cost
26
Ticks and Chiggers repellents
doctor fees
druggist fees
hospitalization
acaracides (residential)
acaracides (organizations)
$5,091,479
22,000
5,500
220,000
1,885,733
Subtotal 7,244,712
Yellow Jackets window screens
screened doors
aerosol sprays
doctor fees
druggist fees
$ 848,580
2,357,166
1,320,013
905,152
150,860
Subtotal $5,581,771
TOTAL $225,414,134
Cost of Control Estimates
Mosquitoes - 40%, Flies - 40%, Eye gnats - 5%
Yellow Jackets - 5%, Others1,2 - 10%
1. Window screens - 10 screens/residence
x $12.00/screen = $120/residence
x 3,771,4663 residences = 452,575,920.
20 year life/screen = $22,628,796/year
x 75% who have window screens $16,971,597
2. Screened doors - 2 screened doors/residence
x $125/screened door = $250/residence
x 3,771,466 residences = 942,866,500.
15 year life span/screened door = 62,857,767/
year x 75% who have screened doors $47,143,325
3. Aerosol sprays - 2-15 oz. aerosol insecticide
spray can/residence. $3.50/can x 2 can x 3,771,466
residences = 26,400,262 $26,400,262
Subtotal $90,515,184
.................................................................................................................................................................................
Mosquitoes - 35%, Ticks and Chiggers - 30%,
Eye gnats - 25%, Others1 - 10%
4. Repellents - 1 pump spray/aerosol can/residence.
$4.50/can x 1 x 3,771,466 residences = $16,971,597 $16,971,597
.................................................................................................................................................................................

27
Mosquitoes - 100%
5. Mosquito Abatement Program
(a) Twelve major programs (Bibb, Camden, Chatham,
Clayton, Cobb, DeKalb, Dougherty, Fulton
Glynn, Liberty, Muscogee and Richmond Counties) $6,269,211
(b) About 128 county/city programs @ approximately $22,912/
program $2,932,736

28
6. Doctor fees - 88 imported malaria cases
$4005/case x 88 cases = $35,200 $35,200
7. Hospitalization - $4,0005/case x 88 cases = $352,000 $352,000
8. Druggist Fees - $1005/case x 88 = $8,800 $8,800
8a. West Nile Encephalitis - average inpatient medical costs7 =
$17,219/case x 9 cases = $154,971 $154,971
8b. LaCrosse Encephalitis - average impatient medical costs8 =
$48,000/case x 1 cases = $48,000 $48,000
8c. Heartworm prevention in pets $60,000,000
8d. Treating pets with heartworm $14,290,000
Subtotal $84,053,918
.................................................................................................................................................................................
Flies - 100%
9. Garbage removal - $50/residence/year x 3,771,466
residences = $188,573,300 x 10% (portion attributed
to insect control) = $18,857,330/year $18,857,330
10. Garbage disposal units (dumpsters - county, commercial
and industrial) - $500/unit; 1 unit/100 residences.
37,715 units x $500 x 10% (portion attributed to
insect control) = $1,885,750. 10 year life span/
unit = $188,575 $188,575
11. Garbage cans (residential) - 2/residence = $15/can x 2
x 3,771,466 residences = $113,143,980 x 10% (portion
attributed to insect control) = $11,314,398. 6 year
life span/can = $1,885,733 $1,885,733
12. Fly swatters - 1 fly swatter/residence $0.59/fly swatter
x 1 x 3,771,466/2 residences = $1,112,582 $1,112,582
Subtotal $22,044,220
.................................................................................................................................................................................
Ticks and Chiggers - 100%
13. Acaracides (residential) - of 3,771 ,466 residences,
estimated 5% purchase $10.00 acaracide for
tick control in yards $1,885,733
14. Acaracides (public and private organizations) $20,000
15. Doctor fees - 48 RMSF cases and 7 Lyme case
$4005/case x 55 cases = $34,400 $22,000

29
16. Hospitalization - $4,0005/case x 55 cases
= $344,000 $220,000

30
17. Druggist fees - $1006/case x 55 cases = $8,600 $5,500
Subtotal $2,153,233
.................................................................................................................................................................................
Yellow jackets - 40%, Others1 - 49%, Eye gnats - 1%,
Mosquitoes - 10%
18. Doctor fees (bites and stings) 1 visit/100
residences at $60/visit = 37,715 residences
x $60/visit = $2,262,880 $2,262,880
19. Druggist fees - 1 visit/100 residences at
$10/visit = 37,715 residences x $10 = $328,170 $37,715
Subtotal $2,640,030
.................................................................................................................................................................................
Head lice - 100%
20. Doctor fees - 3% of 1,476,7356 school children
in ages 5-17 = 44,302 x $60/visit = $2,658,123 $2,658,123
21. Druggist fees - pediculicides for head lice -
$17.50/pediculicide x 1,476,7356 school
children in ages 5-17 15% estimated
infestation = $3,876,429 $3,876,429
Subtotal $6,534,552
1"Others include eye gnats, spiders, biting flies, bees and other stinging insects (other than yellow jackets).2Estimated percent importance insect has to control.3Estimate of number households, US Census Bureau.4Based on survey for mosquito control programs by Cooperative Extension Service 2005.5Based on New York State Department of Health report of over $4,000 hospital cost/care of Lyme disease
reported by CDC, Lyme Disease Surveillance, Volume 4, Number 2, March 1993.6Based on 2000 Georgia County Guide, Cooperative Extension Service7CDC National WNV Conference 20038Public Health Confronts the Mosquito: Developing Sustainab le State and Local Mosquito Control Programs, A
Project of the Association of State and Local Territorial Health Officials, 2005.
31
Small Grain Insects
D. Buntin and J. All
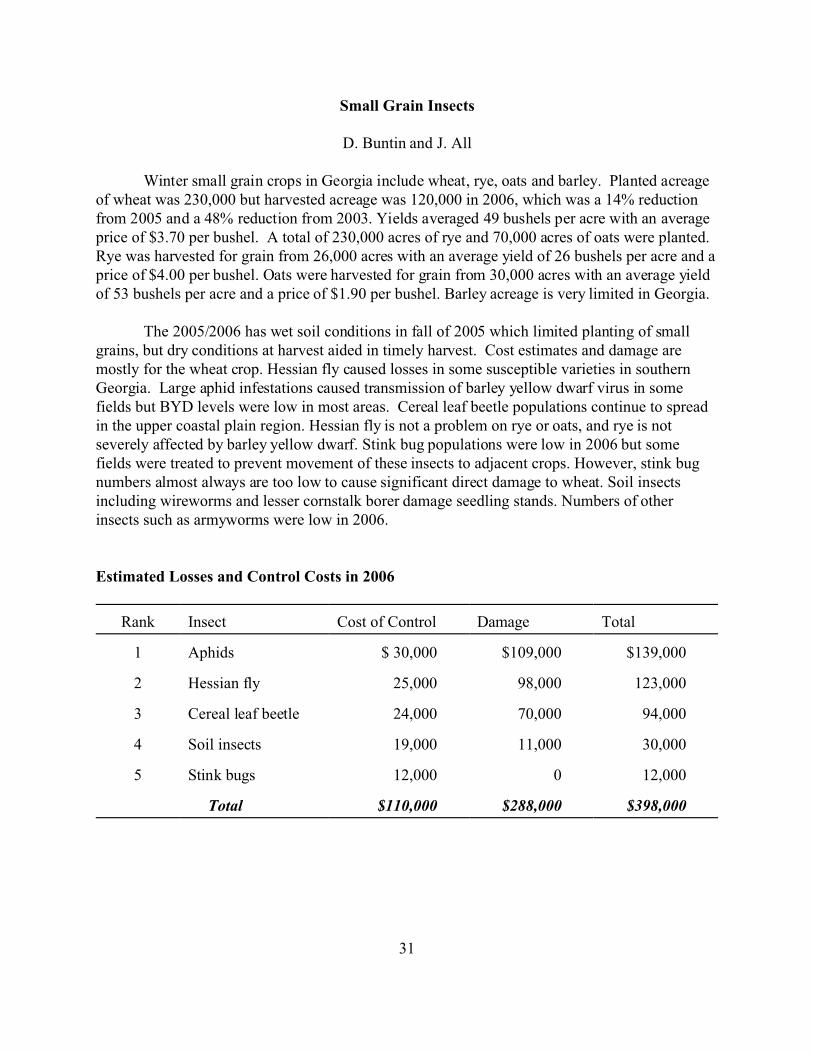
Winter small grain crops in Georgia include wheat, rye, oats and barley. Planted acreageof wheat was 230,000 but harvested acreage was 120,000 in 2006, which was a 14% reductionfrom 2005 and a 48% reduction from 2003. Yields averaged 49 bushels per acre with an averageprice of $3.70 per bushel. A total of 230,000 acres of rye and 70,000 acres of oats were planted. Rye was harvested for grain from 26,000 acres with an average yield of 26 bushels per acre and aprice of $4.00 per bushel. Oats were harvested for grain from 30,000 acres with an average yieldof 53 bushels per acre and a price of $1.90 per bushel. Barley acreage is very limited in Georgia.
The 2005/2006 has wet soil conditions in fall of 2005 which limited planting of smallgrains, but dry conditions at harvest aided in timely harvest. Cost estimates and damage aremostly for the wheat crop. Hessian fly caused losses in some susceptible varieties in southernGeorgia. Large aphid infestations caused transmission of barley yellow dwarf virus in somefields but BYD levels were low in most areas. Cereal leaf beetle populations continue to spreadin the upper coastal plain region. Hessian fly is not a problem on rye or oats, and rye is notseverely affected by barley yellow dwarf. Stink bug populations were low in 2006 but somefields were treated to prevent movement of these insects to adjacent crops. However, stink bugnumbers almost always are too low to cause significant direct damage to wheat. Soil insectsincluding wireworms and lesser cornstalk borer damage seedling stands. Numbers of otherinsects such as armyworms were low in 2006.
Estimated Losses and Control Costs in 2006
Rank Insect Cost of Control Damage Total
1 Aphids $ 30,000 $109,000 $139,000
2 Hessian fly 25,000 98,000 123,000
3 Cereal leaf beetle 24,000 70,000 94,000
4 Soil insects 19,000 11,000 30,000
5 Stink bugs 12,000 0 12,000
Total $110,000 $288,000 $398,000

32
Information Pertaining to Control of Major Small Grain Insect Pests in Georgia in 2006
Insect
No. Acres
Needing
Control
No. Acres
Treated
No. Acres
Applic.
Avg. Cost
Per Unit
Treated1
Yield Loss
on Units
Treated
Yield Loss
on Units
Untreated
Aphids 12,000 6,000 1 6.00 6,000 23,000
Hessian fly 10,000 6,000 1 7.00 0 26,000
Cereal leaf
beetle
12,000 7,400 1 5.00 0 19,000
Soil insects 2,400 1,200 1 8.00 0 3,000
Stink bugs 0 24,00 1 6.00 0 0
1Application cost not included.

33
Soybean Insects
P.M. Roberts and R.M. McPherson
Soybeans were harvested from 140,000 acres during 2006 with an average yield of 25 bushelsper acre. The average price received was $6.00 per bushel, making the value of the 2006 soybean crop inGeorgia worth $21 million (NASS, http:/www.nass.usda.gov). The 2006 production year was plaguedwith dry weather during June and July. Favorable conditions during late summer and fall allowed for anaverage crop to be produced. As a whole insect problems in soybean were limited.
Stink bugs were the primary insect pest of soybeans during 2006, however control costs andlosses were significantly lower that during recent years. Total control costs and losses associated withstink bugs totaled $660,000 or about $5 per acre. The most common stink bug species observed includedthe southern green, brown, and green stink bugs. Thyanta spp. and Euschistus spp. were alsooccasionally observed. Populations were generally light to moderate with some isolated areasexperiencing high infestations.
Velvetbean caterpillar and soybean loopers were the primary foliage feeding insects observedand were the number two and three ranked insect pests in terms of control costs and losses ($352,250 and$167,400 respectively). As with stink bugs foliage feeding insect pest infestations were light tomoderate. Corn earworm populations were generally low on soybeans throughout the state.
Additional soybean insect pests observed throughout the stateincluded whiteflies, grasshoppers,threecornered alfalfa hoppers, whitefringed beetles, cucumber beetles, spider mites, lesser cornstalkborer, and Mexican bean beetles, Japanese beetles, and soybean aphids in north Georgia. Soybean aphidcontinues to be monitored and detected in Georgia soybeans, but to date has not been an economicproblem.
Recommended insecticides provided good control for all major soybean pests when theappropriate rate was applied at the appropriate time.
Estimates of Losses and Control Costs for Soybean Insect pests in 2006
Rank Insect Cost of Control Damage Total
1 Stink bugs1 $504,000 $156,000 $660,000
2 Velvetbean caterpillar 271,250 81,000 352,250
3 Soybean looper 147,000 20,400 167,400
4 Other2 25,500 39,600 65,100
5 Corn earworm 8,750 6,900 15,650
Total $956,500 $303,900 $1,260,400

34

35
Information Pertaining to Control of Major Soybean Insect Pests in Georgia in 2006
Insect
No. AcresNeedingControl
No.AcresTreated
No. ofAcreAppl.
Ave. CostPer UnitTreated1
YieldLoss onUnitsTreated2
Yield Losson UnitsUntreated2
Stink bugs3 60,000 56,000 1.0 $9.00 14,000 12,000
Velvetbeancaterpillar
40,000 35,000 1.0 7.75 3,500 10,000
Soybean looper 15,000 14,000 1.0 10.50 1,400 2,000
Other4 5,000 3,000 1.0 8.50 600 6,000
Corn earworm 1,500 1,000 1.0 8.75 150 1,000
1Includes application costs.2Yield units measured in bushels.3Includes the southern green, green and brown stink bugs.4Others include threecornered alfalfa hoppers, whiteflies, grasshoppers, whitefringed beetles, spider mites, Japanese beetles, Mexican bean beetles, lesser cornstalk borers, cucumber beetles, and soybean aphids.

36
Tobacco Insects
R.M. McPherson
Tobacco was harvested from 16,000 acres in 2006, about the same as the 2005 harvest. Georgia’s average yield was 1900 pounds per acre. The average price received in 2006 was$147.00 per cwt, making the value of the crop $44.7 million.
The tobacco budworm was the number one insect pest on flue-cured tobacco in Georgia,with total losses exceeding $0.7 million due to control costs and damage. This was down somefrom 2005, when this pest caused over $1.0 million in losses. More of the losses in 2006 weredue to damage rather than to costs of control.
Thrips were the second most economically damaging pest, costing Georgia producersover $0.5 million. All of these reported losses were due to control costs. However, over $4.9million were reported lost due to tomato spotted wilt virus, a disease that is vectored by certainthrips species. Tobacco hornworms were the third most economically damaging pest, costingGeorgia growers over $0.4 million.
Wireworms and mole crickets were the fourth and fifth most damaging tobacco pests,totaling nearly $0.3 and $0.2 million, respectively. All other pests accounted for $102,000 inlosses in 2006. These other pests were primarily splitworms, aphids, flea beetles, armyworms,cutworms, grasshoppers, and cucumber beetles.
Estimate of Losses and Control Costs for Tobacco Insect pests in 2006.
Rank Insect Cost of Control Damage Total
1 Tobacco budworms $ 310,000 $429,000 $ 739,000
2 Thrips 504,000 01 504,000
3 Tobacco hornworms 113,000 335,000 448,000
4 Wireworms 224,000 56,000 280,000
5 Mole crickets 128,000 28,000 156,000
6 Other pests2 29,000 73,000 102,000
Total $1,308,000 $921,000 $2,229,000
1Does not include losses due to spotted wilt virus ($4.95 million in 2006).2Other include splitworms, aphids, flea beetles, grasshoppers, cutworms, cucumber beetles, andarmyworms.
___________________________________*Georgia Farm Report Vol 06 (11).

37
Information Pertaining to Control of Major Tobacco Insect Pests in Georgia in 2006
Insect
No. AcresNeedingControl
No.AcresTreated
No. ofAcreAppl.
Ave. CostPer UnitTreated1
YieldLoss onUnitsTreated2
Yield Losson UnitsUntreated2
Tobacco budworms 12,000 12,800 1.94 $12.50 291,840 0
Thrips 14,400 14,400 1.0 35.00 0 0
Tobacco hornworms 10,400 9,600 1.0 11.75 182,000 45,600
Wireworms 8,000 8,000 1.0 28.00 38,000 0
Mole crickets 4,000 4,000 1.0 32.00 19,000 0
Others3 3,200 2,400 1.0 12.00 11,400 38,000
1Includes application costs.2Field units measured in pounds.3Others include splitworms, aphids, flea beetles, cutworms, armyworms, cucumber beetles, andgrasshoppers.

38
Vegetable Insects
A. Sparks
Specific crop estimates in this report are provided for those vegetable crops with anestimated farm gate value in Georgia of more 10 million dollars. These major vegetable cropswere planted on a estimated 159,900 acres, with a total value in excess of $ 763.8 million. Theestimated insecticide costs and losses due to insects exceeded $ 58.3 million, or approximately7.6 % of the total value of these crops. Extrapolation of this estimate to all vegetables producedin Georgia (total value of $ 828 million) estimates total losses at approximately $ 63 million in2006. This is a conservative estimate as it does not include costs associated with insecticideapplication or costs associated with non-insecticidal controls, such as use of reflective mulches.
Insect pest management in vegetables in Georgia is very dynamic because of the diversityof crops and multiple, overlapping growing seasons for many of these crops. Pest pressure andmanagement requirements in a single crop with distinct spring and fall seasons can vary greatlybetween seasons as well as with location within the state. The estimates reported have beenadjusted to reflect seasonal distribution of specific crops, differences in pest pressure betweenseasons, and estimated costs of the most common insecticides used for specific pests. Thus, for apest that requires a single treatment on 100% of the fall acreage of a crop with only 10% of theacreage in the fall, a total of 0.1 applications is shown. Specific insecticide cost estimates variedfrom $4.00 to $5 per acre per application for pyrethroid insecticides to $50 to $60 per acre forsoil applied neonicotinoid insecticides and some acaricides. Estimated yield losses include directlosses, losses associated with lack of marketability (aesthetic damage), and losses associated withdiseases specifically vectored by insects (mostly viruses which would not occur without theinsect vectors). Overall, these costs and loss estimates are not intended to reflect specific cropproduction in a given season, but reflect overall impact for the 2006 calendar year.
Over 30 % of the estimated losses in 2006 were contributed to viral diseases vectored byinsects. Further, this value does not include the potential impact of recently discovered viruses inonions as some debate still exists as to the actual cause of the problems that have occurred in theonion crop the last few years. As in the past, the majority of direct insect losses were largelyattributed to Lepidopteran insects including defoliators in cole crops, fruit feeders in beans andfruiting vegetables, the caterpillar complex in sweet corn, and pickleworm in cucurbit vegetables.Of note in 2006, the diamondback moth was difficult to control in the Spring, resulting in somefields with complete losses, but populations unexplainably disappeared in the fall. Whitefliesreached exceptionally high densities in some areas in the fall and were difficult to control, evenwith insecticides previously highly efficacious against this pest. The potential for insecticideresistance in whitefly will require careful monitoring in 2007.

39
Estimated acreage, average yields and total value of the top commercial vegetable crops1 inGeorgia, 2006.
Crop Acreage Planted Total Value of Yield
1 Onions 14,900 $ 132,029,000
2 Watermelons 23,900 111,060,000
3 Bell Pepper 5,900 77,057,000
4 Cantaloupe 5,400 60,085,000
5 Tomato 6,100 56,641,000
6 Sweet corn 21,800 55,317,000
7 Snap Beans 22,900 48,792,000
8 Squash (Yellow and Zucchini) 9,800 44,841,000
9 Cucumbers 11,100 43,948,000
10 Cabbage 9,800 31,752,000
11 Collard greens 7,500 22,858,000
12 Turnip Greens 7,100 22,331,000
13 Carrots 2,800 22,095,000
14 Mustard greens 3,600 14,439,000
15 Southern Peas 6,000 10,611,000
16 Eggplant 1,300 10,010,000
Total 159,900 $ 763,866,000
Other vegetables2 10,300 64,280,000
Total all vegetables 170,200 $ 828,146,000
1 Table includes only those specific vegetables with an estimated value greater than 10 million dollars.2Other vegetable crops with a value in excess of one million dollars include: hot peppers (9.7 million), lima beans (5.8), spinach (2.8), kale (2.7), sweet potatoes (2.5), green onions (2.3), pumpkins (2.2), okra (1.8), banana peppers (1.7), Irish potatoes (1.4), winter squash (1.1).

40
Estimates of Insect Control Costs and Losses for Georgia Vegetables, 2006.
Crop1 InsectInsecticideCosts2 ($)
Yield Losses($)
Total Losses($)
Snap Beans (1.85 insecticide applications per season) [6 % yield loss]
Whitefly (0.3) 123,500 1,951,700 2,075,200
Pod feeders (1) 91,500 731,900 823,400
Lesser cornstalk borer (0.1) 13,700 125,000 138,700
Thrips (0.2) 18,300 120,000 138,300
ECB Program (0.25) 22,800 (<0.05%) 22,800
Crop totals 269,800 2,928,600 3,198,400
Cabbage (8.25 insecticide applications per season) [12 % yield loss]
Leps. (DBM, loopers)(7) 1,234,800 3,175,200 4,410,000
Whitefly (1) 392,000 635,000 1,027,000
Aphids (0.25) 12,000 (<0.05%) 12,000
Crop totals 1,638,800 3,810,200 5,449,000
Collard greens (8.15 insecticide applications per season) [8 % yield loss]
Leps. (DBM, loopers) (7) 1,312,500 1,600,000 2,912,500
Whitefly (1) 187,500 228,600 416,100
Aphids (0.15) 4,500 (<0.05%) 4,500
Crop totals 1,504,500 1,828,600 3,333,100
Mustard greens (2.7 insecticide applications per season) [3.5 % yield loss]
Leps. (DBM, loopers) (2.5) 225,000 433,200 658,200
Aphids (0.15) 2,400 72,200 74,600
Yellow-margined leaf beetle (0.05) 900 (<0.05%) 900
Crop totals 228,300 505,400 733,700

41
Crop1 InsectInsecticideCosts2 ($)
Yield Losses($)
Total Losses($)
Turnip greens (2.7 insecticide applications per season) [3.5 % yield loss]
Leps. (DBM, loopers) (2.5) 443,750 669,900 1,113,600
Aphids (0.15) 4,700 111,600 116,300
Yellow-margined leaf beetle (0.05) 1,600 (<0.05%) 1,600
Crop totals 450,000 781,500 1,231,500
Carrots (1.5 insecticide applications per season) [4 % yield loss]
Soil insects & aphids (1.0) 84,000 883,800 967,800
Leps. & aphids (0.5) 6,300 (<0.05%) 6,300
Crop totals 90,300 883,800 974,100
Sweet corn (16 insecticide applications per season) [3 % yield loss]
CEW/FAW/ECB (16)(include ECB Program)
1,569,600 1,659,500 3,229,100
Crop totals 1,569,600 1,659,500 3,229,100
Cucumbers (4.25 insecticide applications per season) [5.25 % yield loss]
Pickleworm, melonworm (3) 149,600 1,318,500 1,468,100
Whitefly (0.75) 249,800 879,000 1,128,800
Cucumber beetles (0.5) 25,000 109,900 134,900
Crop totals 424,400 2,307,400 2,731,800
Cantaloupe (3.5 insecticide application per season) [3.5 % yield loss]
Pickleworm (3) 72,900 1,802,500 1,875,400
Cucumber beetles, other pests (0.5) 12,200 300,400 312,600
Crop totals 85,100 2,102,900 2,188,000

42
Crop1 InsectInsecticideCosts2 ($)
Yield Losses($)
Total Losses($)
Watermelons (1.1 insecticide application per season) [2.25 % yield loss]
‘Rindworms’ (0.75) 80,700 2,221,200 2,301,900
Cucumber beetles, Aphids (0.25) 26,900 277,600 304,500
Spider mites (0.1) 95,600 (<0.05%) 95,600
Crop totals 203,200 2,498,800 2,702,000
Squash (6.25 insecticide applications per season) [16.5 % yield loss]
Whitefly (2) 808,000 4,599,900 5,407,900
Aphids/mosaic viruses (2) 80,800 2,300,000 2,380,800
Pickleworm, melonworm (2) 90,900 1,379,000 1,469,900
Cucumber beetles, others (0.25) 10,100 (<0.05%) 10,100
* Losses associated with transmission of mosaic viruses in late spring and fall crops.
Crop totals 989,800 8,278,900 9,268,700
Eggplant (8 insecticide applications per season) [4.0 % yield loss]
Plant bugs (3.0) 15,600 200,200 215,800
Spider mites (2.0) 104,000 50,000 154,000
Leps. (BAW, CEW) (2.0) 31,200 100,100 131,300
Thrips (1.0) 6,500 49,000 55,500
Crop totals 157,300 399,300 556,600
Onions (6.25 insecticide applications per season) [1.5 % yield loss]
Thrips (6)* 402,300 1,980,400 2,382,700
Seedcorn maggot (0.25) 16,700 (<0.05%) 16,700
* Suspected vectoring of bulb rots and viruses is not considered and impact is most likelyunderestimated.
Crop totals 419,000 1,980,400 2,399,400
43
Crop1 InsectInsecticideCosts2 ($)
Yield Losses($)
Total Losses($)
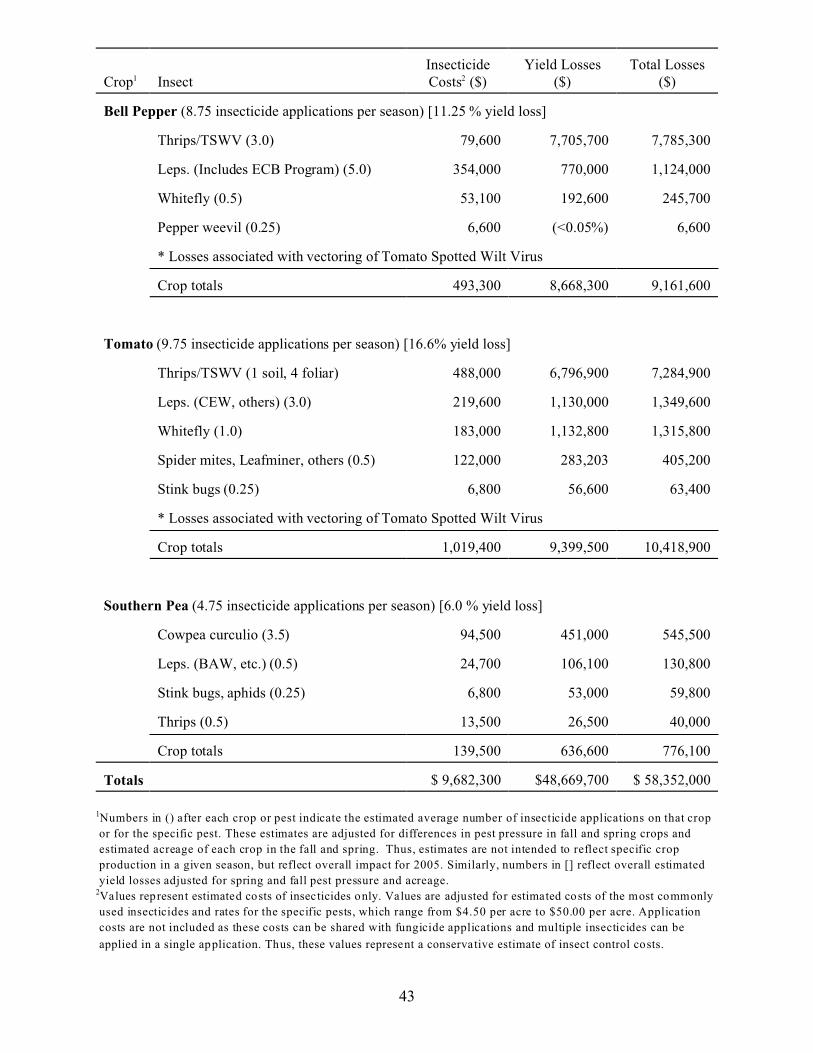
Bell Pepper (8.75 insecticide applications per season) [11.25 % yield loss]
Thrips/TSWV (3.0) 79,600 7,705,700 7,785,300
Leps. (Includes ECB Program) (5.0) 354,000 770,000 1,124,000
Whitefly (0.5) 53,100 192,600 245,700
Pepper weevil (0.25) 6,600 (<0.05%) 6,600
* Losses associated with vectoring of Tomato Spotted Wilt Virus
Crop totals 493,300 8,668,300 9,161,600
Tomato (9.75 insecticide applications per season) [16.6% yield loss]
Thrips/TSWV (1 soil, 4 foliar) 488,000 6,796,900 7,284,900
Leps. (CEW, others) (3.0) 219,600 1,130,000 1,349,600
Whitefly (1.0) 183,000 1,132,800 1,315,800
Spider mites, Leafminer, others (0.5) 122,000 283,203 405,200
Stink bugs (0.25) 6,800 56,600 63,400
* Losses associated with vectoring of Tomato Spotted Wilt Virus
Crop totals 1,019,400 9,399,500 10,418,900
Southern Pea (4.75 insecticide applications per season) [6.0 % yield loss]
Cowpea curculio (3.5) 94,500 451,000 545,500
Leps. (BAW, etc.) (0.5) 24,700 106,100 130,800
Stink bugs, aphids (0.25) 6,800 53,000 59,800
Thrips (0.5) 13,500 26,500 40,000
Crop totals 139,500 636,600 776,100
Totals $ 9,682,300 $48,669,700 $ 58,352,000
1Numbers in () after each crop or pest indicate the estimated average number of insecticide applications on that crop
or for the specific pest. These estimates are adjusted for differences in pest pressure in fall and spring crops and
estimated acreage of each crop in the fall and spring. Thus, estimates are not intended to reflect specific crop
production in a given season, but reflect overall impact for 2005. Similarly, numbers in [] reflect overall estimated
yield losses adjusted for spring and fall pest pressure and acreage.2Values represent estimated costs of insecticides only. Values are adjusted for estimated costs of the most commonly
used insecticides and rates for the specific pests, which range from $4.50 per acre to $50.00 per acre. Application
costs are not included as these costs can be shared with fungicide applications and multiple insecticides can be
applied in a single application. Thus, these values represent a conservative estimate of insect control costs.

44
Summary of Losses Resulting from Insect Damage and Control Costs in Georgia in 2006 byCommodity or Other Category.
Commodity Control Damage Total Losses
Cotton 70,538,047 27,936,500 98,474,547
Field Corn 936,000 1,429,000 2,365,000
Grain Sorghum 46,000 100,000 146,000
Lawn and Turf 23,690,000 13,195,000 36,885,000
Livestock andPoultry
11,609,000 15,710,200 27,319,200
Ornamentals 88,480,000 64,125,000 152,605,000
Pasture and Forages 1,247,000 2,045,935 3,292,935
Peanuts 19,998,750 6,264,125 26,262,875
Pecans 9,834,500 5,233,638 15,068,138
Public Health andRecreational Areas
225,414,134 0 225,414,134
Small Grains 110,000 288,000 398,000
Soybeans 956,500 303,900 1,260,400
Tobacco 1,308,000 921,000 2,229,000
Vegetables 9,682,300 48,669,700 58,352,000
Total $463,850,231 $186,221,998 $650,072,229
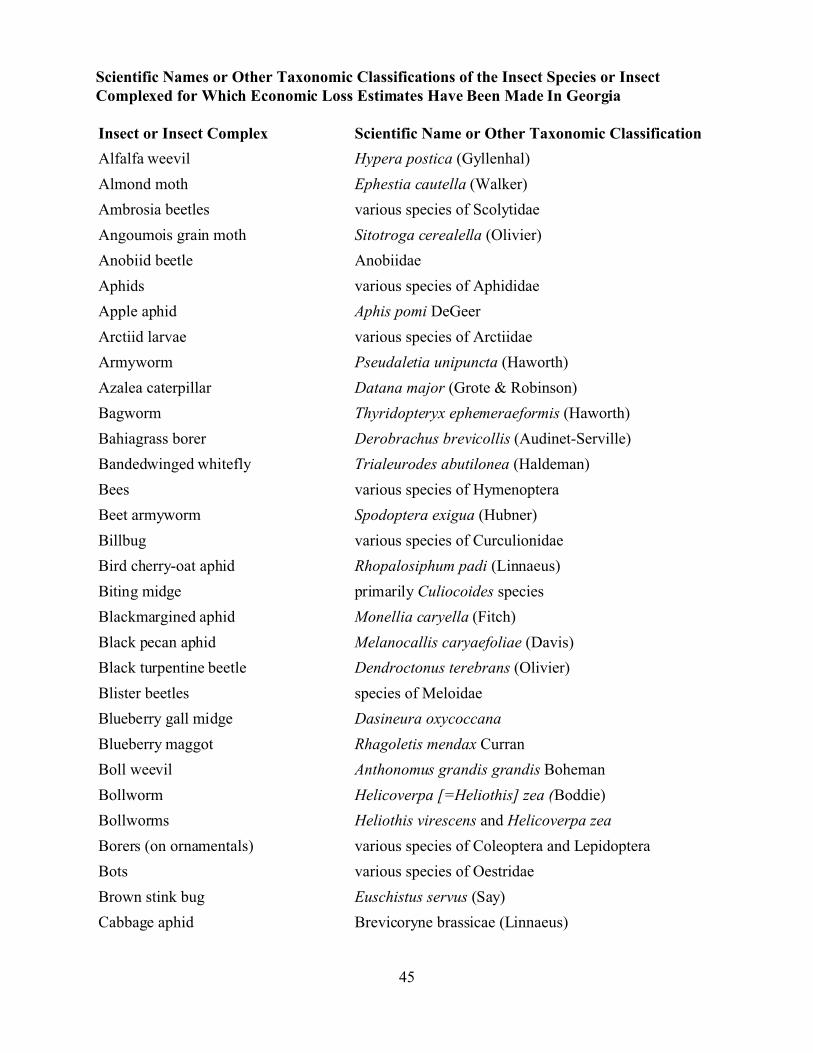
45
Scientific Names or Other Taxonomic Classifications of the Insect Species or InsectComplexed for Which Economic Loss Estimates Have Been Made In Georgia
Insect or Insect Complex Scientific Name or Other Taxonomic Classification
Alfalfa weevil Hypera postica (Gyllenhal)
Almond moth Ephestia cautella (Walker)
Ambrosia beetles various species of Scolytidae
Angoumois grain moth Sitotroga cerealella (Olivier)
Anobiid beetle Anobiidae
Aphids various species of Aphididae
Apple aphid Aphis pomi DeGeer
Arctiid larvae various species of Arctiidae
Armyworm Pseudaletia unipuncta (Haworth)
Azalea caterpillar Datana major (Grote & Robinson)
Bagworm Thyridopteryx ephemeraeformis (Haworth)
Bahiagrass borer Derobrachus brevicollis (Audinet-Serville)
Bandedwinged whitefly Trialeurodes abutilonea (Haldeman)
Bees various species of Hymenoptera
Beet armyworm Spodoptera exigua (Hubner)
Billbug various species of Curculionidae
Bird cherry-oat aphid Rhopalosiphum padi (Linnaeus)
Biting midge primarily Culiocoides species
Blackmargined aphid Monellia caryella (Fitch)
Black pecan aphid Melanocallis caryaefoliae (Davis)
Black turpentine beetle Dendroctonus terebrans (Olivier)
Blister beetles species of Meloidae
Blueberry gall midge Dasineura oxycoccana
Blueberry maggot Rhagoletis mendax Curran
Boll weevil Anthonomus grandis grandis Boheman
Bollworm Helicoverpa [=Heliothis] zea (Boddie)
Bollworms Heliothis virescens and Helicoverpa zea
Borers (on ornamentals) various species of Coleoptera and Lepidoptera
Bots various species of Oestridae
Brown stink bug Euschistus servus (Say)
Cabbage aphid Brevicoryne brassicae (Linnaeus)

Insect or Insect Complex Scientific Name or Other Taxonomic Classification
46
Cabbage looper Trichoplusia ni (Hubner)
Cabbage seedpod weevil Ceutorhynchusassimilis (Paykull)
Cabbagewormsmostly Pieris rapae (Linnaeus) and Plutella xylostella(Linnaeus)
Cadelle Tenebroides mauritanicus (Linnaeus)
Carpet beetles various species of Dermestidae
Carpenter ants Camponotus spp.
Carpenter bees Xylocopa virginica (Linnaeus)
Carpenterworm Prionoxystus robiniae (Peck)
Cattle grub Hypoderma lineatum (Villers)
Chinch bug Blissus leucopterus leucopterus (Say)
Cigarette beetle Lasioderma serricorne (Fabricuis)
Clothes mothprimarily Tinea pellionella L. and Tineola bisseliella(Hummel)
Cockroaches various species of Blattelidae
Codling moth Cydia pomonella (Linnaeus)
Colorado potato beetle Leptinotarsa decemlineata (Say)
Coneworms Dioryctriaspp.
Corn earworm Helicoverpa [=Heliothis] zea (Boddie)
Corn leaf aphid Rhopalosiphum maidis (Fitch)
Corn rootworm Diabrotica undecimpunctata howardi (Barber)
Cotton aphid Aphis gossypii Glover
Cowpea curculio Chalcodermus aeneus Boheman
Cranberry fruitworm Acrobasis vaccinii Riley
Cutworms primarily Feltia subterranea (Fabricius)
Darkling beetle complex various species of Tenebrionidae
Diamondback moth Plutella xylostella (Linnaeus)
Disease vectors (on corn) various species of Aphididae and Cicadellidae
Dogwood borer Synanthedon scitula (Harris)
Earwigs various species of Dermaptera
Eastern tent caterpillar Malacosoma americanum (Fabricius)
English grain aphid Sitobion avenae (Fabricius)
European corn borer Ostrinia nubilalis (Hubner)
European red mite Panonychus ulmi (Koch)

Insect or Insect Complex Scientific Name or Other Taxonomic Classification
47
Eye gnats Hippelatesspp.
Face fly Musca autumnalis De Geer
Fall armyworm Spodoptera frugiperda (J.E. Smith)
Fall webworm Hyphantria cunea (Drury)
False chinch bug Nysius raphanus Howard
Field crickets Gryllusspp.
Fire Ants Solenopsisspp.
Flat grain beetle Cryptolestes pusillus (Schnherr)
Flea beetles various species of Alticinae
Fleas various species of Siphonaptera
Forbes scale Quadraspidiotus forbesi (Johnson)
Forest tent caterpillar Malacosoma disstria Hubner
Fuller rose beetle Asynonychus godmani Crotch
Fungus beetles various species of Tenebrionidae
Fungus gnats various species of Mycetophilidae and Sciaridae
German cockroach Blattella germanica (Linnaeus)
Granulate cutworm Agrotis subterranea (Fabricius)
Grape root borer Vitacea polistiformis (Harris)
Grasshoppers various species of Orthoptera
Green cloverworm Plathypena scabra (Fabricius)
Green fruitworm Lithophane antennata (Walker)
Green June beetle Cotinis nitida (Linnaeus)
Green peach aphid Myzus persicae (Sulzer)
Greenbug Schizaphis graminum (Rondani)
Grub (cattle) Hypoderma lineatum (Villers)
Gypsy moth Lymantria dispar (Linnaeus)
Hessian fly Mayetiola destructor (Say)
Hickory nut curculio Conotrachelus hickoriae (Schoof)
Hickory shoot curculios Conotrachelusspp.
Hickory shuckworm Cydia caryana (Fitch)
Honey bees Apis mellifera (Linnaeus)
Honey bee (tracheal) mite Acarapis woodi (Rennie)
Horn fly Haematobia irritans (Linnaeus)

Insect or Insect Complex Scientific Name or Other Taxonomic Classification
48
Horse flies various species of Tabanidae
House fly Musca domestica Linnaeus
Imported cabbageworm Pieris rapae (Linnaeus)
Indian mealmoth Plodia interpunctella (Hubner)
Ips beetles Ips avulsus, I. grandicolis, I. calligraphis and I. pini
Iris borer Macronoctua onusta Grote
Japanese beetle Popillia japonica Newman
Lace bugs various species of Tingidae
Leafminers various species of Coleoptera, Diptera and Lepidoptera
Leaf rollers various species of Lepidoptera
Leaffooted bugs various species of Coreidae
Leafhoppers various species of Cicadellidae
Lesser appleworm Grapholitha prunivora (Walsh)
Lesser cornstalk borer Elasmopalpus lignosellus (Zeller)
Lesser peachtree borer Synanthedon pictipes (Grote & Robinson)
Lice (on livestock) various species of Anoplura and Mellophaga
Lyctid beetles Lyctidae
Magnolia borer Euzophera magnolialis Capps
May beetles various species of Scarabaeidae
Mealworms Tenebriospp. and Alphitobius spp.
Mealybugs various species of Pseudococcidae
Mexican bean beetle Epilachna varivestis Mulsant
Millipedes various species of Diplopoda
Mites (on livestock) various species of Acari
Mites (on plants) various species of Acari
Mole crickets primarily Scapteriscus spp.
Mosquitoes various species of Culicidae
Moth flies Psychodidae
Nantucket pine tip moth Rhyacionia frustrana (Comstock)
Northern fowl mite Ornithonyssus sylviarum (Canestrini & Fanzago)
Oak skeletonizer Bucculatri ainsliella Murtfeldt
Old house borer Hylotrupes bajulus (Linnaeus)
Onion maggot Delia antiqua (Meigen)

Insect or Insect Complex Scientific Name or Other Taxonomic Classification
49
Oriental fruit moth Grapholita molesta (Busck)
Pales weevil Hylobius pales (Herbst)
Pea aphid Acyrthosiphon pisum (Harris)
Peachtree borer Synanthedon exitiosa (Say)
Pecan bud moth Gretchena bolliana (Slingerland)
Pecan leaf casebearer Acrobasis juglandis (LeBaron)
Pecan leaf phylloxera Phylloxera notabilis Pergande
Pecan spittlebug Clastoptera achatina Germar
Pecan weevil Curculio caryae (Horn)
Pepper weevil Anthonomus eugenii Cano
Pickleworm Diaphania nitidalis (Stoll)
Pitch-eating weevil Pachylobius picivorus (Germar)
Pitch pine tip moth Rhyacionia rigidana (Fernald)
Plant bugs various species of Miridae
Planthoppers various species of Delphacidae and Fulgoridae
Plum curculio Conotrachelus nenuphar (Herbst)
Powderpost beetles various species of Lyctidae
Prionus borers Prionusspp.
Psocids various species of Psocoptera
Red flour beetle Tribolium castaneum (Herbst)
Red imported fire ant Solenopsis invicta Buren
Redbanded leafroller Argyrotaenia velutinana (Walker)
Rice weevil Sitophilus oryzae (Linnaeus)
Rosy apple aphid Dysaphis plantaginea (Passerini)
San Jose scale Quadraspidiotus perniciosus (Comstock)
Sawflies various species of Symphyta
Sawtoothed grain beetle Oryzaephilus surinamensis (Linnaeus)
Scale insects various species of Homoptera
Seed bugs Nysiusspp.
Seedcorn maggot Delia platura (Meigen)
Seedworms Cydiaspp.
Shield bugs various species of Scutelleridae
Shothole borers species of Scolytidae
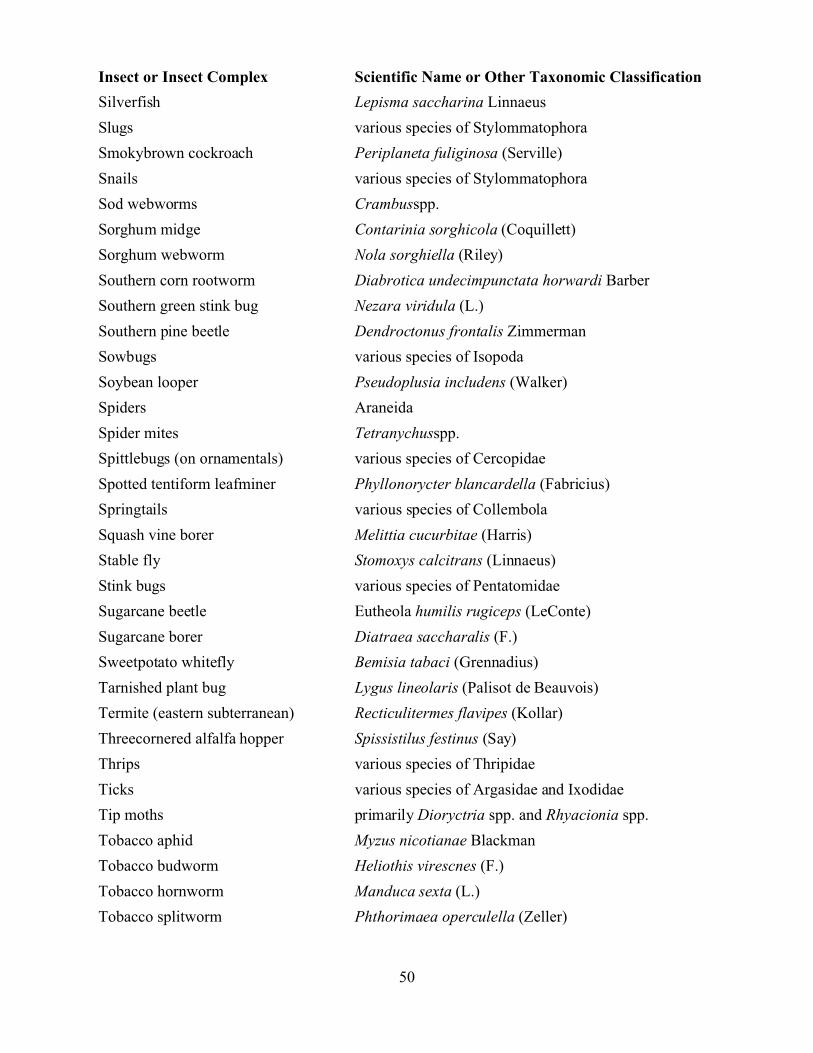
Insect or Insect Complex Scientific Name or Other Taxonomic Classification
50
Silverfish Lepisma saccharina Linnaeus
Slugs various species of Stylommatophora
Smokybrown cockroach Periplaneta fuliginosa (Serville)
Snails various species of Stylommatophora
Sod webworms Crambusspp.
Sorghum midge Contarinia sorghicola (Coquillett)
Sorghum webworm Nola sorghiella (Riley)
Southern corn rootworm Diabrotica undecimpunctata horwardi Barber
Southern green stink bug Nezara viridula (L.)
Southern pine beetle Dendroctonus frontalis Zimmerman
Sowbugs various species of Isopoda
Soybean looper Pseudoplusia includens (Walker)
Spiders Araneida
Spider mites Tetranychusspp.
Spittlebugs (on ornamentals) various species of Cercopidae
Spotted tentiform leafminer Phyllonorycter blancardella (Fabricius)
Springtails various species of Collembola
Squash vine borer Melittia cucurbitae (Harris)
Stable fly Stomoxys calcitrans (Linnaeus)
Stink bugs various species of Pentatomidae
Sugarcane beetle Eutheola humilis rugiceps (LeConte)
Sugarcane borer Diatraea saccharalis (F.)
Sweetpotato whitefly Bemisia tabaci (Grennadius)
Tarnished plant bug Lygus lineolaris (Palisot de Beauvois)
Termite (eastern subterranean) Recticulitermes flavipes (Kollar)
Threecornered alfalfa hopper Spissistilus festinus (Say)
Thrips various species of Thripidae
Ticks various species of Argasidae and Ixodidae
Tip moths primarily Dioryctria spp. and Rhyacionia spp.
Tobacco aphid Myzus nicotianae Blackman
Tobacco budworm Heliothis virescnes (F.)
Tobacco hornworm Manduca sexta (L.)
Tobacco splitworm Phthorimaea operculella (Zeller)

Insect or Insect Complex Scientific Name or Other Taxonomic Classification
51
Tomato fruitworm Helicoverpa [=Heliothis] zea (Boddie)
Tufted apple budmoth Platynota idaeusalis (Walker)
Turkey chigger Neoschoengastia americana (Hirst)
Turnip aphid Lipaphis erysimi (Kaltenbach)
Twolined spittlebug Prosapia bicincta (Say)
Twospotted spider mite Tetranychus urticae Koch
Varroa mite Varroa jacobsoni Oudemans
Vectors (of corn diseases) various species of Aphididae and Cicadellidae
Velvetbean caterpillar Anticarsia gemmatialis Hubner
Walnut caterpillar Datana integerrima Grote & Robinson
Wasps various species of Hymenoptera
Webbing coneworm Dioryctria disclusia Heinrich
Western flower thrips Frankliniella occidentalis (Pergande)
White grubs various species of Scarabaeidae
White peach scale Pseudaulacapis pentagona (Targioni-Tozzetti)
Whiteflies various species of Aleyrodidae
Whitefringed beetle Graphognathusspp.
Wireworms various species of Elateridae
Wooly apple aphid Eriosoma lanigerum (Hausmann)
Yellow jackets Vespulaspp.
Yellow pecan aphids primarily Monelliopsis pecanis (Bissell)
Yellow sugarcane aphid Sipha flava (Forbes)
Yellownecked caterpillar Datana ministra (Drury)
Yellowmargined leaf beetle Microtheca ochroloma Stal

52
References
Suber, E. F. and J. W. Todd (eds.). 1980. Summary of economic losses due to insect damage and
costs of control in Georgia, 1971-1976. Univ. of Ga. Col. of Agr. Exp. Stn. Special Pub.
No. 7, 69p.
Todd, J. W. and E. F. Suber (eds.). 1980. Summary of economic losses due to insect damage and
costs of control in Georgia, 1977. Univ. of Ga. Col. of Agr. Exp. Stn. Special Pub. No. 8,
49p
Suber, E. F ., D. C. Sheppard , and J . W. Todd (eds.). 1981a. Summary of economic losses due to
insect damage and costs of control in Georgia, 1978. Univ. of Ga. Col. of Agr. Exp. Stn.
Special Pub. No. 13 , 53p.
Suber, E. F ., D. C. Sheppard , and J . W. Todd (eds.). 1981b. Summary of economic losses due to
insect damage and costs of control in Georgia, 1979. Univ. of Ga. Col. of Agr. Exp. Stn.
Special Pub. No. 14 , 49p.
Suber, E. F., D. C. Sheppard, and W . A. Gardner (eds.). 1982. Summary of economic losses due
to insect damage and costs of control in Georgia, 1980. Univ. of Ga. Col. of Agr. Exp.
Stn. Special Pub. No. 20 , 51p.
Suber, E. F., D. C. Sheppard, and W. A. Gardner (eds.). 1983. Summary of losses due to insect
damage and costs of control in Georgia, 1981. Univ. of Ga. Col. of Agr. Exp. Stn. Special
Pub . No. 26, 53p.
Suber, E. F., D. C. Sheppard, and W. A. Gardner (eds.). 1984. Summary of losses from insect
damage and costs of control in Georgia, 1982. Univ. of Ga. Col. of Agr. Exp. Stn. Special
Pub . No. 27, 41p.
Suber, E. F., D. C. Sheppard, and W. A. Gardner (eds.). 1985. Summary of losses from insect
damage and costs of control in Georgia, 1983. Univ. of Ga. Col. of Agr. Exp. Stn. Special
Pub . No. 30, 42p.
Douce, G. K. and E. F. Suber. 1985. Summary of losses from insect damage and costs of control
in Georgia, 1984. Univ. of Ga. Col. of Agr. Exp. Stn. Special Pub. No. 36 , 44p.
Douce, G. K. and E. F. Suber (eds.). 1986. Summary of losses from insect damage and costs of
control in Georgia, 1985. Univ. of Ga. Col. of Agr. Exp. Stn. Special Pub. No. 40 , 55p.
Douce, G. K. and E. F. Suber (eds.). 1988. Summary of losses from insect damage and costs of
control in Georgia, 1986. Univ. of Ga. Col. of Agr. Exp. Stn. Special Pub. No. 46 , 41p.
Douce, G. K. and R. M. McPherson. 1988. Summary of losses from insect damage and costs of
control in Georgia, 1987. Univ. of Ga. Col. of Agr. Exp. Stn. Special Pub. No. 54 , 41p.
Douce, G. K. and R. M. McPherson. 1989. Summary of losses from insect damage and costs of
control in Georgia, 1988. Univ. of Ga. Col. of Agr. Exp. Stn. Special Pub. No. 64 , 52p.
Douce, G. K. and R. M. McPherson. 1991. Summary of losses from insect damage and costs of
control in Georgia, 1989. Univ. of Ga. Col. of Agr. Exp. Stn. Special Pub. No. 70 , 47p.
Douce, G. K. and R. M. McPherson. 1992. Summary of losses from insect damage and costs of
control in Georgia, 1990. Univ. of Ga. Col. of Agr. Exp. Stn. Special Pub. No. 77 , 47p.
McPherson, R. M. and G. K. Douce (eds.). 1992. Summary of losses from insect damage and

53
costs of control in Georgia, 1991. Univ. of Ga. Col. of Agr. Exp. Stn. Special Pub. No.
81, 65p.
McPherson, R. M. and G. K. Douce (eds.). 1993. Summary of losses from insect damage and
costs of control in Georgia, 1992. Univ. of Ga. Col. of Agr. Exp. Stn. Special Pub. No.
83, 55p.
Douce, G. K. and R. M. McPherson. 1995. Summary of losses from insect damage and costs of
control in Georgia, 1993. Univ. of Ga. Col. of Agr. Exp. Stn. Special Pub. No. 87 , 56p.
Douce, G. K. and R. M. McPherson. 1997. Summary of losses from insect damage and costs of
control in Georgia, 1994. Univ. of Ga. Col. of Agr. Exp. Stn. Special Pub. No. 89, 56p.
McPherson, R.M., G. K. Douce and D.G. Riley. 1996. Summary of losses from insect damage
and costs of control in Georgia, 1995. Univ. of Ga. Col. of Agr. Exp. Stn. Special Pub.
No. 90, 55p.
Riley, D. G., G. K. Douce and R. M. McPherson. 1997. Summary of losses from insect damage
and costs of control in Georgia, 1996. Univ. of Ga. Col. of Agr. Exp. Stn. Special Pub.
No. 91, 58p.
Guillebeau, P., N. Hinkle and P. Roberts. 2003. Summary of losses from insect damage and costs
of control in Georgia, 2000. Univ. of Ga. Col. of Agr. and Environ. Sci. Miscellaneous
Pub. No. 106, 56 p.
Guillebeau, P., N. Hinkle and P. Roberts. 2003. Summary of losses from insect damage and costs
of control in Georgia 2001. Univ. of Ga. Col. of Agr. and Environ. Sci. Miscellaneous
Pub. No. 106, 57 p.
Guillebeau, P., N. Hinkle and P. Roberts. 2005. Summary of losses from insect damage and costs
of control in Georgia 2002. Univ. of Ga. Col. of Agr. and Environ. Sci. Miscellaneous
Pub. No. 106, 60 p.
Guillebeau, P., N. Hinkle and P. Roberts. 2005. Summary of losses from insect damage and costs
of control in Georgia 2003. Univ. of Ga. Col. of Agr. and Environ. Sci. Miscellaneous
Pub. No. 106, 59p.
Guillebeau, P., N. Hinkle and P. Roberts. 2006. Summary of losses from insect damage and costs
of control in Georgia 2004. Univ. of Ga. Col. of Agr. and Environ. Sci. Miscellaneous
Pub. No. 106, 59p.
Guillebeau, P., N. Hinkle and P. Roberts. 2008. Summary of losses from insect damage and costs
of control in Georgia 2005. Univ. of Ga. Col. of Agr. and Environ. Sci. Miscellaneous
Pub. No. 106, 48p.

54
The University of Georgia and Ft. Valley State College, the U.S. Department of Agriculture andcounties of the state cooperating. Cooperative Extension, the University of Georgia College ofAgricultural and Environmental Sciences, offers educational programs, assistance and materialsto all people without regard to race, color, national origin, age, gender or disability.
An Equal Opportunity Employer/Affirmative Action OrganizationCommitted to a Diverse Work Force
Miscellaneous Publication Number 106 July 2008
Issued in futherance of Cooperative Extension work, Acts of May 8 and June 30, 1914 , The University of Georgia
College of Agricultural and Environmental Sciences and the U.S. Department of Agriculture cooperating.
J. Scott Angle, Dean and Director