summary of previous lower boise river water quality...
TRANSCRIPT

Summary of Previous Lower Boise River Water Quality Modeling
LBWC TAC Meeting
November 28, 2012
Presented by CH2M HILL

Topics
• Focus on methods and lessons learned
• Mass balance models: – The early years (mid-1990s to early 2000s)
– The TP TMDL and implementation plan (2005 to 2008)
• Instream water quality models: – The really early years (1975 to 1992)
– The algae calculator (~2000)
– AQUATOX model (2005 – 2008)
2

Early History of Mass Balance Models
• Mid-1990s: “Strawman” model for potential TP TMDL
• Late 1990s to early 2000s: Model modified and adapted for sediment TMDL:
– Programmed Excel model to allow user to select data, time periods and allocations methodologies
• 2005 to 2008: Following slides (Sherrill)
3
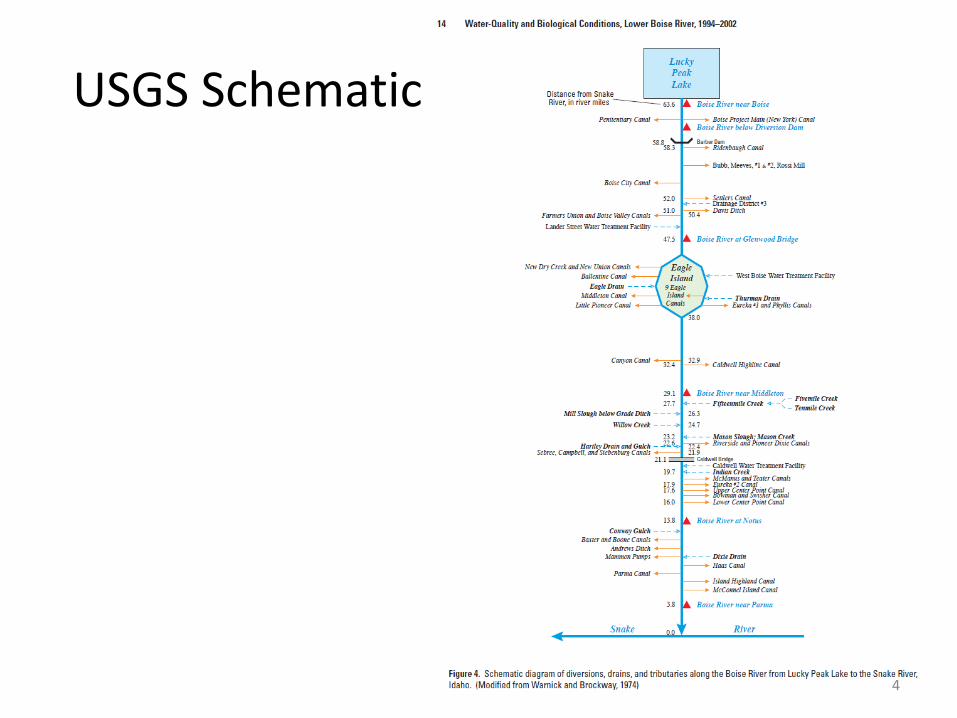
USGS Schematic
4

Source Categories
• Point sources – Current mainstem and tributary WWTFs
– Future WWTFs
– Current MS4 stormwater
– Future MS4 stormwater
• Non-point sources – Agriculture
– Current non-MS4 stormwater
– Groundwater
• Other sources – Background
– Canal “pass-through” water
5

Data Sources: Flows
• Combined data from different sources:
– Boise River: USGS and Idaho Power (1992-1996,1999-2005)
– Canals and drains: USGS, IDWR, Watermaster, ISDA/SCC
– Groundwater: Reclamation reports, USGS research
– WWTFs: Typical discharges (calibration), design flows/build-out flows
6

Data Sources: Concentrations
• Combined data from different sources:
– Boise River: USGS (2000-2004)
– Canals and drains: USGS (2000-2004), ISDA (1999-2000)
– WWTFs: DMR Data (2000-2004)
– Groundwater: USGS Groundwater (2001)
– Background: Reclamation (1994-2004)
7

Data Sources: Concentrations (con’t.)
• Stormwater – Wet-weather: ACHD Phase 1 MS4 monitoring
(2000-2006)
– Dry-weather (urban irrigation runoff): • ACHD Phase 1 MS4 monitoring (2006), weighted for
land use
+
• Reclamation Fivemile study (2001)
– Dry-weather runoff concentration is a critical driver for projected conditions
8
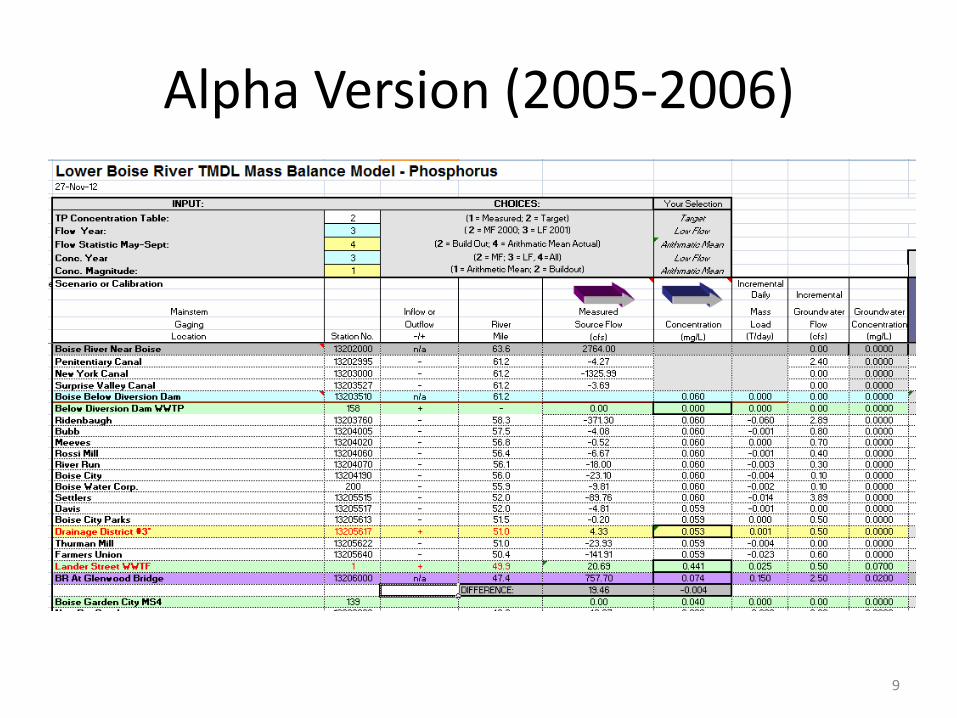
Alpha Version (2005-2006)
9

Beta Version (2006-2007)
10

11

Gamma Version
(2007-2008)
12

13

Instream Water Quality Models
• Simulate effects of loadings to the river
• User inputs loads based on other watershed models (e.g., mass balance models)
• Applications to LBR:
– Chen and Wells, 1975
– EPA R10’s RNGKMOD (early 1990s)
– Algae calculator (~2000)
– AQUATOX (2005 – 2008)
14

Chen and Wells (1975)
• Contract with Corps • Looked at various scenarios of instream flows,
diversions and loadings • Modeled Indian Creek and mainstem river • Ecological model: Temperature, bacteria, DO, nutrients,
algae, zooplankton, detritus, organic sediment, benthos, and fish
• “Floating algae could not thrive in the river due to the short hydraulic residence times of the water. This was the case for all of the hydrologic conditions tested. Algal biomass would not occur if suspended solids were removed from irrigation return waters.”
15

EPA R10 Model (early 1990s)
• RNGKMOD initially developed and applied to LBR by John Yearsly (EPA R10)
• Focus was DO: – BOD – Mass balance – Dilution – Nitrification – Reaeration – Organic decay – Nutrients/algae rudimentary
• Used in 1992 by CH2M HILL on behalf of Boise City to evaluate various scenarios
16

Algae Calculator (Excel)
• Developed ~2000 at requet of LBWC and DEQ
• Thomann and Mueller equations
• Primary objective was to evaluate issue whether reduced sediment concentrations in the lower river would lead to problematic phytoplankton issues
• Provided to DEQ and used in SBA and 303(d)
• Answer: Confirmed Chen and Wells, flushing during growing season too high
17
18
AQUATOX Application
• Background
• Description of AQUATOX
• Application of AQUATOX to LBR – Model Setup and Calibration
– Scenario Runs and Results
– Key Findings
• Potential Application for Nutrient Criteria for the LBR
19
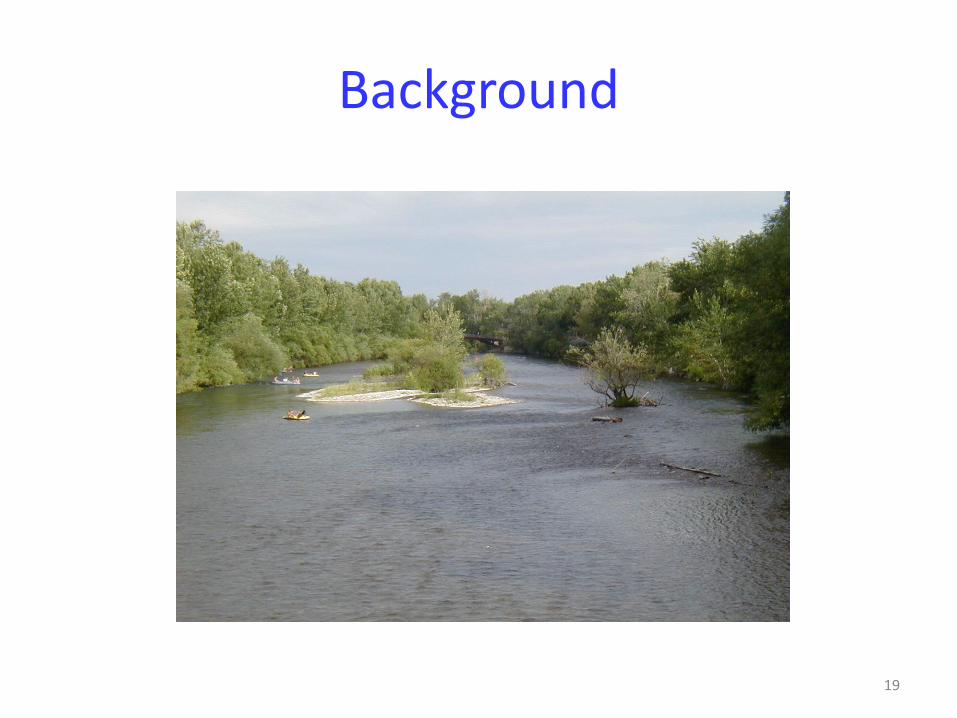
Background
20
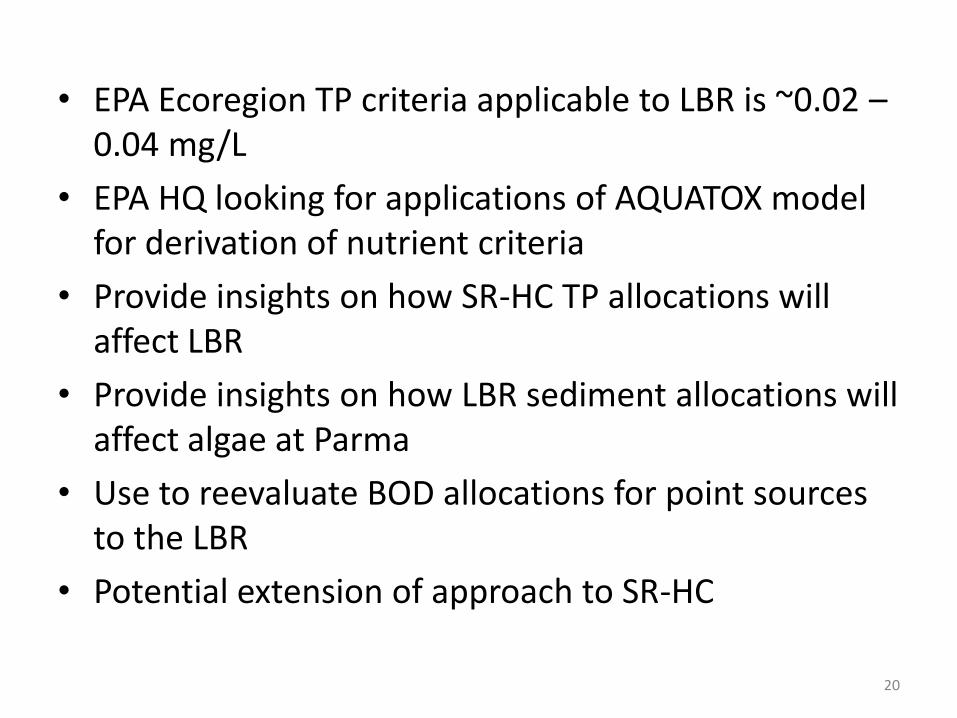
• EPA Ecoregion TP criteria applicable to LBR is ~0.02 – 0.04 mg/L
• EPA HQ looking for applications of AQUATOX model for derivation of nutrient criteria
• Provide insights on how SR-HC TP allocations will affect LBR
• Provide insights on how LBR sediment allocations will affect algae at Parma
• Use to reevaluate BOD allocations for point sources to the LBR
• Potential extension of approach to SR-HC
21
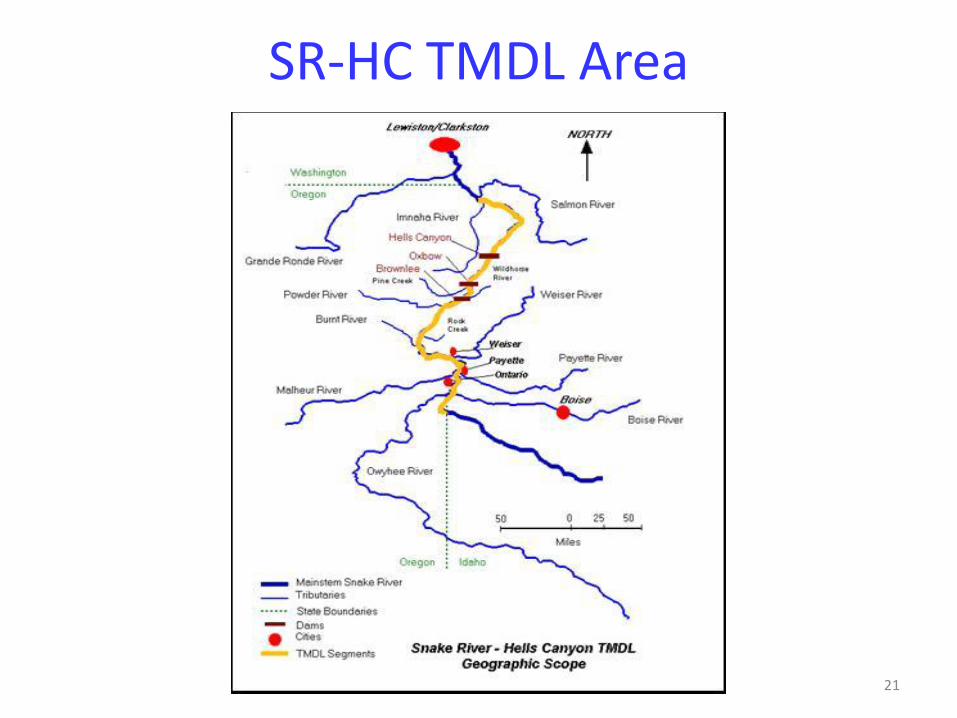
SR-HC TMDL Area

22
Lower Boise Watershed

23
Algae Issues in SR vs. LBR
• Snake River: – Primary driver in final TMDL was phytoplankton in river
upstream of Brownlee (seasonal target of 14 ug/L of phytoplankton chlorophyll)
• Lower Boise River:
– DO and pH meet standards, part of basis for DEQ delisting – Lingering concern has been periphyton at Middleton (low
flow location) – Additional concern has been phytoplankton at Parma
when sediment TMDL increases light availability

24
Description of AQUATOX
25
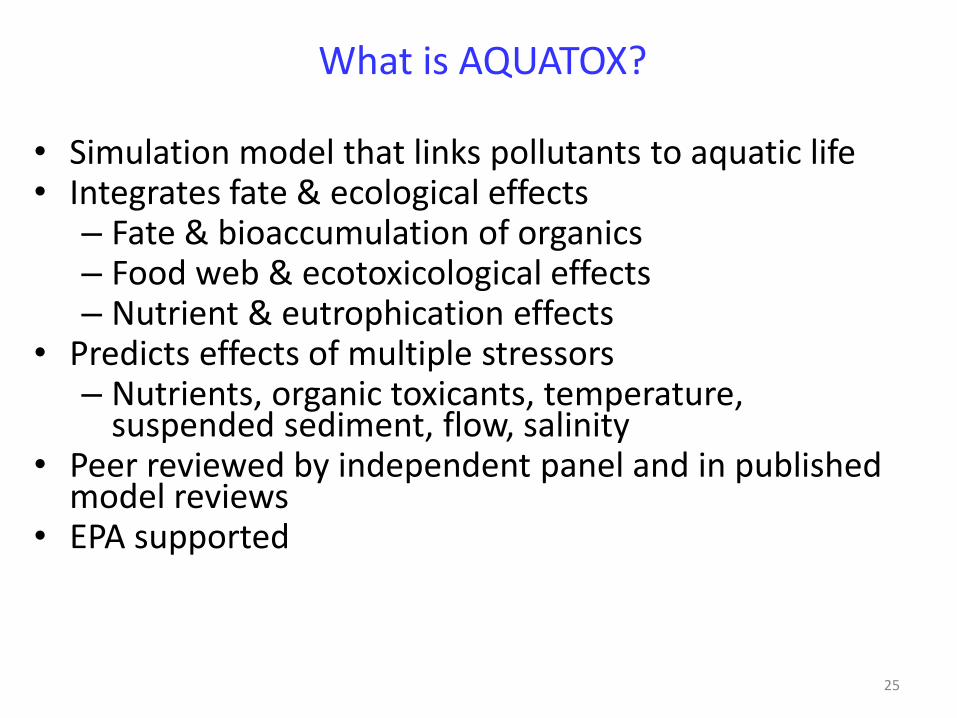
What is AQUATOX?
• Simulation model that links pollutants to aquatic life • Integrates fate & ecological effects
– Fate & bioaccumulation of organics – Food web & ecotoxicological effects – Nutrient & eutrophication effects
• Predicts effects of multiple stressors – Nutrients, organic toxicants, temperature,
suspended sediment, flow, salinity • Peer reviewed by independent panel and in published
model reviews • EPA supported

26
Nutrients
Light Atmos. Dep. Temperature Wind Inflow
Outflow
AQUATOX Ecosystem Representation
Inorganic Sediment
Organic toxicant
Organic matter
Oxygen
Plants Phytoplankton Periphyton Macrophytes
Invertebrates
Animals
Fish
Suspended sediment
Ingestion
Saltwater
Entrainment
27

28
Why Use AQUATOX?
• When have aquatic life endpoints
– Models hydraulic scour of periphyton
– Most water quality models do not include animals
• When have complex ecological & biological processes
– Feedback loops, indirect effects
– Trophic cascades
– Multiple factors affecting ecosystem responses
– Non-linear relationships

29
Process for Application to LBR • EPA HQ contract with CH2M HILL, with Eco Modeling (Dick
Park) and Warren Pinnacle (Jon Clough) (model developers) as subconsultants
• Boise City staff as technical support • Kickoff meeting held Fall 2005 with LBWC TAC • Boise City (Kate Harris) collected additional algae speciation
data • Model set up and calibrated for LBR by Jon and Dick • Boise City (Ben Nydegger) ran multiple scenarios:
– included current, LBR IP allocations, and many others above and below
• Final report submitted to EPA HQ at end of December 2008
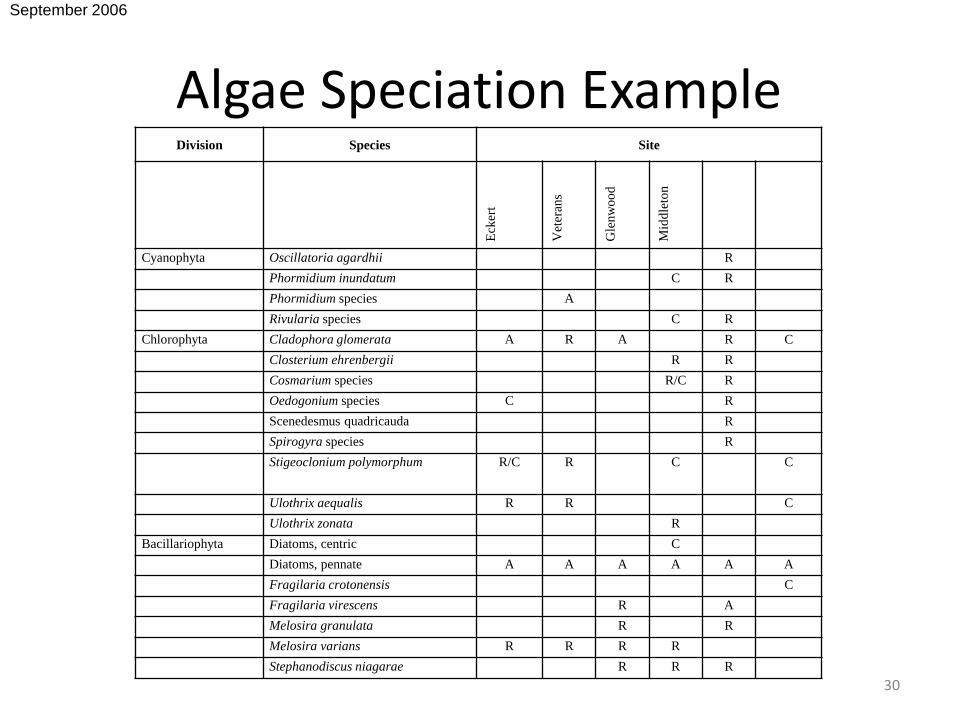
Algae Speciation Example
30
Division Species Site
Eck
ert
Vet
eran
s
Gle
nw
oo
d
Mid
dle
ton
Cyanophyta Oscillatoria agardhii R
Phormidium inundatum C R
Phormidium species A
Rivularia species C R
Chlorophyta Cladophora glomerata A R A R C
Closterium ehrenbergii R R
Cosmarium species R/C R
Oedogonium species C R
Scenedesmus quadricauda R
Spirogyra species R
Stigeoclonium polymorphum R/C R C C
Ulothrix aequalis R R C
Ulothrix zonata R
Bacillariophyta Diatoms, centric C
Diatoms, pennate A A A A A A
Fragilaria crotonensis C
Fragilaria virescens R A
Melosira granulata R R
Melosira varians R R R R
Stephanodiscus niagarae R R R
September 2006

31
Model Setup and Calibration
Eagle Bridge over S. Channel LBR
32
1
2
3
4
6
7
8
9
11
10
12
13
5
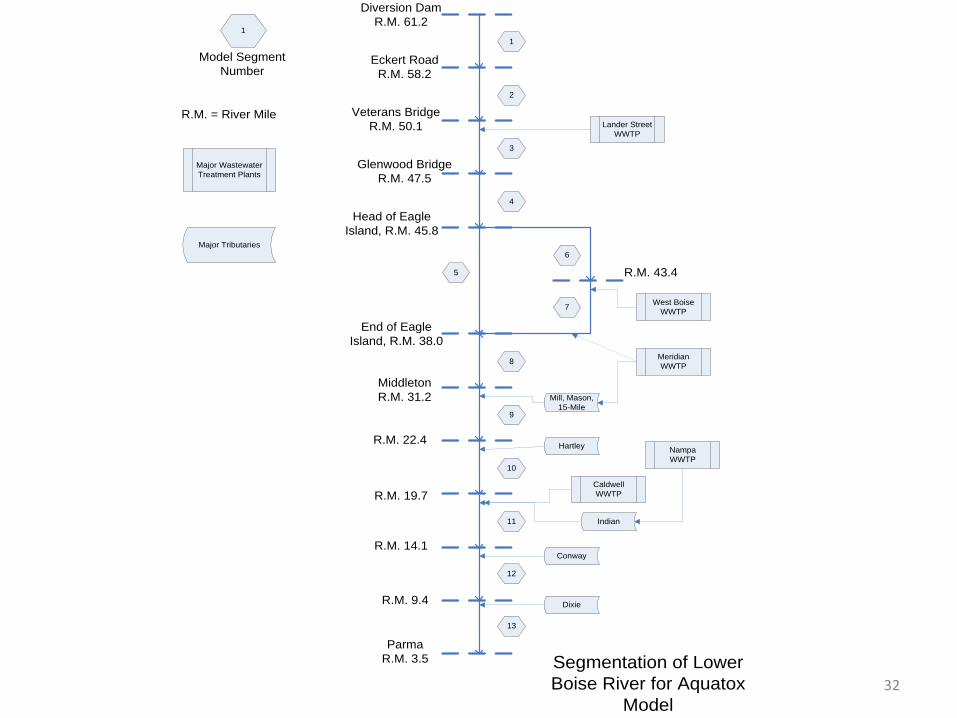
1
Model Segment
NumberEckert Road
R.M. 58.2
Veterans Bridge
R.M. 50.1
Glenwood Bridge
R.M. 47.5
Head of Eagle
Island, R.M. 45.8
End of Eagle
Island, R.M. 38.0
R.M. 43.4
Middleton
R.M. 31.2
R.M. 22.4
R.M. 19.7
R.M. 14.1
R.M. 9.4
Parma
R.M. 3.5
R.M. = River Mile
Segmentation of Lower
Boise River for Aquatox
Model
Diversion Dam
R.M. 61.2
Lander Street
WWTP
West Boise
WWTP
Caldwell
WWTP
Nampa
WWTP
Meridian
WWTP
Mill, Mason,
15-Mile
Hartley
Indian
Conway
Dixie
Major Wastewater
Treatment Plants
Major Tributaries

33
Ecosystem Compartments Simulated for LBR

34
Calibration Period (1999-2001)
• 1999: High flow year
– Others: 2003, 2004, 2005, 2007
• 2000: Medium flow year
– Other: 1995
• 2001: Low flow year
– Others: 1996,1997, 1998, 2006

35
TP Calibration Results Veterans Glenwood
Middleton Parma

36
TP for All Model Segments
37
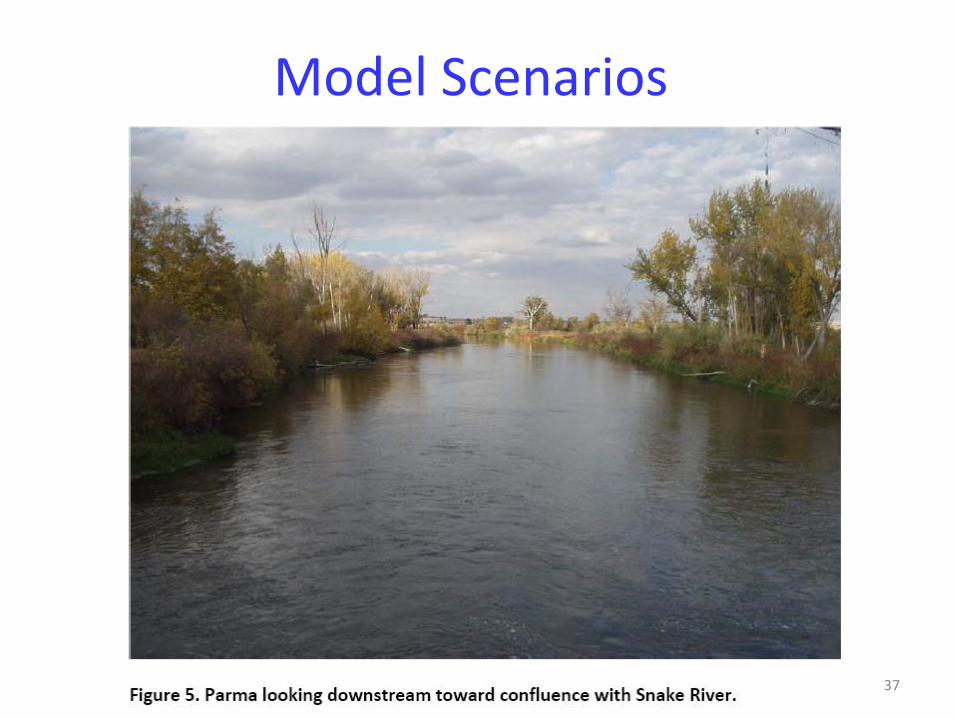
Model Scenarios

38
Some Results
• Selected Scenarios:
– 1: Current (calibrated) conditions
– 3: DEQ-adopted Implementation Plan
– 8: Same as 3 with point sources to 0.07 mg/L
– 9: Same as 3 with point sources to 0 mg/L
– 2a: Current flows with DEQ-adopted IP and 37% sediment reduction
– 3a: Same as 3 with 37% sediment reduction

39

40

41

42

43

44

45

46
Key Finding Related to SR-HC TMDL Implementation on LBR
• DEQ-adopted Implementation Plan will meet 0.07 mg/L target at Parma even during very low flow year (2001) and even during lowest flow period
• All predicted 9 daily “exceedances” had TP values < 0.075 mg/L
May through September Data Only Daily Weekly Avg Monthly Avg
1999 0/153 0.0%
0/22 0.0%
0/5
0.0%
2000 0/153 0.0%
0/22 0.0%
0/5
0.0%
2001 9/153 5.9%
0/22 0.0%
0/5
0.0%
1999-2001 Avg.
9/459 2.0%
0/66 0.0%
0/15 0.0%

47
Effect of 37% TSS Reduction at Parma

48
Effect of 37% TSS Reduction at Parma

49
Other Key Findings Related to LBR Water Quality
• Phytoplankton chlorophyll concentration is now and will be ~ 15 ug/L at most sensitive location (Parma), even with sediment TMDL reduction goals met
• Periphyton chlorophyll will be less than 150 mg/sq.m at most sensitive location (Middleton) even during low flow year – 150 mg/sq.m is recent criterion developed by
Montana (needs to be evaluated further for LBR)

50
Potential Application of AQUATOX for Nutrient Criteria for LBR

51
Some Key Findings for LBR Related to Potential Site Specific Nutrient Criteria
• Phytoplankton not very sensitive to nutrient concentrations • Periphyton are sensitive to phosphorus concentrations, but
not nitrogen • Phytoplankton, blue greens, cladophora not responsive to
nutrients • Periphyton appear to be best measure of nutrient/use
attainment • Most sensitive location appears to be Middleton • LBR TP target appears to be in the 120-130 ug/l range • One approach to P criteria might be combination of AQUATOX
with periphyton criterion similar to Montana’s
52
Montana Criterion
• 150 mg/m2 (with allowance for statistical exceedances)

53
Montana Survey Results

54
Montana Survey Pics

55
Potential Application to LBR

56
Potential Application to LBR
Table 6-1. Aquatox Predicted TP concentration (µg/L) to Achieve Periphyton Chlorophyll a Level of 150 mg/m2
Season Water Year and Location
May-Sep. May-Nov. Oct.-Nov. Jun.-Aug.
Three-Year (1999 to 2001) Average
Middleton 160 361 N/A 124
Parma 351 297 208 315