summary of rubavu district dvelopment strtategy
TRANSCRIPT

1
REPUBLIC OF RWANDA
WESTERN PROVINCE,
RUBAVU DISTRICT
P.O BOX 173 GISENYI
Website: www.rubavu.gov.rw
SUMMARY OF RUBAVU DISTRICT DVELOPMENT
STRTATEGY
2018-2024
DECEMBER 2018
2
1. VISION, MISSION AND OBJECTIVES ........................................................................................................ 3
2. PROFILE OF THE DISTRICT ............................................................................................................. 3
3. MAIN CHALLENGES FACED IN THE IMPLEMENTATION OF THE DDP ................................. 5
4. DISTRICT ECONOMIC POTENTIALITIES....................................................................................... 7
5. MAIN PRIORITIES FOR THE DISTRICT ..................................................................................................... 9
7. MAIN TRANSFORMATIONAL PROJECTS PLANNED BY THE DISTRICT .............................. 11
8. GREENING THE DDS ....................................................................................................................... 12
9. ESTIMATED COSTS TO IMPLEMENT THE DDS ......................................................................... 13
10. LOG FRAME .................................................................................................................................... 14

3
1. Vision, Mission and Objectives
Vision
The “Vision” of Rubavu District is to be “Rwanda’s Business and Tourism Gateway”
Mission
The mission of Rubavu district is “To become a socio-economic prosperous model, based on
good governance, specialized and modern agriculture, urbanization, tourism, culture and
security “.
Strategic Objectives
The medium-term strategic objectives the District intends to achieve over the course of NST 1 as
it delivers the DDS are set out below:
- Objectives 1: Contribute to Jobs creation
- Objectives 2: Increase infrastructure and investments in eco-tourism
- Objectives 3: Improve urbanization and rural settlement
- Objective 4: Maximize production & productivity of Agriculture and Livestock.
- Objectives 5: Transform ( Add-value) to agriculture and livestock production in order to
boost exports
These five objectives will contribute to the achievement of the vision of the District.
2. Profile of the District
Description of the district
Rubavu District is one of the 7 districts of the country‟s western province. It has a total surface
area of 388.3 Km2. It is bordered in the east by Nyabihu District, west and north by the
Democratic Republic of Congo and south by Rutsiro district and is 152 km from city of Kigali.
Its geographic location and related features such as lake kivu helps the district to be a business
and tourism hub (especially through cross border trade with DRC).
The District of Rubavu is composed of 12 administrative sectors, 80 Cells and 525 Villages
(Imidugudu).
Geography of the District
Rainfall in Rubavu District varies between 1200 mm and 1500 mm per year. The Land of North-
west part of the District has a very rich soil, but shallow, volcanic ash and lava decomposed,
while land in the south east has deep soils but poor, often acidic, sandy clay and leached by high
erosion.

4
Demography
The 4th
Rwanda Population and Housing Census (PHC4) of 2012, enumerated 403,662 residents
in Rubavu District on a density of 1039 Inhabitants/Km2, where 51.7 % of the total population
are females and 48.3 % are male. total population in urban areas is 149,209 which makes 37% of
the total district‟s population whereas 254,453 (63%) reside in rural areas. The district‟s
population represents 3.8% of the total country‟s population and 16.3 % of the Western Province
population (2,471,239 inhabitants). The average house-hold size is 5.2 against 4.8 at national
level, the population aged between 0-14 years old represented 43.8% and the population aged
between 15 and 49 years old represented 47.8% while those above 50 years old represented
8.1%.
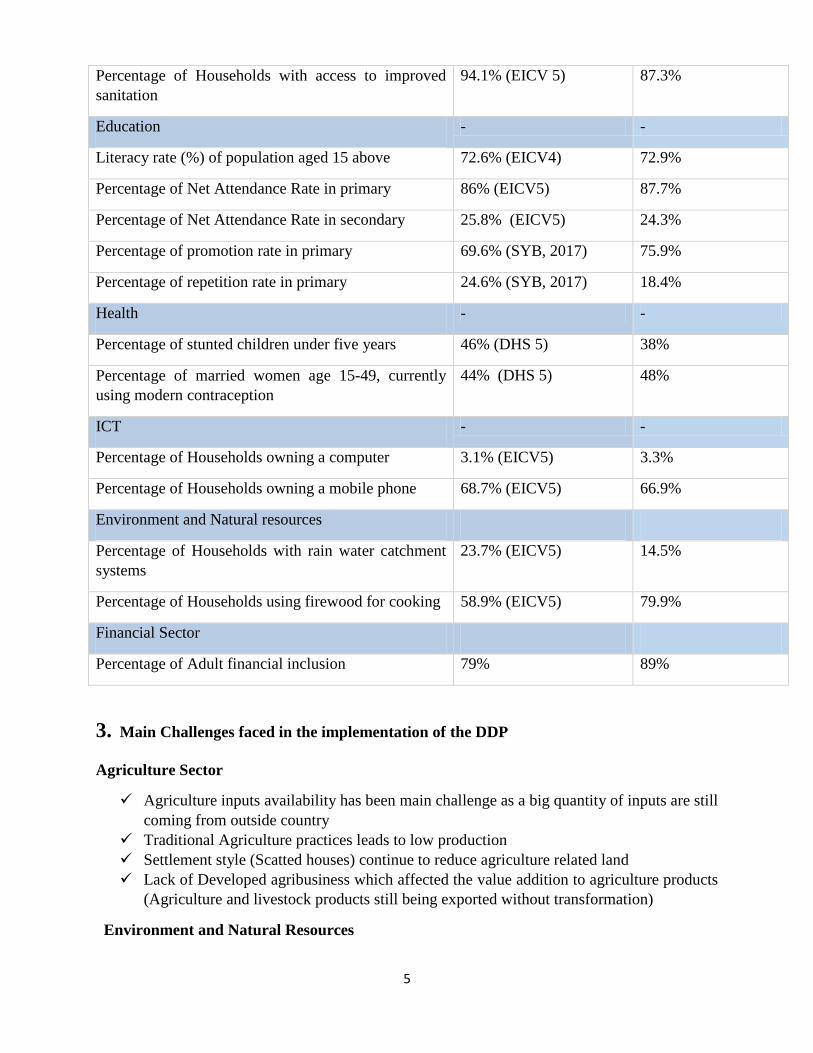
The table below presents the status of the district o selected socio-economic indicators.
Main indicator District Status National Status
Poverty Incidence rate 35.7% (EICV 5) 38.2%
Extreme Poverty Rate 14.6% (EICV 5) 16%
Labour force participation Rate 61.5% (LFS1, August
2017)
52.9%
Unemployment rate 17.3% (LFS, August
2017)
17.8%
Agriculture - -
Percentage of land under consolidation 59.6% (EICV 5) 15.9%
Percentage of land protected against soil erosion 88.7% (EICV 5) 68.5%
Percentage of land under irrigation 0.3% (EICV 5) 6%
Energy - -
Percentage of Households using Electricity for
lighting
40.8% (EICV 5) 27.1%
Water and sanitation - -
Percentage of Households using an improved water
source
98.6% (EICV 5) 87.1%
1 LFS- Labour Force Survey
5
Percentage of Households with access to improved
sanitation
94.1% (EICV 5) 87.3%
Education - -
Literacy rate (%) of population aged 15 above 72.6% (EICV4) 72.9%
Percentage of Net Attendance Rate in primary 86% (EICV5) 87.7%
Percentage of Net Attendance Rate in secondary 25.8% (EICV5) 24.3%
Percentage of promotion rate in primary 69.6% (SYB, 2017) 75.9%
Percentage of repetition rate in primary 24.6% (SYB, 2017) 18.4%
Health - -
Percentage of stunted children under five years 46% (DHS 5) 38%
Percentage of married women age 15-49, currently
using modern contraception
44% (DHS 5) 48%
ICT - -
Percentage of Households owning a computer 3.1% (EICV5) 3.3%
Percentage of Households owning a mobile phone 68.7% (EICV5) 66.9%
Environment and Natural resources
Percentage of Households with rain water catchment
systems
23.7% (EICV5) 14.5%
Percentage of Households using firewood for cooking 58.9% (EICV5) 79.9%
Financial Sector
Percentage of Adult financial inclusion 79% 89%
3. Main Challenges faced in the implementation of the DDP
Agriculture Sector
Agriculture inputs availability has been main challenge as a big quantity of inputs are still
coming from outside country
Traditional Agriculture practices leads to low production
Settlement style (Scatted houses) continue to reduce agriculture related land
Lack of Developed agribusiness which affected the value addition to agriculture products
(Agriculture and livestock products still being exported without transformation)
Environment and Natural Resources

6
Soil erosion and landslides were frequent in most areas of the District;
Deforestation and environmental degradation were increased by the high use of firewood
and low budget to implement environmental protection projects
Private Sector Development
In private sector development, the implementation was affected by:
Insufficient participation/engagement of the private sector in District transformational
projects;
Energy
Existence of some areas without electricity access within the District
Renewable energy not developed
Water and Sanitation
Insufficient water supply within the District;
Lack waste management system
Rain Water harvesting system (Insufficient)
Transport
Existence of Inadequate Roads infrastructures within the District
Lack of Maritime transportation system (Port)
Inactivity and outdated status of domestic airport
Inexistence of Rubavu Main Taxi park and bus station within the District
Lack of Non-Motorized Transport ways within the City
ICT
Very low rate of ICT literacy within the District (6.8%)
Urbanization and Rural settlement
Lack of Rubavu detailed land use master plan
Financial Sector development
Low rate of Financial literacy
Lack of Long term serving scheme
10. Education
Insufficient Education Staff's capacity
Education infrastructures still low;
Number of student per teacher still high (61)
Health
Insufficient and qualified medical personnel
Inadequate and insufficient Health Infrastructure and equipments
Rate of population without medical insurance (citizen not adhering in any medical
insurance scheme)
Social Protection
Rate of citizen in poverty and extreme poverty status

7
Sport and Culture
Insufficient of sport and leisure public infrastructures
Governance and Decentralization
Insufficient infrastructures and office equipments towards service delivery
Lack of updates and implementable related to District personnel capacity building plan
Justice, Reconciliation, Law and order
Week implementation of Citizen out rich programs aiming to citizen complaints
resolution and prevention
Public Finance Management
Low professional of Financial staff
4. District Economic potentialities.
Being a border district (neighboring DRC), the geographic location of Rubavu and access to lake
Kivu provides huge potential for cross border trade and tourism. In addition, the fertile soils in
the vast areas of the district provides huge potential for Agriculture production.
The following table present the analysis of the district‟s potentialities
Potentialities Opportunities
Tourism Existence of touristic sites (Lake Kivu, Virunga National Park, The
Caves and Gishwati Natural Forest) that attract tourists
Gisenyi: 6 hotels and many guest houses to accommodate visitors and
tourists
ICT services available
Cultural offer, dance clubs available,
Airport located in Gisenyi
Beautiful islands and hills along Kivu Belt
Recognized as one of High National tourism destination
Supportive institutions (RDB) and different stakeholders
Hot spring /Geothermal water
Good weather at all time of the year
Cross border
trade and
business
establishments
for job creation
High rate of cross border trade with Goma town in DRC.
Existence of 12 modern public markets and 41 trading centers
Some of the Rwandan products are more preferred by neighboring markets
(e.g. Agashya juice, Akabanga, Kiyaka products and craft
products)Rubavu town is a strategic location with many hotels and other
business infrastructures
Modern financial services including Mobile Money Transfers
Presence of international travel agencies
Modern ICT infrastructure.

8
Potentialities Opportunities
Presence of big business establishments e.g. BRALIRWA headquarters
which is a source of employment.
Suitable land
for crops
production
Fertile soil suitable for crops like maize and potato, coffee and pisciculture
production
Sufficient rainfall and good seasonal distribution
Manpower
Buffer zone of Lake Kivu for coffee plantation
Existence of 227 cooperatives of which the majority operates in the trading
(54) and agriculture (49) sector
Existence of coffee washing factory
Maize processing plants
Crops production is labour intensive and therefore, promotes job creation
Favorable climate
Easy access to market in DRC
High local demand for agricultural production (maize and Irish potatoes)
NAEB, RAB (modern farming techniques available, post-harvest and
export promotion)
Coffee export market
National Land Consolidation Strategy
Existence of guarantee fund for agriculture, business and rural
investments.
Lake for
maritime
transport
Strategic location regarding national and international travels
Lake Kivu connects the districts of Rutsiro, Karongi, Nyamasheke and
Rusizi
Connection to DRC through maritime transport line
Lake Kivu as national resource which the central government plans to
invest in
Source: Compiled from LE Assessment, Rubavu District, March 2017
9
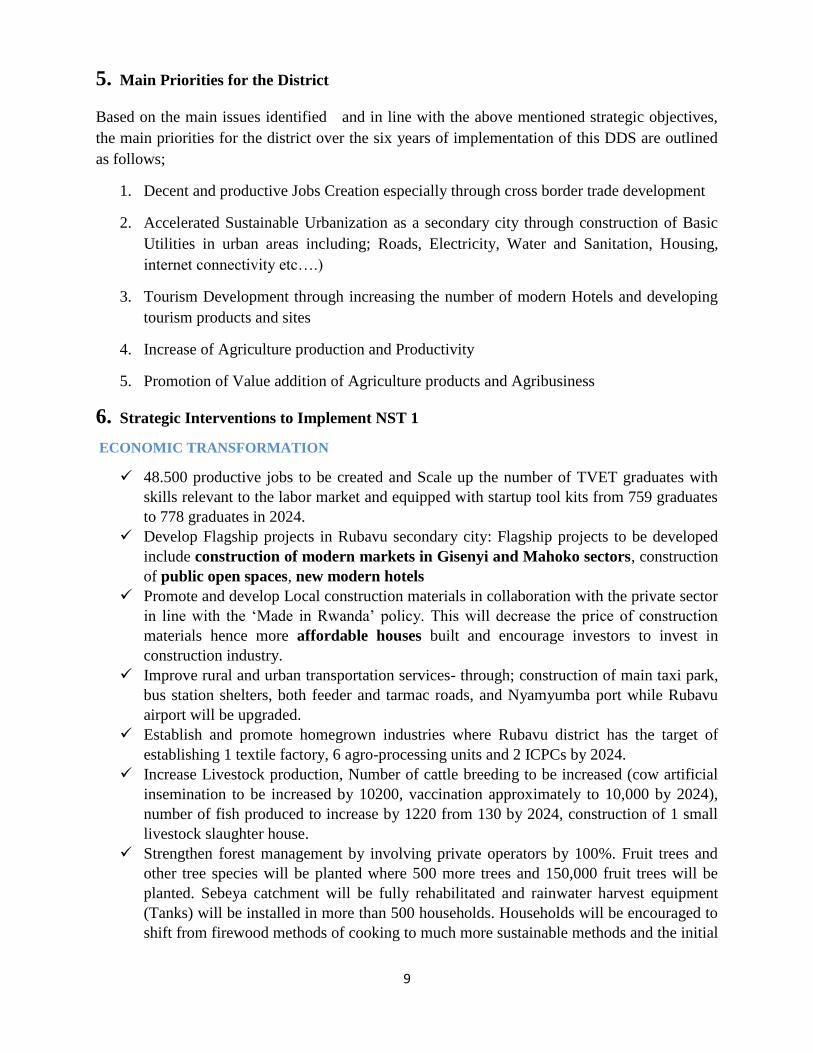
5. Main Priorities for the District
Based on the main issues identified and in line with the above mentioned strategic objectives,
the main priorities for the district over the six years of implementation of this DDS are outlined
as follows;
1. Decent and productive Jobs Creation especially through cross border trade development
2. Accelerated Sustainable Urbanization as a secondary city through construction of Basic
Utilities in urban areas including; Roads, Electricity, Water and Sanitation, Housing,
internet connectivity etc….)
3. Tourism Development through increasing the number of modern Hotels and developing
tourism products and sites
4. Increase of Agriculture production and Productivity
5. Promotion of Value addition of Agriculture products and Agribusiness
6. Strategic Interventions to Implement NST 1
ECONOMIC TRANSFORMATION
48.500 productive jobs to be created and Scale up the number of TVET graduates with
skills relevant to the labor market and equipped with startup tool kits from 759 graduates
to 778 graduates in 2024.
Develop Flagship projects in Rubavu secondary city: Flagship projects to be developed
include construction of modern markets in Gisenyi and Mahoko sectors, construction
of public open spaces, new modern hotels
Promote and develop Local construction materials in collaboration with the private sector
in line with the „Made in Rwanda‟ policy. This will decrease the price of construction
materials hence more affordable houses built and encourage investors to invest in
construction industry.
Improve rural and urban transportation services- through; construction of main taxi park,
bus station shelters, both feeder and tarmac roads, and Nyamyumba port while Rubavu
airport will be upgraded.
Establish and promote homegrown industries where Rubavu district has the target of
establishing 1 textile factory, 6 agro-processing units and 2 ICPCs by 2024.
Increase Livestock production, Number of cattle breeding to be increased (cow artificial
insemination to be increased by 10200, vaccination approximately to 10,000 by 2024),
number of fish produced to increase by 1220 from 130 by 2024, construction of 1 small
livestock slaughter house.
Strengthen forest management by involving private operators by 100%. Fruit trees and
other tree species will be planted where 500 more trees and 150,000 fruit trees will be
planted. Sebeya catchment will be fully rehabilitated and rainwater harvest equipment
(Tanks) will be installed in more than 500 households. Households will be encouraged to
shift from firewood methods of cooking to much more sustainable methods and the initial

10
percentage of firewood users is 99.8% to be decreased to 42% while promoting GAZ
usage in cooking.
SOCIAL TRANSFORMATION
Strengthen Multi- sectoral coordination and ensure sustained food security. This will be
achieved through increased number of social, education, health, agriculture, National
Woman Council unit implicated in eradication of malnutrition. Local enriched food will
be initiated from fisheries, iron rich beans, Vitamin A rich sweet potatoes, etc. District
plan to Eliminate Malnutrition activities at all levels will be reinforced and coordinated
where 5,137 more groups (amasibo) will be established by 2024 from 13 that are in place.
The number of children under 5 years and pregnant women that benefit from FBF from
will increase from 3,942 to 16,434 by 2024. In addition, there will be mobilization of
citizens for establishment of kitchen garden in all villages and at a household level.
Health services will be improved through; upgrade Gisenyi hospital, establishment of
an additional modern hospital, 50 Health Posts construction and renovation of health
centers, increase of ambulances from 3 to 10 as well as connection of health facilities
with adequate infrastructure with a target of 100% access to water and electricity.
Education quality will also be improved through; increased number of classrooms to
reduce students‟ teacher ratio, promoting teachers training, construction of laboratories
(science and technology) and decrease the rate of drop-outs.
Increase Technical and Vocational Education and Training (TVET) schools and
graduates. Number of TVET schools to be increased from 8 available to 20 schools and
increased number of girls and people with disabilities in TVET schools.
Increase access to basic infrastructure including 100% access to electricity and
water. In addition, increased access to sanitation will be promoted through construction
of public toilets, landfill and faecal sludge treatment plant. Broadband coverage will be
increased to 47% of all citizens by partnering with telecommunication companies. All
citizens living in high risk zone will be relocated by 2024. Rubavu Citizens will be
facilitated to acquire affordable and decent housing, promote recreational, sports and
culture e.g. construction of water sport complex
TRANSFORMATIONAL GOVERNANCE
Promote unity and reconciliation among Rwandans through "Ndi Umunyarwanda
and abarinzi b‟igihango” campaigns that will be conducted in all villages.
Strengthen and promote gender equality by increased number of programs/ projects
from 5 to 47 implemented by 2024.
Promote peace and security through strengthening community policing and crime
prevention. This will be delivered through training community policing members,
initiate professional patrol (irondo ry‟umwuga) and equip them with adequate
working facilities like uniforms, patrol car, among others. In addition, a rehabilitation
center will be established, campaigns to fight against drugs and crime will be
conducted and avail police stations will be established in each sector.

11
Strive for unity of Africans and development of the region through organizing
meetings with foreign local authorities (DRC)
Sustained respect for human rights and civil liberties by promoting alternative
dispute resolution mechanism e.g. through training of mediation committees(abunzi),
intensify the fight against corruption and genocide ideology at all levels by creating
anti-corruption, and peace and unity clubs and awareness campaigns and construct
“Ubutore” development center.
Enhanced accountability and production across public institutions and online service
delivery which is to be done through construction of sector offices and deliver all
public services online, ensure all projects to be implemented have feasibility studies,
strengthen functioning clusters i.e. all stakeholders in the district e.g. JADF and
increase the District‟s own revenues through enforcement of the new property tax
law for local Governments.
Increased citizens‟ participation, engagement and partnerships in development
7. Main Transformational Projects planned by the district
NO PROJECT
Economic Transformation
1 Construction of Gisenyi Modern Market
2 Construction Mahoko Modern Market
3 Construction of Cross border Infrastructure at KABUHANGA border
4 Creation of 2 public open spaces in Rubavu City
5 Construction of bonded warehouse at Petite Barriere
6 Implementation of Ecotourism project at Rubavu Mountain
7 Construction of 5 Modern Hotels
8 Construction of Talent detection Centers
9 Affordable modern houses Construction
10 Construction of Modern Office Buildings
11 Construction of Modern Kilns (brick furnace)
12 Greened affordable real estates constructed in partnership with private sectors
13 Rubavu Main Taxi Park construction
14 Bus stations shelters construction
15 Construction of 25 Km of Serviced Tarmac Roads
16 Construction of 100 Km of Feeder Roads
17 Extension of Rubavu Airport
18 Construction of Nyamyumba Port
19 Establishment of Textile Factory
20 Establishment of 5 Agro Processing Units
21 Construction of Integrated Craft Production Centers (ICPCs)
22 Construction of 3000 ha Progressive terraces
23 Construction of 300 ha of Bench terraces
24 Construction of 5 Irish Potatoes seeds multiplication (minitubes) green houses
25 Upgrading of Farmers training centers
12
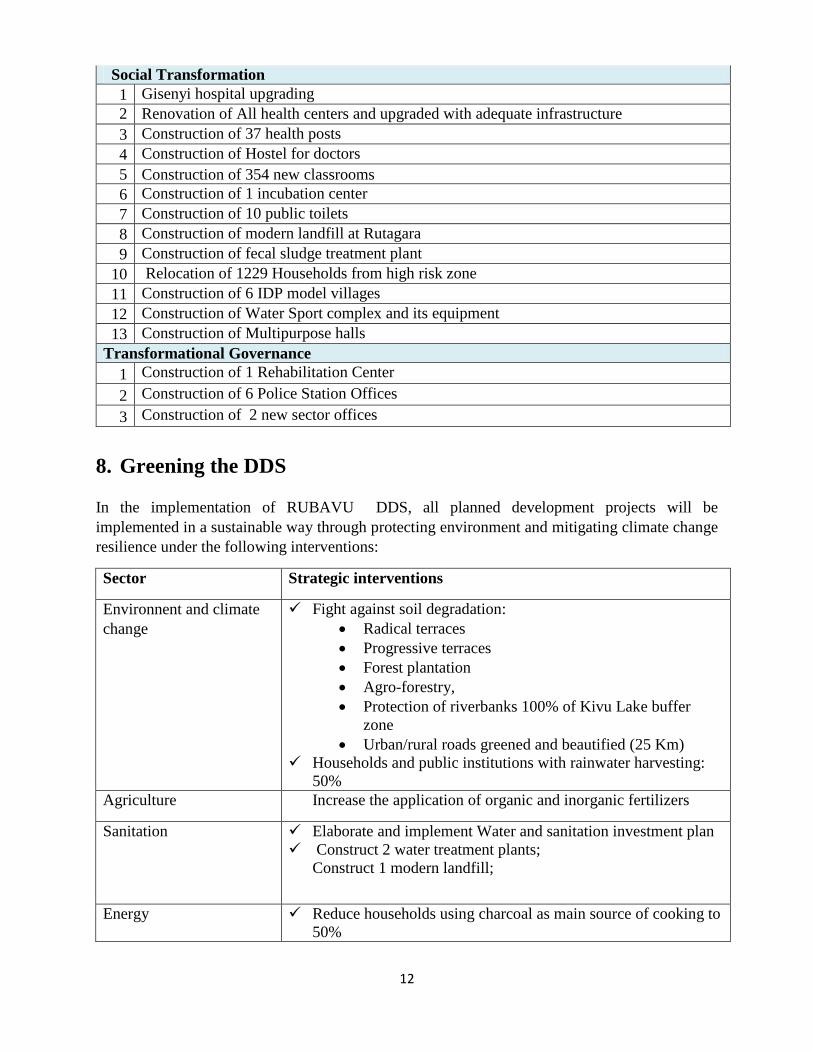
Social Transformation
1 Gisenyi hospital upgrading
2 Renovation of All health centers and upgraded with adequate infrastructure
3 Construction of 37 health posts
4 Construction of Hostel for doctors
5 Construction of 354 new classrooms
6 Construction of 1 incubation center
7 Construction of 10 public toilets
8 Construction of modern landfill at Rutagara
9 Construction of fecal sludge treatment plant
10 Relocation of 1229 Households from high risk zone
11 Construction of 6 IDP model villages
12 Construction of Water Sport complex and its equipment
13 Construction of Multipurpose halls
Transformational Governance
1 Construction of 1 Rehabilitation Center
2 Construction of 6 Police Station Offices
3 Construction of 2 new sector offices
8. Greening the DDS
In the implementation of RUBAVUR DDS, all planned development projects will be
implemented in a sustainable way through protecting environment and mitigating climate change
resilience under the following interventions:
Sector Strategic interventions
Environnent and climate
change
Fight against soil degradation:
Radical terraces
Progressive terraces
Forest plantation
Agro-forestry,
Protection of riverbanks 100% of Kivu Lake buffer
zone
Urban/rural roads greened and beautified (25 Km)
Households and public institutions with rainwater harvesting:
50%
Agriculture Increase the application of organic and inorganic fertilizers
Sanitation Elaborate and implement Water and sanitation investment plan
Construct 2 water treatment plants;
Construct 1 modern landfill;
Energy Reduce households using charcoal as main source of cooking to
50%
13
Promotion of off grid electricity (30% of population)
Urbanization and
settlement
70% of households in planned settlement
Construct 6 new IDP Models (Relocate households from High
Risk zones and scattered areas);
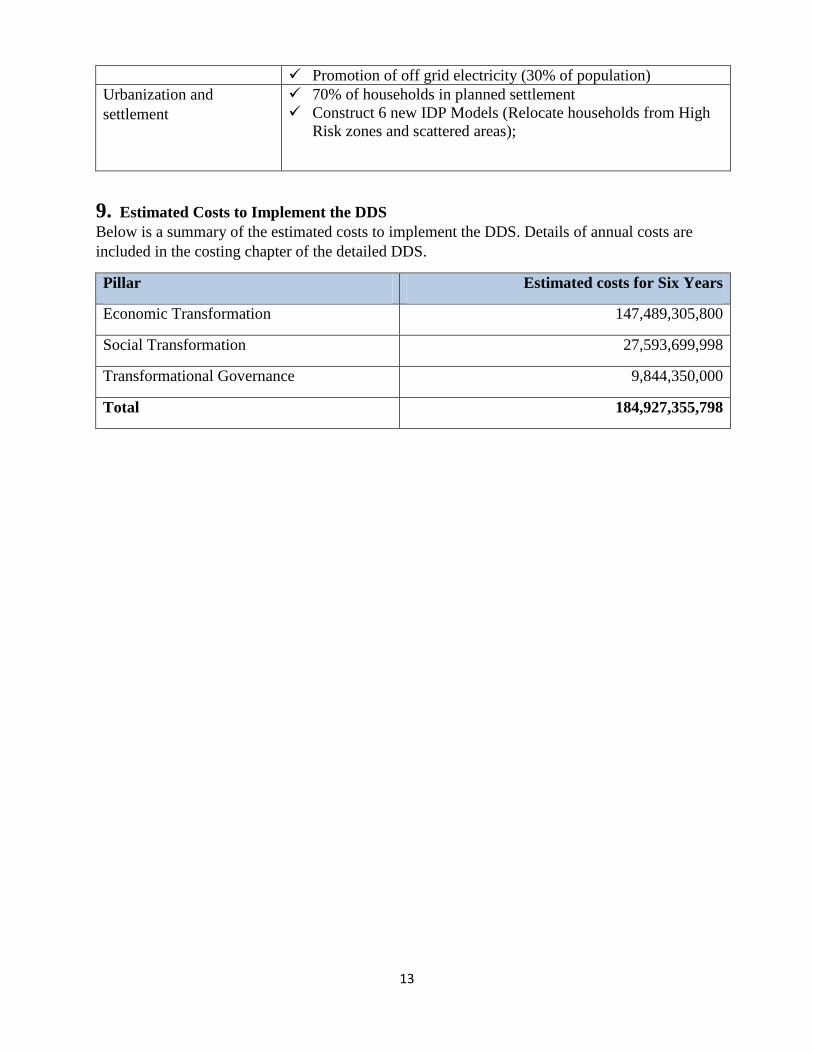
9. Estimated Costs to Implement the DDS
Below is a summary of the estimated costs to implement the DDS. Details of annual costs are
included in the costing chapter of the detailed DDS.
Pillar Estimated costs for Six Years
Economic Transformation 147,489,305,800
Social Transformation 27,593,699,998
Transformational Governance 9,844,350,000
Total 184,927,355,798

14
10. Log frame
The log frame below entails the baseline, means of verification and assumptions to deliver on the
district targets over the DDS period.

15
Table 2: Logical framework
ECONOMIC TRANSFORMATION
GOAL/IMPACT: Inclusive and sustainable economic development founded on the Private Sector, knowledge and Rwanda‟s Natural Resources
INDICATOR BASELINE DDS
Target
TARGET TARG
ET
TARGET TARGET TARGET TARGET Estimated Budget MEANS OF
(2017/18) 2018/19 2019/20 2020/21 2021/22 2022/23 2023/24 VERIFICATION
SECTOR: Private sector development and youth employment
PRIORITYAREA 1: Create 1.5m (over 214,000 annually) decent and productive jobs for economic development
OUTCOME 1: Improved hands-on skills among youth, women and PWDs outside regular education system to harness their employment
Output 1.1: Hands-on Skills enhanced and improved through critical massive short term vocational training (MVT)
Number of semi-skilled &
Unskilled youth, women and
PWDs (People with Disability)
trained and employed
150 610 90 95 100 100 110 115 61000000 report
Output 1.1: Hands-on Skills enhanced and improved for ICPCs operators (Integrated Craft Production Centers)
Number of existing productive
craftsmen and artisans in
ICPCs upgraded with skills and
awarded certificates
300 180 30 30 30 30 30 30
9,000,00
0
report
OUTCOME 2: Increased productive Jobs through entrepreneurship and business development
Output 2.1: MSMEs and Cooperatives in ICPCs supported to access modern equipment
Number of ICPCs operators
supported to acquire
Equipment through leasing
scheme
222 270 45 45 45 45 45 45 1500000
00
report
Output 2.2: Start up MSMEs are coached to develop bankable projects by Business Development Advisors using vouchers
Number of start-up MSMEs for
Youth and Women coached to
1500 4,050 600 650 650 700 700 750
40,500,0
report

16
access finance 00
Output 2.3: New TVET graduates accessing start up toolkit loan facility
Number of new TVET
graduates who received start up
toolkit.
759 778 116 122 130 135 135 140 389,000,
000
report
Output 2.4: Agribusiness projects for university graduates supported with start up capital
Number of agribusiness projects
for graduates which received
start-up capital
3 28 3 4 5 6 7 8 330,000,
000
report
Output 2.5: One model project per village implemented for youth employment
Number of model village
projects established
30 531 86 87 88 89 90 91 5,310,00
0,000
report
Output 2.6: Startup and early growth SMEs supported to access finance through BDF guarantee and grant scheme
Number of SMEs supported to
access finance through BDF
guarantee and grant scheme
350 225 33 35 35 37 40 45 2,250,00
0,000
report
Output 2.7: Productive Jobs created in all economic activities in the District are traced and reported
Number of productive jobs
created
8000 45660 7500 7540 7540 7540 7540 8000 1200000
0
report
SECTOR: Urbanization and rural settlement
PRIORITY AREA 2: Accelerate Sustainable Urbanization from 17.3% (2013/14) to 35% by
2024
OUTCOME 2.1: Develop flagship Projects in secondary city
OUTPUT 2.1.1: Flagship projects developed in Rubavu City
Number of Gisenyi Modern
Market constructed
0 1 0 1 0 0 0 0 2,000,00
0,000
report
Number of Mahoko Modern 0 1 0 1 0 0 0 0 4,000,00 report

17
Market Constructed 0,000
Number public open spaces
created
2 1 1 0 0 0 2,000,00
0,000
report
Number of bonded warehouse
constructed
1 5 2 1 1 1 0 1,900,00
0,000
report
Number of Ecotourism project
implementation at Rubavu
Mountain
2 1 50% 50% 0 0 0 0 2,000,00
0,000
report
Number of New Modern Hotels
Constructed
0 1 0 1 0 0 0 0 1,000,00
0,000
report
OUTPUT2.1.2: To develop green local urban development plans for emerging centers of Rubavu District
Number of Rubavu District
Master Plan updated
1 1 1 0 0 0 0 0 600,000,
000
report
Number of Local Urban
development plan developed
1 7 1 1 2 1 1 1 800,000,
000
report
Number of Green city detailed
physical Plan developed
0 1 0 1 0 0 0 0 510,000,
000
report
Number of Modern Office
Buildings constructed
0 1 0 1 0 0 0 0 1,000,00
0,000
report
Number of Modern Kilns (brick
furnace) constructed
0 2 0 1 1 0 0 0 200,000,
000
report
OUTCOME 3.: Promote and develop local construction Materials in Collaboration with Private Sector in Rubavu District
OUTPUT 3.1: Increased availability of affordable housing
Number of affordable modern
house constructed
2 30 2 5 8 9 4 2 4,500,00
0,000
report
Number of greened affordable
real estates constructed in
partnership with private sectors
0 2 1 0 1 0 0 17,000,0
00,000
report
18
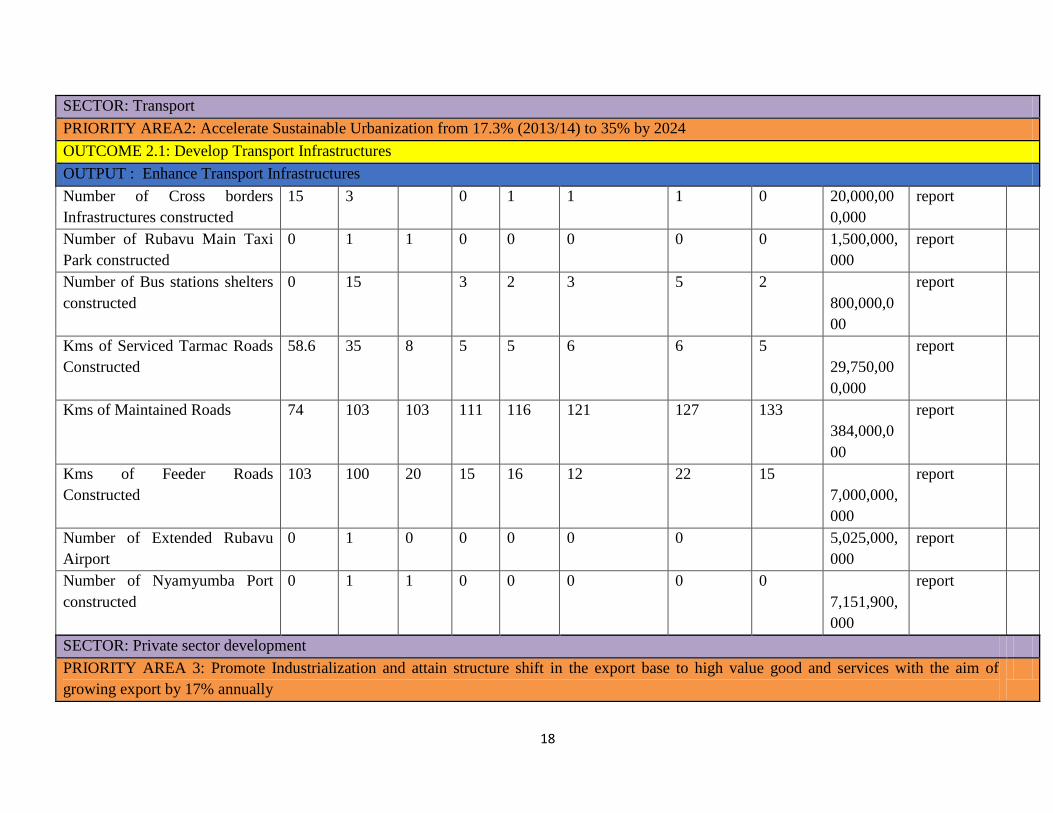
SECTOR: Transport
PRIORITY AREA2: Accelerate Sustainable Urbanization from 17.3% (2013/14) to 35% by 2024
OUTCOME 2.1: Develop Transport Infrastructures
OUTPUT : Enhance Transport Infrastructures
Number of Cross borders
Infrastructures constructed
15 3 0 1 1 1 0 20,000,00
0,000
report
Number of Rubavu Main Taxi
Park constructed
0 1 1 0 0 0 0 0 1,500,000,
000
report
Number of Bus stations shelters
constructed
0 15 3 2 3 5 2
800,000,0
00
report
Kms of Serviced Tarmac Roads
Constructed
58.6 35 8 5 5 6 6 5
29,750,00
0,000
report
Kms of Maintained Roads 74 103 103 111 116 121 127 133
384,000,0
00
report
Kms of Feeder Roads
Constructed
103 100 20 15 16 12 22 15
7,000,000,
000
report
Number of Extended Rubavu
Airport
0 1 0 0 0 0 0 5,025,000,
000
report
Number of Nyamyumba Port
constructed
0 1 1 0 0 0 0 0
7,151,900,
000
report
SECTOR: Private sector development
PRIORITY AREA 3: Promote Industrialization and attain structure shift in the export base to high value good and services with the aim of
growing export by 17% annually
19
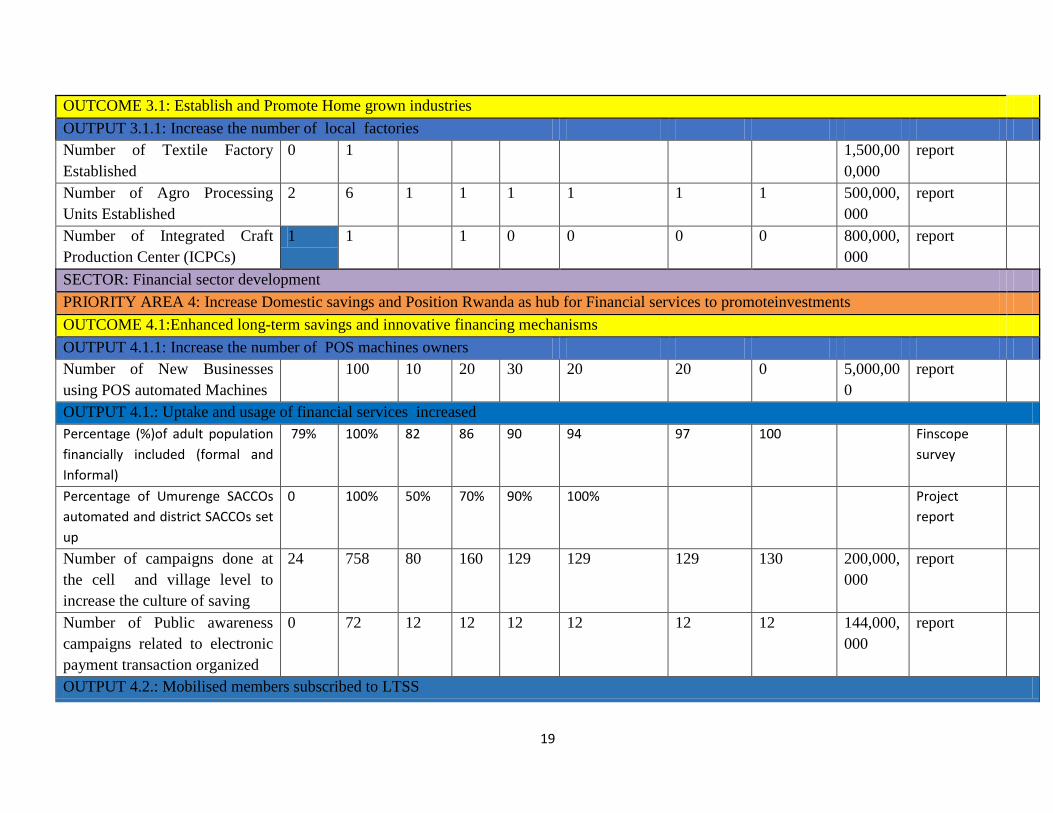
OUTCOME 3.1: Establish and Promote Home grown industries
OUTPUT 3.1.1: Increase the number of local factories
Number of Textile Factory
Established
0 1 1,500,00
0,000
report
Number of Agro Processing
Units Established
2 6 1 1 1 1 1 1 500,000,
000
report
Number of Integrated Craft
Production Center (ICPCs)
1 1 1 0 0 0 0 800,000,
000
report
SECTOR: Financial sector development
PRIORITY AREA 4: Increase Domestic savings and Position Rwanda as hub for Financial services to promoteinvestments
OUTCOME 4.1:Enhanced long-term savings and innovative financing mechanisms
OUTPUT 4.1.1: Increase the number of POS machines owners
Number of New Businesses
using POS automated Machines
100 10 20 30 20 20 0 5,000,00
0
report
OUTPUT 4.1.: Uptake and usage of financial services increased
Percentage (%)of adult population
financially included (formal and
Informal)
79% 100% 82 86 90 94 97 100 Finscope
survey
Percentage of Umurenge SACCOs
automated and district SACCOs set
up
0 100% 50% 70% 90% 100% Project
report
Number of campaigns done at
the cell and village level to
increase the culture of saving
24 758 80 160 129 129 129 130 200,000,
000
report
Number of Public awareness
campaigns related to electronic
payment transaction organized
0 72 12 12 12 12 12 12 144,000,
000
report
OUTPUT 4.2.: Mobilised members subscribed to LTSS
20
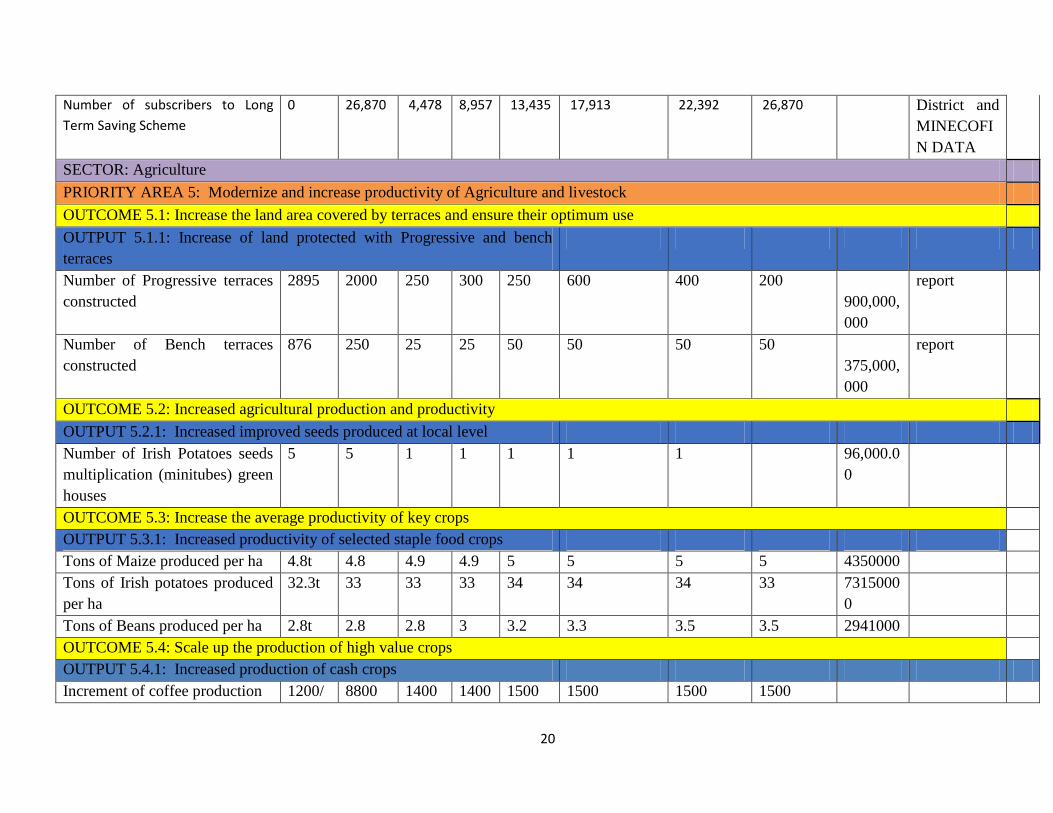
Number of subscribers to Long
Term Saving Scheme
0 26,870 4,478 8,957 13,435 17,913 22,392 26,870 District and
MINECOFI
N DATA
SECTOR: Agriculture
PRIORITY AREA 5: Modernize and increase productivity of Agriculture and livestock
OUTCOME 5.1: Increase the land area covered by terraces and ensure their optimum use
OUTPUT 5.1.1: Increase of land protected with Progressive and bench
terraces
Number of Progressive terraces
constructed
2895 2000 250 300 250 600 400 200
900,000,
000
report
Number of Bench terraces
constructed
876 250 25 25 50 50 50 50
375,000,
000
report
OUTCOME 5.2: Increased agricultural production and productivity
OUTPUT 5.2.1: Increased improved seeds produced at local level
Number of Irish Potatoes seeds
multiplication (minitubes) green
houses
5 5 1 1 1 1 1 96,000.0
0
OUTCOME 5.3: Increase the average productivity of key crops
OUTPUT 5.3.1: Increased productivity of selected staple food crops
Tons of Maize produced per ha 4.8t 4.8 4.9 4.9 5 5 5 5 4350000
Tons of Irish potatoes produced
per ha
32.3t 33 33 33 34 34 34 33 7315000
0
Tons of Beans produced per ha 2.8t 2.8 2.8 3 3.2 3.3 3.5 3.5 2941000
OUTCOME 5.4: Scale up the production of high value crops
OUTPUT 5.4.1: Increased production of cash crops
Increment of coffee production 1200/ 8800 1400 1400 1500 1500 1500 1500

21
year
Increment of Tea production 2250/
year
14100 2300 2300 2300 2300 2400 2500
Increment of Pyrethrum
production
140/y
ear
910 145 150 150 155 160 150
OUTCOME 5.5:Increased financing and infrastructure for agriculture
OUTPUT 5.5.1 :Skills development for farmers
Number of Farmers training
centers upgraded
1 2 1 1 2500000
00
Percentage of men and women
trained from the farmers training
center
male 0 100 20 20 30 30 0 1000000
0
femal
e 0
100 20 20 30 30 0 1500000
0
OUTCOME 5.6: Improved livestock sector
OUTPUT 5.6.1: Enhance the quality and quantity of livestock production
Number of cows artificiality
inseminated
1782 10,200 1,500 1,60
0
1,700 1,750 1,800 1,850 70000000
Number of cows vaccinated
against Black quarter (BQ)
10,00
0
79,500 12,00
0
12,5
00
13,000 13,500 14,000 14,500 60000000
Number of cows vaccinated
against Lumpy skin
disease(LSD)
9,000 73,500 11,00
0
11,5
00
12,000 12,500 13,000 13,500 60000000
Number of animal vaccinated/
Rabies
200 1,500 250 250 250 250 250 250 15000000
Number of fish produced (MT) 130 1,220 180 190 200 210 220 220 50000000
0
number of small livestock
slaughter house constructed
0 1 1 10000000
0
22
Number of children benefit from
one cup of milk
10,76
9
73,169 11,76
9
12,0
00
12,200 12,300 12,400 12,500 42145344
00
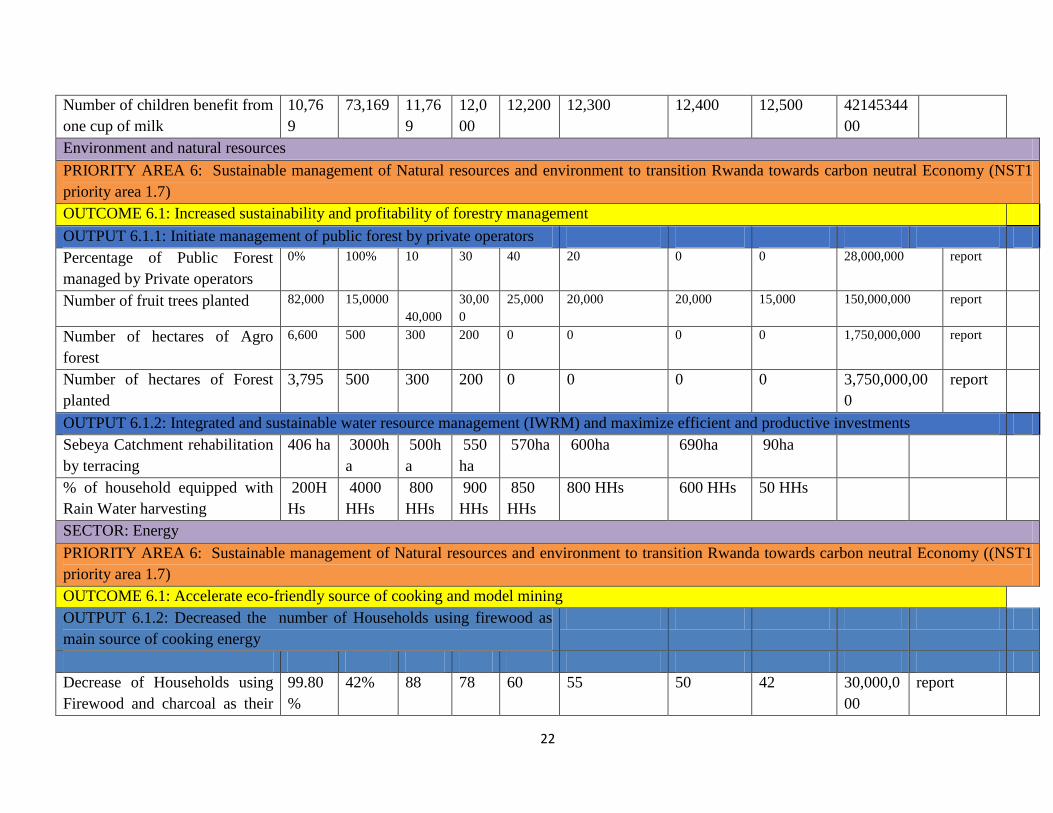
Environment and natural resources
PRIORITY AREA 6: Sustainable management of Natural resources and environment to transition Rwanda towards carbon neutral Economy (NST1
priority area 1.7)
OUTCOME 6.1: Increased sustainability and profitability of forestry management
OUTPUT 6.1.1: Initiate management of public forest by private operators
Percentage of Public Forest
managed by Private operators
0% 100% 10 30 40 20 0 0 28,000,000 report
Number of fruit trees planted 82,000 15,0000
40,000
30,00
0
25,000 20,000 20,000 15,000 150,000,000 report
Number of hectares of Agro
forest
6,600 500 300 200 0 0 0 0 1,750,000,000 report
Number of hectares of Forest
planted
3,795 500 300 200 0 0 0 0 3,750,000,00
0
report
OUTPUT 6.1.2: Integrated and sustainable water resource management (IWRM) and maximize efficient and productive investments
Sebeya Catchment rehabilitation
by terracing
406 ha 3000h
a
500h
a
550
ha
570ha 600ha 690ha 90ha
% of household equipped with
Rain Water harvesting
200H
Hs
4000
HHs
800
HHs
900
HHs
850
HHs
800 HHs 600 HHs 50 HHs
SECTOR: Energy
PRIORITY AREA 6: Sustainable management of Natural resources and environment to transition Rwanda towards carbon neutral Economy ((NST1
priority area 1.7)
OUTCOME 6.1: Accelerate eco-friendly source of cooking and model mining
OUTPUT 6.1.2: Decreased the number of Households using firewood as
main source of cooking energy
Decrease of Households using
Firewood and charcoal as their
99.80
%
42% 88 78 60 55 50 42 30,000,0
00
report

23
main source of cooking (USING
GAZ)
OUTPUT 6.2.1: upgrading of existing mining.
Number of upscale, small scale
and exploration mining to be
eco-friendly mining.
0 10 5 5 0 0 0 0 10,000,0
00
report
SOCIAL TRANSFORMATION
GOAL/IMPACT: Capable and skilled Rwandan with quality standard of living, stable and secure society
INDICATOR BASE
LINE
DDS
Target
TAR
GET
TAR
GET
TARG
ET
TARGET TARGET TARGET Estimate
d
Budget
MEANS OF
VERIFICA
TION
A
SS
U
M
PT
IO
N
S
(2017/
18)
2018/
19
2019
/20
2020/2
1
2021/22 2022/23 2023/24
SECTOR: Social protection
PRIORITY AREA: Enhancing graduation from extreme Poverty and promoting resilience)

24
OUTCOME1.1: Reduced poverty among Rwandans
OUTPUT 1.1.1:Scale up the minimum package for graduation (MPG)
Number of HHs who benefit
from VUP classic increased
4984 50,904 5,984 6,98
4
7,984 8,984 9,984 10,984 Reporting
Number of HHs who benefit
from VUP expanded public
works increased
355 4,,230 455 555 655 755 855 955 Reporting
Number of HHs who benefit to
MPG
781 21087 1,562 2,34
3
3,124 3,905 4,686 5,467 Reporting
OUTPUT 1.1.2: Enhance programme aiming at supporting Rubavu citizens to graduate from extreme poverty
Number of HHs graduated from
extreme poverty through PPP
14.2
%
0% 12% 8% 6% 3% 0.6% 0%
SECTOR: Health
PRIORITY AREA 2: Ensure quality healthy population
OUTCOME 2: Eradicate malnutrition
OUTPUT 2.1:Strengthening Multi-sectoral coordination
Number of social, education,
health, agriculture, NWC unit
implicated in eradication of
malnutrition
3 5 5 5 5 5 5 5
18,000,0
00
Reporting
Number of nutritional
intervention collaborate with
Rubavu District in eradication of
malnutrition
6 8 8 8 8 8 8 8
15,000,0
00
Reporting
Number of HHs benefit from
one cow per family increased
6116 6796 6616 6652 6688 6724 6760 6796 Reporting
Initiate local enriched food
(from fisheries, iron rich beans,
0 3 2 3 3 3 3 3
100,000,
Reporting

25
Vit A rich sweat potatoes) 000
DPEM activities at all level
(village, cell, sector, district)
coordinated NB. In village we
shall have groups(amasibo) to
reach end user
13 5137 93 93 618 5137 5137 5137 25,000,0
00
Reporting
OUTPUT2.2:Ensuring and sustaining food security
All under 5 years children
locating and pregnant women in
categories 1&2 receiving FBF
3942 16,434 5913 6,70
1
11,826 13,797 15,768 16,434
221,859,
000
Reporting
Kitchen garden available at
ECD, hospital, school, health
centers and health post
64 153 89 94 101 153 153 153
5,000,00
0
Reporting
OUTCOME 3.4: prevention of unplanned pregnancy
OUTPUT3.24.1: Scale up the use Medical Eligibility Criteria Wheel for contraceptive use to enhance acceptability and use of FP methods( sufficient
and trained health care providers
Contraceptive prevalence
increased
36.70
%
43.00
%
37.70
%
38.7
0%
39.70
%
40.70% 41.70% 43% 36,000,0
00
Contraceptiv
e prevalence
increased
from 36.7%
to 43%
OUTPUT3.4.2: Establish system to document and track FP users for better adherence to the program
Number of youth campaign to
prevent teenage pregnancies
0 18 3 6 9 12 15 18
108,000,
000
Teenage
pregnancies
reduced
Number of youth corners at HCs
enhanced
8 14 9 10 11 12 13 14
220,000,
000
Teenage
pregnancies
reduced

26
System to track FP users
installed
0 100% 20%
of the
syste
m
30% 50% 70% 80% 100%
100,000,
000
Dropout
cases
reduced and
family
planning
prevalence
increased
SECTOR: Health
PRIORITY AREA 4: Enhancing demographic dividend through ensuring access to quality Health for all
OUTCOME 4.1: Construct and upgrade health facilities with adequate infrastructure
OUTPUT 4.1.1: 100% access of water and electricity to all public institutions
All health posts with access to
water
90% 100% 100% 100
%
100% 100% 100% 100%
600,000,
000
All health
posts
connected to
water and
hygiene
status
increased
All health posts with access to
electricity
90% 100% 100% 100
%
100% 100% 100% 100%
400,000,
000
All health
posts
connected to
electricity
OUTPUT4.1.2.: 100% of health facilities with adequate infrastructure
Gisenyi hospital upgrading 1 Stand
ard
buildi
ng &
full
equip
Feasib
ility
study
10% 30% 60% 80% 100%
1,000,00
0,000
Gisenyi
district
hospital
constructed
and
equipped

27
ped with
adequate
equipments
All health centers renovated and
upgraded with adequate
infrastructure
8 14 9 10 11 12 13 14
1,500,00
0,000
14 health
centers with
adequate
infrastructur
e
Increase the number of health
posts
10 23 13 15 17 19 21 23
370,000,
000
Two health
post per year
OUTPUT 4.1.3.: 100% of health facilities accessible
Number of ambulance
purchased
3 10 4 5 6 7 8 10
350,000,
000
Accessibilit
y to Health
services
increased,
reduce
infant and
maternal
mortality
rate
OUTPUT 4.1.4:One health center upgraded to a model health center of excellence
Mudende HC upgraded on
infrastructure, equipment and
personnel to a model health
center of excellence
0 1 10%(
feasib
ility
study
)
25% 50% 75% 100% 100%
900,000,
000
Mudende
HC operate
as a health
center of
excellence
OUTCOME 4.2: Increased health of workforce
28
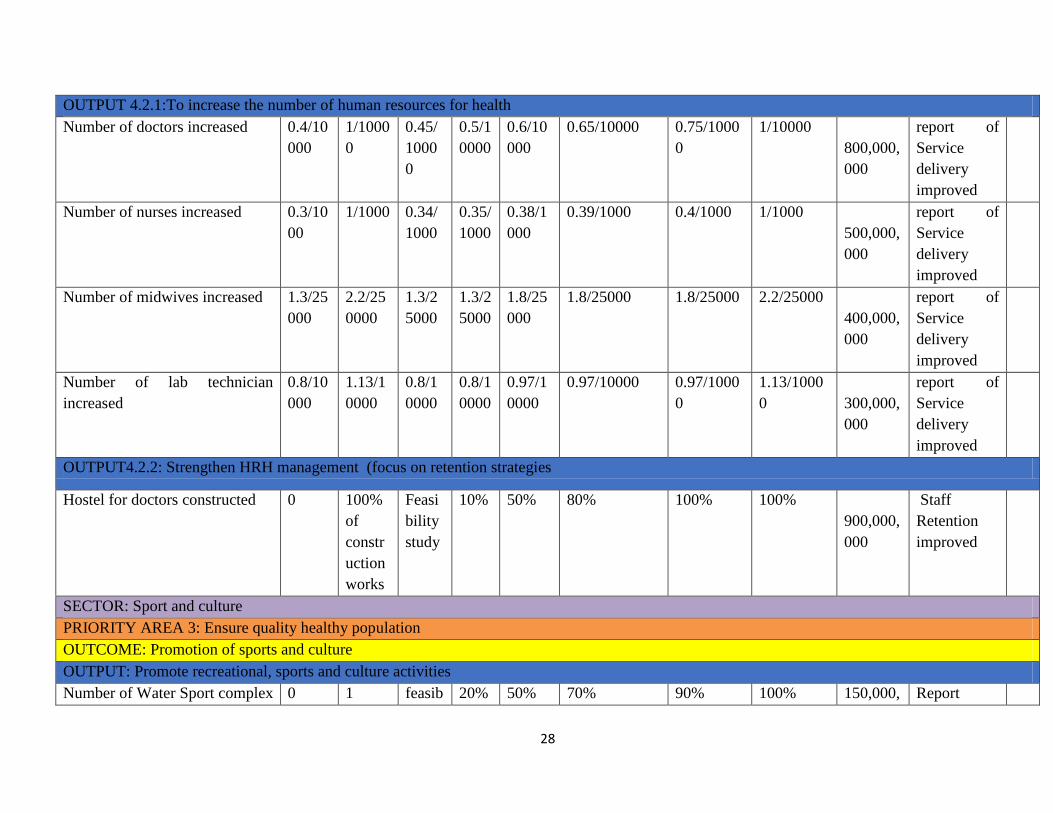
OUTPUT 4.2.1:To increase the number of human resources for health
Number of doctors increased 0.4/10
000
1/1000
0
0.45/
1000
0
0.5/1
0000
0.6/10
000
0.65/10000 0.75/1000
0
1/10000
800,000,
000
report of
Service
delivery
improved
Number of nurses increased 0.3/10
00
1/1000 0.34/
1000
0.35/
1000
0.38/1
000
0.39/1000 0.4/1000 1/1000
500,000,
000
report of
Service
delivery
improved
Number of midwives increased 1.3/25
000
2.2/25
0000
1.3/2
5000
1.3/2
5000
1.8/25
000
1.8/25000 1.8/25000 2.2/25000
400,000,
000
report of
Service
delivery
improved
Number of lab technician
increased
0.8/10
000
1.13/1
0000
0.8/1
0000
0.8/1
0000
0.97/1
0000
0.97/10000 0.97/1000
0
1.13/1000
0
300,000,
000
report of
Service
delivery
improved
OUTPUT4.2.2: Strengthen HRH management (focus on retention strategies
Hostel for doctors constructed 0 100%
of
constr
uction
works
Feasi
bility
study
10% 50% 80% 100% 100%
900,000,
000
Staff
Retention
improved
SECTOR: Sport and culture
PRIORITY AREA 3: Ensure quality healthy population
OUTCOME: Promotion of sports and culture
OUTPUT: Promote recreational, sports and culture activities
Number of Water Sport complex 0 1 feasib 20% 50% 70% 90% 100% 150,000, Report
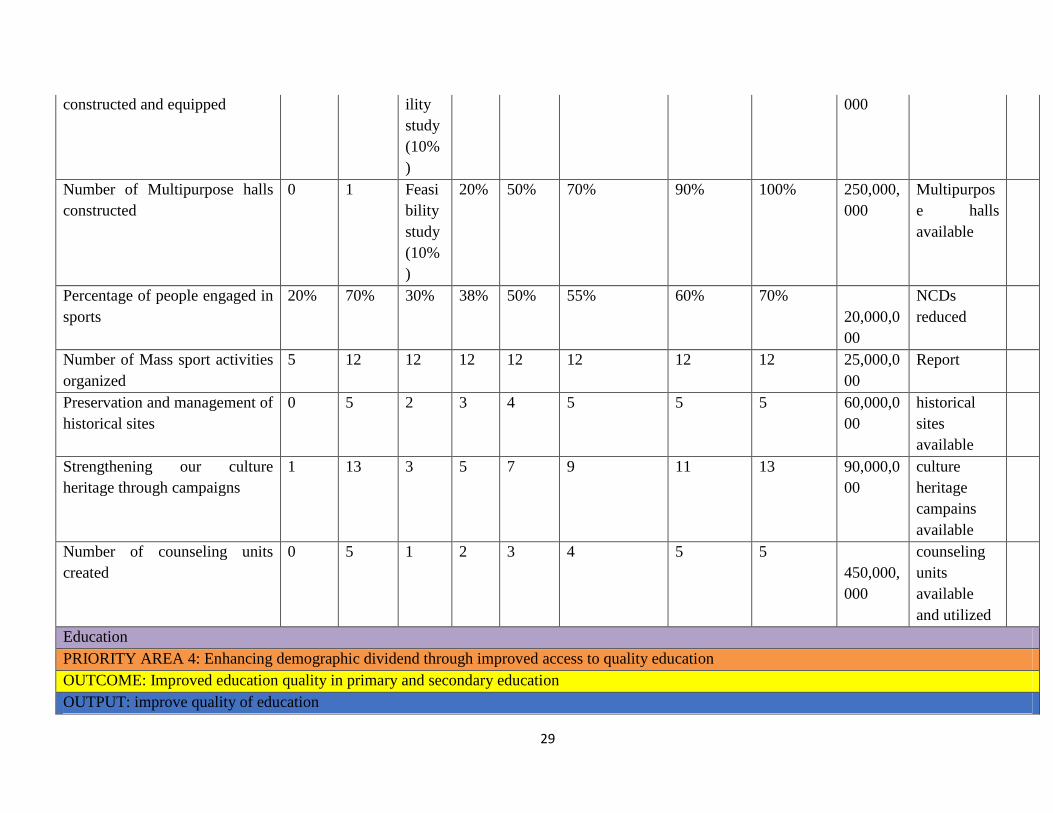
29
constructed and equipped ility
study
(10%
)
000
Number of Multipurpose halls
constructed
0 1 Feasi
bility
study
(10%
)
20% 50% 70% 90% 100% 250,000,
000
Multipurpos
e halls
available
Percentage of people engaged in
sports
20% 70% 30% 38% 50% 55% 60% 70%
20,000,0
00
NCDs
reduced
Number of Mass sport activities
organized
5 12 12 12 12 12 12 12 25,000,0
00
Report
Preservation and management of
historical sites
0 5 2 3 4 5 5 5 60,000,0
00
historical
sites
available
Strengthening our culture
heritage through campaigns
1 13 3 5 7 9 11 13 90,000,0
00
culture
heritage
campains
available
Number of counseling units
created
0 5 1 2 3 4 5 5
450,000,
000
counseling
units
available
and utilized
Education
PRIORITY AREA 4: Enhancing demographic dividend through improved access to quality education
OUTCOME: Improved education quality in primary and secondary education
OUTPUT: improve quality of education

30
Number of classrooms
constructed
3,076 34,24 33 43 53 63 73 83
3,480,00
0,000
Classrooms
available
Number of teacher's trainings
enhanced
5 96 11 13 15 17 19 21
384,000,
000
Trainings
done
Number of teachers 2156 2339 2189 2219 2249 2279 2309 2339
1,872,00
0,000
Teachers
available
Number of smart classrooms
established
8 20 10 12 14 16 18 20
192,000,
000
Classrooms
available
Number of laboratories
constructed
9 21 11 13 15 17 26 28
288,000,
000
Laboratories
available
Number of Talent Detection
Centers constructed
1 1 2,000,00
0,000
report
Percentage of student school
drop out
2.50% 1% 2% 2% 1.50% 1.50% 1% 1%
6,000,00
0
Report
OUTPUT: Increased pre-primary net enrollment to 45%
Number of ECDs constructed
and equipped
5 80 10 20 35 50 65 80
400,000,
000
ECD fully
equiped
available
OUTPUT: People with disabilities to be able to access education
Number of capacity building
conducted in favor of people
with disability
3 9 4 5 6 7 8 9
120,000,
000
Sessions
conducted
OUT PUT: Increase adult literacy
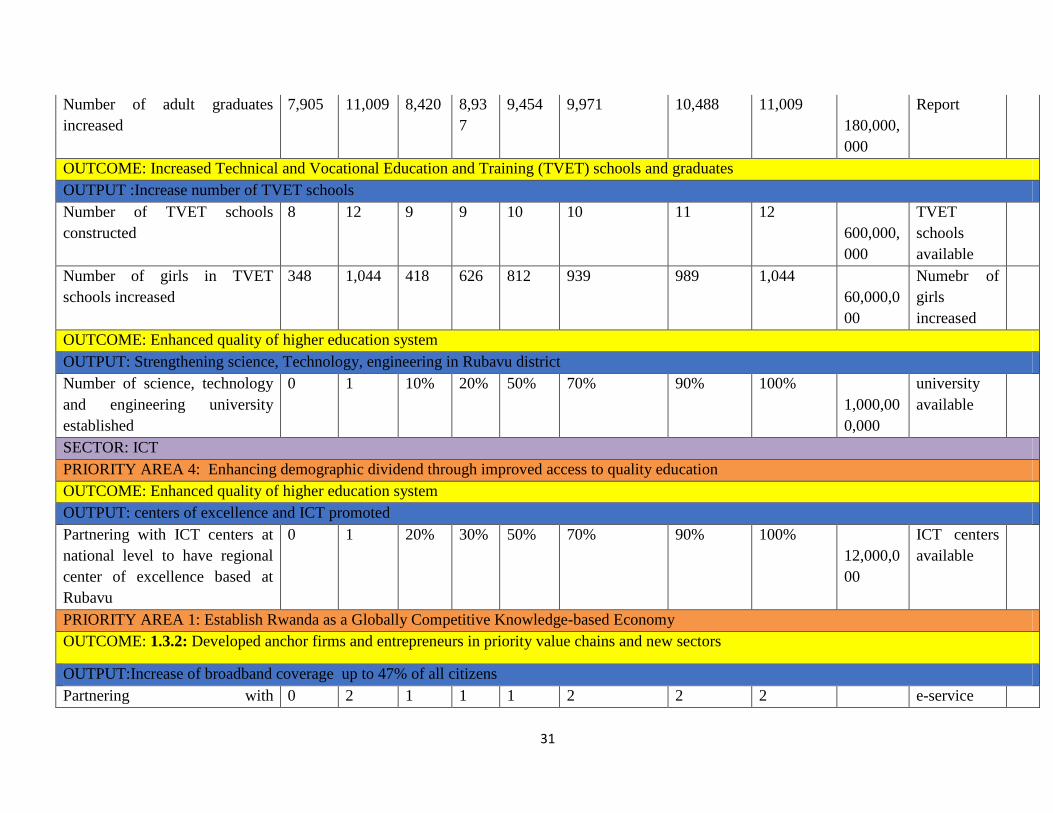
31
Number of adult graduates
increased
7,905 11,009 8,420 8,93
7
9,454 9,971 10,488 11,009
180,000,
000
Report
OUTCOME: Increased Technical and Vocational Education and Training (TVET) schools and graduates
OUTPUT :Increase number of TVET schools
Number of TVET schools
constructed
8 12 9 9 10 10 11 12
600,000,
000
TVET
schools
available
Number of girls in TVET
schools increased
348 1,044 418 626 812 939 989 1,044
60,000,0
00
Numebr of
girls
increased
OUTCOME: Enhanced quality of higher education system
OUTPUT: Strengthening science, Technology, engineering in Rubavu district
Number of science, technology
and engineering university
established
0 1 10% 20% 50% 70% 90% 100%
1,000,00
0,000
university
available
SECTOR: ICT
PRIORITY AREA 4: Enhancing demographic dividend through improved access to quality education
OUTCOME: Enhanced quality of higher education system
OUTPUT: centers of excellence and ICT promoted
Partnering with ICT centers at
national level to have regional
center of excellence based at
Rubavu
0 1 20% 30% 50% 70% 90% 100%
12,000,0
00
ICT centers
available
PRIORITY AREA 1: Establish Rwanda as a Globally Competitive Knowledge-based Economy
OUTCOME: 1.3.2: Developed anchor firms and entrepreneurs in priority value chains and new sectors
OUTPUT:Increase of broadband coverage up to 47% of all citizens
Partnering with 0 2 1 1 1 2 2 2 e-service
32
telecommunication companies
to increase the internet coverage
500,000,
000
improved
Number of ICT incubation
center constructed
0 2 1 1 2 2 2 2
1,400,00
0,000
Incubation
center
available
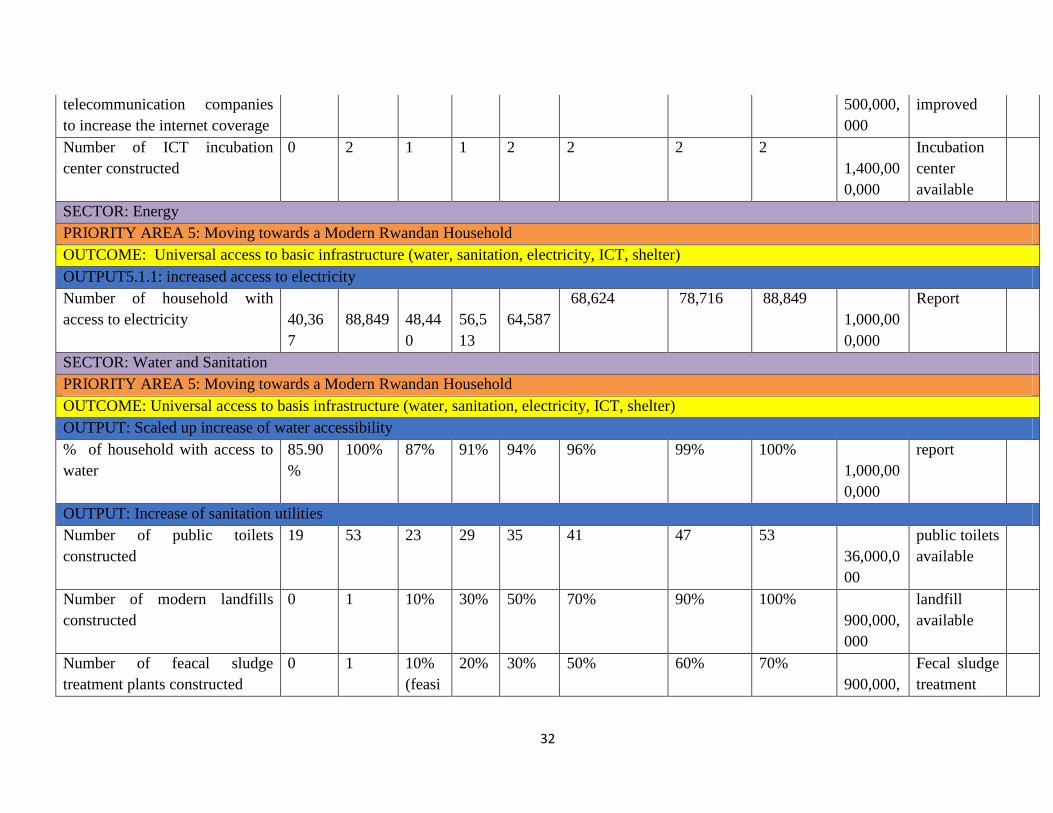
SECTOR: Energy
PRIORITY AREA 5: Moving towards a Modern Rwandan Household
OUTCOME: Universal access to basic infrastructure (water, sanitation, electricity, ICT, shelter)
OUTPUT5.1.1: increased access to electricity
Number of household with
access to electricity
40,36
7
88,849
48,44
0
56,5
13
64,587
68,624 78,716 88,849
1,000,00
0,000
Report
SECTOR: Water and Sanitation
PRIORITY AREA 5: Moving towards a Modern Rwandan Household
OUTCOME: Universal access to basis infrastructure (water, sanitation, electricity, ICT, shelter)
OUTPUT: Scaled up increase of water accessibility
% of household with access to
water
85.90
%
100% 87% 91% 94% 96% 99% 100%
1,000,00
0,000
report
OUTPUT: Increase of sanitation utilities
Number of public toilets
constructed
19 53 23 29 35 41 47 53
36,000,0
00
public toilets
available
Number of modern landfills
constructed
0 1 10% 30% 50% 70% 90% 100%
900,000,
000
landfill
available
Number of feacal sludge
treatment plants constructed
0 1 10%
(feasi
20% 30% 50% 60% 70%
900,000,
Fecal sludge
treatment

33
bility
study
)
000 plant
available
SECTOR: Urbanization and rural settlement
PRIORITY AREA 5: Moving towards a Modern Rwandan Household
OUTCOME: Increase of the population‟s quality of living
OUTPUT: Relocation of citizens living in High Risk Zone
Number of households relocated
from high risk zone
1538 2750 1755 1855 1955 2256 2455 2750
12,120,0
00,000
Report
OUTPUT: Facilitate Rubavu citizens to acquire affordable and decent housing
Number of IDP model villages
constructed
1 5 3 3 4 4 5 5
6,000,00
0,000
IDP model
village
available
OUTPUT5: Mainstreaming disaster risk reduction and management into all development sectors
Number of District projects with
Disaster mitigation measures
TRANSFORMATIONAL GOVERNANCE
GOAL/IMPACT: Transformational Governance that build on a capable, united, safe and Rwandan Values
INDICATOR BASE
LINE
DDS
Target
TAR
GET
TAR
GET
TARG
ET
TARGET TARGET TARGET
Estimate
d
MEANS OF
VERIFICA
TION
A
SS
U

34
Budget M
PT
IO
N
S
(2017/
18)
106 101 2020/2
1
2021/22 2022/23 2023/24
SECTOR: Sport and culture
PRIORITY AREA 1: Reinforce Rwandan culture and values as a foundation for peace and unity (NST1 priority area 3.1)
OUTCOME: Enhanced unity among Rwandans (NST1 outcome 3.1.1)
OUTPUT1.1.1: NDUMUNYARWANDA values reinforced
Number of
NDUMUNYARWANDA
sessions organized at all levels
within the District
667 4002 667 667 667 667 667 667
42,000,0
00
Reports
Number of Unity and
Reconciliation Forums
Established
13 598 80 106 103 103 103 103
20,000,0
00
Operational
clubs &
Monitoring
Reports
Number of ABARINZI
b'IGIHANGO trained and
rewarded
0 48 48 48 48 48 48 48
20,000,0
00
Number of
ABARINZI
B'IGIHANG
O Trained
and
rewarded
OUTPUT : Strengthening and Promoting Gender Equality
Number of Programs/projects
implemented considering
Gender Equality
5 42 6 6 7 7 8 8
2,000,00
0,000,00
Reports
35
0
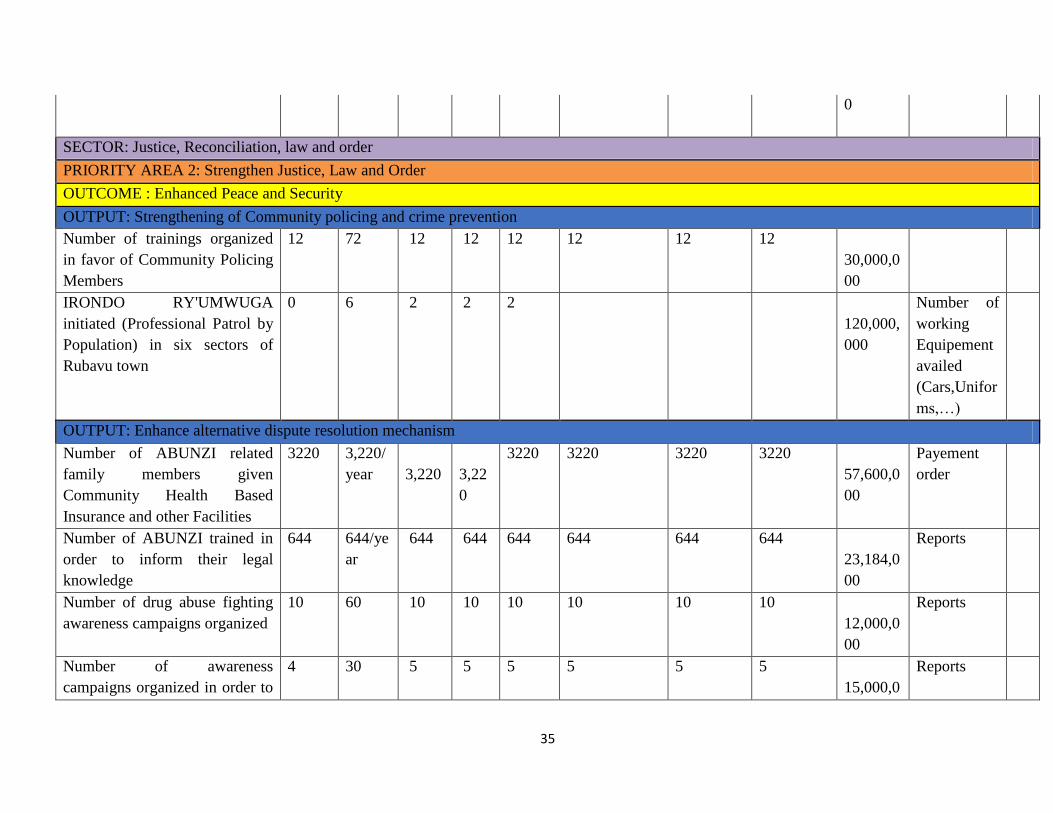
SECTOR: Justice, Reconciliation, law and order
PRIORITY AREA 2: Strengthen Justice, Law and Order
OUTCOME : Enhanced Peace and Security
OUTPUT: Strengthening of Community policing and crime prevention
Number of trainings organized
in favor of Community Policing
Members
12 72 12 12 12 12 12 12
30,000,0
00
IRONDO RY'UMWUGA
initiated (Professional Patrol by
Population) in six sectors of
Rubavu town
0 6 2 2 2
120,000,
000
Number of
working
Equipement
availed
(Cars,Unifor
ms,…)
OUTPUT: Enhance alternative dispute resolution mechanism
Number of ABUNZI related
family members given
Community Health Based
Insurance and other Facilities
3220 3,220/
year
3,220
3,22
0
3220 3220 3220 3220
57,600,0
00
Payement
order
Number of ABUNZI trained in
order to inform their legal
knowledge
644 644/ye
ar
644 644 644 644 644 644
23,184,0
00
Reports
Number of drug abuse fighting
awareness campaigns organized
10 60 10 10 10 10 10 10
12,000,0
00
Reports
Number of awareness
campaigns organized in order to
4 30 5 5 5 5 5 5
15,000,0
Reports

36
enhance crime prevention
among population
00
OUTPUT: Security organs working area improved
Number of Police Stations
Offices Constructed
6 6 1 1 1 1 1 1
300,000,
000
Police
Stations
Offices
Constructed
SECTOR: Governance and Decentralization
PRIORITY AREA 4: Ensure Safety and Security of citizens and property
OUTCOME: Sustained respect for human rights and civil liberties
OUTPUT Strengthening strategies to fight GBV and Child abuse
Number of initiatives conducted
to strengthen family cohesion
home grown
2 5 4 5 5 5 5 5 60,000,0
00
reports
Number of health care services
for GBV Victims established
1 1 1 1 1 1 1 1 100,000,
000
heelth care
for GBV
victims
available
Number of Rehabilitation
Centers constructed
0 1 1
300,000,
000
OUTPUT: To ensure orphans are raised in Families
Number of campaigns
conducted to create awareness
on Tubarere mu muryango
program
2 5 5 5 5 5 5 5 60,000,0
00
reports

37
OUTPUT: Intensified Mechanism to fight against Corruption at all levels
Number of anti-corruption clubs
created and trained
12 80 10 10 10 10 15 15
10,000,0
00
number of
anti
corruption
clubs
Number of organized awareness
campaigns to fight against
corruption
2 18 3 3 3 3 3 3
12,000,0
00
Reports
OUTPUT: Intensified mechanisms to fight against genocide ideology
Number of peace and unity
clubs established
54 80 20 20 12 12 12 4
10,000,0
00
operational
clubs
Number of UBUTORE
Development Center
Constructed
0 1 1
100,000,
000
UBUTORE
Developmen
t Center
Constructed
Governance and decentralization
PRIORITY AREA 5: Increase citizens‟ participation, engagement and partnerships in development
OUTCOME: Enhanced decentralization system
OUTPUT: Reinforce mechanisms at decentralized levels for citizens particularly women and youth to effectively contribute to districts planning and
prioritization.
Number of participatory
planning session organized
93 558 93 93 93 93 93 93
120,000,
000
Reports
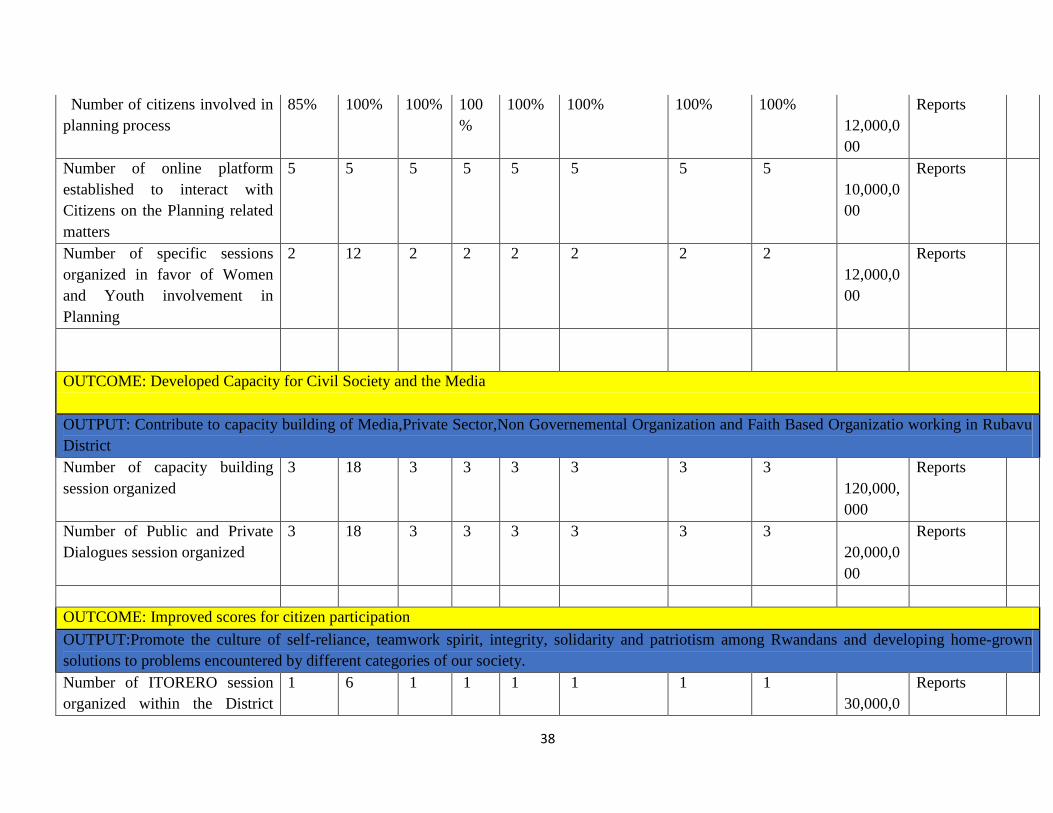
38
Number of citizens involved in
planning process
85% 100% 100% 100
%
100% 100% 100% 100%
12,000,0
00
Reports
Number of online platform
established to interact with
Citizens on the Planning related
matters
5 5 5 5 5 5 5 5
10,000,0
00
Reports
Number of specific sessions
organized in favor of Women
and Youth involvement in
Planning
2 12 2 2 2 2 2 2
12,000,0
00
Reports
OUTCOME: Developed Capacity for Civil Society and the Media
OUTPUT: Contribute to capacity building of Media,Private Sector,Non Governemental Organization and Faith Based Organizatio working in Rubavu
District
Number of capacity building
session organized
3 18 3 3 3 3 3 3
120,000,
000
Reports
Number of Public and Private
Dialogues session organized
3 18 3 3 3 3 3 3
20,000,0
00
Reports
OUTCOME: Improved scores for citizen participation
OUTPUT:Promote the culture of self-reliance, teamwork spirit, integrity, solidarity and patriotism among Rwandans and developing home-grown
solutions to problems encountered by different categories of our society.
Number of ITORERO session
organized within the District
1 6 1 1 1 1 1 1
30,000,0
Reports

39
(with focus in URUGERERO
RUCIYE INGANDO approach)
00
Number of people working in
voluntary framework
5,620 7,654
1,276
1,27
6
1,276 1,276 1,276 1,276 Reports
Number of Social Development
projects implemented within
Voluntary scheme
9 14 10 12 12 12 13 14 Reports
OUTPUT: Promote home-grown solutions to problems solving within different categories of our society.
Value for Umuganda
contribution to District Budget
620,0
00,00
0
990,00
0,000
690,0
00,00
0
730,
000,
000
800,00
0,000
880,000,000
930,000,0
00
990,000,0
00
30,000,0
00
Reports
SECTOR: Governance and Decentralization (Regional integration)
PRIORITY AREA 5: Strengthen Diplomatic and International Operation to accelerate Rwandan and African Development (NST1 priority area 3.3)
OUTCOME: Strive for Unity of Africans and Development of the Continent
3.3.1: Enhanced international profile and reputation of Rwanda (NST1 outcome 3.3.1)
OUTPUT: Enhance Good relationship with neighboring DRC City (Goma) and Other foreign Local Authorities
Number of meetings organized
with foreign Local Authorities
2 12 2 2 2 2 2 2
12,000,0
00
Reports
Public financial management
PRIORITY AREA 4: Strengthen Capacity, Service delivery and Accountability of public institutions
OUTCOME: Enhanced accountability and production across public institutions and online service delivery
OUTPUT:Enhance capacity and production for public institutions

40
Number of sector offices
constructed
10 2 1 1
300,000,
000
sector
offices
constucted
OUTPUT: Online service delivery reinforced
Percentage of Services delivered
online
85% 100% 1 1 80% 90% 100% 100%
100,000,
000
Services
delivered
online
OUTPUT: Project feasibility studies to be elaborated
Percentageof feasibility study
available for every project
100% 100% 100% 100
%
100% 100% 100% 100%
800,000,
000
Reports
OUTPUT: Strengthening functioning clusters
Number of capacity building
organized for JADF members
1 6 1 1 1 1 1 1
50,000,0
00
Reports
Number of stakeholders
dialogues organized
1 6 1 1 1 1 1 1
12,000,0
00
Reports
Output: Increase the Implementation of
Auditors recommendation
Percentage of audits
recommendation implemented
64% 100% 100% 100
%
100% 100% 100% 100%
12,000,0
00
Reports
Number of Financial Years
where the District got Clean
Audit opinion
0 6 1 1 1 1 1 1
20,000,0
00
Reports

41
OUTPUT: Increase District Own revenues
Amount of Own revenue
collected
2,002,
615,1
81
4,430,
771,88
2
2,303
,007,
458
2,64
8,45
8,57
7
3,045,
727,36
3
3,502,586,468
4,027,974,
438
4,430,771,
882
510,000,
000
Reports
OUTPUT : Enhanced Accountability at all stakeholders levels
Number of Public
Accountability days organized
2 12 2 2 2 2 2 2 30,000,000 Reports
Number of JADF Opens Days
organized
1 6 1 1 1 1 1 1 15,000,000 Reports