summary of safety and effectiveness data (ssed)pma p160017: fda summary of safety and effectiveness...
TRANSCRIPT

PMA P160017: FDA Summary of Safety and Effectiveness Data Page 1
SUMMARY OF SAFETY AND EFFECTIVENESS DATA (SSED) I. GENERAL INFORMATION
Device Generic Name: Automated Insulin Delivery System
Device Trade Name: MiniMed 670G System
Device Procode: OZP, Artificial pancreas device system, single hormonal control
Applicant’s Name and Address: Medtronic MiniMed, Inc. 18000 Devonshire Street Northridge, CA 91325
Date(s) of Panel Recommendation: None
Premarket Approval Application (PMA) Number: P160017
Date of FDA Notice of Approval: September 28, 2016
Priority Review: Granted priority review status on July 13, 2016 because the device is a novel technology and availability is in patients’ best interest.
II. INDICATIONS FOR USE
MiniMed 670G System The Medtronic MiniMed 670G system is intended for continuous delivery of basal insulin (at user selectable rates) and administration of insulin boluses (in user selectable amounts) for the management of Type 1 diabetes mellitus in persons, fourteen years of age and older, requiring insulin as well as for the continuous monitoring and trending of glucose levels in the fluid under the skin. The MiniMed 670G System includes SmartGuard technology, which can be programmed to automatically adjust delivery of basal insulin based on Continuous Glucose Monitor sensor glucose values, and can suspend delivery of insulin when the sensor glucose value falls below or is predicted to fall below predefined threshold values. The Medtronic MiniMed 670G System consists of the following devices: MiniMed 670G insulin pump, the Guardian Link (3) Transmitter, the Guardian Sensor (3), One-Press Serter, and the Contour NEXT Link 2.4 Glucose Meter. The system requires a prescription. The Guardian Sensor (3) glucose values are not intended to be used directly for making therapy adjustments, but rather to provide an indication of when a finger stick may be required. All therapy adjustments should be based on measurements obtained using a home glucose monitor and not on values provided by the Guardian Sensor (3). Guardian Sensor (3)

PMA P160017: FDA Summary of Safety and Effectiveness Data Page 2
The Guardian Sensor (3) is intended for use with the MiniMed 670G system to continuously monitor glucose levels in persons with diabetes. It is intended to be used for detecting trends and tracking patterns in persons aged fourteen years and older, and to be used by the MiniMed 670G system to automatically adjust basal insulin levels. It is indicated for use as an adjunctive device to complement, not replace, information obtained from standard blood glucose monitoring devices. The sensor is intended for single use and requires a prescription. The Guardian Sensor (3) is indicated for 7 days of continuous use. One-press Serter The One-press Serter is used as an aid for inserting the sensor. It is indicated for single-patient use and it is not intended for multiple-patient use. Guardian Link (3) Transmitter The Guardian Link (3) Transmitter is intended for use with the MiniMed 670G System. The Guardian Link (3) Transmitter powers the glucose sensor, collects and calculates sensor data, and wirelessly sends the data to the MiniMed 670G insulin pump. The Transmitter is intended for single-patient multi-use.
Contour NEXT Link 2.4 Glucose Meter The Contour Next Link 2.4 Wireless Blood Glucose Monitoring System is an over the counter (OTC) device utilized by persons with diabetes in home settings for the measurement of glucose in whole blood, and is for single patient use only and should not be shared. The Contour Next Link 2.4 wireless blood glucose monitoring system is indicated for use with fresh capillary whole blood samples drawn from the fingertip and palm only. The Contour NEXT Test Strips are intended for self-testing by persons with diabetes for the quantitative measurement of glucose in whole blood samples from 20 to 600 mg/dL. The Contour Next Link 2.4 wireless blood glucose monitoring system is intended to be used to transmit glucose values to the MiniMed 670G pump and facilitate transfer of information to Medtronic CareLink Software through the use of radio frequency communication. The Contour Next Link 2.4 Wireless Blood Glucose Monitoring System is not intended for the diagnosis of, or screening for, diabetes mellitus. It is not intended for use on neonates.
CONTRAINDICATIONS
A prominent boxed warning is included in the labeling regarding use of the device in subjects under the age of 7 years as follows: “Medtronic performed an evaluation of the 670G closed loop system and determined that it may not be safe for use in children under the age of 7 because of the way that the system is designed and the daily insulin requirements. Therefore this device should not be used in anyone under the age of 7 years old. This device should also not be used in patients who require less than a total daily insulin dose of 8 units per day because the device requires a minimum of 8 units per day to operate safely.” The following contraindications for this device are also described in the labeling:

PMA P160017: FDA Summary of Safety and Effectiveness Data Page 3
Insulin pump therapy is not recommended for people who are unwilling or unable to perform a minimum of four blood glucose tests per day. As insulin pumps use rapid acting insulin only, blood glucose testing is required to help identify rapid glycemic deterioration due to insulin infusion occlusion, infusion site problems, insulin stability issues, user error, or a combination of these.
Pump therapy is not recommended for people who are unwilling or unable to maintain contact with their healthcare professional.
Pump therapy is not recommended for people whose vision or hearing does not allow recognition of pump signals and alarms.
Do not use serter on products other than the Enlite Sensor (P120010) or Guardian Sensor (3). Medtronic cannot guarantee the safety or efficacy of this product if used with other products.
The reservoir is contraindicated for the infusion of blood or blood products. Infusion sets are indicated for subcutaneous use only and not for intravenous (IV)
infusion or the infusion of blood or blood products.
III. WARNINGS AND PRECAUTIONS
The warnings and precautions can be found in the 670G System User Guide labeling. IV. DEVICE DESCRIPTION
The MiniMed 670G system is comprised of the following devices: MiniMed 670G Pump (MMT-1780) The MiniMed 670G pump (model MMT-1780) is an ambulatory, battery operated, rate programmable micro infusion pump designed to deliver insulin from a reservoir. The reservoir is driven by a motor to deliver determined basal rate profiles and user selected bolus amounts of insulin into the subcutaneous tissue through an infusion set. The MiniMed 670G pump is offered in one model (MMT-1780). The pump houses electronics, a pumping mechanism, a user interface, and a medication reservoir within the same physical device. The reservoir is attached to a tube that connects to the user’s infusion site on their body. It is intended to deliver insulin through a diffusion mechanism. Model MMT-1780 is compatible with a 3.0 mL reservoir. The pump only displays blood glucose level units in mg/dL and cannot be reconfigured by the user. In addition to its delivery of insulin, the MiniMed 670G pump is designed to receive and display real-time interstitial fluid glucose values via the Guardian Link (3) Transmitter. When used in combination with Guardian Sensor (3), the transmitter sends sensor signals to the MiniMed 670G pump via radiofrequency (RF) telemetry. The 670G Pump has the following features and capabilities:
Provides predictive sensor glucose alerts when sensor glucose values are high or low (please see ‘Manual Mode’ section below for details).
Can receive blood glucose values from the Contour NEXT Link 2.4 Meter to use for sensor calibration.

PMA P160017: FDA Summary of Safety and Effectiveness Data Page 4
The pump can display Guardian sensor glucose values in real-time, and also store those values (and blood-glucose values from the meter) into its pump memory.
“SmartGuard” Technology: There are two levels of this technology; the first is available in Manual Mode and the second in Auto Mode.
o The first level of SmartGuard technology is available in Manual Mode: This technology automatically suspends insulin when the sensor
reaches a preset low limit (referred to as ‘Suspend on Low’) This technology automatically suspends insulin when the sensor
glucose value is predicted, using a proprietary predictive suspend algorithm, to reach a pre-set low limit, i.e., suspends before the low limit is reached (referred to as ‘Suspend before Low’).
When a Suspend event occurs, the user can choose to continue to keep insulin suspended, or the user can choose to resume insulin delivery.
Following a Suspend event, insulin delivery will automatically resume when the sensor glucose levels rise above the pre-set suspend threshold.
The ‘Suspend on low’ and ‘Suspend before low’ features are optional features available when the system is in Manual Mode.
This technology (in Manual Mode) provides a bolus calculator called the ‘Bolus Wizard’ that uses your settings to calculate an estimated bolus amount based on the meter blood glucose values and carbohydrates that the user enters. These settings should be set up with the help of a Health Care Practitioner before using the Bolus Wizard. Those settings include:
Carbohydrate Ratio Insulin Sensitivity Factor Blood Glucose Target Active Insulin Time
o The second level of SmartGuard technology is available in Auto Mode:
This technology automatically adjusts basal insulin delivery using continuous glucose monitor data, referred to as Auto Mode.
The Auto Mode feature can automatically increase or decrease the amount of insulin delivered based on sensor values.
During Auto mode operation, the user must manually deliver meal boluses that they calculate using the estimated amount of carbohydrates for meals at the time they are eaten. The user must also use the Auto Mode bolus feature to calculate boluses while in Auto Mode. The MiniMed 670G Insulin Pump is designed to receive and display real-time glucose values received from the Guardian Link transmitter. Guardian sensor signals are transmitted from the transmitter to the MiniMed 670G Insulin Pump via RF telemetry and converted into glucose concentrations based on calibration values from the Contour Next Link 2.4 meter. Signals are updated and transmitted to the pump every five minutes.

PMA P160017: FDA Summary of Safety and Effectiveness Data Page 5
The real time sensor glucose values, displayed by the MiniMed 670G Insulin Pump, are not intended to be used directly for making therapy adjustments. The user can use the tracking and trending of sensor glucose values to help determine if an unplanned finger stick measurement may be needed. In addition, sensor glucose values should not be used to modify insulin therapy. All manual insulin therapy adjustments should be based on measurements obtained using a blood glucose meter and not based on the sensor glucose value displayed by the MiniMed 670G Insulin Pump.
Manual Mode The user can set the pump to temporarily suspend insulin delivery automatically when the sensor glucose level is equal to or less than a selected threshold. The user has the capability to select a ‘Suspend on Low’ threshold within the 50 mg/dL to 90 mg/dL range. When the ‘Suspend on Low’ tool is set to ‘ON’, the system compares the sensor glucose value and the programmed Suspend threshold whenever the sensor glucose value is updated (every five minutes). If the sensor glucose value falls below the set threshold, insulin delivery will be suspended. Once the sensor glucose rises above that set threshold, insulin delivery will resume. The use of the ‘Suspend on Low’ tool is optional and the user can turn the tool ‘ON’ and ‘OFF’. The pump also includes the new Predictive Low Management tool that allows the user to set a glucose value threshold where the pump will suspend the insulin delivery if the blood glucose value is predicted to reach the selected threshold in the near future (‘Suspend before Low’). The user can set their low sensor glucose threshold value from 50 mg/dL to 90 mg/dL; insulin delivery will suspend when the sensor glucose value is predicted to reach or fall below a level that is 20 mg/dL above the set low limit threshold value within approximately 30 minutes. The user has the ability to program the length of time in which suspension will occur pending the blood glucose threshold 30 minutes before the threshold is reached. Once the sensor glucose rises above that set threshold, insulin delivery will resume. The use of the ‘Suspend on Low’ tool is optional and the user can turn the tool ‘ON’ and ‘OFF’. When the sensor glucose value is below or predicted to be below the set threshold, an alarm and siren occurs and the pump suspends, and the user may elect to continue the suspend, or cancel the temporary pump suspension of insulin delivery at any time. If the user does not respond to the ‘suspend on low’ or ‘suspend before low’ alarm or siren, the pump will automatically suspend for up to two hours. If the user cancels the suspension of insulin delivery, the system will continue to deliver insulin at the programmed basal rate until the next time the sensor glucose value is below the set threshold value. The alarm and siren will then re-sound, and the pump will suspend (unless canceled by the user). If the user responds to the alarm or siren by electing to accept the insulin suspension, the pump will suspend for at least 30 minutes and up to a maximum of 2 hours; the pump
PMA P160017: FDA Summary of Safety and Effectiveness Data Page 6
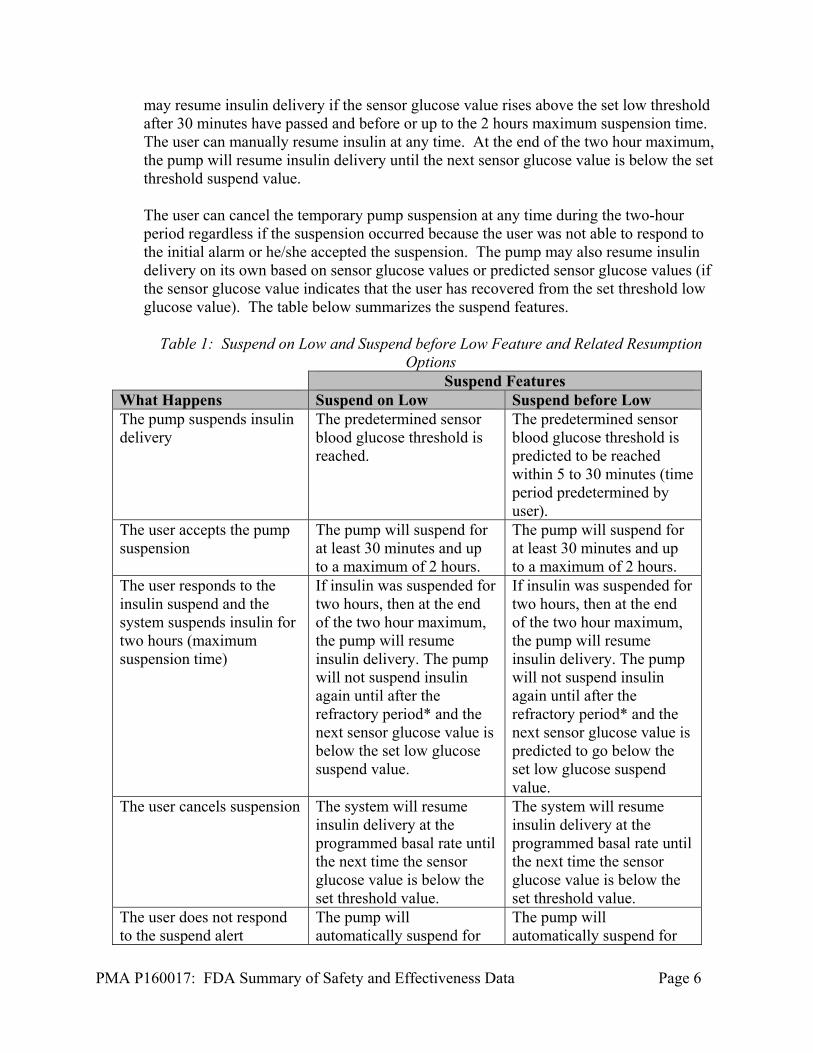
may resume insulin delivery if the sensor glucose value rises above the set low threshold after 30 minutes have passed and before or up to the 2 hours maximum suspension time. The user can manually resume insulin at any time. At the end of the two hour maximum, the pump will resume insulin delivery until the next sensor glucose value is below the set threshold suspend value. The user can cancel the temporary pump suspension at any time during the two-hour period regardless if the suspension occurred because the user was not able to respond to the initial alarm or he/she accepted the suspension. The pump may also resume insulin delivery on its own based on sensor glucose values or predicted sensor glucose values (if the sensor glucose value indicates that the user has recovered from the set threshold low glucose value). The table below summarizes the suspend features.
Table 1: Suspend on Low and Suspend before Low Feature and Related Resumption
Options Suspend Features What Happens Suspend on Low Suspend before Low The pump suspends insulin delivery
The predetermined sensor blood glucose threshold is reached.
The predetermined sensor blood glucose threshold is predicted to be reached within 5 to 30 minutes (time period predetermined by user).
The user accepts the pump suspension
The pump will suspend for at least 30 minutes and up to a maximum of 2 hours.
The pump will suspend for at least 30 minutes and up to a maximum of 2 hours.
The user responds to the insulin suspend and the system suspends insulin for two hours (maximum suspension time)
If insulin was suspended for two hours, then at the end of the two hour maximum, the pump will resume insulin delivery. The pump will not suspend insulin again until after the refractory period* and the next sensor glucose value is below the set low glucose suspend value.
If insulin was suspended for two hours, then at the end of the two hour maximum, the pump will resume insulin delivery. The pump will not suspend insulin again until after the refractory period* and the next sensor glucose value is predicted to go below the set low glucose suspend value.
The user cancels suspension The system will resume insulin delivery at the programmed basal rate until the next time the sensor glucose value is below the set threshold value.
The system will resume insulin delivery at the programmed basal rate until the next time the sensor glucose value is below the set threshold value.
The user does not respond to the suspend alert
The pump will automatically suspend for
The pump will automatically suspend for

PMA P160017: FDA Summary of Safety and Effectiveness Data Page 7
up to two hours if the sensor glucose does not detect that the users glucose values are or are predicted to go above the low glucose level
up to two hours if the sensor glucose does not detect that the users glucose values are or are predicted to go above the low glucose level
The sensor glucose detects a glucose value above the low glucose pre-set level
Pump may resume insulin delivery on its own after 30 minutes based on sensor glucose values glucose values.
Pump may resume insulin delivery on its own after 30 minutes based on sensor glucose values or predicted sensor glucose values.
* After a Suspend event occurs, there is a period of time when the suspend functionality is unavailable (refractory period). This time will vary depending on whether or not the user responds to the Suspend event. Please see the labeling for the MiniMed 670G System regarding how the suspend functions work. The user can manually suspend insulin delivery at any time. The MiniMed 670G Insulin Pump is capable of storing 90 days of pump history and glucose sensor data. The pump has a graphical display that the user can use to view the glucose history for the past 3, 6, 12 and 24 hours, high/low glucose alarms and display of retrospective glucose trend information. Stored pump history and glucose data can be downloaded to a personal computer for review and analysis, to track patterns and improve diabetes management. Data is downloaded from the pump to CareLink therapy management software.
The MiniMed 670G pump is compatible with commercially available Medtronic Paradigm infusion sets and their 3 mL volume reservoirs. It was not necessary to develop new infusion sets or reservoirs for use with this pump. Auto Mode The MiniMed 670G Insulin Pump contains an auto mode feature; this new tool uses an algorithm to automatically adjust basal insulin delivery using continuous glucose monitor data. When in Auto Mode, the pump responds to fluctuations in interstitial fluid glucose levels measured by the continuous glucose monitor; the Auto Mode feature can automatically increase or decrease the amount of basal insulin delivered based on sensor glucose values. Auto Mode does not administer meal boluses. During Auto mode operation, users must deliver meal boluses by entering the amount of insulin they want to deliver based on the estimated amount of carbohydrates they are eating. Failure to deliver meal boluses in association with meals during Auto mode operation can result in significant post meal hyperglycemia. The Auto Mode algorithm is designed to adjust the user’s basal insulin rates to try to keep them at a target blood glucose level. The standard target glucose setting in Auto Mode is

PMA P160017: FDA Summary of Safety and Effectiveness Data Page 8
120 mg/dL, and the target can also be set temporarily to 150 mg/dL for exercise and other events. In addition, blood glucose readings above 150 mg/dL will prompt the Auto Mode feature to calculate if a correction bolus is needed; if needed, a correction bolus will be recommended to the users, who can choose whether they want to deliver that correction bolus. Users should check their blood glucose levels using a blood glucose meter before administering a correction bolus. When first using the device, Auto Mode cannot be activated until the system completes a 48 hour warm-up period while the user uses the pump in manual mode to deliver insulin. In addition, before activation, the user must cancel any temporary basal rates, ensure delivery is not suspended, set a carbohydrate ratio, set high and low glucose settings, and enter a blood glucose value obtained by using a blood glucose meter if one has not been entered in the last 12 minutes. Carbohydrate ratios and high and low glucose settings should be discussed and established with the user’s healthcare practitioner before use of Auto Mode begins. There is an additional feature, called the safe basal feature which will be activated in Auto Mode when the system encounters specific issues that the user should address; the user cannot manually enable Safe Basal as it is a mandatory automatic feature that activates when the pump encounters these types of issues. This feature is designed to be a safety net when in Auto Mode. The pump will transition into Safe Basal if the system detects the user is getting too little or too much basal insulin, if the pump detects an issue with the sensor or a discrepancy between blood glucose meter and sensor glucose readings, or if the pump has not received sensor glucose values in over 5 minutes. When the pump encounters an issue, it transitions to safe basal; in safe basal, the pump supplements the user’s basal insulin needs by delivering a steady state basal rate, which allows the user time to perform the additional actions prompted by the pump that are required to ensure Auto Mode stays active. Safe Basal does not automatically adjust basal insulin and instead delivers a steady basal rate until the user has addressed the issue that triggered the pump to activate Safe Basal. After 90 minutes in Safe Basal, if the condition(s) that caused the pump to transition into Safe Basal have not been resolved, the pump will automatically exit Auto Mode and enter Manual Mode. If Auto Mode is active, then the ‘Suspend on Low’ and ‘Suspend before Low’ features from the ‘Manual Mode’ are unavailable and inactive. However, while in Auto Mode, basal insulin is adjusted by decreasing or suspending automatically based on continuous glucose monitor sensor values if the user is experiencing low glucose. The table below describes the available features and accessibility within each mode (Auto Mode and Manual Mode). Note that, although Safe Basal is not mentioned in the table below, it is only available in Auto Mode and cannot be activated by the user, as it is a mandatory automatic feature that activates when the pump encounters an issue that the user should address (see description above).
Table 2: Modes and Related Accessibility Mode Description When is it Active? Will I receive Alerts?

PMA P160017: FDA Summary of Safety and Effectiveness Data Page 9
Mode Description When is it Active? Will I receive Alerts? Manual Mode: Sensor Augmented Pump
This mode is when the device is functioning as a sensor and pump, but the device is not in Auto Mode and the insulin suspend features are not turned on.
This is the default mode and the user does not have to specifically turn this mode on.
There is a mandatory severe low alarm at 50 mg/dL; The user can also set optional high and low alerts to sound on or before set sensor glucose levels.
Manual Mode: Suspend On Low
When this feature is active the device detects that your sensor glucose level has reached a pre-set sensor glucose value and it automatically suspends basal insulin delivery when that value is reached.
The user has to turn this feature on. It is not available when Auto Mode is turned on, and it cannot be turned on if suspend before low is turned on.
There is a mandatory severe low alarm at 50 mg/dL and at the pre-set low level. The user can also set optional high alerts to sound on or before set sensor glucose levels, and an optional alert before low alert.
Manual Mode: Suspend Before Low
When this feature is active the device detects when your sensor glucose is predicted to reach a pre-set value and it automatically suspends basal insulin delivery before that value is reached.
The user has to turn this feature on. It is not available when Auto Mode is turned on, and it cannot be turned on if suspend before low is turned on.
There is a mandatory severe low alarm at 50 mg/dL and at the pre-set low level. The user can also set optional high alerts to sound on or before set sensor glucose levels, and an optional alarm before low alert.
Auto Mode When this mode is active, the device can automatically adjust basal insulin by increasing, decreasing, or turning off basal insulin delivery based on sensor glucose levels.
The user has to turn this mode on and certain pre-defined conditions have to be met.
There is a mandatory severe low alarm at 50 mg/dL; The user can also set optional high and low alerts to sound on or before set sensor glucose levels.
Guardian Link Transmitter System (MMT-7811) The Guardian Link Transmitter System consists of the Guardian Link Transmitter (MMT-7811), the Charger (model MMT-7715), and the Tester (model MMT-7736). The Guardian Link Transmitter interfaces directly with the glucose-sensor assembly. The Guardian Link Transmitter provides power to the glucose sensor, and measures the sensor signal current from the glucose sensor. The sensor signal current is an electrical current level that is proportional to the glucose level in the user’s subcutaneous interstitial fluid. The sensor signal current is converted to a digital signal, which is filtered to reduce noise artifacts. This digital signal is sent to the MiniMed 670G pump every 5 minutes, using radio frequency (RF). Guardian Sensor (MMT-7020)

PMA P160017: FDA Summary of Safety and Effectiveness Data Page 10
The Guardian Sensor is a sterile, single-use, single patient glucose sensing component for continuous monitoring of glucose levels in the user’s interstitial fluid, when inserted in the user’s abdomen for up to seven days. The Sensor is inserted into the subcutaneous tissue using the One-Press Serter and is taped to the user’s skin. It connects to the Guardian Link Transmitter, which in turn communicates with the MiniMed 670G Pump. When making treatment decisions, such as determining insulin dose for meals, the 670G continuous glucose monitor (CGM) values should not be used, as they are not intended to be used to make such treatment decisions. The 670G continuous glucose monitor does not replace a blood glucose meter. Users should always use the values from a blood glucose meter for treatment decisions. Blood glucose values may differ from sensor glucose values. Using the sensor glucose readings for treatment decisions could lead to unwanted high or low blood glucose. Users should calibrate the Guardian Sensor at least every 12 hours using meter blood glucose values. Calibration is necessary for sensor function, and more frequent calibration can help to increase the accuracy of the sensor. The system requires a minimum of two calibrations per day, and four calibrations per day are recommended. The system is contraindicated for patients unwilling or unable to do frequent blood glucose meter measurements. If the user obtains blood glucose values using the Contour Next Link 2.4 Meter, the user may transmit blood glucose values via Bluetooth to the 670G pump to be used for sensor calibrations. If the user uses a different FDA cleared blood glucose meter to calibrate the Guardian Sensor, the user must manually input the blood glucose values into the pump to be used for sensor calibration. Additionally, users who use the Contour Next Link 2.4 should calibrate with values obtain using fingersticks; users should not use readings obtained from blood from alternative sites (e.g., palm). One-Press Serter The One-Press serter is a sensor insertion device which aids the user in inserting the Guardian Sensor. The serter was also previously reviewed and approved under P120010/S070. The user must use the One-Press Serter in order to insert the Guardian Sensor. Contour Next Link 2.4 Meter (MMT-1352 and MMT-1152) and Test strips The Contour Next Link 2.4 Meter can be used with the 670G system; the meter wirelessly sends blood glucose values to the insulin pump for sensor calibration via Bluetooth. The meter was also previously cleared under k110894. Specifications and performance requirements were established for the meter and evaluated as part of the class III 670G System. The sponsor verified and validated the specifications and performance requirements of the meter for the 670G System. The sponsor provided blood glucose meter specifications, rationale for requirements for the meter, and impact of error on the sensor, predictive low alerts, threshold glucose suspend, and the predictive low glucose management and hybrid closed loop features in the current submission. The sponsor carried out error impact analysis in order to determine the lot release criteria for

PMA P160017: FDA Summary of Safety and Effectiveness Data Page 11
the meter test strips. Based on the information provided, the meter specifications meet the clinical needs of the 670G system.
Additional System Accessories The following additional accessory devices are compatible with the 670G Insulin Pump:
Table 3: Accessory Devices Device Model
Reservoirs and Infusion Sets Model Numbers MiniMed Quick Set Infusion Set MMT-386, MMT-387, MMT-394, MMT-396, MMT-397,
MMT-398, MMT-399 MiniMed Silhouette Infusion Set MMT-368, MMT-369, MMT-370, MMT-377, MMT-378,
MMT-381, MMT-382, MMT-383, MMT-384
MiniMed Mio Infusion Set MMT-921, MMT-923, MMT-925, MMT-941, MMT-943, MMT-945, MMT-965, MMT-975
MiniMed Sure-T Infusion Set MMT-862, MMT-864, MMT-866, MMT-874, MMT-876, MMT-886
Paradigm Reservoir MMT-332A Optional Devices Model Numbers CareLink USB 2.4 MMT-7306
CareLink Online (Personal) MMT-7333 CareLink Pro MMT-7335
V. ALTERNATIVE PRACTICES AND PROCEDURES
Control of diabetes can be achieved through a combination of various behaviors and methods. Self-behaviors include healthy eating, taking the clinically indicated medications, and being active. Persons with diabetes may also administer insulin by injection or using other insulin infusion pumps as prescribed by their physician. An insulin pump is an alternative to multiple daily insulin injections (via insulin syringe or an insulin pen). Periodic self-glucose monitoring using home use blood glucose meters provides information regarding variations in glucose levels. Methods of monitoring glycemic control include periodic measurement of Hemoglobin A1c (HbA1c) which reflects blood glucose control over a three month period. Self-monitoring of blood glucose using glucose meters and test strips provides quantitative measurements of blood glucose at a single point in time for users and their healthcare providers. This helps to monitor the effectiveness of glycemic control, as well as make more immediate treatment modifications. Currently, cleared or approved insulin infusion pumps may be used for continuous subcutaneous insulin infusion. Additionally, commercially available sensor-augmented insulin infusion pumps or continuous glucose monitoring systems may be used to record

PMA P160017: FDA Summary of Safety and Effectiveness Data Page 12
continuous interstitial glucose information and provide real-time hypoglycemia and hyperglycemia alerts. Each alternative method for monitoring glycemic control has its own advantages and disadvantages. A user should fully discuss these alternatives with his/her physician to select the method that best meets expectations and lifestyle.
VI. MARKETING HISTORY
The 670G System has not been marketed in the United States or any foreign country. The insulin reservoirs and infusion sets used with the 670G System are the same as those currently used with the MiniMed 530G System (P120010). These devices have not been withdrawn from commercial distribution for any reason, related to either safety or effectiveness.
VII. POTENTIAL ADVERSE EFFECTS OF THE DEVICE ON HEALTH
Potential device-related serious adverse events include Diabetic ketoacidosis (DKA) resulting from high blood glucose due to suspension
of insulin delivery or inadequate insulin delivery (which may result from catheter occlusion, hardware or software malfunction, erroneous CGM readings in Auto Mode or suspend mode, or inadequate insulin dosing).
Severe hypoglycemia resulting from over-delivery of insulin (which can result from hardware or software malfunction, erroneous CGM readings in Auto Mode, or erroneous insulin dosing), which may lead to seizure, unconsciousness, and rarely death.
Potential device related non serious events include: Skin irritation or redness Infection Pain or discomfort Bruising Edema Rash Bleeding Induration of skin Allergic reaction to adhesives
Sensor breakage with fragments retained under the skin is a potential adverse event related to use of the CGM component of the 670G system, but this was not observed during these studies. Based on postmarket experience with similar devices and the results observed in these clinical studies, the occurrence and severity of these events is low. Infection at the insulin pump infusion set insertion site and sensor insertion site is a potential complication related to insertion of the CGM or the insulin pump infusion set.

PMA P160017: FDA Summary of Safety and Effectiveness Data Page 13
Based on post-market experience with similar devices, and the results observed in these clinical studies, the occurrence and severity of these events are not expected to be different from other approved infusion sets and CGM devices. Use of insulin pumps are known to carry an increased risk of DKA. However, FDA has received information indicating some patients are willing to accept an increased risk of DKA or ketosis and hyperglycemia (severe hyperglycemia) because of the benefits of pump use (see also Section XII below). Like other insulin pumps, there is an inherent risk that users of the device who do not use the 670G device as intended could harm themselves. Therefore, the device is for prescription use only and contraindicated for people unwilling or unable to perform a minimum of four fingerstick blood glucose meter tests per day and for people unwilling or unable to maintain contact with their healthcare professional. As demonstrated under P120010/S046 for the MiniMed 530G System (which has the same ‘suspend on low’ feature, where the insulin delivery will suspend for two hours after the low glucose threshold has been reached), two hour suspension of insulin delivery is unlikely to lead to clinically significant ketosis or ketoacidosis even if the pump inappropriately suspends when the blood sugar is normal or elevated, and should respond to insulin therapy and hydration within a few hours. . There is a theoretical risk of insulin over-delivery due to device malfunction which has a risk of leading to severe hypoglycemia due to malfunction of the 670G System. This event did not occur during the pivotal study or the continuation phase of the pivotal study. If insulin over-delivery were to occur, there are several mechanisms in place designed to help detect and mitigate the risk of impending and/or current hypoglycemia, including the presence of alarms/alerts and the suspension/reduction of insulin delivery. There is a theoretical risk of insulin under-delivery (due to a hardware or software malfunction) which may lead to severe hyperglycemia or DKA due to malfunction of the 670G system. This event did not occur during the pivotal study or the continuation phase of the pivotal study. If insulin under-delivery were to occur, there are mechanisms in place to help detect impending and/or current hyperglycemia, including the presence of alerts and alarms. The consequences of falsely high glucose reading on the continuous glucose monitor would be potential over-delivery of insulin via automated insulin delivery and missed low glucose suspensions and alerts/alarms, which have the potential to lead to severe hypoglycemia. The consequences of falsely low glucose reading on the continuous glucose monitor would be potential under-delivery of insulin and missed high glucose alerts, which have the potential to lead to severe hyperglycemia or DKA.
VIII. SUMMARY OF NONCLINICAL STUDIES
A. Laboratory Studies

PMA P160017: FDA Summary of Safety and Effectiveness Data Page 14
Pre–clinical testing was performed on the Guardian Link Transmitter, and the Guardian Sensor. Pre-clinical testing of the MiniMed 630G pump hardware supports safe use of the 670G pump, as the two pumps contain identical hardware. Please see the SSED for P150001 for descriptions of the pre-clinical testing of the MiniMed 630G pump. The Next Link 2.4 Blood Glucose Monitoring System was previously cleared as a stand-alone blood glucose test system under k110894. For approval as part of the MiniMed 670G System, Next Link 2.4 Blood Glucose Monitoring System analytical performance information was referenced from k110894, and that analytical performance was determined to be adequate to support approval. A description of meter performance can be found in the Decision Summary in the FDA public 510(k) database; http://www.accessdata.fda.gov/cdrh_docs/reviews/K110894.pdf Pre-clinical testing of the serter was reviewed and approved under P120010/S070. Guardian Link (3) Transmitter (MMT-7811) Twenty-nine Guardian Link transmitters (MMT-7811) were subjected to the following functional and environmental tests to ensure that these devices will continue to function normally when exposed to extreme environmental conditions.
Table 4: Transmitter Functional and Environmental Tests
Test Purpose Acceptance Criteria
Chemical Compatibility
Demonstrate the ability of various components to withstand exposure to the following chemicals for between 45 seconds – 1 minute: U100 Insulin (Humalog or Novolog), a solution of 1 part dish detergent to 9 parts water, 70% Isopropyl Alcohol.
No cracks, crazing, dissolving or discoloration to the transmitter surface.
Environmental storage conditions
Transmitters withstand -25 to 55ºC, 10-100% relative humidity.
No visible degradation. When connected to a simulated sensor, signal current shall be 53.5 nA ±10%. When leak tested, leak rate shall be <0.40 mbar.
Temperature shock test
Transmitters demonstrate reliable performance after 10 cycles from -5 to 45 ºC with 5 minute ramp time and 30 minute dwell time at each plateau.
No visible degradation, and signal current when connected to a simulated sensor must be 53.5 nA ±10%. When leak tested, leak rate shall be <0.40 mbar.
Operating environment conditions
Transmitters demonstrate the ability to operate with temperature of -5-45 ºC, 95% relative humidity, 8.9-15.4 psiA
No visible degradation, and shall have a signal current of 53.5 nA ±10%.

PMA P160017: FDA Summary of Safety and Effectiveness Data Page 15
Test Purpose Acceptance Criteria
Random vibration test per EN 60601-2-24
Transmitters demonstrate reliable operation after exposure to 10-100 Hz @ (1 m/s2)2/Hz, 100-200 Hz @ -3dB/octave, and 200-2000 Hz @ 0.5 (m/s2)2/Hz for 30 minutes in each axis.
No visible degradation, and signal current when attached to simulated sensor is 53.5 nA ±10%.
Drop test per EN 60601-2-24
Demonstrate safe operation after six repeated 1 meter drops onto 50 mm thick hardwood – one drop for each of 6 device faces or axes (±X, Y, Z)
No visible degradation, and signal current when attached to simulated sensor is 53.5 nA ±10%.
Push test per EN 60601-1
Demonstrate that transmitters maintain performance after exposure to applied force.
When subjected to a steady force of 56 lbf ±2.25 lbf, the transmitter shows no sign of distortion or damage.
Mechanical Shock per IEC 60601-1-11
Demonstrate reliable transmitter operation after exposure to 150 m/s2 (15g) acceleration, with three shocks per axis in each direction (±X, Y, Z) for a total of 18 shocks.
Transmitters show no visible degradation, and signal current when attached to simulated sensor is 53.5 nA ±10%.
Impact Test per IEC 60601-1
Demonstrate ability of transmitter to withstand an impact from a 500g steel ball with approximate diameter of 50mm dropped from a height of 1.3m
Transmitter must not introduce a safety hazard to the user or other persons in the surroundings.
Connector insertion force
Demonstrate force required to connect battery charger and sensor to transmitter is less than 3 pounds.
Insertion force is less than 3 pounds.
Connector retention force
Demonstrate force required to retain battery charger to transmitter is greater than 0.5 pounds and less than 3 pounds.
Charger retention force is greater than 0.5 pounds and less than 3 pounds.
Connector cycling Demonstrate that the transmitter can withstand 244 insertion/removal cycles with both the battery charger and the sensor.
Transmitters show no visible degradation, and signal current when attached to simulated sensor is 53.5 nA ±10%.
Mold stress relief per EN 60601-1
Demonstrate that after release of any internal stresses due to the plastic molding process, the transmitter maintains basic safety.
After exposure to 70ºC for 7 hours, transmitters are returned to room temperature and tested for basic safety. Transmitter shall not show visible damage or distortion.

PMA P160017: FDA Summary of Safety and Effectiveness Data Page 16
Test Purpose Acceptance Criteria
Fluid ingress per IPX8 (International Protection)
Demonstrate reliable operation of the transmitter when submerged to a depth of 8ft for 30 minutes.
Visual inspection of transmitter shall show no water ingress. Sensor signal shall be 2.35-2.65 nA in the 2.5 nA range, 24.25-25.75 nA in the 25 nA range, and 145.5-154.5 nA in the 150 nA range.
Protection against solid foreign objects per IP48
Demonstrate that the full diameter of 1.0mm spherical probe cannot pass through any opening of the transmitter.
The full diameter of a 1.0mm spherical probe cannot pass through any opening of the transmitter.
All protocols, test reports, and acceptance criteria have been reviewed and found to be acceptable. All transmitter devices met all pre-determined acceptance criteria during this testing.
Guardian Sensor (MMT-7020)
Thirty Guardian Sensors (MMT-7020) were subjected to the following functional and environmental testing after sterilization and 365 day accelerated aging:
Table 5: Sensor Functional and Environmental Tests
Test Purpose Acceptance Criteria Extraction Force To test the force required to
extract the needle after insertion.
The extraction force (along the needle axis) required to extract the needle hub from the sensor base shall not exceed 1 LbF
Patch Pull Test To test the force required to break the bond between the sensor patch and the sensor
base
Either an applied force exceeding 2.5 LbF shall be required to separate the adhesive bonds on the patch from the sensor base or the patch material shall fail before any adhesive bond.
Sensor Pull Test To test mechanical integrity of the senor/tube assembly
An applied force exceeding 0.13 LbF shall be required to break the sensor from the sensor base
Sensor Connection Force Test
To test the force required to connect the sensor to the compatible transmitter
The sensor shall require a connection force of no more than 4.8 pounds when connecting to the

PMA P160017: FDA Summary of Safety and Effectiveness Data Page 17
transmitter/recorder Contact Pad Continuity Test
To test the resiliency of the senor contact pads after
multiple connect/disconnect cycles
Each contact pad shall have a resistance of less than 10 Ohms after 6 insertion cycles with the transmitter/ recorder connector
Latching Force Test
To test that the connection to the transmitter is robust
An applied force exceeding 1 Lbf shall be required to separate the transmitter from the sensor base
Water Tightness Test
To test the ability of the connection between the
sensor and the transmitter to prevent water from entering
the transmitter bore
The connection between the sensor and the transmitter shall be fluid tight and meet the IPX8 requirements of IEC60529 Section 14 (submersion of 8 feet for 30 minutes)
SynDaver Insertion Test
To test the overall mechanical functionality of the device in
a representative use-case scenario
The sensor shall neither kink nor show signs of damage upon insertion into a representative human tissue; and the needle hub shall shield the needle after removal from the sensor base
Accuracy Test To test that the sensor output is within the system required
limits at the extent of the glucose ranges (40 mg/dL and
400 mg/dL)
The sensor shall be capable of achieving a calibration ratio (glucose-to-sensor current ratio) between 1.5 to 15 mg/dL/nA, inclusive, within the operating range of the sensor. 90% of the individual glucose concentration values must fall within the calibration range for both 40 and 400 mg/dL solutions.
Linearity Test To test that sensors show a linear response when glucose
levels are driven from 40 mg/dL to 400 mg/dL in a
stepwise manner
The sensor shall operate with a measured linearity of at least 0.90 (R2) within the operating range of the sensor
Response Time Test
To test that the senor responds adequately to sudden changes
in glucose concentrations
The in-vitro signal (current) shall reach 95% of the average stead-state value 15 after a glucose concentration step change. The glucose

PMA P160017: FDA Summary of Safety and Effectiveness Data Page 18
concentration shall change from 100 ± 10 mg/dL to 200 ± 20 mg/dL in a buffered saline test solution at a temperature of 37⁰C ± 1⁰C
Sensor Stability Test
To test that the sensor’s signal remains stable throughout the
wear period
The change in in-vitro signal (current) measured at 100 mg/dL glucose shall be less than 20% for each 24 hour period of 170 hour run
Operating Temperature Test
To test that the sensor’s signal remains stable when subject
to changes in external temperature during the wear
period
The sensor shall operate within a temperature range of 32 to 40⁰C (inclusive) with an in-vitro signal (current) change of less than a 3% change in ⁰C
Oxygen Effect Test
To test the sensor’s response to variation in oxygen concentration of the
surrounding environment
The sensor shall operate during a switch in oxygen concentration from 5% to 1% (inclusive) in 200 mg/dL solution with less than a 20% in-vitro signal (current) decrease or 30% in-vitro signal (current) increase. This is equivalent to a less than 0.66% per mm Hg oxygen reduction in signal or 1% mm Hg increase in signal
Ascorbic Acid Test
To test the sensor’s response to the introduction of ascorbic
acid in the surrounding environment
The change in in-vitro signal (current) caused by 0.1 mg/dL of ascorbic acid shall be less than 40% at 40 mg/dL
Acetaminophen Test
To test the sensor’s response to the introduction of acetaminophen in the
surrounding environment.
The change in in-vitro signal (current) caused by 0.1 mg/dL of acetaminophen shall be less than 40% at 40 mg/dL
Expiration dating for the Sensor component of this device has been established and approved at 12 months at storage conditions between 36ºF to 81ºF. The protocol and data for recommended storage and expiration date were reviewed and found to be acceptable.

PMA P160017: FDA Summary of Safety and Effectiveness Data Page 19
All protocols, test reports and acceptance criteria have been reviewed and found to be acceptable. All sensor devices met all pre-determined acceptance criteria during this testing.
The MiniMed 670G System with all components operating together, including the Guardian Sensor (3), Guardian Link (3) Transmitter, and Contour NEXT LINK 2.4 meter (MMT-1152 and MMT-1352), was subjected to the following functional and environmental tests to ensure that these devices will continue to function normally when exposed to extreme environmental conditions:
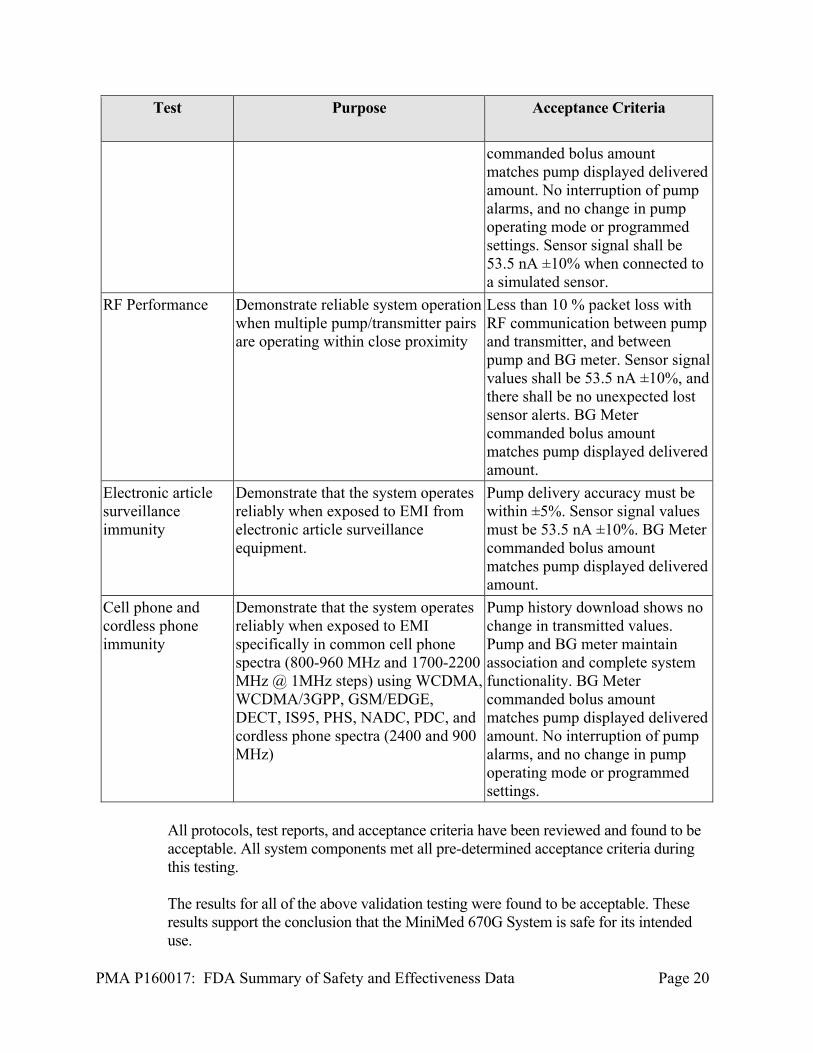
Table 6: System Functional and Environmental Tests
Test Purpose Acceptance Criteria
EMC/EMI Testing per EN 60601-1-2:2007
Demonstrate ability of the system to operate in environments with EMI which meet the standard of EN 60601-1-2:2007
Maintain basic safety and essential performance during exposure to EMI – delivery accuracy must be within ±5%. BG Meter commanded bolus amount matches pump displayed delivered amount.
Wireless Coexistence
Demonstrate ability of system to withstand expected levels of wireless transmission from other sources
Maintain basic safety and essential performance during exposure to wireless transmission sources – delivery accuracy must be within ±5%.
FCC and Avionics Demonstrate compatibility with FCC regulation
Emitted levels must be per FCC CFR 47 Part 15.247. It is acceptable that the pump pay lose RF communication with the transmitter. In this case the pump will alarm “Lost Sensor” to notify the user. Pump operating mode shall not be affected. BG Meter commanded bolus amount matches pump displayed delivered amount. No interruption of pump alarms, and no change in pump operating mode or programmed settings.
X-ray Immunity Demonstrate reliable operation when exposed to x-ray – 100kV, 100 uA exposure for 2 minutes
Pump history download shows no change in transmitted values. Pump and BG meter maintain association and complete system functionality. BG Meter
PMA P160017: FDA Summary of Safety and Effectiveness Data Page 20
Test Purpose Acceptance Criteria
commanded bolus amount matches pump displayed delivered amount. No interruption of pump alarms, and no change in pump operating mode or programmed settings. Sensor signal shall be 53.5 nA ±10% when connected to a simulated sensor.
RF Performance Demonstrate reliable system operation when multiple pump/transmitter pairs are operating within close proximity
Less than 10 % packet loss with RF communication between pump and transmitter, and between pump and BG meter. Sensor signal values shall be 53.5 nA ±10%, and there shall be no unexpected lost sensor alerts. BG Meter commanded bolus amount matches pump displayed delivered amount.
Electronic article surveillance immunity
Demonstrate that the system operates reliably when exposed to EMI from electronic article surveillance equipment.
Pump delivery accuracy must be within ±5%. Sensor signal values must be 53.5 nA ±10%. BG Meter commanded bolus amount matches pump displayed delivered amount.
Cell phone and cordless phone immunity
Demonstrate that the system operates reliably when exposed to EMI specifically in common cell phone spectra (800-960 MHz and 1700-2200 MHz @ 1MHz steps) using WCDMA, WCDMA/3GPP, GSM/EDGE, DECT, IS95, PHS, NADC, PDC, and cordless phone spectra (2400 and 900 MHz)
Pump history download shows no change in transmitted values. Pump and BG meter maintain association and complete system functionality. BG Meter commanded bolus amount matches pump displayed delivered amount. No interruption of pump alarms, and no change in pump operating mode or programmed settings.
All protocols, test reports, and acceptance criteria have been reviewed and found to be acceptable. All system components met all pre-determined acceptance criteria during this testing.
The results for all of the above validation testing were found to be acceptable. These results support the conclusion that the MiniMed 670G System is safe for its intended use.

PMA P160017: FDA Summary of Safety and Effectiveness Data Page 21
Biocompatibility Testing Biocompatibility testing for the sensor components of the Guardian Sensor (Patch, tube and circuits) was performed in accordance with the recommendations of ISO 10993-1, Biological Evaluation of Medical Devices-Part 1: Evaluation and Testing. The results of these tests are listed in the Table below.
Table 7: Biocompatibility Testing Summary
Test Testing Summary Cytotoxicity Pass-Non-cytotoxic Irritation Pass-Non-irritating Sensitization Pass-Non-sensitizing Systemic Toxicity (Acute) Pass-Non-Toxic Repeated (Sub-Acute) Toxicity
Pass-Non-Toxic
Genotoxicity: Bacterial Reverse Mutation
Pass-Non-genotoxic
Implantation (12 weeks) Pass
Material mediated pyrogenicity and hemolysis testing were leveraged from P120010, as the materials that comprise the Guardian sensor are the same as the materials that comprise the Enlite sensor. Please see the SSED for P120010 for additional details on testing for these materials. Sterility The method employed for the sterilization of the Guardian Sensor is Electron Beam Sterilization. The sterilization process used to sterilize the sensor was validated according to the ISO 11137 Sterilization of Health Care Products – Radiation standard. All sterilized components met the standards of IS0 11137 to assure a sterility assurance level (SAL) of 10-6. The Guardian Link Transmitter, 670G pump, and Contour NEXT Link 2.4 Wireless Blood Glucose Monitoring System are provided as non-sterile.
Packaging/Shelf-Life:
The MiniMed 670G System (670G pump, Guardian Link Transmitter, and Guardian Sensor) was tested under conditions of simulated shipping per ASTM D4169, Standard Practice for Performance Testing of Shipping Containers and Systems. Testing included environmental conditioning, manual handling, vehicle stacking, loose load vibration, low pressure testing, vehicle vibration, concentrated impact, and final inspection of samples. The MiniMed 670G Insulin Pump (MMT-1780) has a shelf life of six months based on the internal backup battery, which requires regular

PMA P160017: FDA Summary of Safety and Effectiveness Data Page 22
recharging. The Guardian Link Transmitter is intended to be operable for a period of 12 months. The shelf-life of the Guardian Sensor (MMT7008) was validated to be up to one year when stored at 36⁰F to 81⁰F (+2⁰C to +27⁰C) according to the requirements of ISO 11607: Packaging for Terminally Sterilized Medical Devices, ASTM D 4169: Standard Practice for Performance Testing of Shipping Containers and Systems and ASTM F 1929: Standard Test Method for Detecting Leaks in Porous Medical Packaging by Dye Penetration. The packaging of the Contour NEXT Link Meter 2.4 was subject to and has met the requirements for international shipping and handling using procedures and methods defined in ISTA Procedure 2A, Performance Test Procedure for Individual Packaged Products Weighing 150 Lbs. (68 Kg) or less. The operating temperature of the meter is from 41⁰F-113⁰F (5⁰C to 45⁰C) and relative humidity range from 10% to 93%.
Software
Comprehensive verification and validation testing was conducted to confirm that the software used in the MiniMed 670G System meets all specified requirements and that the software will operate reliably and safely under normal or abnormal use conditions. The software verification and validation were carried out in accordance with the FDA Guidance Document, “General Principles of Software Validation: Final Guidance for Industry and FDA Staff.” Software development activities included establishing detailed software requirements, linking requirements with associate verification tests, software code reviews, unit testing, system level testing and defect tracking and dispositioning to ensure the software conforms to user needs and intended uses. Human Factors Testing A human-factors-usability analysis was conducted in accordance with EN62366, Medical Devices – Application of Usability Engineering to Medical Devices.
Task analysis was evaluated by conducting usability studies on selected functions that were determined to have either a high or medium risk to the user. During the usability validation study, 60 representative users performed typical tasks associated with using the pump in both Manual and Auto Modes, and the Guardian continuous glucose monitoring system; four representative user groups were studied (15 per group):
Pediatric Novice Insulin Pump Users (ages 14-21 years) (5) o Users in this group were not currently external pump users, had less
than 6 months of experience with a Medtronic pump, or were currently using a competitor pump.
Adult Novice Insulin Pump Users (ages 22 and older) (8)

PMA P160017: FDA Summary of Safety and Effectiveness Data Page 23
o Users in this group were not currently external pump users, had less than 6 months of experience with a Medtronic pump, or were currently using a competitor pump.
Pediatric Experienced Insulin Pump Users (ages 14-21 years) o Users in this group currently were using a Medtronic external insulin
pump for more than 6 months. Adult Experienced Insulin Pump Users (ages 22 and older)
o Users in this group were using a Medtronic external insulin pump for more than 6 months.
These representative users only included a few truly pump naïve users. This device is available by prescription only, and the healthcare provider will provide training, and will determine who is most appropriate to use the device. All errors and near errors from participants during the usability study were collected and documented for basic statistical analyses. A root cause of any user error was classified as a device issue (e.g., user did not know how to use a portion of the device such as how to disconnect the tubing from the infusion site), test artifact, or use error. For any use errors, a residual risk analysis was performed to determine the impact of the error that could potentially lead to a residual risk of significant over or under-delivery of insulin. The usability evaluations performed demonstrated that users understood the instructions provided in the user guide and that they could use the device safely.
B. Animal Studies Animal testing was performed on an early version of the 670G System control algorithm in Auto Mode. The animal studies were performed using canines to evaluate the probable safety of the closed loop system (Auto Mode) before entering into human studies. The animal studies showed that the early algorithm was safe and based on these results, Medtronic moved the device into human studies.
C. Additional Studies None
IX. SUMMARY OF PRIMARY CLINICAL STUDIES
Medtronic performed clinical studies to establish a reasonable assurance of safety and effectiveness of the 670G System. A summary of the clinical studies is presented below.

PMA P160017: FDA Summary of Safety and Effectiveness Data Page 24
Table 8: Summary of P160017 Clinical Studies
Clinical Study IDE Patient Population
Study Design/Objective
Safety Evaluation of the Hybrid Closed Loop (HCL) System in Type 1 Diabetes
G140167 14-75 years (Type 1 Diabetes)
Multi-center, single-arm, home and hotel clinical study. The study evaluated the safety of the 670G System and its algorithm with the Guardian Sensor in subjects 14 to 75 years.
A Performance Evaluation of the Enlite® 3 Sensor to Support a Full 168 hours (7 Days) of Use
G140053 14-75 years (Type 1 or Type 2
diabetes)
Multi-center, prospective, single-sample correlational design without controls. The study demonstrated the measurement performance of the Guardian Sensor over 7 days in subjects 14 to 75 years.
Pivotal study: Safety Evaluation of the Hybrid Closed Loop (HCL) System in Type 1 Diabetes (G140167):
A. Study Design
Subjects were treated between June 3, 2015 and March 7, 2016 and included 123 patients. There were 10 investigational sites.
The pivotal study was a multi-center, single-arm home and hotel clinical evaluation in subjects with type 1 diabetes on insulin pump therapy. The sponsor enrolled 126 subjects (ages 14-75 years) at 10 investigational centers. Three subjects did not complete the study (see subject accountability below). The 123 study subjects wore the 670G pump with the Guardian Link Transmitter, the Guardian Sensor and infusion sets for approximately 3.5 months and participated in three study phases: a two week run-in period, a three month at home use period, and a 5 day/6 night hotel study, which occurred during month 1, month 2, or month 3 of the study. Subjects were instructed to use the device in auto mode for the duration of the 3 month at home study.
Run-in period During the two week run-in period, subjects used the study pump (670G) with only the sensor augmented pump function activated (all automated features were off). Prior to wearing study devices, all subjects and their companions were trained on the devices as well as diabetes management principles, such as the treatment of hyperglycemia and hypoglycemia. In addition, there was training regarding the need to have access to oral glucose in case of hypoglycemia. Subjects were instructed to

PMA P160017: FDA Summary of Safety and Effectiveness Data Page 25
monitor blood glucose using self-monitoring of blood glucose (SMBG) 4-6 times a day. As a precaution, subjects were told that they should keep their own insulin pump supplies in case they were asked during the study to revert back to using their own pump. Subjects were also instructed that they should always have insulin and syringes or pens, in case they encountered problems with the study pump (e.g., infusion set occlusion with high glucose).
At Home Study Period Following the two week run-in period using the Study Pump (670G), a total of 123 subjects participated in a 3-month at home study period. Prior to entry into Auto Mode, subjects used the pump in Manual Mode during the first 6 days of the study period in order to collect data on insulin utilization and sensor glucose levels. After this 6 day period, the subjects were allowed to enter Auto Mode.
Subjects were required to have a companion with them during the night for the duration of the study period. Companions were instructed to be under the same roof (i.e., within range and able to hear sensor alarms), but not necessarily in the same bedroom as the study subject. Subjects were also required to upload their pump data daily for the first 14 days after entering into Auto Mode to facilitate remote monitoring by the study sponsor.
The required device settings for the study are below unless otherwise stated as optional:
Manual Mode:
o High sensor glucose alert set at 300 mg/dL o Low sensor glucose alert set at 70 mg/dL o Predictive alerts and rate of change alerts are optional o It was recommended (optional) to have the ‘Suspend before Low’ ON
with the low limit setting of 70 mg/dL. Auto Mode:
o High sensor glucose alert set at 300 mg/dL o Low sensor glucose alert set at 70 mg/dL
The target glucose during Auto Mode o The target glucose was 120 mg/dL. o A temporary target of 150 mg/dL could be used in certain scenarios (e.g.,
exercise). o Alarms that were mandatory (fixed into the system):
Sensor glucose at or below 50 mg/dL Sensor glucose at or above 300 mg/dL for one hour Sensor glucose at or above 250 mg/dL for 3 hours
Hotel Study Period A total of 122 of the 123 subjects participated in the Hotel portion of the study (6 days, 5 nights); one subject did not complete the hotel visit and removed the sensor and study devices for the last 30 days of the study due to rheumatoid arthritis and C.

PMA P160017: FDA Summary of Safety and Effectiveness Data Page 26
difficile diarrhea (unrelated to device use and study protocol). There was an average of 4-6 subjects participating in each hotel stay. The hotel stays were to occur during the first, second or third month of study, with a minimum of 20 subjects completing the hotel stay each month. The purpose of the hotel portion of the study was to stress the user with sustained daily exercise and unrestricted eating (see description below).
All subjects underwent daytime and nighttime frequent sample testing for approximately 24 hours during the Hotel study with a laboratory blood glucose method. Overnight frequent sample testing occurred every 30 minutes from approximately 10PM to 7AM. Daytime frequent sample testing was every 60 minutes from approximately 7AM to 10PM. Subjects also participated in daily sustained exercise/activity regimens for a minimum of 4 hours spread throughout the day. With respect to meals, subjects were allowed to eat what they chose.
On Days 1-6 of the Study period, the subjects used the device in Manual Mode to collect data necessary for the system in order to enter into Auto Mode. Entry into Auto Mode occurred on day 7 whether at home or in the hotel. If a subject was scheduled for their hotel visit in month 1, the hotel visit would occur during days 7-14 of the study.
The study was a multi-center, single arm observational at home and hotel clinical study with no controls. There were no statistically powered endpoints in the Auto Mode study (G140167). This was a descriptive study to evaluate the safe use of the 670G System.
1. Clinical Inclusion and Exclusion Criteria
Enrollment in the pivotal study was limited to subjects who met the following inclusion criteria.
1. Subject is age 14-75 years at the time of screening 2. Subject has a clinical diagnosis of type 1 diabetes for 2 years or more as
determined via medical record or source documentation by an individual qualified to make medical diagnosis.
3. Subject is willing to participate in a hotel study for the specified duration of hotel stay.
4. Subject must have companion who will sleep in the same dwelling place every night during the study period and should also be able to call the subject daily in the event the subject is traveling. This requirement may be verified by subject report at screening visit.
5. Subject is willing to perform ≥ 4 finger stick blood glucose measurements daily.
6. Subject is willing to perform required sensor calibrations 7. Subject is willing to wear the system continuously throughout the study 8. Subject has a Glycosylated hemoglobin (HbA1c) value less than 10.0%
(as processed by Central Lab) at time of screening visit.

PMA P160017: FDA Summary of Safety and Effectiveness Data Page 27
9. Subject has TSH in the normal range OR if the TSH is out of normal reference range the Free T3 is below or within the lab’s reference range and Free T4 is within the normal reference range.
10. Pump therapy for greater than 6 months prior to screening (with or without continuous glucose monitor experience)
11. Subject is willing to upload data from the study pump, must have Internet access and a computer system that meets the requirements for uploading the study pump
12. If subject has celiac disease, it has been adequately treated as determined by the investigator
13. Subject is willing to take one of the following insulins and can financially support the use of either of the 2 insulin preparations throughout the course of the study (i.e., copayments for insulin with insurance or able to pay full amount)
Humalog® (insulin lispro injection) NovoLog® (insulin aspart)
14. Subjects with history of cardiovascular event 1 year or more from the time of screening must have an EKG within 6 months prior to screening or during screening. If subject has an abnormal EKG, participation is allowed if there is clearance from a cardiologist
15. Subjects with the 3 or more cardiovascular risk factors listed below must have an EKG within 6 months prior to screening or during screening. If subject has an abnormal EKG, participation is allowed if there is clearance from a cardiologist
Cardiovascular risk factors include: Age >35 years Type 1 diabetes of >15 years’ duration Presence of any additional risk factor for coronary artery
disease Presence of microvascular disease (proliferative retinopathy or
nephropathy, including microalbuminuria) Presence of peripheral vascular disease Presence of autonomic neuropathy
16. Subjects with history of cardiovascular event 1 year or more from the time of screening must have a stress test within 6 months prior to screening or during run in period. If subject fails stress test, participation is allowed if there is clearance from a cardiologist
17. Subjects must be able to speak English, and be literate in English
Subjects were not permitted to enroll in the pivotal study if they met any of the following exclusion criteria:
1. Subject has a history of 2 or more episodes of severe hypoglycemia, which resulted in any of the following during the 6 months prior to screening:
a. Medical assistance (i.e., Paramedics, Emergency Room or Hospitalization)

PMA P160017: FDA Summary of Safety and Effectiveness Data Page 28
b. Coma c. Seizures
2. Subject is unable to tolerate tape adhesive in the area of sensor placement 3. Subject has any unresolved adverse skin condition in the area of sensor
placement (e.g., psoriasis, dermatitis herpetiformis, rash, Staphylococcus infection)
4. Females who are sexually active and able to conceive will be excluded if they are not using an effective method of contraception and do not agree to continue using an effective method of contraception for the duration of the study as determined by investigator.
5. Subject has had any of the following cardiovascular events within 1 year of screening: myocardial infarction, unstable angina, coronary artery bypass surgery, coronary artery stenting, transient ischemic attack, cerebrovascular accident, angina, congestive heart failure, ventricular rhythm disturbances or thromboembolic disease
6. Subject is being treated for hyperthyroidism at time of screening 7. Subject has diagnosis of adrenal insufficiency 8. Subject has had DKA in the 6 months prior to screening visit 9. Subject has taken any oral, injectable, or intravenous steroids within 8
weeks from time of screening visit, or plans to take any oral, injectable or intravenous steroids during the course of the study
10. Subject is actively participating in an investigational study (drug or device) wherein he/she has received treatment from an investigational study drug or investigational study device in the last 2 weeks.
11. Subject has been hospitalized or has visited the ER in the 6 months prior to screening resulting in a primary diagnosis of uncontrolled diabetes.
12. Subject is currently abusing illicit drugs 13. Subject is currently abusing marijuana 14. Subject is currently abusing prescription drugs 15. Subject is currently abusing alcohol 16. Subject is using pramlintide (Symlin), DDP-4 inhibitor, liraglutide
(Victoza or other GLP-1 agonists), metformin, canagliflozin (Invokana or other SGLT2 inhibitors) at time of screening
17. Subject has a history of visual impairment which would not allow subject to participate in the study and perform all study procedures safely, as determined by the investigator
18. Subject has elective surgery planned that requires general anesthesia during the course of the study
19. Subject has a sickle cell disease, hemoglobinopathy; or has received red blood cell transfusion or erythropoietin within 3 months prior to time of screening
20. Subject plans to receive red blood cell transfusion or erythropoietin over the course of the study participation
21. Subject diagnosed with current eating disorder such as anorexia or bulimia 22. Subject has been diagnosed with chronic kidney disease that results in
chronic anemia

PMA P160017: FDA Summary of Safety and Effectiveness Data Page 29
23. Subject has a hematocrit that is below the normal reference range of lab used
24. Subject is on dialysis 25. Subject has serum creatinine of > 2 mg/dL
2. Follow-up Schedule
Throughout the study period there were a number of scheduled telephone calls. These calls were meant to make sure that the subject was healthy and to remind them about adherence to study requirements, for example uploading the study pump data to CareLink. During the final study visit, subjects were asked to complete some questionnaires about their experience and also had blood collected for an HbA1c test. Hotel Study Phase The subject received a follow-up phone call from the study doctor’s staff within 6-18 hours from discharge after the visit at the hotel or clinic to address any questions or concerns the subject had and to ask how they were doing.
3. Clinical Endpoints
There were no statistically powered endpoints in the pivotal study, nor was there any hypothesis testing. This was a descriptive study to evaluate the safe use of the Auto Mode. The analyses used for the various study phases are as follows: At-home Study Phase
The mean change in HbA1c will be presented from baseline to end of study Change of Total Daily Dose (TDD) of insulin and weight from baseline to
end of study Time spent in Auto Mode versus time spent in Manual Mode Time in different range (% of sensor glucose [SG]): SG≤50, 60, 70 mg/dL,
70 mg/dL <SG≤180 mg/dL, SG≥180, 250 mg/dL, 350 mg/dL Number of Events, Area under the Curve (AUC) and Time in the
hyperglycemic range: SG≥180, 250 mg/dL, 350 mg/dL Number of Events, AUC and Time in the hypoglycemic range: SG≤50, 60,
and 70 mg/dL Hotel Study Phase
Time in different ranges (per the comparator method (CM): BG ≤50, 60, 70 mg/dL, 70 mg/dL <SG≤180 mg/dL, SG≥180, 250 mg/dL
Number of Events, AUC and Time in the hyperglycemic range: CM ≥180, 250 mg/dL, 350 mg/dL
Number of Events, AUC and Time in the hypoglycemic range: CM ≤50, 60, and 70 mg/dL

PMA P160017: FDA Summary of Safety and Effectiveness Data Page 30
Safety Endpoints Serious adverse events, serious adverse device events Unanticipated adverse device effects Incidence of severe hypoglycemia Incidence of DKA
B. Accountability of Study Cohort
A total of 126 subjects entered the run-in period, 2 subjects did not meet the run-in criteria and 124 subjects entered the study period; 1 subject was withdrawn during the study period because the subject felt too restricted by the study protocol and the inability to control mildly elevated glucose levels with frequent correction boluses; therefore, 123 subjects completed the home study phase. The demographics of the study population are typical for studies performed in the Type 1 diabetes population performed in the US.
C. Study Population Demographics and Baseline Parameters
Characteristic Number of Subjects =124
Age (Years) N 124 Mean (SD) 37.8 (16.46) Median 39.0 Min, Max 14.0, 75.0 Gender N (%) Female 69 (55.6%) Male 55 (44.4%) Race N (%) Asian 3 (2.4%) Black/African American 1 (0.8%) Other 1 (0.8%) White 119 (96.0%) Ethnicity N (%) Hispanic/Latino 3 (2.4%) Non-Hispanic/Non-Latino 109 (87.9%) Not reportable per local law or regulation 12 (9.7%) Diabetes History(Years) N 119 Mean (SD) 21.7 (13.65) Median 19.0 Min, Max 2.0, 57.0

PMA P160017: FDA Summary of Safety and Effectiveness Data Page 31
Height (cm) N 124 Mean (SD) 171.2 (10.29) Median 170.3 Min, Max 147.1, 198.5 Weight (kg) N 124 Mean (SD) 76.9 (17.86) Median 73.5 Min, Max 46.7, 175.0 BMI N 124 Mean (SD) 26.2 (5.27) Median 25.0 Min, Max 17.0, 46.0 Baseline A1C N 124 Mean (SD) 7.4 (0.91) Median 7.3 Min, Max 5.2, 9.7
D. Safety and Effectiveness Results
1. Safety Results
The analysis of safety was based on the pivotal study (G140167) and the Guardian sensor performance study (G140053 – see study description below) which included 123 subjects available for the 3.5 month evaluation, and 89 subjects available for two weeks, respectively. Key safety outcomes and adverse effects are reported below for the pivotal study. The continuation phase of the pivotal study (G140167/S004), as well as the confirmatory (post-market) study (G160046) for the 670G system should provide further information regarding the safety of the device (including incidence of harmful events), as well as durability of the results noted during the pivotal study. See below for additional descriptive details for the continuation and confirmatory studies. Adverse events that occurred in the pivotal study: The safety data of the 670G System was assessed by evaluation of the incidence of all serious Adverse Events, Adverse Device Effects (ADEs), Serious Adverse Device Events (SADEs), and Unanticipated Adverse Device Effects (UADEs) experienced by study subjects. Adverse events (AEs) were listed in terms of severity and relationship to the device. There were 4 reports of serious adverse events.
1 report of appendicitis

PMA P160017: FDA Summary of Safety and Effectiveness Data Page 32
1 report of bacterial arthritis of right wrist 1 report of C. difficile diarrhea 1 report of worsening rheumatoid arthritis
There were no reports of unanticipated adverse device effects There were no reports of DKA There were no reports of severe hypoglycemia events. There were 4 procedure-related events
thrombophlebitis pain irritation/bruising pain at the IV site
There were 24 severe hyperglycemia events reported. Severe hyperglycemia was defined in the protocol as a glucose concentration >300 mg/dL with blood ketones >0.6mmol/L or accompanied by symptoms of nausea, vomiting or abdominal pain. Table 9 (below) summarizes the severe hyperglycemic events which were reported during the study, and provides a column that identifies any mitigations, where applicable. The HCL study was not powered to detect if the incidence of adverse events varies by subpopulation.

PMA P160017: FDA Summary of Safety and Effectiveness Data Page 33
Table 9: Summary of Severe Hyperglycemic Events Event Description Run-in Phase Study Phase Mitigations
Implemented Not device related 2 5 N/A- not device
related Infusion set issues 5 6 No changes to the
670G pump or Guardian system as the events were due to infusion set site issues
Software or hardware issues resulting in depletion of pump’s battery backup
0 5 A software anomaly that is related to the pump’s battery depletion was fixed and applied in the software that is included in the approved device
Sensor values triggering the safe basal insulin delivery rate that was not sufficient to maintain normal glucose levels
0 1 N/A- No changes to the device were made because this is a risk mitigation by design of the 670G System when the user is in Auto Mode and it senses that the sensor is not performing as needed by the system.
2. Effectiveness Results
System Performance: Pivotal Study (G140167)
The data below describe how the device performed during the pivotal study. The study was not designed to determine the effectiveness of the device compared to alternative treatments such as manual daily injections or non-automated insulin pump therapy.
The table below provides an overall summary of the run-in phase and study phase (home and hotel) for all subjects in the study. The data presented in this table

PMA P160017: FDA Summary of Safety and Effectiveness Data Page 34
includes information about subjects’ glucose levels, insulin delivered and weight during run-in versus study phases.
Table 10: Percent of Time within Glucose Ranges, Mean Insulin Delivery, and Mean Weight of Subjects during Run-in and Study Phases
Parameter Run-In (Two weeks) Study (Three months) Sensor glucose, mean ± SD
(median) mg/dL 150.2±22.7 (150.1) 150.8±13.7 (149.9)
Percent of time with glucose level in range: mean ± SD (95% CI), % SG <= 50 mg/dL 1.0±1.09(0.76, 1.15) 0.6±0.61(0.49, 0.70) SG <= 60 mg/dL 2.6±2.32(2.22, 3.04) 1.5±1.17(1.31, 1.73) SG <= 70 mg/dL 5.9±4.08(5.13, 6.59) 3.3±1.97(2.91, 3.61)
SG >70 −<= 180 mg/dL 66.7±12.17 (64.58, 68.91) 72.2±8.83(70.64, 73.78)
SG > 180 mg/dL 27.4±13.69 (24.96, 29.83) 24.5±9.21(22.90, 26.17) SG > 250 mg/dL 6.9±7.44(5.61, 8.26) 5.6±4.45(4.83, 6.41) SG > 300 mg/dL 2.3±4.19(1.57, 3.06) 1.7±1.89(1.33, 2.00) SG > 350 mg/dL 0.7±1.68(0.41, 1.00) 0.5±0.71(0.36, 0.61)
Within-day SD of glucose mean ± SD (median,
interquartile range) mg/dL
50.1±9.9 (48.9, 43.7-56.2) 46.7±7.3 (45.6, 41.7-50.4)
Within-day coefficient of variation of glucose (%); mean
± SD (median, interquartile range) mg/dL
33.5±4.3 (33.1, 30.3-36.4) 30.8±3.3 (30.7, 28.2-33.0)
HbA1c; mean ± SD (median), %
7.4±0.91 (7.3) 6.9±0.61 (6.8)
Total daily dose of insulin; mean ± SD (median), U
47.5±22.67 (43.9) 50.9±26.72 (44.1)

PMA P160017: FDA Summary of Safety and Effectiveness Data Page 35
The baseline HbA1c value was collected at the first office visit for subjects during the study phase. The end of study HbA1c was collected at the last visit of the study phase. The change in mean HbA1c from the first visit and last visit was analyzed, and was found to be -0.5% (with 95% confidence intervals of -0.6 to -0.4). A summary of HbA1c data is provided in the table below.
Table 11: Percent Change in HbA1c from Baseline to End of Study
Baseline % (SD) End of Study % (SD) Change from Baseline to End of Study % SD)
N 124 123 123 Mean(SD) 7.4 (0.9) 6.9 (0.6) -0.5 (0.6) Median 7.3 6.8 -0.4 95% Confidence Interval
(7.2, 7.6) (6.8, 7.0) (-0.6, -0.4)
Min, Max 5.2, 9.7 5.4, 8.4 -2.3, 0.7
The table below provides data regarding the subject baseline HbA1c collected at the beginning of the study and the number of subjects who experienced a decrease, no change, or increase in HbA1c values at the end of the study.
Table 12: Number of subjects with change in HbA1C at different baselines
HbA1C Change Range Number of Subjects (% of Subjects) with Change in HbA1c
Baseline HbA1c (%) Decrease
> 1% Decrease 0 to 1%
No Change
Increase 0 to 1%
Increase > 1%
5% ≤ HbA1c < 6% 0 (0.0%) 1 (0.8%) 0 (0.0%) 3 (2.4%) 0 (0.0%)
6% ≤ HbA1c < 7% 1 (0.8%) 20 (16.1%) 5 (4.0%) 11 (8.9%) 0 (0.0%)
7% ≤ HbA1c < 8% 8 (6.5%) 34 (27.4%) 1 (0.8%) 9 (7.3%) 0 (0.0%)
8% ≤ HbA1c < 9% 11 (8.9%) 12 (9.7%) 1 (0.8%) 0 (0.0%) 0 (0.0%)
9% ≤ HbA1c < 10% 6 (4.8%) 0 (0.0%) 0 (0.0%) 0 (0.0%) 0 (0.0%)
Overall 26 (21.0%) 67 (54.0%) 7 (5.6%) 23 (18.5%) 0 (0.0%)

PMA P160017: FDA Summary of Safety and Effectiveness Data Page 36
The table below provides the average time the subjects spent in a specific glucose range in both the run-in and study phases.
Table 13: Time spent in specific glucose ranges during the run-in and study phases by all subjects
Glucose Range
(mg/dL)
Run-In Phase
Time in Glucose Range Mean±SD
Study Phase
Time in Glucose Range Mean±SD
≤ 50 12.8 mins ± 14.5 mins 7.7 mins ± 7.6 mins ≤ 60 35.2 mins ± 31.2 mins 19.9 mins ± 14.8 mins ≤ 70 1 hr 18.6 mins ± 55.3 mins 42.9 mins ± 25.4 mins
70 – 180 14 hrs 54.4 mins ± 3 hrs 1.4
min 16 hrs 2.2 mins ± 2 hrs 35.6
mins
>180 6 hrs 2.1 mins ± 2 hrs 52.7
mins 5 hrs 20.7 mins ± 1 hr 46.9
mins
>250 1 hr 30.4 mins ± 1 hr 32.3
mins 1 hr 12.1 mins ± 52.6 mins > 300 29.6 mins ± 51.7 mins 21.1 mins ± 22.2 mins > 350 8.9 mins ± 20.7 mins 6.1 mins ± 8.35 mins
The table below provides the different ranges of time a specific number of subjects and percentage of subjects spent in specific glucose ranges throughout the study phase (includes time spent in Auto Mode and in Manual Mode while using the device).

PMA P160017: FDA Summary of Safety and Effectiveness Data Page 37
Table 14: Number of subjects that spent a certain time range in each glucose range during the study phase
Time Range
Number of Subjects (% of Subjects) in the Glucose Range (mg/dL) Indicated
≤ 50 ≤ 60 ≤ 70 70 – 180 > 180 > 250
0 to 10 mins 91
(73.4%) 36
(29.0%) 5 (4.0%) 0 (0.0%) 0 (0.0%) 4 (3.2%)
10 to 20 mins 24
(19.4%) 40
(32.3%) 20
(16.1%) 0 (0.0%) 0 (0.0%) 9 (7.3%)
20 to 30 mins 6 (4.8%) 25
(20.2%) 20
(16.1%) 0 (0.0%) 0 (0.0%) 11
(8.9%)
30 to 40 mins 2 (1.6%) 7 (5.6%) 22
(17.7%) 0 (0.0%) 0 (0.0%) 16
(12.9%)
40 to 50 mins 1 (0.8%) 10 (8.1%) 15
(12.1%) 0 (0.0%) 0 (0.0%) 16
(12.9%) 50 mins to 1
hour 0 (0.0%) 5 (4.0%) 17
(13.7%) 0 (0.0%) 0 (0.0%) 9 (7.3%)
1 to 2 hours 0 (0.0%) 1 (0.8%) 24
(19.4%) 0 (0.0%) 2 (1.6%) 40
(32.3%)
2 to 3 hours 0 (0.0%) 0 (0.0%) 1 (0.8%) 0 (0.0%) 10 (8.1%) 15
(12.1%)
3 to 4 hours 0 (0.0%) 0 (0.0%) 0 (0.0%) 0 (0.0%) 22
(17.7%) 3 (2.4%)
4 to 5 hours 0 (0.0%) 0 (0.0%) 0 (0.0%) 0 (0.0%) 20
(16.1%) 1 (0.8%)
5 to 10 hours 0 (0.0%) 0 (0.0%) 0 (0.0%) 3 (2.4%) 68
(54.8%) 0 (0.0%)
10 to 15 hours 0 (0.0%) 0 (0.0%) 0 (0.0%) 31
(25.0%) 2 (1.6%) 0 (0.0%)
15 to 20 hours 0 (0.0%) 0 (0.0%) 0 (0.0%) 86
(69.4%) 0 (0.0%) 0 (0.0%) >20 hours 0 (0.0%) 0 (0.0%) 0 (0.0%) 4 (3.2%) 0 (0.0%) 0 (0.0%)

PMA P160017: FDA Summary of Safety and Effectiveness Data Page 38
The table below provides number of subjects and percentage of subjects who spent the indicated average amount of time in each glucose range (mg/dL) while in auto mode per day.
Table 15: Number of subjects that spent a certain time range in each glucose range while in auto mode during the study phase
Time Range
Number of Subjects (% of Subjects) in the Glucose Range (mg/dL) Indicated
≤ 50 ≤ 60 ≤ 70 70 to 180
> 180 > 250 > 300 > 350
0 to 15 mins 105 (84.7%)
58 (46.8%)
12 (9.7%)
0 (0.0%) 0 (0.0%) 8 (6.5%) 66 (53.2%)
112 (90.3%)
15 to 30 mins
16 (12.9%) 43 (34.7%)
33 (26.6%)
0 (0.0%) 0 (0.0%) 16 (12.9%)
31 (25.0%)
6 (4.8%)
30 to 45 mins
3 (2.4%) 12 (9.7%)
29 (23.4%)
0 (0.0%) 0 (0.0%) 24 (19.4%)
12 (9.7%)
6 (4.8%)
45 mins to 1 hr
0 (0.0%) 10 (8.1%)
25 (20.2%)
0 (0.0%) 0 (0.0%) 17 (13.7%)
6 (4.8%) 0 (0.0%)
1-4 hr 0 (0.0%) 1 (0.8%) 25 (20.2%)
0 (0.0%) 34 (27.4%)
58 (46.8%)
9 (7.3%) 0 (0.0%)
4-8 hr 0 (0.0%) 0 (0.0%) 0 (0.0%) 0 (0.0%) 83 (66.9%)
1 (0.8%) 0 (0.0%) 0 (0.0%)
8-12 hr 0 (0.0%) 0 (0.0%) 0 (0.0%) 12 (9.7%)
7 (5.6%) 0 (0.0%) 0 (0.0%) 0 (0.0%)
12-16 hr 0 (0.0%) 0 (0.0%) 0 (0.0%) 38 (30.6%)
0 (0.0%) 0 (0.0%) 0 (0.0%) 0 (0.0%)
16-20 hr 0 (0.0%) 0 (0.0%) 0 (0.0%) 70 (56.5%)
0 (0.0%) 0 (0.0%) 0 (0.0%) 0 (0.0%)
20-24* hr 0 (0.0%) 0 (0.0%) 0 (0.0%) 4 (3.2%) 0 (0.0%) 0 (0.0%) 0 (0.0%) 0 (0.0%)
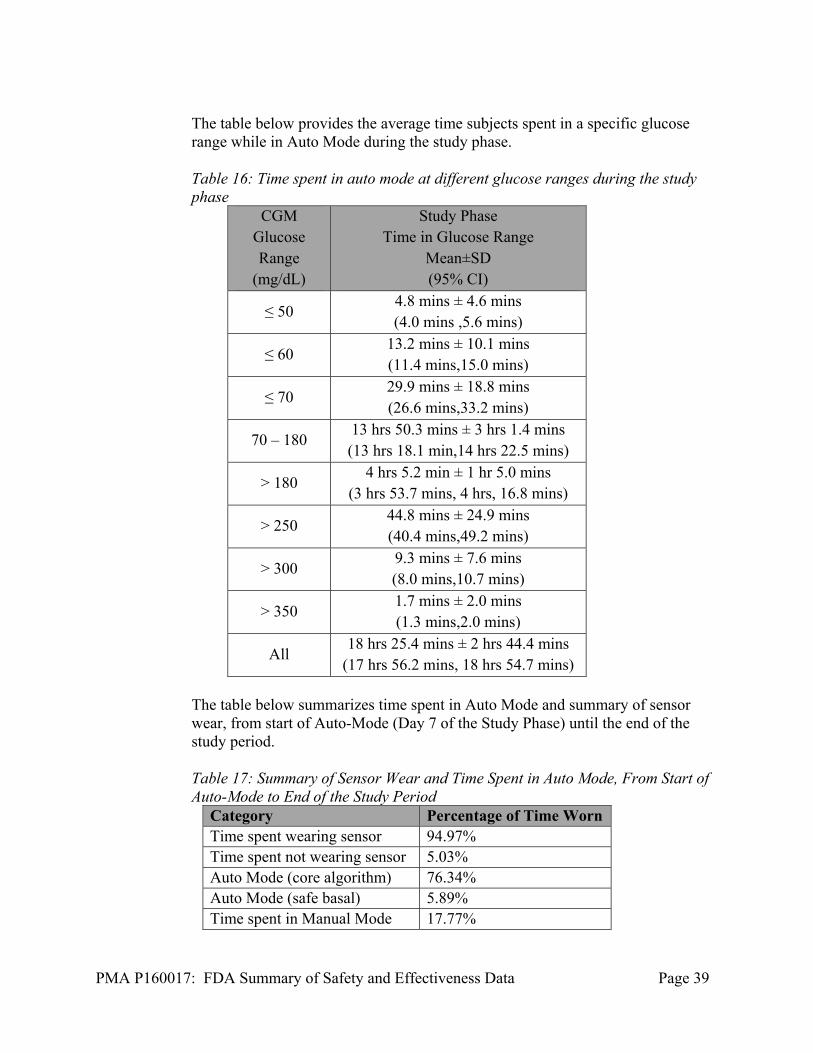
PMA P160017: FDA Summary of Safety and Effectiveness Data Page 39
The table below provides the average time subjects spent in a specific glucose range while in Auto Mode during the study phase.
Table 16: Time spent in auto mode at different glucose ranges during the study phase
CGM Glucose Range
(mg/dL)
Study Phase Time in Glucose Range
Mean±SD (95% CI)
≤ 50 4.8 mins ± 4.6 mins (4.0 mins ,5.6 mins)
≤ 60 13.2 mins ± 10.1 mins (11.4 mins,15.0 mins)
≤ 70 29.9 mins ± 18.8 mins (26.6 mins,33.2 mins)
70 – 180 13 hrs 50.3 mins ± 3 hrs 1.4 mins (13 hrs 18.1 min,14 hrs 22.5 mins)
> 180 4 hrs 5.2 min ± 1 hr 5.0 mins
(3 hrs 53.7 mins, 4 hrs, 16.8 mins)
> 250 44.8 mins ± 24.9 mins (40.4 mins,49.2 mins)
> 300 9.3 mins ± 7.6 mins (8.0 mins,10.7 mins)
> 350 1.7 mins ± 2.0 mins (1.3 mins,2.0 mins)
All 18 hrs 25.4 mins ± 2 hrs 44.4 mins
(17 hrs 56.2 mins, 18 hrs 54.7 mins) The table below summarizes time spent in Auto Mode and summary of sensor wear, from start of Auto-Mode (Day 7 of the Study Phase) until the end of the study period. Table 17: Summary of Sensor Wear and Time Spent in Auto Mode, From Start of Auto-Mode to End of the Study Period
Category Percentage of Time Worn Time spent wearing sensor 94.97% Time spent not wearing sensor 5.03% Auto Mode (core algorithm) 76.34% Auto Mode (safe basal) 5.89% Time spent in Manual Mode 17.77%

PMA P160017: FDA Summary of Safety and Effectiveness Data Page 40
All data was collected using sensors inserted in the abdomen, as the sensor is approved only for use in the abdomen.
Guardian Sensor Performance Study (G140053)-A Performance Evaluation of the Enlite 3 Sensor to Support a Full 168 hours (7 days) of Use:
A. Study Design
This study was performed to assess the analytical performance of the Guardian sensor. It ran between April 30, 2015 and August 25, 2015 and included 89 subjects (different from subjects who participated in the pivotal study above). There were 6 investigational sites.
This study was a multi-center, prospective, single-sample correlational study without a control group, designed to determine the performance of the Guardian sensor in adolescents and adults with Type I or Type II Diabetes Mellitus between the ages of 14-75 years. All subjects wore a receiver, Guardian Link (3) transmitter, and a Guardian Sensor (3). All subjects were assigned to complete ‘Frequent Sample Testing’ and blood glucose testing. Subjects wore the Guardian sensor for a 7-day training period (that included a minimum 6 days of sensor wear), followed by a 7-day study period. During the study period, each subject participated in three in-clinic, frequent sample testing interventions. Frequent sample testing occurred at the beginning (Day 1), middle (Day 3) and end (Day 7) of the Guardian sensor system use. During these FST sessions, intravenous (IV) blood samples were drawn every 5 to 15 minutes and analyzed for plasma blood glucose levels using the comparator method (CM). The CM is this study was the Yellow Springs Instrument 2300 Stat Plus Glucose Lactate Analyzer. Frequent sample testing with the CM lasted approximately 12 to 14 hours during the in-clinic visit. Subjects were randomized to one of 2 groups that determined when they participated in the in-clinic frequent sample testing; a day cohort (hours 1-12) and an evening cohort (hours 12-24). Subjects continued with their current diabetes regimen independent of the study devices. Subjects were instructed by the investigational center that they were not to use the investigational devices for the management of their diabetes.
There was no control group as this study was an observational study to determine the accuracy and precision of the Guardian sensor. Accuracy was assessed by comparing the sensor values to the CM, and precision of the sensor system was assessed by comparing sensor values to each other in subjects wearing two sensors. 1. Clinical Inclusion and Exclusion Criteria

PMA P160017: FDA Summary of Safety and Effectiveness Data Page 41
Enrollment in the Guardian sensor study was limited to subjects who met the following inclusion criteria:
1. Subject is 14 - 75 years of age at time of screening 2. A clinical diagnosis of type 1 or 2 diabetes for a minimum of 12 months
duration, as determined via medical record or source documentation by an individual qualified to make a medical diagnosis
3. Adequate venous access as assessed by investigator or appropriate staff 4. Subjects participating in the high and low glucose challenges must have an
established insulin:carbohydrate ratio(s) and insulin sensitivity ratio. (The term “established” refers to a ratio that has been previously defined and tested prior to screening visit). Subjects without established ratios may be enrolled but will not be subjected to high and low glucose challenges.
Subjects were not permitted to enroll in the Guardian sensor study if they met any of the following exclusion criteria:
1. Subject will not tolerate tape adhesive in the area of Guardian Sensor placement as assessed by qualified individual
2. Subject has any unresolved adverse skin condition in the area of Guardian Sensor or device placement (e.g., psoriasis, rash, Staphylococcus infection)
3. Subject is actively participating in an investigational study (drug or device) wherein they have received treatment from an investigational study (drug or device) in the last 2 weeks
4. Subject is female and has a positive pregnancy screening test 5. Females of child bearing age and who are sexually active should be
excluded if they are not using a form of contraception deemed reliable by investigator
6. Subject is female and plans to become pregnant during the course of the study
7. Subject has had a hypoglycemic seizure within the past 6 months 8. Subject has had hypoglycemia resulting in loss of consciousness within
the past 6 months prior to screening visit 9. Subject has had an episode of DKA within the past 6 months prior to
screening visit 10. Subject has a history of a seizure disorder 11. Subject has central nervous system or cardiac disorder resulting in
syncope 12. Subject has a history of myocardial infarction, unstable angina, coronary
artery bypass surgery, coronary artery stenting, transient ischemic attack (TIA), cerebrovascular accident (CVA), angina, congestive heart failure, ventricular rhythm disturbances or thromboembolic disease
13. Subject has a hematocrit (Hct) lower than the normal reference range 14. Subject has a history of adrenal insufficiency
2. Follow-up Schedule

PMA P160017: FDA Summary of Safety and Effectiveness Data Page 42
At the end of the study, subjects removed all study devices. Upon removal, all the Sensor insertion sites were examined and evaluated by the study staff. Sensors were visually inspected at the site. Study investigators documented any Adverse Device Effects (including skin irritations) and evaluated safety issues related to system use during the study. No long-term follow up was included in this study protocol.
3. Clinical Endpoints
Because this was an observational study, it did not include traditional analysis of clinical endpoints. The data were presented using multiple analyses as described in the Study Results section below. Safety of the sensor was determined by skin and insertion site reactions.
B. Accountability of Study Cohort
Of the 93 subjects that entered the study, 4 subjects failed the screening, and 89 subjects were randomized into one of two groups that determined when they participated in the in-clinic frequent sample testing (day testing or night testing). Of these 89 randomized subjects, 7 subjects did not complete the study for the following reasons:
One subject withdrew their informed consent One subject withdrew due to work schedule One subject withdrew due to school schedule One subject did not show up for insertion visit After review of study dates, one subject withdrew. A sensor failed on frequent sampling day 7 and subject did not have adequate
time off work to reschedule After a sensor fell out due to sweating, before frequent sample day 7, the subject
decided to withdraw so they did not have to complete a second round of frequent sample testing.
A total of 82 subjects underwent frequent sample testing and completed the study. Eighty-eight (88) subjects completed the first frequent sample testing on day 1, 87 subjects completed frequent sample testing on day 3, and 79 subjects completed frequent sample testing on day 7. Three (3) subjects completed the study by attending the last visit, but did not complete frequent sample testing on day 7.
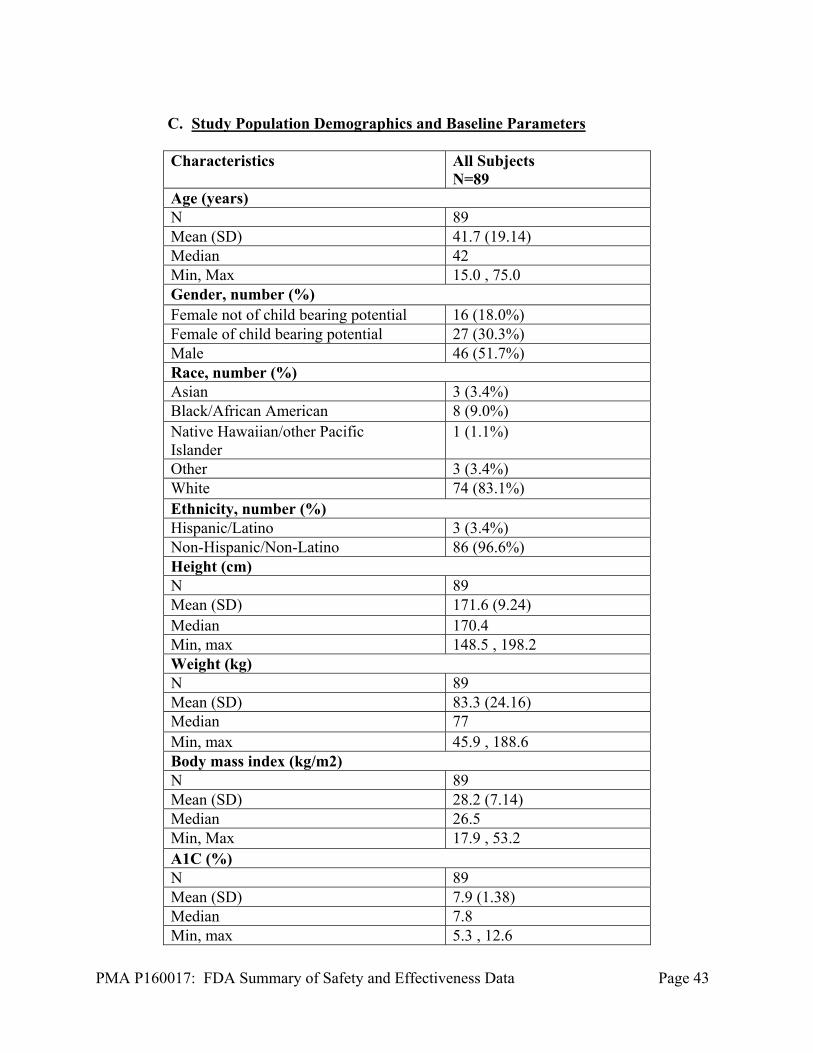
PMA P160017: FDA Summary of Safety and Effectiveness Data Page 43
C. Study Population Demographics and Baseline Parameters Characteristics All Subjects
N=89Age (years) N 89 Mean (SD) 41.7 (19.14) Median 42 Min, Max 15.0 , 75.0 Gender, number (%) Female not of child bearing potential 16 (18.0%) Female of child bearing potential 27 (30.3%) Male 46 (51.7%) Race, number (%) Asian 3 (3.4%) Black/African American 8 (9.0%) Native Hawaiian/other Pacific Islander
1 (1.1%)
Other 3 (3.4%) White 74 (83.1%) Ethnicity, number (%) Hispanic/Latino 3 (3.4%) Non-Hispanic/Non-Latino 86 (96.6%) Height (cm) N 89 Mean (SD) 171.6 (9.24) Median 170.4 Min, max 148.5 , 198.2 Weight (kg) N 89 Mean (SD) 83.3 (24.16) Median 77 Min, max 45.9 , 188.6 Body mass index (kg/m2) N 89 Mean (SD) 28.2 (7.14) Median 26.5 Min, Max 17.9 , 53.2 A1C (%) N 89 Mean (SD) 7.9 (1.38) Median 7.8 Min, max 5.3 , 12.6
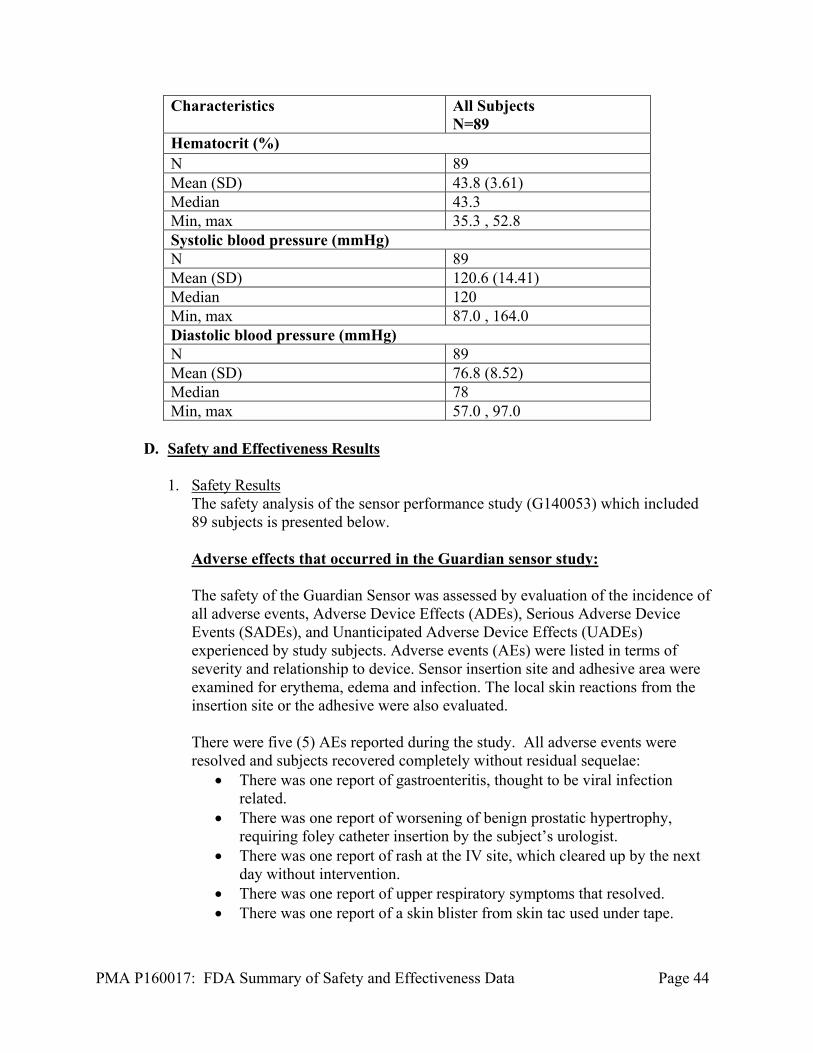
PMA P160017: FDA Summary of Safety and Effectiveness Data Page 44
Characteristics All Subjects N=89
Hematocrit (%) N 89 Mean (SD) 43.8 (3.61) Median 43.3 Min, max 35.3 , 52.8 Systolic blood pressure (mmHg)N 89 Mean (SD) 120.6 (14.41) Median 120 Min, max 87.0 , 164.0 Diastolic blood pressure (mmHg)N 89 Mean (SD) 76.8 (8.52) Median 78 Min, max 57.0 , 97.0
D. Safety and Effectiveness Results 1. Safety Results
The safety analysis of the sensor performance study (G140053) which included 89 subjects is presented below.
Adverse effects that occurred in the Guardian sensor study:
The safety of the Guardian Sensor was assessed by evaluation of the incidence of all adverse events, Adverse Device Effects (ADEs), Serious Adverse Device Events (SADEs), and Unanticipated Adverse Device Effects (UADEs) experienced by study subjects. Adverse events (AEs) were listed in terms of severity and relationship to device. Sensor insertion site and adhesive area were examined for erythema, edema and infection. The local skin reactions from the insertion site or the adhesive were also evaluated. There were five (5) AEs reported during the study. All adverse events were resolved and subjects recovered completely without residual sequelae:
There was one report of gastroenteritis, thought to be viral infection related.
There was one report of worsening of benign prostatic hypertrophy, requiring foley catheter insertion by the subject’s urologist.
There was one report of rash at the IV site, which cleared up by the next day without intervention.
There was one report of upper respiratory symptoms that resolved. There was one report of a skin blister from skin tac used under tape.

PMA P160017: FDA Summary of Safety and Effectiveness Data Page 45
There were no reports of subject death There were no reports of device-related serious adverse events (SAEs). There were no reports of DKA There were no reports of severe hyperglycemia There were no reports of severe hypoglycemia. There were no reports of non-device-related SAEs. There were no reports of device-related adverse events. The incidence of adverse events directly related to the CGM in the intended use population is not expected to differ significantly from the event rate observed during the Sensor accuracy study (G140053) or those observed for other approved CGM devices. Based on (FDA-analyzed) postmarket adverse event reports for similar CGM devices, no additional concerns regarding adverse events were raised for CGMs.
2. Effectiveness Results
Study results from the Guardian sensor study are presented in Tables 18 to 35.
Tables 18 and 19 below provide the Guardian sensor values and the percent difference with respect to comparator method (CM) values when the sensor was calibrated every 12 hours and when the sensor was calibrated three to four times per day.
Table 18: CGM Difference to CM within Reference Glucose Range, Calibrating Every 12 hours, Abdominal Insertion Site
CM Glucose Ranges (mg/dL)
Number of Paired CGM-CM Pairs
Mean Absolute Percent Difference
(%)
Median Absolute Percent Difference
(%) Overall 12090 10.55 7.84 <40* 12 17.03 16.82 40-60* 353 7.96 7.1 61-80* 1445 9.44 7.55 81-180 6505 9.94 7.14 181-300 3277 10 8 301-350 366 9.63 7.48 351-400 117 9.58 7.58 >400 15 10.85 10.83
*For glucose ranges ≤ 80 mg/dL, the differences in mg/dL are included instead of percent difference (%). Note: Sensor glucose readings are within 40-400 mg/dL.

PMA P160017: FDA Summary of Safety and Effectiveness Data Page 46
Table 19: CGM Difference to CM within CM Glucose Ranges, Calibrating three to four times per day, Abdominal Insertion Site
CM Glucose Ranges (mg/dL)
Number of Paired CGM-CM Pairs
Mean Absolute Percent
Difference (%)
Median Absolute Percent Difference
(%) Overall 11664 9.64 7.08 <40* 11 16.41 15.05 40-60* 324 7.53 6.6 61-80* 1403 8.81 6.75 81-180 6342 9.33 6.62 181-300 3114 8.57 6.98 301-350 341 8.13 6.26 351-400 114 8.56 7.15 >400 15 10.92 10.83
*For glucose ranges ≤ 80 mg/dL, the differences in mg/dL are included instead of percent difference (%). Note: Sensor glucose readings are within 40-400 mg/dL.
Tables 20 and 21 below provide the Guardian sensor values and the percent of data points that fell within 15, 20, 30, 40, and >40 mg/dL or percent of a specific glucose CM range when the sensor was calibrated every 12 hours and when the sensor was calibrated three to four times per day.
Table 20: Agreement (%) of Sensor-CM Paired Points (15/15%- greater than 40/40%) Stratified by Different CM Glucose Ranges, Calibrated every 12 hours, Abdominal Insertion Site CM Glucose Ranges (mg/dL)
Number of
CGM- CM
Pairs
Percent of CGM
Within 15/15% of
CM
Percent of CGM
Within 20/20% of
CM
Percent of CGM
Within 30/30% of
CM
Percent of CGM
Within 40/40% of
CM
Percent of CGM Greater Than 40/40% of CM
Overall 12090 78.8 88.2 96.1 98.9 1.1 <40* 12 41.7 66.7 100 100 0 ≥40-60* 353 87.3 96.9 99.2 100 0 >60-80* 1445 77.9 88.4 98.3 99.7 0.3 >80-180 6505 78.6 87.2 95.3 98.6 1.4 >180-300 3277 79 89.1 96.2 98.9 1.1 >300-350 366 79.5 88.5 95.9 100 0 >350-400 117 76.9 91.5 98.3 100 0 >400 15 86.7 100 100 100 0
*For glucose ranges ≤ 80 mg/dL, agreement was based on 15/20/30/40 mg/dL. Note: Sensor glucose readings are within 40-400 mg/dL

PMA P160017: FDA Summary of Safety and Effectiveness Data Page 47
Table 21: Agreement (%) of Sensor-CM Paired Points (15/15%-greater than 40/40%) Stratified by Different CM Glucose Ranges, Calibrated three to four times per day, Abdominal Insertion Site CM Glucose Ranges (mg/dL)
Number of
CGM- CM
Pairs
Percent of CGM
Within 15/15% of
CM
Percent of CGM
Within 20/20% of
CM
Percent of CGM
Within 30/30% of
CM
Percent of CGM
Within 40/40% of
CM
Percent of CGM
Greater Than
40/40% of CM
Overall 11664 82.6 90.7 96.9 99.1 0.9 <40* 11 45.5 72.7 100 100 0 ≥40-60* 324 89.5 96.6 99.1 100 0 >60-80* 1403 79.9 89.8 98.5 99.9 0.1 >80-180 6342 80.9 89 96.1 98.8 1.2 >180-300 3114 86.4 93.6 97.6 99.3 0.7 >300-350 341 86.5 93 96.8 100 0 >350-400 114 82.5 93 100 100 0 >400 15 86.7 93.3 100 100 0
*For glucose ranges ≤ 80 mg/dL, agreement was based on 15/20/30/40 mg/dL. Note: Sensor glucose readings are within 40-400 mg/dL
The tables 22 to 25 below provide the number and percentage of CM measurements collected while the continuous glucose monitor read ‘low’ (< 40 mg/dL), or ‘high’ (> 400 mg/dL) for sensors calibrated every 12 hours and three to four times per day.
Table 22: The Number and Percentage of CM values collected when CGM readings displayed ‘Low’ (less than 40 mg/dL); calibrating every 12 hours, Abdominal insertion site
CGM Readings
CGM-CM pairs
<55 <60 <70 <80 >80 Total
'LOW'
Cumulative, n
42 77 139 150 4 154
'LOW' Cumulative %
27% 50% 90% 97% 3%
Table 23: The Number and Percentage of CM values collected when CGM readings displayed ‘High’ (more than 400 mg/dL); calibrating every 12 hours, Abdominal insertion site
CGM Readings
CGM-CM pairs
>340 >320 >280 >240 <240 Total
'HIGH'
Cumulative, n 8 9 9 9 0 9 'HIGH' Cumulative %
89% 100% 100% 100% 0%

PMA P160017: FDA Summary of Safety and Effectiveness Data Page 48
Table 24: The Number and Percentage of CM values collected when CGM readings displayed ‘Low’ (less than 40 mg/dL); calibrating three to four times per day, Abdominal insertion site
CGM Readings
CGM-CM pairs
<55 <60 <70 <80 >80 Total
'LOW'
Cumulative, n
33 64 108 119 4 123
'LOW' Cumulative %
27% 52% 88% 97% 3%
Table 25: The Number and Percentage of CM values collected when CGM readings displayed ‘High’ (more than 400 mg/dL); calibrating three to four times per day, Abdominal insertion site
CGM Readings
CGM-CM pairs
>340 >320 >280 >240 <240 Total
'HIGH'
Cumulative, n
8 9 9 9 0 9
'HIGH' Cumulative %
89% 100% 100% 100% 0%
The following tables show the percentage of concurring CGM readings compared to CM values. Tables 21 and 22 show the concurrence of the CGM values compared to CM values when calibrating every 12 hours, and when calibrating every three to four hours, respectively. With ideal performance the CGM readings would match the CM values. For example, with perfect concurrence, the shaded boxes would be 100 percent.

PMA P160017: FDA Summary of Safety and Effectiveness Data Page 49
Table 26: Concurrence of CM values and CGM readings using CM glucose ranges; Calibrating every 12 hours, Abdominal Insertion site
CM Glucose Ranges (mg/dL)
Percent of Matched Pairs-in Each CGM Glucose Range for Each CM Glucose RangeCGM (mg/dL)
Number of
Paired CGM-
CM Values
<40 >=40-60 >60-80 >80-120 >120-160 >160-200 >200-250 >250-300>300-350
>350-400
>400
A) <40 12 0.0% (0/0)
75.0% (9/12)
25.0% (3/12)
0.0% (0/0) 0.0% (0/0) 0.0% (0/0) 0.0% (0/0) 0.0% (0/0)
0.0% (0/0)
0.0% (0/0)
0.0% (0/0)
B) >=40-60
430 17.9% (77/430)
55.8% (240/430)
26.0% (112/430)
0.2% (1/430)
0.0% (0/0) 0.0% (0/0) 0.0% (0/0) 0.0% (0/0)
0.0% (0/0)
0.0% (0/0)
0.0% (0/0)
C) >60-80
1518 4.8% (73/1518)
29.4% (447/1518)
53.4% (811/1518)
12.2% (185/1518)
0.1% (2/1518)
0.0% (0/0) 0.0% (0/0) 0.0% (0/0)
0.0% (0/0)
0.0% (0/0)
0.0% (0/0)
D) >80-120
2885 0.1% (4/2885)
2.9% (83/2885)
13.7% (394/2885)
74.8% (2157/2885)
8.5% (245/2885)
0.1% (2/2885)
0.0% (0/0) 0.0% (0/0)
0.0% (0/0)
0.0% (0/0)
0.0% (0/0)
E) >120-160
2644 0.0% (0/0)
0.1% (2/2644)
1.1% (28/2644)
20.3% (537/2644)
71.3% (1885/2644)
7.1% (188/2644)
0.2% (4/2644)
0.0% (0/0)
0.0% (0/0)
0.0% (0/0)
0.0% (0/0)
F) >160-200
1868 0.0% (0/0)
0.0% (0/0) 0.1% (2/1868)
3.2% (60/1868)
30.2% (565/1868)
60.4% (1128/1868)
5.9% (111/1868)
0.1% (2/1868)
0.0% (0/0)
0.0% (0/0)
0.0% (0/0)
G) >200-250
1534 0.0% (0/0)
0.0% (0/0) 0.0% (0/0) 0.8% (13/1534)
5.1% (79/1534)
34.5% (529/1534)
55.0% (844/1534)
4.3% (66/1534)
0.2% (3/1534)
0.0% (0/0)
0.0% (0/0)
H) >250-300
855 0.0% (0/0)
0.0% (0/0) 0.0% (0/0) 0.0% (0/0) 0.9% (8/855)
3.3% (28/855)
45.5% (389/855)
43.5% (372/855)
6.7% (57/855)
0.1% (1/855)
0.0% (0/0)
I) >300-350
367 0.0% (0/0)
0.0% (0/0) 0.0% (0/0) 0.0% (0/0) 0.0% (0/0) 0.0% (0/0) 8.7% (32/367)
42.2% (155/367)
43.1% (158/367)
5.7% (21/367)
0.3% (1/367)
J) >350-400
124 0.0% (0/0)
0.0% (0/0) 0.0% (0/0) 0.0% (0/0) 0.0% (0/0) 0.0% (0/0) 1.6% (2/124)
10.5% (13/124)
51.6% (64/124)
30.6% (38/124)
5.6% (7/124)
K) >400 16 0.0% (0/0)
0.0% (0/0) 0.0% (0/0) 0.0% (0/0) 0.0% (0/0) 0.0% (0/0) 0.0% (0/0) 0.0% (0/0)
25.0% (4/16)
68.8% (11/16)
6.3% (1/16)

PMA P160017: FDA Summary of Safety and Effectiveness Data Page 50
Table 27: Concurrence of CM values and CGM readings using CM glucose ranges; Calibrating three to four times per day, Abdominal Insertion site
CM Glucose Ranges (mg/dL)
Percent of Matched Pairs-in Each CGM Glucose Range for Each CM Glucose RangeCGM (mg/dL)
Number of
Paired CGM-
CM Values
<40 >=40-60 >60-80 >80-120 >120-160 >160-200 >200-250 >250-300 >300-350 >350-400
>400
A) <40 11 0.0% (0/0)
81.8% (9/11)
18.2% (2/11)
0.0% (0/0) 0.0% (0/0) 0.0% (0/0) 0.0% (0/0) 0.0% (0/0)
0.0% (0/0)
0.0% (0/0)
0.0% (0/0)
B) >=40- 60
388 16.5% (64/388)
55.9% (217/388)
27.3% (106/388)
0.3% (1/388)
0.0% (0/0) 0.0% (0/0) 0.0% (0/0) 0.0% (0/0)
0.0% (0/0)
0.0% (0/0)
0.0% (0/0)
C) >60-80
1458 3.8% (55/1458)
26.8% (391/1458)
56.7% (826/1458)
12.8% (186/1458)
0.0% (0/0) 0.0% (0/0) 0.0% (0/0) 0.0% (0/0)
0.0% (0/0)
0.0% (0/0)
0.0% (0/0)
D) >80- 120
2790 0.1% (4/2790)
2.4% (68/2790)
12.3% (342/2790)
76.5% (2133/2790)
8.6% (241/2790)
0.1% (2/2790)
0.0% (0/0) 0.0% (0/0)
0.0% (0/0)
0.0% (0/0)
0.0% (0/0)
E) >120- 160
2597 0.0% (0/0)
0.0% (1/2597)
1.0% (25/2597)
19.3% (502/2597)
72.2% (1874/2597)
7.2% (188/2597)
0.3% (7/2597)
0.0% (0/0)
0.0% (0/0)
0.0% (0/0)
0.0% (0/0)
F) >160- 200
1821 0.0% (0/0)
0.0% (0/0) 0.1% (2/1821)
2.0% (36/1821)
28.1% (512/1821)
63.5% (1157/1821)
6.2% (112/1821)
0.1% (2/1821)
0.0% (0/0)
0.0% (0/0)
0.0% (0/0)
G) >200- 250
1441 0.0% (0/0)
0.0% (0/0) 0.0% (0/0) 0.4% (6/1441)
3.4% (49/1441)
31.5% (454/1441)
59.5% (858/1441)
5.1% (74/1441)
0.0% (0/0)
0.0% (0/0)
0.0% (0/0)
H) >250- 300
811 0.0% (0/0)
0.0% (0/0) 0.0% (0/0) 0.0% (0/0) 0.6% (5/811)
2.3% (19/811)
39.8% (323/811)
51.0% (414/811)
6.2% (50/811)
0.0% (0/0)
0.0% (0/0)
I) >300- 350
342 0.0% (0/0)
0.0% (0/0) 0.0% (0/0) 0.0% (0/0) 0.0% (0/0) 0.0% (0/0) 4.1% (14/342)
43.6% (149/342)
48.5% (166/342)
3.5% (12/342)
0.3% (1/342)
J) >350- 400
121 0.0% (0/0)
0.0% (0/0) 0.0% (0/0) 0.0% (0/0) 0.0% (0/0) 0.0% (0/0) 0.0% (0/0) 10.7% (13/121)
48.8% (59/121)
34.7% (42/121)
5.8% (7/121)
K) >400 16 0.0% (0/0)
0.0% (0/0) 0.0% (0/0) 0.0% (0/0) 0.0% (0/0) 0.0% (0/0) 0.0% (0/0) 0.0% (0/0)
25.0% (4/16)
68.8% (11/16)
6.3% (1/16)

PMA P160017: FDA Summary of Safety and Effectiveness Data Page 51
The following tables 28 and 29 show the percentage of concurring CM readings compared to CGM values, when calibrating every 12 hours, and when calibrating every three to four hours, respectively. With ideal performance the CGM readings would match the CM values. For example, with perfect concurrence, the shaded boxes would be 100 percent.
Table 28: Concurrence of CGM readings and CM values using CGM glucose ranges; Calibrating every 12 hours, Abdominal insertion site
Percent of Matched Pairs-in Each CM Glucose Range for Each CGM Glucose Range CM Value (mg/dL) CGM
Glucose Ranges (mg/dL)
Number of
Paired CGM-
CM Values <40 >=40-60 >60-80 >80-120 >120-160 >160-200 >200-250 >250-300 >300-350
>350-400 >400
A) <40 154 0.0% (0/0)
50.0% (77/154)
47.4% (73/154)
2.6% (4/154)
0.0% (0/0) 0.0% (0/0) 0.0% (0/0) 0.0% (0/0) 0.0% (0/0)
0.0% (0/0)
0.0% (0/0)
B)>=40- 60
781 1.2% (9/781)
30.7% (240/781)
57.2% (447/781)
10.6% (83/781)
0.3% (2/781)
0.0% (0/0) 0.0% (0/0) 0.0% (0/0) 0.0% (0/0)
0.0% (0/0)
0.0% (0/0)
C) >60-80
1350 0.2% (3/1350)
8.3% (112/1350)
60.1% (811/1350)
29.2% (394/1350)
2.1% (28/1350)
0.1% (2/1350)
0.0% (0/0) 0.0% (0/0) 0.0% (0/0)
0.0% (0/0)
0.0% (0/0)
D) >80 - 120
2953 0.0% (0/0)
0.0% (1/2953)
6.3% (185/2953)
73.0% (2157/2953)
18.2% (537/2953)
2.0% (60/2953)
0.4% (13/2953)
0.0% (0/0) 0.0% (0/0)
0.0% (0/0)
0.0% (0/0)
E) >120-160
2784 0.0% (0/0)
0.0% (0/0) 0.1% (2/2784)
8.8% (245/2784)
67.7% (1885/2784)
20.3% (565/2784)
2.8% (79/2784)
0.3% (8/2784)
0.0% (0/0)
0.0% (0/0)
0.0% (0/0)
F) >160-200
1875 0.0% (0/0)
0.0% (0/0) 0.0% (0/0) 0.1% (2/1875)
10.0% (188/1875)
60.2% (1128/1875)
28.2% (529/1875)
1.5% (28/1875)
0.0% (0/0)
0.0% (0/0)
0.0% (0/0)
G) >200-250
1382 0.0% (0/0)
0.0% (0/0) 0.0% (0/0) 0.0% (0/0) 0.3% (4/1382)
8.0% (111/1382)
61.1% (844/1382)
28.1% (389/1382)
2.3% (32/1382)
0.1% (2/1382)
0.0% (0/0)
H) >250-300
608 0.0% (0/0)
0.0% (0/0) 0.0% (0/0) 0.0% (0/0) 0.0% (0/0) 0.3% (2/608)
10.9% (66/608)
61.2% (372/608)
25.5% (155/608)
2.1% (13/608)
0.0% (0/0)

PMA P160017: FDA Summary of Safety and Effectiveness Data Page 52
Percent of Matched Pairs-in Each CM Glucose Range for Each CGM Glucose Range CM Value (mg/dL) CGM
Glucose Ranges (mg/dL)
Number of
Paired CGM-
CM Values <40 >=40-60 >60-80 >80-120 >120-160 >160-200 >200-250 >250-300 >300-350
>350-400 >400
I) >300- 350
286 0.0% (0/0)
0.0% (0/0) 0.0% (0/0) 0.0% (0/0) 0.0% (0/0) 0.0% (0/0) 1.0% (3/286)
19.9% (57/286)
55.2% (158/286)
22.4% (64/286)
1.4% (4/286)
J) >350- 400
71 0.0% (0/0)
0.0% (0/0) 0.0% (0/0) 0.0% (0/0) 0.0% (0/0) 0.0% (0/0) 0.0% (0/0) 1.4% (1/71)
29.6% (21/71)
53.5% (38/71)
15.5% (11/71)
K) >400 9 0.0% (0/0)
0.0% (0/0) 0.0% (0/0) 0.0% (0/0) 0.0% (0/0) 0.0% (0/0) 0.0% (0/0) 0.0% (0/0) 11.1% (1/9)
77.8% (7/9)
11.1% (1/9)

PMA P160017: FDA Summary of Safety and Effectiveness Data Page 53
Table 29: Concurrence of CGM readings and CM values using CGM glucose ranges; Calibrating three to four times per day, Abdominal insertion site
Percent of Matched Pairs-in Each CM Glucose Range for Each CGM Glucose Range CM (mg/dL) CGM
Glucose Ranges (mg/dL)
N of Paired CGM-
CM Values <40 >=40-60 >60-80 >80-120 >120-160 >160-200 >200-250 >250-300 >300-350 >350-400>400
A) <40 123 0.0% (0/0)
52.0% (64/123)
44.7% (55/123)
3.3% (4/123)
0.0% (0/0) 0.0% (0/0)
0.0% (0/0) 0.0% (0/0) 0.0% (0/0) 0.0% (0/0)
0.0% (0/0)
B)>=40- 60
686 1.3% (9/686)
31.6% (217/686)
57.0% (391/686)
9.9% (68/686)
0.1% (1/686)
0.0% (0/0)
0.0% (0/0) 0.0% (0/0) 0.0% (0/0) 0.0% (0/0)
0.0% (0/0)
C) >60- 80
1303 0.2% (2/1303)
8.1% (106/1303)
63.4% (826/1303)
26.2% (342/1303)
1.9% (25/1303)
0.2% (2/1303)
0.0% (0/0)
0.0% (0/0) 0.0% (0/0) 0.0% (0/0)
0.0% (0/0)
D) >80- 120
2864 0.0% (0/0)
0.0% (1/2864)
6.5% (186/2864)
74.5% (2133/2864)
17.5% (502/2864)
1.3% (36/2864)
0.2% (6/2864)
0.0% (0/0) 0.0% (0/0) 0.0% (0/0)
0.0% (0/0)
E) >120- 160
2681 0.0% (0/0)
0.0% (0/0) 0.0% (0/0)
9.0% (241/2681)
69.9% (1874/2681)
19.1% (512/2681)
1.8% (49/2681)
0.2% (5/2681)
0.0% (0/0) 0.0% (0/0)
0.0% (0/0)
F) >160- 200
1820 0.0% (0/0)
0.0% (0/0) 0.0% (0/0)
0.1% (2/1820)
10.3% (188/1820)
63.6% (1157/1820)
24.9% (454/1820)
1.0% (19/1820)
0.0% (0/0) 0.0% (0/0)
0.0% (0/0)
G)>200-250
1314 0.0% (0/0)
0.0% (0/0) 0.0% (0/0)
0.0% (0/0)
0.5% (7/1314)
8.5% (112/1314)
65.3% (858/1314)
24.6% (323/1314)
1.1% (14/1314)
0.0% (0/0)
0.0% (0/0)
H)>250- 300
652 0.0% (0/0)
0.0% (0/0) 0.0% (0/0)
0.0% (0/0)
0.0% (0/0) 0.3% (2/652)
11.3% (74/652)
63.5% (414/652)
22.9% (149/652)
2.0% (13/652)
0.0% (0/0)
I) >300- 350
279 0.0% (0/0)
0.0% (0/0) 0.0% (0/0)
0.0% (0/0)
0.0% (0/0) 0.0% (0/0) 0.0% (0/0)
17.9% (50/279)
59.5% (166/279)
21.1% (59/279)
1.4% (4/279)

PMA P160017: FDA Summary of Safety and Effectiveness Data Page 54
Percent of Matched Pairs-in Each CM Glucose Range for Each CGM Glucose Range CM (mg/dL) CGM
Glucose Ranges (mg/dL)
N of Paired CGM-
CM Values <40 >=40-60 >60-80 >80-120 >120-160 >160-200 >200-250 >250-300 >300-350 >350-400>400
J) >350- 400
65 0.0% (0/0)
0.0% (0/0) 0.0% (0/0)
0.0% (0/0)
0.0% (0/0) 0.0% (0/0) 0.0% (0/0)
0.0% (0/0)
18.5% (12/65)
64.6% (42/65)
16.9% (11/65)
K) >400
9 0.0% (0/0)
0.0% (0/0) 0.0% (0/0)
0.0% (0/0)
0.0% (0/0) 0.0% (0/0) 0.0% (0/0)
0.0% (0/0)
11.1% (1/9)
77.8% (7/9)
11.1% (1/9)

PMA P160017: FDA Summary of Safety and Effectiveness Data Page 55
Tables 30 and 31 show the sensor stability by comparing the CM values collected during frequent sample testing days 1, 3, and 7 to their paired sensor points. The tables stratify the paired CM-sensor data by 15/15, 20/20, 30/30, 40/40 and >40/40 mg/dL and percent, respectively. Table 30: Sensor Stability (accuracy over time) for Calibration every 12 hours
Day of Wear
No. of Paired System
CM
Mean absolute percent
difference (%)
Medianabsolute percent
difference (%)
Percent within
15/15% CM
Percent within
20/20% CM
Percent within
30/30% CM
Percent within
40/40% CM
Percentgreater than
40/40% CM
1 4294 13.0 10.2 68.3 81 93.1 97.9 2.13 4533 8.9 6.9 86.6 93.8 98.2 99.5 0.57 3263 9.5 6.8 81.9 90.1 97 99.2 0.8
Table 31: Sensor Stability (accuracy over time) for Calibration three to four times per day
Table 28: Sensor Stability (accuracy
Number of
Paired System
CM
Mean absolute percent difference (%)
Median absolute percent difference(%)
Percent within
15/15% CM
Percent within
20/20% CM
Percent within
30/30% CM
Percent within
40/40% CM
Percentgreater than
40/40% CM
1 4136 11.7 8.8 74.4 85.3 94.6 98.2 1.83 4378 8.3 6.3 88.3 94.8 98.6 99.7 0.37 3150 8.7 6.2 85.5 92.1 97.7 99.6 0.4
The tables 32 and 33 below provide the percent agreement of Guardian Sensor (3) and comparator method (CM) within a specific time range after calibration. Tables x and x below provides that the percent agreement within 15, 20, 30, 40, and >40 % mg/dL is highest from zero to two hours after calibration for sensors calibrated every 12 hours and three to four times per day, respectively.
Table 32: Agreement Rates for Every 2 Hr. Period Post Calibration, Calibrating every 12 hours
Time after calibration
No. paired CM-sensor points
Percentage (%) Agreement
± 15% (± 15 mg/dL)
± 20% (± 20 mg/dL)
± 30% (± 30 mg/dL)
± 40% (± 40 mg/dL)
> ±40% (± 40 mg/dL)
0–2 hours 2999 85 92.6 97.8 99.6 0.4
2–4 hours 2667 75.1 85.9 95.3 98.8 1.2
4–6 hours 2138 71.4 82 92.7 97.6 2.4
6–8 hours 1521 77.6 88.4 97 99.3 0.7
8–10 hours 1523 84.2 91.1 97.6 99.3 0.7
10–12 hours 1242 79.8 89.5 96.3 98.6 1.4

PMA P160017: FDA Summary of Safety and Effectiveness Data Page 56
Table 33: Agreement Rates for Every 2 Hour Period Post Calibration, Calibrating three to four times per day
Time after calibration
No. paired CM-sensor points
Percentage (%) Agreement
± 15%
(± 15 mg/dL)
± 20%
(± 20 mg/dL)
± 30%
(± 30 mg/dL)
± 40%
(± 40 mg/dL)
> ±40%
(± 40 mg/dL)
0-2 hours
4585
87 93.5 98.1 99.7
0.3
2-4 hours
3949
80.7 89.9 96.7 99
1
4-6 hours
2856
78.7 87.6 95.5 98.5
1.5
6-8 hours
227
74.9 86.3 96.9 99.6
0.4
8-10 hours
35
82.9 85.7 91.4 94.3
5.7
10-12 hours
12
91.7 91.7 91.7 100
0
The tables 34 and 35 below provided data to present sensor accuracy over specific glucose rates of change. The concurrence tables below provided the percent of matched CM pairs to CGM values over specific glucose rates of change for sensors calibrated every 12 hours and three to four times per day, respectively.
Table 34: Calibration every 12 hours
CGM Rate Ranges (mg/dL/min)
Percent of Matched Pairs in Each CM Rate Range for Each CGM Rate RangeCM (mg/dL/min) No. of Paired CGM-
<-3
[-3, -2)
[-2, -1)
[-1, 1]
(1, 2]
(2, 3]
>3
≤ 3
27
25.9% (7/27)
22.2% (6/27)
25.9% (7/27)
22.2% (6/27)
3.7% (1/27)
0.0% (0/0)
0.0% (0/0)
[-3, -2)
135
5.9% (8/135)
30.4% (41/135)
43.0% (58/135)
20.7% (28/135)
0.0% (0/0)
0.0% (0/0)
0.0% (0/0)
[-2, -1)
1001
0.5% (5/1001)
4.3% (43/1001)
39.9% (399/1001
55.0% (551/1001)
0.3% (3/1001)
0.0% (0/0)
0.0% (0/0)
[-1, 1]
9477
0.2% (16/9477)
0.2% (21/9477)
2.6% (246/9477
92.7% (8781/9477
4.0% (375/9477
0.3% (29/9477)
0.1% (9/9477)
(1, 2]
1059
0.1% (1/1059)
0.0% (0/0)
0.4% (4/1059)
42.4% (449/1059)
48.6% (515/1059
7.6% (80/1059)
0.9% (10/1059)
(2, 3]
308
0.0% (0/0)
0.0% (0/0)
0.0% (0/0)
11.0% (34/308)
46.4% (143/308)
35.4% (109/308)
7.1% (22/308)
> 3
83
0.0% (0/0)
0.0% (0/0)
0.0% (0/0)
7.2% (6/83)
20.5% (17/83)
34.9% (29/83)
37.3% (31/83)
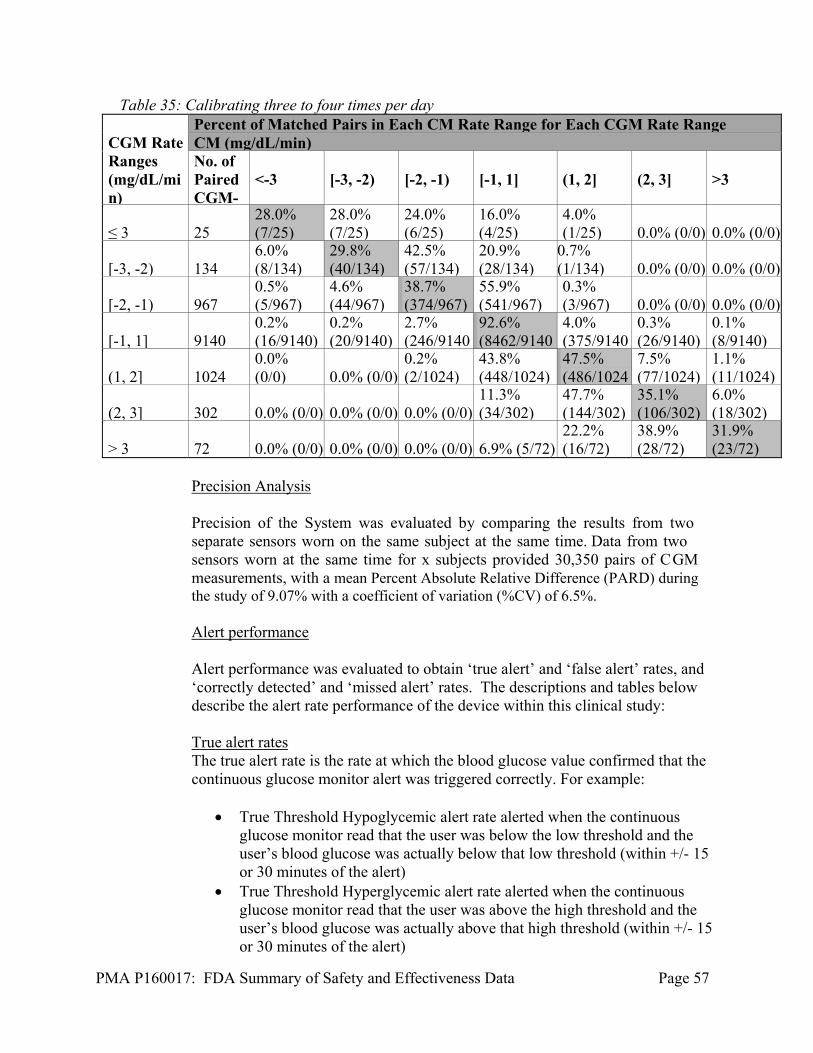
PMA P160017: FDA Summary of Safety and Effectiveness Data Page 57
Table 35: Calibrating three to four times per day CGM Rate Ranges (mg/dL/min)
Percent of Matched Pairs in Each CM Rate Range for Each CGM Rate RangeCM (mg/dL/min) No. of Paired CGM-
<-3
[-3, -2)
[-2, -1)
[-1, 1]
(1, 2]
(2, 3]
>3
≤ 3
25
28.0% (7/25)
28.0% (7/25)
24.0% (6/25)
16.0% (4/25)
4.0% (1/25)
0.0% (0/0)
0.0% (0/0)
[-3, -2)
134
6.0% (8/134)
29.8% (40/134)
42.5% (57/134)
20.9% (28/134)
0.7% (1/134)
0.0% (0/0)
0.0% (0/0)
[-2, -1)
967
0.5% (5/967)
4.6% (44/967)
38.7% (374/967)
55.9% (541/967)
0.3% (3/967)
0.0% (0/0)
0.0% (0/0)
[-1, 1]
9140
0.2% (16/9140)
0.2% (20/9140)
2.7% (246/9140
92.6% (8462/9140
4.0% (375/9140
0.3% (26/9140)
0.1% (8/9140)
(1, 2]
1024
0.0% (0/0)
0.0% (0/0)
0.2% (2/1024)
43.8% (448/1024)
47.5% (486/1024
7.5% (77/1024)
1.1% (11/1024)
(2, 3]
302
0.0% (0/0)
0.0% (0/0)
0.0% (0/0)
11.3% (34/302)
47.7% (144/302)
35.1% (106/302)
6.0% (18/302)
> 3
72
0.0% (0/0)
0.0% (0/0)
0.0% (0/0)
6.9% (5/72)
22.2% (16/72)
38.9% (28/72)
31.9% (23/72)
Precision Analysis
Precision of the System was evaluated by comparing the results from two separate sensors worn on the same subject at the same time. Data from two sensors worn at the same time for x subjects provided 30,350 pairs of CGM measurements, with a mean Percent Absolute Relative Difference (PARD) during the study of 9.07% with a coefficient of variation (%CV) of 6.5%.
Alert performance
Alert performance was evaluated to obtain ‘true alert’ and ‘false alert’ rates, and ‘correctly detected’ and ‘missed alert’ rates. The descriptions and tables below describe the alert rate performance of the device within this clinical study:
True alert rates The true alert rate is the rate at which the blood glucose value confirmed that the continuous glucose monitor alert was triggered correctly. For example:
True Threshold Hypoglycemic alert rate alerted when the continuous
glucose monitor read that the user was below the low threshold and the user’s blood glucose was actually below that low threshold (within +/- 15 or 30 minutes of the alert)
True Threshold Hyperglycemic alert rate alerted when the continuous glucose monitor read that the user was above the high threshold and the user’s blood glucose was actually above that high threshold (within +/- 15 or 30 minutes of the alert)

PMA P160017: FDA Summary of Safety and Effectiveness Data Page 58
True Predictive Hypoglycemic alert rate alerted when the continuous glucose monitor predicted that the user would reach below the low threshold and the user’s blood glucose was actually below that low threshold within 15 or 30 minutes following the alert
True Predictive Hyperglycemic alert rate alerted when the continuous glucose monitor predicted that the user would reach above the high threshold and the user’s blood glucose was actually above that high threshold within 15 or 30 minutes following the alert.
Table 36: Glucose TRUE Alert Performance using every 12 hours
Threshold Only Predictive Only Threshold & Predictive
mg/dL 30 min
15 min
mg/dL 30 min
15 min
mg/dL 30 min 15 min
Glucose True Alert Rate: Low glucose Alerts
50 25.0% 25.0% 50 15.2% 12.3%
50 18.2% 16.2%
60 53.5% 51.9% 60 40.7% 37.1%
60 46.2% 43.4%
70 66.9% 66.9% 70 52.7% 47.7%
70 58.3% 55.2%
80 69.3% 69.3% 80 57.8% 51.1%
80 62.2% 58.2%
90 75.1% 74.4% 90 64.0% 58.5%
90 67.9% 64.3%
Glucose True Alert Rate: High glucose Alerts
300 81.3% 81.3% 300 57.8% 54.0%
300 65.4% 62.7%
250 90.2% 90.2% 250 64.0% 60.1%
250 72.5% 69.8%
220 91.9% 91.9% 220 68.9% 66.3%
220 76.6% 74.8%
180 93.7% 92.8% 180 70.5% 66.9%
180 78.0% 75.4%
False Alert Rates
The glucose false alert rate is the rate at which the blood glucose value did not confirm that the continuous glucose monitor alert was triggered correctly. For example:
False Threshold Hypoglycemic alert rate the alarm alerted when the
continuous glucose monitor read that the user was below the low threshold but the users blood glucose was actually above that low threshold (within +/- 15 or 30 minutes of the alert); or
False Threshold Hyperglycemic alert rate the alarm alerted when the continuous glucose monitor read that the user was above the high threshold but the user’s blood glucose was actually below that high threshold(within +/- 15 or 30 minutes of the alert); or

PMA P160017: FDA Summary of Safety and Effectiveness Data Page 59
False Predictive Hypoglycemic alert rate the alarm alerted when the continuous glucose monitor predicted that the user would be below the low threshold but the user’s blood glucose was actually above that low threshold within 15 or 30 minutes following the alert.
False Predictive Hyperglycemic alert rate the alarm alerted when the continuous glucose monitor predicted that the user would be above the high threshold but the user’s blood glucose was actually below the high threshold within 15 or 30 minutes following the alert.
Table 37: Glucose FALSE Alert Performance calibrating every 12 hours
Threshold Only Predictive Only Threshold & Predictive mg/dL 30
min 15 min mg/d
L 30
min 15 min mg/dL 30 min 15
min Glucose False Alert Rate: Low Glucose Alerts
50 75.0% 75.0% 50 84.8% 87.7% 50 81.8% 83.8%
60 46.5% 48.1% 60 59.3% 62.9% 60 53.8% 56.6%
70 33.1% 33.1% 70 47.3% 52.3% 70 41.7% 44.8%
80 30.7% 30.7% 80 42.2% 48.9% 80 37.8% 41.8%
90 24.9% 25.6% 90 36.0% 41.5% 90 32.1% 35.7%
Glucose False Alert Rate: High Glucose Alerts
300 18.8% 18.8% 300 42.2% 46.0% 300 34.6% 37.3%
250 9.80% 9.80% 250 36.0% 39.9% 250 27.5% 30.2%
220 8.10% 8.10% 220 31.1% 33.7% 220 23.4% 25.2%
180 6.30% 7.20% 180 29.5% 33.1% 180 22.0% 24.6%

PMA P160017: FDA Summary of Safety and Effectiveness Data Page 60
Correct Detection Rates Glucose Correct Detection Rate is the rate that the device alerted when it should have alerted. For example, the blood glucose was below the hypoglycemic threshold, or above the hyperglycemic threshold, and the device sounded an alert (within +/- 15 or 30 minutes for the threshold alerts, and within 15 or 30 minutes following predictive alerts).
Table 38: Glucose Correct Detection Alert Performance calibrating every 12 hours
Threshold Only Predictive Only Threshold & Predictive mg/dL 30
min 15 min mg/d
L 30
min 15 min mg/dL 30 min 15
min Glucose Correct Detection Rate: Low Glucose Alerts
50 64.0% 64.0% 50 76.0% 68.0% 50 76.0% 68.0%
60 83.3% 82.1% 60 94.0% 88.1% 60 94.0% 89.3%
70 90.5% 90.5% 70 94.2% 89.8% 70 94.2% 92.0%
80 87.2% 87.2% 80 93.6% 87.2% 80 93.6% 89.9%
90 91.1% 88.7% 90 94.6% 89.5% 90 95.7% 92.2%
Glucose Correct Detection Rate: High Glucose Alerts
300 75.3% 75.3% 300 95.3% 92.9% 300 95.3% 94.1%
250 81.5% 80.9% 250 96.5% 91.3% 250 96.5% 93.6%
220 90.1% 89.2% 220 94.8% 93.5% 220 95.3% 94.4%
180 93.1% 91.4% 180 96.6% 93.4% 180 96.9% 95.4%

PMA P160017: FDA Summary of Safety and Effectiveness Data Page 61
Missed Detection Rates The Missed Detection Rate is the rate that the device did not alert when it should have (within +/- 15 or 30 minutes for the threshold alerts, and within 15 or 30 minutes following predictive alerts). For example, the blood glucose was below the hypoglycemic threshold, or above the hyperglycemic threshold, and the device did not sound a threshold or predictive alert.
Table 39: Glucose Missed Detection Alert Performance calibrating every 12 hours
Threshold Only Predictive Only Threshold & Predictive mg/dL 30
min 15 min mg/d
L 30
min 15 min mg/dL 30 min 15
min Glucose Missed Detection Rate: Low Glucose Alerts
50 36.0% 36.0% 50 24.0% 32.0% 50 24.0% 32.0%
60 16.7% 17.9% 60 6.0% 11.9% 60 6.0% 10.7%
70 9.5% 9.5% 70 5.8% 10.2% 70 5.8% 8.0%
80 12.8% 12.8% 80 6.4% 12.8% 80 6.4% 10.1%
90 8.9% 11.3% 90 5.4% 10.5% 90 4.3% 7.8%
Glucose Missed Detection Rate: High Glucose Alerts
300 24.7% 24.7% 300 4.7% 7.1% 300 4.7% 5.9%
250 18.5% 19.1% 250 3.5% 8.7% 250 3.5% 6.4%
220 9.9% 10.8% 220 5.2% 6.5% 220 4.7% 5.6%
180 6.9% 8.6% 180 3.4% 6.6% 180 3.1% 4.6%
3. Sub Group Analysis
Guardian sensor performance and 670G System performance was evaluated within study population subgroups, such as the frequent sampling participation group, age (14-21 years old, 22 years old and above), body mass index (BMI), baseline HbA1c, prior continuous glucose monitor experience, prior pump experience, and exercise activity (during in-clinic and hotel portions of the study). Although the studies were not powered for analysis of subpopulations, no significant differences in performance were noted based on these subgroup analyses. However, it should be noted that the system was not evaluated in pump naïve users.
4. Pediatric Extrapolation In this premarket application, existing clinical data was not leveraged to support approval of a pediatric patient population.
E. Financial Disclosure
The Financial Disclosure by Clinical Investigators regulation (21 CFR 54) requires applicants who submit a marketing application to include certain information concerning the compensation to, and financial interests and arrangement of, any

PMA P160017: FDA Summary of Safety and Effectiveness Data Page 62
clinical investigator conducting clinical studies covered by the regulation. The pivotal clinical study included 10 investigators. The sensor performance (Guardian Sensor study) included 6 investigators. None of the clinical investigators had disclosable financial interests/arrangements as defined in sections 54.2(a), (b), (c), and (f). The information provided does not raise any questions about the reliability of the data.
X. SUMMARY OF SUPPLEMENTAL CLINICAL INFORMATION
Continued Access Study Subjects in the pivotal study were given the opportunity to extend the use of their 670G systems study devices for a period of up to 2 years after the end of the study period or until, the device is available commercially (if approved). If subjects chose to participate in this optional continued access program, they retained the study devices at the end of study period (or received them back in the event they had been returned to study staff). During the continued access period, subjects were scheduled to come in for office visits every 3 months. At each of the quarterly visits, subjects were asked about the occurrence of adverse events and device complaints. The purpose of the continued access study was to obtain additional safety information regarding the device. The data provided for the continued access study was collected through April 26, 2016; the earliest date of subject entry into the continued access study was October 23, 2015. The continuation phase included a total of 99 of the 123 subjects who were enrolled in the clinical study (approved under G140167). As of April 26, 2016, one subject had withdrawn from the study due to a severe hypoglycemic event that required assistance (subject number 294005007; see table below). This episode was due to the subject over-treating their blood glucose (over bolus); the subject was not in Auto Mode at the time of the incident. The following is a description of the adverse events and device complaints collected through April 26, 2016: There were sixteen adverse events reported from all sites during the continued access phase. Of these adverse events, three were device related.

PMA P160017: FDA Summary of Safety and Effectiveness Data Page 63
Table 40: Adverse Events
Subject Adverse Event Onset Date
Medical Diagnosis
Outcome Device related?
294002006 20160202 Giant Papillary Conjunctivitis
Recovered without sequela
NO
294002013 20160326 Severe Hypoglycemia
Recovered without sequela
NO
294003001 20160115 Right medial meniscus tear
Ongoing NO
294003001 20160123 Vomiting Recovered without sequela
NO
294003001 20160310 Allergies Recovered without sequela
NO
294003002 20160331 Severe Hyperglycemia
Recovered without sequela
YES
294003004 20160410 Severe Hyperglycemia
Recovered without sequela
NO
294003006 20160222 Tooth Pain Recovered without sequela
NO
294005003 20160105 Severe Hyperglycemia
Recovered without sequela
NO
294005007 20160410 Severe hypoglycemia
Recovered without sequela
NO
294006002 20160123 upper respiratory infection
Recovered without sequela
NO
294006003 20160324 Impacted wisdom teeth
Recovered Without Sequela
NO
294006003 20160309 Severe Hyperglycemia
Recovered Without Sequela
YES
294006008 20160210 upper respiratory infection
Recovered Without Sequela
NO
294006010 20160324 suicide ideation
Recovered Without Sequela
NO
294007012 20160107 Infection Recovered Without Sequela
YES
Post-Approval Study As a condition of approval, Medtronic must perform a confirmatory (post-market) study for the 670G System. The purpose of this prospective, controlled study will be to collect additional data on the safety and effectiveness of the 670G System in adult and pediatric

PMA P160017: FDA Summary of Safety and Effectiveness Data Page 64
patients with type 1 diabetes in the home setting. A diverse population of patients with type 1 diabetes will be studied. This should be submitted within 30-days of approval. Predictive Suspend (‘Suspend before Low’) Evaluation The Predictive Low Glucose Management Study was conducted to evaluate the ‘Suspend before low’ feature (discussed in the device description above). The Predictive Low Glucose Management contains the ‘Suspend on Low’ and ‘Suspend before Low’ features. The study was a multi-center, single arm, in-clinic study. The study (approved under G140052) was conducted in 71 subjects with type 1 diabetes (age 14-75 years old) enrolled at eight investigational centers to complete the study with the Guardian Sensor during a 1 day study. Subjects were evaluated in an in-clinic setting with the induction of hypoglycemia. The aim of the study was to determine the safety of the Predictive Low Glucose Management Feature, and to determine whether blood glucose increased over 250 mg/dL within 4 hours of the insulin delivery suspension associated with the tool. Five (5) adverse events (AE) were reported during the study. There were four (4) adverse events that were neither device nor product related. These included the following: One upper respiratory infection One mild back strain One emesis One headache
There was one adverse event that was procedure related (diagnosed as pain). Three adverse events were reported as recovered without sequelae (emesis, headache, and procedure related event). Two events were still ongoing (upper respiratory infection and mild back strain) at the end of the subjects’ study participation. Data supported that the ‘Suspend on Low’ feature was adequately safe for use in the 670G System. G130040: In-Clinic Feasibility Study to Observe the Hybrid Closed Loop System The applicant conducted a multi-phased, multi-center feasibility study to evaluate the safety of the device and the algorithms used in the system prior to the pivotal study. Subjects with Type 1 diabetes were enrolled in up to six investigational centers. The table below describes the phase and purpose of the study phase, along with summary of results and device configuration.

PMA P160017: FDA Summary of Safety and Effectiveness Data Page 65
Table 41: Study Phase, Purpose, and Summary of Results Phase Purpose Summary of Results Device Configuration
Exploratory A Phase (n=8)
Exploratory A Phase was to provide data about all safeguards except the insulin limit safeguard.
No adverse events related to the algorithm were reported.
Closed-loop glucose control was performed using a proportional integral derivative-based controller without implementing insulin limits (no specific device configuration).
Exploratory B Phase (n=8)
Exploratory B Phase was to determine the insulin limit (UMAX) and establish a safe duration of insulin delivery at UMAX.
It was concluded that it is safe to continuously deliver insulin at the calculated UMAX rate for up to four hours without causing any major hypoglycemia-related safety concerns.
Insulin infusion study (no specific device configuration).
Phase 1 (n=16)
Phase 1 was to establish safety using the worst-case sensor errors that would allow entry into closed-loop mode.
The results demonstrated that with the system’s maximum allowable sensor error that still allowed subjects to enter closed loop, safe and effective glycemic control could be maintained.
An artificial calibration error was induced at the initiation of closed-loop to force the sensor to over-read or under-read (no specific device configuration).
Phase 2 (n=14)
Phase 2 was conducted to evaluate the HCL system in a monitored setting (clinic or hotel) for a 3 day period with the following stressors: missed meal bolus, exercise, missed transmission.
The average (SD) sensor glucose time in-range (between 70 – 180 mg/dL) was 65.8% (16.2) with a min-max range of 29.8% – 87.0%. No adverse events related to the algorithm were reported.
Phase 2 of the study was performed using the Auto Mode with the Revel 2.0 Pump and a modified, Android phone-based control algorithm.
Phase 3 (n=8)
This phase was conducted to evaluate the HCL feature in a monitored setting (clinic or hotel/house) for 12 days/11 nights with the following
The average (SD) sensor glucose time in range (between 70 – 180 mg/dL) was 69.3% (8.9) with a min-max range of 58.0% – 82.0%. No
Phase 3 was performed using the Auto Mode control algorithm system with the 670G Pump (MMT-1580) and the Enlite 3 Sensor.

PMA P160017: FDA Summary of Safety and Effectiveness Data Page 66
stressors: missed meal bolus, exercise, induced missed sensor signal transmission.
adverse events related to the algorithm were reported.
Phase 4 (n=10)
This phase evaluated the HCL feature in a monitored setting for 12 days/11 nights with only the exercise stressor, to simulate actual use of the system.
The average (SD) sensor glucose (SG) percentage of time between 70–180 mg/dL and <70 mg/dL were 76.1% (8.5%) and 0.7% (0.7%), respectively. There were no adverse events reported related to the algorithm.
Phase 4 was performed using Auto Mode with the 670G Pump (MMT-1580) and the Enlite 3 Sensor.
Phase 5 (n=4)
This phase evaluated the system when used by pediatric subjects (7-13 years old) in a monitored setting (clinic, hotel or house) for seven days and six nights.
The average sensor glucose (SG) percentage of time between 70–180 mg/dL and <70 mg/dL were 60% and 0.5%, respectively. There were no reported adverse events related to the algorithm.
Phase 6 was performed using Auto Mode with the 670G Pump (MMT-1580) and the Enlite 3 Sensor.
Phase 6 (not complete)
This phase will evaluated the system when used by pediatric subjects (2-6 years old) in a monitored setting (clinic, hotel or house) for seven days and six nights. This phase has commenced.
This phase has not commenced.
Phase 7 will be performed using the Auto Mode with the 670G Pump (MMT-1580) and the Enlite 3 Sensor.
XI. PANEL MEETING RECOMMENDATION AND FDA’S POST-PANEL ACTION
In accordance with the provisions of section 515(c)(2) of the act as amended by the Safe Medical Devices Act of 1990, this PMA was not referred to the Clinical Chemistry and Clinical Toxicology Devices Panel, an FDA advisory committee.
PMA P160017: FDA Summary of Safety and Effectiveness Data Page 67
XII. CONCLUSIONS DRAWN FROM PRECLINICAL AND CLINICAL STUDIES A. Effectiveness Conclusions
The results of the clinical studies performed to support this submission establish a reasonable assurance of effectiveness that the MiniMed 670G System can automatically adjust basal insulin rates based on continuous glucose monitor sensor values. Additionally, a reasonable assurance has been demonstrated that the system can detect trends and track patterns and temporarily suspend and resume the delivery of insulin when used as intended, as an adjunct to blood glucose testing in subjects with type 1 diabetes mellitus. The effectiveness of the Guardian sensor component was based on the performance evaluation of the Guardian Sensor compared to the blood glucose values measured by the CM during in-clinic sessions spanning the wear period of the sensor (7 days). The performance data presented above (Tables 18 to 35) established the sensor performance across the claimed measuring range (40 to 400 mg/dL glucose), the precision, and the calibration frequency (calibrate minimally every 12 hours or 3-4 times a day) of the 7 day wear period for the Guardian sensor. The performance data presented above also established the performance of the alarms and alerts of the Guardian sensor. The results of the clinical studies performed to support approval establish a reasonable assurance that the MiniMed 670G system is effective for its intended use.
B. Safety Conclusions
An understanding of the risks of the device are based on nonclinical laboratory data as well as on data collected in the clinical studies conducted to support PMA approval that are described above. The following events are possible adverse device effects of inserting a sensor into your skin: local infection, inflammation, pain or discomfort, bleeding at the glucose sensor insertion site, bruising, itching, scarring or skin discoloration, hematoma, tape irritation, sensor or needle fracture during insertion, wear or removal.
Potential device related non serious events include: Skin irritation or redness Infection Pain or discomfort Bruising Edema Rash Bleeding Induration of skin Allergic reaction to adhesives

PMA P160017: FDA Summary of Safety and Effectiveness Data Page 68
Hyperglycemia following inadequate or suspension of insulin delivery (which can result from catheter occlusion, hardware or software malfunction, or erroneous CGM readings)
Ketosis following inadequate or suspension of insulin delivery (which can result from catheter occlusion, hardware or software malfunction, or erroneous CGM readings)
Hypoglycemia resulting from insulin over-delivery (which can result from catheter occlusion, hardware or software malfunction, or erroneous CGM readings)
Sensor breakage with fragments retained under the skin is a potential adverse event related to use of the CGM component of the 670G system, but this was not observed during these studies. Based on postmarket experience with similar devices and the results observed in these clinical studies, the occurrence and severity of these events do not raise major concerns. Infection at the insulin pump infusion set insertion site and sensor insertion site is a potential complication related to insertion of the CGM or the insulin pump infusion set. Based on post-market experience with similar devices, and the results observed in these clinical studies, the occurrence and severity of these events are not expected to be different from other approved infusion sets and CGM devices, and so do not pose an unreasonable risk. The continuous glucose sensor readings (together with blood glucose meter readings) are used by the 670G System to determine automated insulin delivery, including insulin suspension and insulin dosing, and are the basis for alerts for hypoglycemia and hyperglycemia. The continuous glucose sensor readings are also to be used by the patient for tracking and trending, when in Manual Mode. While in manual mode, the continuous glucose sensor readings are intended to be used adjunctively (i.e., confirmatory blood glucose meter readings should be used for diabetes treatment decisions) for tracking and trending of blood sugars. The consequences of a false positive (falsely high) glucose reading on the continuous glucose meter would be potential over-delivery of insulin via automated insulin delivery, which has the potential to lead to severe hypoglycemia or even death. The consequences of a false negative (falsely low) glucose reading on the continuous glucose meter would be potential under-delivery of insulin, which has the potential to lead to severe hyperglycemia or DKA. A confirmatory blood glucose meter reading has the potential to mitigate some of the risk of falsely high or falsely low glucose sensor readings, as the patient could choose to override the settings of the 670G system in some cases (i.e., decline to take additional bolus of insulin as recommended by the 670G system in setting of falsely high continuous glucose reading or exit Auto Mode).

PMA P160017: FDA Summary of Safety and Effectiveness Data Page 69
The results of the clinical studies performed and described in section IX above to support approval establish a reasonable assurance that the MiniMed 670G system is safe for its intended use.
C. Benefit-Risk Determination
Summary of Benefits: The probable benefits of the device are based on data collected in clinical studies conducted to support PMA approval as described above in Sections IX and X. The MiniMed 670G System is a novel device, which features in addition to sensor-augmented insulin pump therapy; an automated insulin delivery (Auto Mode) feature, as well as a predictive low glucose management feature (‘Suspend before low’). The MiniMed 670G System has the same insulin pump hardware as the MiniMed 630G System (P150001), but has the additional new features noted above. Compared to the run-in period for the pivotal study, results from the pivotal study period demonstrated the following:
Suggested a potential for improvement in overall glycemic control based on change in HbA1c values (table 12).
Less time and number of events with sensor glucose <70 mg/dL, particularly overnight.
Less time and number of events with sensor glucose >250 mg/dL in tables 13, 14, and 15
More time with sensor glucose in the 70-180 range. Good usability of the device based on Human Factors Studies Improved CGM accuracy, reproducibility and consistency (which should benefit
users to more effectively self-manage their diabetes and reduce the possibility of over treating hyper- or hypoglycemia) compared to prior generation approved Medtronic CGMs.
Longer sensor life compared to prior generation approved Medtronic CGMs (should benefit users since less insertions are required, reducing the risks associated with the process (pain, bruising, bleeding)).
The 670G System is intended for user-specified continuous delivery of basal insulin and insulin boluses for the management of Type 1 diabetes mellitus in persons 14 years of age and older. In the 670G System, insulin delivery is coupled with the continuous monitoring and trending of glucose levels in the fluid under the skin. The MiniMed 670G System can be programmed to automatically suspend insulin delivery for up to two hours when the sensor glucose value falls below a predefined or predicted threshold value. The MiniMed 670G System can be programmed to automatically calculate the insulin dose, based on information received from the CGM, to achieve glycemic control throughout the day and night. The Auto Mode and insulin suspend features described above can be enabled on the 670G system, but they cannot be enabled at the same time.

PMA P160017: FDA Summary of Safety and Effectiveness Data Page 70
The Guardian CGM is intended to supplement self-monitoring of blood glucose to track and trend interstitial glucose levels as estimates of glucose excursions in the blood. The adjustable hypoglycemia and hyperglycemia alerts are intended to warn the patients that they need to test their blood glucose to see if they need to take action to treat or prevent a hypoglycemic or hyperglycemic event. Furthermore, CGM measurements, which are performed every 5 minutes for 7 days via an indwelling sensor, provide tracking and trending information to supplement blood glucose meter measurements that are made several times daily and for calibration of the CGM device. The use of the continuous glucose monitor gives patients and healthcare providers glucose tracking and trending information not feasible using traditional blood glucose monitoring as blood glucose meters only provide information about discrete, intermittent blood glucose levels. Patients and healthcare providers can review the tracking and trending data by day and time of day such as daytime, or night time when fewer fingersticks are usually performed. The CGM includes a software package to aid in the evaluation of glucose trends over several days to detect patterns which may indicate a need to adjust therapy such as changes to basal rates and bolus dose instructions. Furthermore, the continuous glucose monitors provide real time knowledge of interstitial glucose levels that can be displayed on the insulin pump screen. The system can be set to provide notifications based on sensor trends or threshold, adding information unavailable by traditional discrete monitoring. Interstitial glucose trending information can be used to provide rate of change alerts that notify the patient that interstitial glucose is increasing or decreasing at a rate that raises concern for hyperglycemia or hypoglycemia. Threshold and Predictive (‘suspend on low’ and ‘suspend before low’ respectively) alert settings allow for high alerts, low alerts, and alerts regarding insulin delivery suspension. With the guidance of their healthcare provider the patient can set predictive or threshold high or low alerts to provide notifications that sensor glucose is approaching (the case of the predictive) or has reached (in the case of the threshold) level of concern. These alerts and alarms are especially helpful for individuals with hypoglycemia unawareness (these individuals may develop severe hypoglycemia with loss of consciousness, seizures, or rarely death without the normal warning symptoms), or during the night when patients may have prolonged hypoglycemia that does not awaken them and could proceed to severe hypoglycemia if not treated in time. Traditional blood glucose testing is not able to automatically alert users to these potentially dangerous episodes of asymptomatic hypoglycemia. The PLGM feature is a new, optional tool (not available when the Auto Mode of the 670G is activated), which when activated, is intended to suspend insulin delivery (for up to 2 hours) when the sensor glucose value is predicted to reach a preset value between 50 to 90 mg/dL. The PLGM feature also resumes insulin delivery based on feedback from the CGM system after 2 hours or before based on a pre-set glucose value. The user

PMA P160017: FDA Summary of Safety and Effectiveness Data Page 71
has the option to choose between suspending on a sensor glucose threshold (‘suspend on low’) or suspending based on a prediction (‘suspend before low’). The ability to automatically suspend insulin when the user is unaware of and/or unable to treat a low blood sugar with carbohydrate is a desirable feature given the risk of severe hypoglycemia and its potential complications (seizures, unconsciousness and death). The ability to automatically resume insulin is also a desired feature as it reduces the risk of hyperglycemia, ketoacidosis and DKA from prolonged insulin suspension. The degree of prevention of hypoglycemia could not be determined in the predictive suspend study because of the limitations of study design. Nevertheless, if used as intended and not as the primary method for preventing hypoglycemia, the predictive suspend feature is likely to provide more benefit than risk. The Auto Mode feature is a new optional tool to automate insulin delivery within the MiniMed 670G system. The automated insulin delivery is based on sensor glucose readings. There is no automated insulin-delivery system currently commercially available. Auto Mode, when activated, will calculate the insulin dose at five minute intervals, based on CGM data, in order to achieve a target glucose threshold (120 mg/dL) throughout the day and night. Meal boluses are the responsibility of the user. Blood glucose meter readings will be used for any correction boluses, as well as when the user elects to take a reading prior to their meal bolus (while in Auto Mode). There are several different options (Modes) within Auto Mode: (1) Temp Target - The user can set a temporary target glucose of 150 mg/dL for a period of time within “Temp Target” mode (2) Safe Basal Mode (or Safe Basal Low Mode) - The Auto Mode algorithm initiates a “safe basal mode” or “safe basal low” when the safeguards within the system algorithm determine that either the sensor data is not adequate for Auto Mode (sensor under-reading or no sensor data), or delivery at the minimum or maximum limit for a set amount of time has elapsed. The Auto Mode algorithm will determine when to deliver safe basal or safe basal low, depending on the patient’s sensor glucose value. The various safe basal rates are defined as:
Safe basal is the calculated rate of insulin [U/h] that will bring the fasting blood glucose to the value of 120 [mg/dL].
Safe Basal Low is the calculated rate of insulin [U/h] that will bring the fasting blood glucose to the value of 200 [mg/dL].
The ability to automate insulin delivery (Auto Mode feature) is a desirable feature given the risk of severe hypoglycemia and DKA associated with insulin pump therapy, especially when patients are unable to adjust insulin doses or monitor their blood glucose (e.g., when sleeping ). In addition, automated insulin delivery has the potential to be convenient to the user. Both the clinical and patient communities have expressed a strong desire for an automated insulin delivery system (“artificial pancreas”) to be commercially available in the US.
PMA P160017: FDA Summary of Safety and Effectiveness Data Page 72
The 670G insulin pump hardware is unchanged from the 630G insulin pump (P150001). The 670G insulin pump has the potential to be used as a traditional insulin pump as well as an automated insulin delivery system. Benefits of insulin therapy with continuous insulin infusion include the ability to:
1. Administer insulin frequently without repeated injections; 2. Set multiple basal rates during the day to better match basal insulin requirements
which may fluctuate during the course of the day; 3. Calculate active insulin remaining from previous boluses to avoid “insulin
stacking”, which can lead to hypoglycemia; 4. Administer bolus doses over an extended time; 5. Use a “built in” calculation tool to assist users in calculating appropriate bolus
insulin doses for meals based on current blood glucose levels, anticipated number of carbohydrates to be consumed, target blood glucose levels, insulin sensitivity, insulin to carbohydrate ratio, and active insulin time, factors which are determined by users’ experiences and diabetes care providers’ recommendations/instructions.
Summary of Risks: Risks of the Auto Mode feature include the following: The insulin pump may inappropriately suspend or decrease insulin delivery due to
software error or erroneous CGM data. The insulin pump may inappropriately increase insulin delivery or suggest that the
user administer additional insulin due to software error or erroneous CGM data. Hyperglycemia and ketosis from automatic insulin suspension or decrease in insulin
delivery. Hypoglycemia from automatic increase in insulin delivery. Hyperglycemia, ketosis, ketoacidosis, hypoglycemia due to willing or unwilling off
label use of the device. Inappropriate use of Auto Mode can result in an increased risk of the above risks Risks of the predictive suspend feature include the following: The predictive suspend feature may inappropriately suspend insulin due to a
software defect or erroneous CGM data, which inaccurately detects impending hypoglycemia or a threshold glucose
The predictive suspend feature may inappropriately resume insulin due to a software defect or erroneous CGM data, which inaccurately detects resolution of hypoglycemia or a threshold glucose
The predictive suspend feature may not appropriately suspend insulin due to a software defect or erroneous CGM data, which does not detect impending hypoglycemia or a threshold glucose.
The predictive suspend feature may not appropriately resume insulin due to a software defect or erroneous CGM data, which does not detect resolution of hypoglycemia or a threshold glucose
Hyperglycemia and ketosis from automatic insulin suspension.

PMA P160017: FDA Summary of Safety and Effectiveness Data Page 73
Inappropriate reliance on predictive suspend feature can result in an increased risk of the above risks.
Risks of the pump hardware problems include the following: Hypoglycemia from excessive pump delivery due to a hardware defect Hyperglycemia and ketosis possibly leading to ketoacidosis due to inappropriate
insulin suspension or pump failure resulting in cessation of all insulin delivery due to either a hardware defect or software anomaly.
Risks of the CGM include: Sensor error resulting in incorrect tracking and trending or threshold detection;
increased false negative and false positive low threshold alerts and alarms or high threshold alerts, and incorrect rate of change calculations that could adversely affect treatment decisions, and result in an increased risk of hypoglycemia or hyperglycemia
Non-adjunctive use of CGM data for meal bolusing decisions could result in an increased risk of hypoglycemia or hyperglycemia
Potential device-related non-serious events include: o Skin irritation or redness o Infection o Pain or discomfort o Bruising o Edema o Rash o Bleeding o Induration of skin o Allergic reaction to adhesives o Hematoma o Unnecessary fingersticks o Hyperglycemia following insulin suspensions o Ketosis following insulin suspensions o Sensor may break leaving a sensor fragment under the skin
Summary of Other Factors: The sensor was redesigned to extend its life to 7 days. The previous generation
Medtronic sensor model (P120010) has a life of 6 days. Hypoglycemia can cause serious morbidity and mortality The fear and risk of hypoglycemia limits the treatment of hyperglycemia Intensive insulin therapy is well known to increase the risk of hypoglycemia Optimizing glucose control is well known to decrease the risk of chronic
complications of diabetes mellitus, which result in significant morbidity and mortality

PMA P160017: FDA Summary of Safety and Effectiveness Data Page 74
Patient Perspectives Patient perspectives considered during the review included: Patients want a variety of devices that provide information and aid in management of their glucose control to inform decision making with their health care providers on lifestyle changes and treatment decisions. Patients have also expressed that they want devices that provide features that enable automated insulin delivery, and are willing to accept reasonable risks related to such devices. This information was gathered during patient oriented conferences and face-to-face meetings with patients.
D. Overall Conclusions
The data in this application support a reasonable assurance of safety and effectiveness for this device when used in accordance with the indications for use. The benefits of using the MiniMed 670G system, as discussed above, outweigh the risks.
XIII. CDRH DECISION
CDRH issued an approval order on September 28. 2016. The final conditions of approval cited in the approval order are described below.
The sale and distribution of this device are restricted to prescription use in accordance with 21 CFR 801.109 and under section 515(d)(1)(B)(ii) of the Federal Food, Drug, and Cosmetic Act (the act). The device is further restricted under section 515(d)(1)(B)(ii) of the act insofar as the labeling must specify the specific training or experience practitioners need in order to use the device. In addition, the device is restricted under section 515(d)(1)(B)(ii) of the act in that the following statement must appear prominently and conspicuously in all advertising and promotional materials for this device, as well as prominently and conspicuously immediately following the Indications for Use statement in the Operators Manual that is to be distributed with the device:
IMPORTANT: Medtronic performed an evaluation of the 670G closed loop system and determined that it may not be safe for use in children under the age of 7 because of the way that the system is designed and the daily insulin requirements. Therefore this device should not be used in anyone under the age of 7 years old. This device should also not be used in patients who require less than a total daily insulin dose of 8 units per day because the device requires a minimum of 8 units per day to operate safely.
FDA has determined that these restrictions on sale and distribution are necessary to provide reasonable assurance of the safety and effectiveness of the device. The device is therefore a restricted device subject to the requirements in sections 502(q) and (r) of the act, in addition to the many other FDA requirements governing the manufacture, distribution, and marketing of devices.
PMA P160017: FDA Summary of Safety and Effectiveness Data Page 75
Continued approval of this PMA is contingent upon the submission of periodic reports, required under 21 CFR 814.84, at intervals of one year from the date of approval of the original PMA. In addition to the above, and in order to provide continued reasonable assurance of the safety and effectiveness of the device, the Annual Report must include, separately for each model number (if applicable), the number of devices sold and distributed during the reporting period, including those distributed to distributors. The distribution data will serve as a denominator and provide necessary context for FDA to ascertain the frequency and prevalence of adverse events, as FDA evaluates the continued safety and effectiveness of the device. Within 30 days of the receipt of the approval letter, a PMA supplement that includes complete protocol of the post-approval study to provide additional confirmatory safety outcomes data collected in a controlled clinical study for a duration of one year must be provided. In addition to the Annual Report requirements, data in post-approval study (PAS) reports must be provided. PAS Progress Reports must be submitted for the study every six (6) months during the first two (2) years of the study and annually thereafter, unless otherwise specified by FDA. XIV. APPROVAL SPECIFICATIONS
Directions for use: See device labeling. Hazards to Health from Use of the Device: See Indications, Contraindications, Warnings, Precautions, and Adverse Events in the device labeling. Post-approval Requirements and Restrictions: See approval order.
XV. REFERENCES
None.