summary of safety & effectiveness data (ssed) of safety & effectiveness data (ssed) ......
TRANSCRIPT

Summary of Safety amp Effectiveness Data (SSED)
I GENERAL INFORMATION
Device Generic Name Interlaminar Stabilization Device
Device Trade Name coflex Interlaminar Technology
Device Procode NQO
Applicants Name and Address Paradigm Spine LLC 505 Park Ave 14h Floor New York NY 10022
Date(s) of Panel Recommendation None
Premarket Approval Application (PMA) Number P110008
Date of FDA Notice of Approval October 17 2012
Expedited Not Applicable
II INDICATIONS FOR USE
The coflexreg Interlaminar Technology is an interlaminar stabilization device indicated for use in one or two level lumbar stenosis from L1-L5 in skeletally mature patients with at least moderate impairment in function who experience relief in flexion from their symptoms of legbuttocksgroin pain with or without back pain and who have undergone at least 6 months of non-operative treatment The coflexreg is intended to be implanted midline between adjacent lamina of 1 or 2 contiguous lumbar motion segments Interlaminar stabilization is performed after decompression of stenosis at the affected level(s)
III CONTRAINDICATIONS
Prior fusion or decompressive laminectomy at any index lumbar level Radiographically compromised vertebral bodies at any lumbar level(s) caused by
current or past trauma or tumor (eg compression fracture) Severe facet hypertrophy that requires extensive bone removal which would cause
instability Grade II or greater spondylolisthesis Isthmic spondylolisthesis or spondylolysis (pars fracture) Degenerative lumbar scoliosis (Cobb angle of greater than 250)
PMA P110008 FDA Summary of Safety and Effectiveness Data 1
Osteoporosis Back or leg pain of unknown etiology Axial back pain only with no leg buttock or groin pain Morbid obesity defined as a body mass index gt 40 Active or chronic infection - systemic or local Known allergy to titanium alloys or magnetic resonance imaging (MRI) contrast
agents Cauda equina syndrome defined as neural compression causing neurogenic bowel or
bladder dysfunction
IV WARNING AND PRECAUTIONS
The warnings and precautions can be found in the coflexreg Interlaminar Technology labeling
V DEVICE DESCRIPTION
The coflex Interlaminar Technology is an interlaminar functionally dynamic implant designed to impart a stabilization effect at the operative level(s) It consists of a single U-shaped component fabricated from medical grade titanium alloy (Ti6Al4V per ASTM F136 and ISO 5832-3) In clinical use the U is positioned horizontally with its apex oriented anteriorly and the two long arms of the U paralleling the long axis of the spinal processes The bone-facing surfaces are ridged to provide resistance to migration
Vertebra Spinous Processes
Intervertebral Disc coflexreg
Nerve
Figure 1 coflex Implanted in the Spine
A set of two wings extends vertically from the superior long arm of the U with a second set of wings extending below the inferior long arm Both sets of wings have
PMA P110008 FDA Summary of Safety and Effectiveness Data 2
serrated bone-facing surfaces which are designed to further stabilize the coflex device to the superior and inferior spinous processes respectively at the treated level In addition the opposing wing surfaces are spaced such that they surround the midportion of the spinous process between the base and the tip but are more narrowly set (after intraoperative crimping if necessary) than the flared posterior tip of the spinous process Spacing of the superior and inferior wing sets is staggered preventing overlapping of the wings if the coflexregdevice is implanted at adjacent levels
To properly fit into the space between the spinous processes in a range of patient anatomies the coflex implant is manufactured in five sizes 8 10 12 14 and 16mm The size corresponds to the size of the U as measured from opposing long arms The number of teeth and the dimensions of the teeth are the same for all device sizes The gap between the upper and lower arms of the U is 5mm for the size 8 device 7mm for the size 10 9mm for the size 121 1mm for the size 14 and 13mm for the size 16
VI ALTERNATIVE PRACTICES AND PROCEDURES
Non-surgical alternatives include non-steroidal anti-inflammatory medications analgesics oral and epidural steroids an initial period of rest physical therapy and bracing Surgical alternatives to coflexreg depend on the severity of the spinal stenosis back pain and instability and include various decompressive procedures (eg laminectomy hemilaminectomy foraminotomy etc) interspinous process distraction devices (eg X-Stop) and posterolateral fusion with pedicle screws Each alternative has its own advantages and disadvantages A patient should fully discuss these alternatives with his or her physician to select the method that best meets expectations and lifestyle
VII MARKETING HISTORY
The coflex has been commercially available in markets outside of United States since 2005 A listing of the countries in which the device has been commercially available is included below in Table 1 The coflexreg has not been withdrawn from marketing in any of these markets
Table 1 coflex Marketing History
Argentina Australia Austria Belgium Bulgaria Chile China Colombia
Czech Republic Denmark Egypt Germany Greece Hong Kong India Indonesia Israel Italy Jordan Korea
Luxembourg Malaysia Mexico Netherlands New Zealand Norway Panama Peru
Philippines Poland Portugal Russia Saudi Arabia Singapore Slovakia Slovenia South Africa Spain Sweden Switzerland
Taiwan Thailand Turkey UAE UK Ukraine Venezuela Vietnam
PMA P110008 FDA Summary of Safety and Effectiveness Data 3
VIII POTENTIAL ADVERSE EFFECTS OF THE DEVICE ON HEALTH
Below is a list of the potential adverse effects (eg complications) associated with the use of the coflex Interlaminar Technology identified from the coflex clinical study results approved device labeling for other interlaminar devices and published scientific literature including (1) those associated with any surgical procedure (2) those associated with decompressive procedures and posterolateral fusion for the treatment of spinal stenosis and instability and (3) those associated with an interlaminar stabilization device including the coflex Interlaminar Technology In addition to the risks listed below there is also the risk that surgery may not be effective in relieving symptoms or may cause worsening of symptoms Additional surgery may be required to correct some of the adverse effects
I Risks associated with any surgical procedure include infection pneumonia atelectasis septicemia injury to blood vessels soft tissue damage phlebitis thromboembolus or pulmonary embolus hemorrhage respiratory distress pulmonary edema reactions to the drugs or anesthetic agent used during and after surgery reactions to transfused blood failure of the tissue to heal properly (eg hematoma seroma dehiscence etc) which may require drainage aspiration or debridement or other intervention incisional pain heart attack stroke and death
2 Risks associated with decompressive procedures and posterolateral fusion for treatment of spinal stenosis and instability include damage to nerves leading to sensory or motor deficits paralysis parasthesia cauda equina syndrome damage to nerves blood vessels and nearby tissues epidural bleeding hematoma or fibrosis instability blindness -secondary to pressure on the eye during surgery surgery at incorrect level osteolysis injury to the spinal cord or the nerves leaving or entering the cord loss of bowel or bladder function retrograde ejaculation sexual dysfunction or sterility disc herniation injury to blood vessels dural violation with or without CSF leakage impaired muscle or nerve function hemorrhage epidural injection reaction epidural injection failure fracture of the vertebrae spinous process or other damage to bony structures during or after surgery postoperative muscle and tissue pain surgery may not reduce the preoperative pain experienced pain and discomfort associated with the presence of implants used to aid in the fusion surgery or reaction to the metal used in the implant as well as the cutting and healing of tissues failure of the fusion to heal or spontaneous fusion the spine may undergo adverse changes or deterioration including loss of proper spinal curvature correction height andor reduction or malalignment and another surgery may be required and adverse boneimplant interface reaction
3 Risks associated with an interlaminar stabilization device including the coflexreg Interlaminar Technology include implant malposition or incorrect orientation allergies to implant materials possible wear debris implantation at the wrong spinal level fracture of the vertebrae spinous process or other damage to bony structures during or after surgery the implant may loosen deform break fatigue
PMA P110008 FDA Summary of Safety and Effectiveness Data 4
or move which may necessitate another surgery to correct the problem and instruments also may break or malfunction in use which may cause damage to the operative site or adjacent structures
For the specific adverse events that occurred in the clinical studies please see Section X below
IX SUMMARY OF PRECLINICAL STUDIES
A variety of testing was conducted to characterize the performance of the coflex Interlaminar Technology as follows
Laboratory Studies Static Axial Compression Dynamic Axial Compression Dynamic Axial Compression following Static Axial Compression Dynamic Torsion Dynamic Torsion following Bending and Crimping Wings Biomechanical Wing Testing Expulsion Cadaveric Biomechanical Testing Functional Testing of Pliers
Additional Studies Biocompatibility Sterilization Validation Shelf Life and Packaging Validation
A Laboratory Studies
Table 2 Laboratory Studies on coflex Device
Test Purpose Method Acceptance Results _____________ I Criteria
Static Axial To evaluate the Five (5) samples The maximum The mean yield load Compression performance of the of the coflexreg compressive was 239 N
coflexreg implant were strength of the Interlaminar tested under static wire-EDM Technology under compression manufactured static axial device (used in compressive prior human loading under clinical worst-case investigations) conditions 218 N
PMA PI 10008 FDA Summary of Safety and Effectiveness Data 5
Test Purpose Method AcceptanceCriteria
Results
Dynamic Axial To evaluate the Fifteen (15) The maximum The maximum run-Compression performance of the samples of the dynamic out load to 10
coflexreg coflexreg implant compressive run- million cycles was Interlaminar were tested under out load to 10 150 N Technology under dynamic million cycles of dynamic axial compression to 10 the wire-EDM compressive million cycles at manufactured loading under 10 Hz (R=10) device (used in worst-case prior human conditions clinical
investigations) 150 N
Dynamic Axial To evaluate the Samples ofthe The maximum The maximum run-Compression maximum load coflexreg implant dynamic out load to 10 following Static that the coflexreg were initially compressive run- million cycles was Axial Interlaminar statically loaded out load of the 175 N Compression Technology can to 330 N which milled coflexreg
withstand under caused plastic - device with no dynamic axial deformation prior static compressive Subsequently loading 150 N loading after the dynamic device is subjected compression to 10 to a static load million cycles at exceeding the 10 Hz was yield force performed at
multiple loads Dynamic Torsion To evaluate the Fifteen (15) The maximum The maximum run-
maximum samples of the dynamic torsion out load to 10 torsional load that coflexreg implant run-out load of the million cycles was the coflexreg were tested under wire-EDM 75 N Interlaminar dynamic torsion to manufactured Technology can 10 million cycles device (used in withstand at 10 Hz prior human
clinical investigations) 75 N
Dynamic Torsion To evaluate the Following The maximum The maximum run-following maximum bending and dynamic torsion out load to 10 Bending and torsional load that crimping ofthe run-out load million cycles was Crimping Wings the coflexreg wings six (6) following bending 50 N
Interlaminar samples ofthe and crimping of Technology can coflex implant the wings is higher withstand after were tested under than the maximum opening and dynamic torsion to forces on the wing closing the caudal 10 million cycles in lateral bending wings to at a frequency of (42N) axial maximum 10 Hz rotation (27N) displacement with and flexion the coflexreg extension (30N) bending and [values from crimping pliers biomechanical
wing test]
PMA P1 10008 FDA Summary of Safety and Effectiveness Data 6
______________ Test
Biomechanical Wing Test
Expulsion
Purpose
To evaluate the strain at various locations on the coflexreg Interlaminar Technology when implanted in a cadaver spine and subjected to flexionextension lateral bending and rotation
To evaluate the force required to cause expulsion of the coflexreg Interlaminar Technology under worst-case conditions Note loading conditions in vivo piesent little or no potential for high axial push-out forces between the spinous processes that could cause device expulsion
Method
Strain gauges were placed at 5 locations on the device to determine the maximum external moment in each loading mode
Five (5) samples of the coflexreg implant were tested using standard polyurethane sawbones foam (grade 40)
AcceptanceCriteria
In lateral bending axial rotation and flexionextension the maximum bending force on the wing is less than or equal to the maximum dynamic torsion run-out load of 75N
-Indicate high expulsion resistance to withstand worst case in vivo forces as observed in similar devices (lumbar interbody cages) in the literature with 50ON preload 642-1033N
_
Results
-In lateral bending the maximum wing bending moment was 042 Nm and the maximum force on the wing was 42 N -in axial rotation the maximum wing bending moment was 026 Nm and the maximum force on the wing was 26 N -In flexionextension the maximum wing bending moment was 016 Nm and the maximum force was 16 N -This test showed that the loads seen on the wings are low under worst case loading in flexionextension lateral bending and axial rotation Even with the worst case 10 Nm load the test results showed that the device had adequate strength to survive 10 million cycles
initial testing under 100 N preload required 467 N force to cause expulsion Second test to compare the milled devices to wire-EDM required 381 N force to cause expulsion -Third test performed under 500 N preload required 1318 N to cause expulsion
PMA P110008 FDA Summary of Safety and Effectiveness Data 7
Test Purpose
Cadaveric To evaluate the Biomechanical effect of the Testing coflexreg
Interlaminar Technology on range of motion
Functional To ensure that the Testing of Pliers coflex bending
and crimping pliers allow the opening and closing ofthe device wings without damage to the implant
Method
Eight (8) cadaveric specimens (L4L5) were tested The center of rotation was established to minimize off-axis bending Specimens were preconditioned for 1000 cycles at 500N Compression (900N at 25cmmin) fexionextension (+12 Nm) lateral bending (Il2Nm) and axial rotation (+9 Nm) were applied under a 600 N preload
Six (6) coflexreg implants (8mm) were tested All separation distances were measured
Criteria Restoration of spine to normal flexionlextension axial rotation and lateral bending ranges of motion
Wings are required to be opened 50 compared to the baseline separation distance without damage to the implant following maximal spring back
Results
Partial destabilization increased flexionextension relative to intact spine by 121 Implantation of the coflex reduced this ratio to nearly 11 representing nearly complete restoration -In axial rotation a significant increase in ROM was observed after partial destabilization (-151) but it was restored to nearly normal (-121) after the implantation of coflexreg device -In lateral bending the results ofthe cadaveric testing confirm that the coflex device does not impose any significant limitation on lateral bending -Crimping produced an average decrease in wing separation distance of 424 (39-44) compared to open dimension after bending -Compared to baseline (before bending) an increase of 53 (-03-9) of the separation distance was produced No distances showed evidence of damage
Note that during the course of the clinical trial the wings were modified slightly for ease of stacking two devices at adjacent levels The holes in the wings were also removed The modification was not the result of any clinical problems safety issues or adverse events product complaints or surgeon requests from within or outside the United States As this
PMA P110008 FDA Summary of Safety and Effectiveness Data 8
modification was minor it did not affect the mechanical behavior of the device or the anticipated clinical outcome
Figure 2 Original coflexreg IDE Design (left) and Modified coflex Design (right)
Table 3 provides a summary of the laboratory studies for the modified coflex device
Table 3 Laboratory Studies on Modified coflex Device
Test Purpose
Static Axial To evaluate the Compression performance of
the modified coflexreg Interlaminar Technology under static axial compressive loading under worst-case conditions
Dynamic Axial To evaluate the Compression performance of
the modified coflexreg Interlaminar Technology under dynamic axial compressive loading under worst-case conditions
Dynamic Torsion To evaluate the maximum torsional load that the modified coflexreg Interlaminar Technology can withstand
Method
Five (5) samples ofthe coflexreg implant were tested under static compression
Fifteen (15) samples of the coflexregimplant were tested under dynamic compression to 10 million cycles at 10 Hz
Fi_
Fifteen (15) samples of the coflexreg implant were tested under dynamic torsion to 10 million cycles at 22 Hz and I8 Hz
AcceptanceCriteria The maximum compressive strength of the original IDE device 239 N
Run out load equal to or greater than original IDE device 150 N
Run out load equal to or greater than original IDE device 75 N
Results
The mean yield load was 309 N
The maximum run-out load to 10 million cycles was 150 N
The maximum run-out load to 10 million cycles was 75 N
PMA P110008 FDA Summary of Safety and Effectiveness Data 9
B Additional Studies
1 Biocompatibility
The coflex implant is manufactured from standard medical grade Ti alloy Ti6Al4V per ASTM F136 and ISO 5832-3 This is a standard material used in permanently implanted orthopaedic devices However cytotoxicity testing was performed to verify that the manufacturing process did not introduce any contaminants that could impact biocompatibility in accordance with ISO 10993-5 Biological evaluation of medical devices Part 5 Tests for in vitro cytotoxicity The test results demonstrated that the finished device passed the cytotoxicity test with the score of
The coflexreg surgical instruments are manufactured from titanium alloy per ASTM F136 stainless steel and an acetal copolymer Biocompatibility testing for the coflex trials was performed as recommended in ISO 10993-1 for devices having limited duration contact with tissue or bone Cytotoxicity Sensitization and Irritation testing was performed in accordance with ISO 10993-5 and ISO 10993-10 The test results demonstrate that all the trials (each with a different colorant) meet the acceptance criteria and are biocompatible for their intended use
2 Sterilization
Sterilization validation according to EN556-1 Sterilization of medical devices shyRequirements for terminally sterilized devices to be labeled Sterile and ISO 11137 Sterilization of Health Care Products Parts 1 2 and 3 was conducted to confirm that the sterility of the device is maintained through a sterile barrier
3 Shelf Life and Packaging Validation
Shelf life and packaging validation studies including packaging seal and integrity accelerated aging and real-time aging testing were conducted to demonstrate that the device packaging can maintain a sterile barrier with a shelf life of 5 years
4 MRI Compatibility
Non-clinical testing has demonstrated that the coflex Interlaminar Technology is MR Conditional It can be scanned safely under the following conditions
Static magnetic field of 15-Tesla (15T) or 30-Tesla (30T) Spatial gradient field of up to
o 11230 Gcm (1123 Tm) for 15T systems o 5610 Gcm (561 Tm) for 3OT systems
Maximum whole body averaged specific absorption rate (SAR) of o 20 Wkg for 15 minutes of scanning in Normal Operating Mode at 15T o 20 Wkg for 15 minutes of scanning in Normal Operating Mode at 3OT
PMA P110008 FDA Summary of Safety and Effectiveness Data 10
30T RF heating In non-clinical testing with body coil excitation the coflex Interlaminar Technology produced a temperature rise of less than 350 C at a maximum whole body averaged specific absorption rate (SAR) of 20 Wkg as assessed by calorimetry for 15 minutes of scanning in a 30T Siemens Trio (MRC20587) MR scanner with SYNGO MR A30 4VA30A software
15T RF heating In non-clinical testing with body coil excitation the coflexreg Interlaminar Technology produced a temperature rise of less than 350 C at a maximum whole body averaged specific absorption rate (SAR) of 20 Wkg as assessed by calorimetry for 15 minutes of scanning in a 15T Siemens Espree (MRC30732) MR scanner with SYNGO MR B17 software
Caution The RF heating behavior does not scale with static field strength Devices which do not exhibit detectable heating at one field strength may exhibit high values of localized heating at another field strength
MR Artifact In testing using a 3OT system with spin-echo sequencing the shape of the image artifact follows the approximate contour of the device and extends radially up to 19 mm from the implant
X SUMMARY OF CLINICAL STUDIES
The applicant performed a clinical study to establish a reasonable assurance of safety and effectiveness of coflex Interlaminar Technology for the treatment of moderate to severe spinal stenosis with back pain in the US under IDE G060059 Data from this clinical study were the basis for the PMA approval decision A summary of the clinical study is presented beloW
A Study Design
Patients were treated between October 2006 and March 2010 The database for this PMA reflected data collected through March 2012 A total of 384 patients were enrolled consisting of up to 40 non-randomized roll-in patients and 344 randomized patients Excluding 22 protocol violators 215 randomized coflex patients and 107 randomized control patients were enrolled There were 21 investigational sites
The study was a prospective randomized multi-center concurrently controlled clinical study Surgeons were blinded prior to patient randomization and patients were blinded until after surgery The control group was posterolateral fusion with autograft bone and pedicle screw fixation following surgical decompression Based on the well-established performance of posterolateral fusion in the medical literature a 21 randomization ratio was applied with block randomization and a randomly
PMA P110008 FDA Summary of Safety and Effectiveness Data 11
changing block size A Bayesian statistical plan utilizing Jeffries non-informative priors and a single late-information time interim analysis was used to analyze the success of the device After 70 of patients were evaluable for month 24 composite clinical success the Bayesian posterior probability was to be computed and compared to 0975 If larger than 0975 the interim analysis sample was to be used to support approval If not the data on the remaining patients would be included in the analysis cohort after they complete 24 months of follow-up and again the posterior probability would be compared to 0975 in a final analysis Subsequently FDA requested submission of the patient data for the entire cohort
An independent Data Safety Monitoring Board (DSMB) evaluated all safety events on a quarterly basis during the course of the study to ensure patient safety was not compromised All adverse events were independently reviewed and adjudicated by a Clinical Events Committee (CEC) with their decision binding on the study sponsor All radiographs were analyzed by an independent core lab (Medical Metrics Inc)
The control group was the accepted standard of care for this indication posterolateral fusion with pedicle screw fixation The systems utilized were the Expedium (Johnson and Johnson Inc) and the CD Horizon LegacyTM (Medtronic Inc)
I Clinical Inclusion and Exclusion Criteria
Enrollment in the coflex study was limited to patients who met the following inclusion criteria
Radiographic confirmation of at least moderate lumbar stenosis which narrows the central spinal canal at one or two contiguous levels from LI -L5 that require surgical decompression Moderate stenosis is defined as gt 25 reduction of the antero-posterior dimension compared to the next adjacent normal level with nerve root crowding compared to the normal level as determined by the investigator on CT Scan or MRI The patient may have but is not required to have for inclusion in the study
Facet hypertrophy and subarticular recess stenosis at the affected level(s) o Foraminal stenosis at the affected level(s) o Up to Grade I stable degenerative spondylolisthesis (Meyerding
classification) or equivalent retrolisthesis as determined by flexionextension X-ray
For single level disease there may be up to a Grade I stable spondylolisthesis or equivalent retrolisthesis at the affected level as determined on flexionextension films by the investigator
For two level disease there may be up to a Grade I stable spondylolisthesis or equivalent retrolisthesis at only one of the two contiguous affected levels as determined on flexionextension films by the investigator Patients with up to Grade I stable spondylolisthesis at two contiguous levels are excluded but patients with up to Grade I stable spondylolisthesis at one level and equivalent retrolisthesis at the adjacent level may be included
PMA P110008 FDA Summary of Safety and Effectiveness Data 12
o Mild lumbar scoliosis (Cobb angle up to 250) Radiographic confirmation of the absence of angular or translatory instability of
the spine at index or adjacent levels (instability as defined by White amp Panjabi Sagittal plane translation gt45mm or 15 or sagittal plane rotation gt150 at Ll-L2 L2-L3 and L3-L4 gt200 at L4-L5 based on standing flexionextension X-rays)
VAS back pain score of at least 50 mm on a 100 mm scale Neurogenic claudication as defined by legbuttocks or groin pain that can be
relieved by flexion such as sitting in a chair Patient has undergone at least one epidural injection at any prior time point AND
at least 6 months of prior conservative care without adequate and sustained symptom relief
Age between 40 to 80 years Oswestry Low Back Pain Disability Questionnaire score of at least 2050 (40) Appropriate candidate for treatment using posterior surgical approach Psychosocially mentally and physically able to fuly comply with this protocol
including adhering to scheduled visits treatment plan completing forms and other study procedures
o Personally signed and dated informed consent document prior to any study-related procedures indicating that the patient has been informed of all pertinent aspects of the trial
Patients were not permitted to enroll in the coflex study if they met any of the following exclusion criteria
More than two vertebral levels requiring surgical decompression Prior surgical procedure that resulted in translatory instability of the lumbar spine
[as defined by White amp Panjabi] More than one surgical procedure at any combination of lumbar levels Prior fusion implantation of a total disc replacement complete laminectomy or
implantation of an interspinous process device at any lumbar level Radiographically compromised vertebral bodies at any lumbar level(s) caused by
current or past trauma or tumor (eg compression fracture) Severe facet hypertrophy that requires extensive bone removal which would cause
instability Isthmic spondylolisthesis or spondylolysis (pars fracture) Degenerative lumbar scoliosis (Cobb angle of greater than 250) Disc herniation at any lumbar level requiring surgical intervention Osteopenia A screening questionnaire for osteopenia SCORE (Simple
Calculated Osteoporosis Risk Estimation) will be used to screen patients who require a DEXA bone mineral density measurement If DEXA is required exclusion will be defined as a DEXA bone density measured T score of -10 (The World Health Organization definition of osteopenia)
Back or leg pain of unknown etiology Axial back pain onlywith no leg buttock or groin pain Morbid obesity defined as a body mass index gt 40 Pregnant or interested in becoming pregnant in the next three years
PMA P110008 FDA Summary of Safety and Effectiveness Data 13
Known allergy to titanium titanium alloys or MR contrast agents Active or chronic infection - systemic or local Chronically taking medications or any drug known to potentially interfere with
bonesoft tissue healing (eg steroids) not including a medrol dose pack History of significant peripheral neuropathy Significant peripheral vascular disease (eg with diminished dorsalis pedis or
posterior tibial pulses) Unremitting back pain in any position Uncontrolled diabetes Known history of Pagets disease osteomalacia or any other metabolic bone
disease (excluding osteopenia which is addressed above) Cauda equina syndrome defined as neural compression causing neurogenic bowel
(rectal incontinence) or bladder (bladder retention or incontinence) dysfunction Fixed and complete motor sensory or reflex deficit Rheumatoid arthritis or other autoimmune diseases Known or documented history of communicable disease including AIDS HIV
active Hepatitis Active malignancy a patient with a history of any invasive malignancy (except
nonmelanoma skin cancer) unless heshe has been treated with curative intent and there has been no clinical signs or symptoms of the malignancy for at least five years Patients with a primary bony tumor are excluded as well
Prisoner or ward of the state Subject has a history of substance abuse (eg recreational drugs narcotics or
alcohol) Subject is currently involved in a study of another investigational product for
similar purpose Currently seeking or receiving workmans compensation In active spinal litigation
2 Follow-up Schedule
All patients were scheduled to return for follow-up examinations at 6 weeks 3 months 6 months 12 months 18 months and 24 months postoperatively
Patients were evaluated for Oswestry Disability Index (ODI) Zurich Claudication Questionnaire (ZCQ) SF-12 back and leg pain (via visual analog scale (VAS)) and neurological assessment at preoperative visit and at all postoperative visits Radiographic evaluation was performed at all timepoints Adverse events and complications were recorded at all visits
The key time points are shown below in the tables summarizing safety and effectiveness
PMA P110008 FDA Summary of Safety and Effectiveness Data 14
3 Clinical Endpoints
The safety of the coflexreg Interlaminar Technology was assessed by comparing adverse event incidence epidural steroid injections reoperations revisions and neurological function in comparison to the posterolateral fusion control group
The effectiveness of the coflexreg Interlaminar Technology was assessed by evaluating clinical pain and function (evaluated by ODI) compared to the posterolateral fusion control group
Per the protocol an individual patient was considered a Composite Clinical Success (CCS) if all of the following criteria were met at 24 months Improvement of at least 15 points in the Oswestry Low Back Pain Disability
Index (ODI) at 24 months compared to baseline No reoperations revisions removals or supplemental fixation and No major device-related complications including but not limited to permanent
new or increasing sensory or motor deficit at 24 months and No epidural steroid injections in the lumbar spine
Overall study success criteria were based on a comparison of individual patient success rates such that the patient success rate for the coflexreg investigational group must be non-inferior to that of the posterolateral fusion control group Bayesian statistical methods were used to obtain the posterior probabilities of non-inferiority and superiority According to the statistical analysis plan if non-inferiority was demonstrated then superiority would be evaluated as defined more
specifically in the analysis plan The posterior probability threshold of 0975 was used to determine non-inferiority
Secondary effectiveness evaluations specified in the protocol included comparisons of the following ZCQ Symptom Severity ZCQ Physical Function ZCQ Patient Satisfaction Leg and Back Pain (via VAS) SF-12 time to recovery and patient satisfaction
In addition several radiographic endpoints were considered in evaluating both safety and effectiveness including index level and adjacent level range of motion translation instability and device-related effects (eg device fracture or migration fusionnon-fusion spinous process fracture)
B Accountability of PMA Cohort
At the time of database lock (March 11 2012) of 322 per protocol patients (215 coflex and 107 fusion) enrolled in PMA study 957 (204 coflex and 104 fusion) had data available for analysis at the completion of the study Patient accountability is
shown in Table 4 a patient accounting tree is shown in Figure 3 and a summary of data available at 24 months for each specific evaluation is provided in Table 5
PMA P110008 FDA Summary of Safety and Effectiveness Data 15
Table 4 Patient Accounting and Follow-Up Compliance Table- Efficacy Evaluable (PP) coflex (1) and Fusion Control Patients (C)
Date of data transfer 03112012 Pro-Op Week 6 Month 3 Month 6 Month 12 Month 18 Month 24
I C I C I C I C I C I C
(1)Theoreticalfolow-up 215 107 215 107 215 107 215 107 215 107 215 107 215 107
(2) Cumrulative deaths 0 o a 0 00 0 0 0 0 0 0 0 0
(3) CurnlativeStudy Failures 0 0 8 3 11 6 20j10 26 12 35 17 42 18
(4) Nat Yet Overdue 0 0 a 0 0 0 0 0 0 0 0 0 1 0
(5)Deaths-failuresaringtheoreticaldue 0 0 8 3 11 6 20 10 26 12 35 17 42 18
() Expected duefor clinic visit6 215 107 207 104 204 101 195 97 189 95 180 90 172 89
(7) Failures arng theoretical due 0 0 8 3 11 6 20 10 26 12 35 17 42 I8
(8) Rpected due+failures among theoretical due 215 107 2151 107 15 1 1 f67 215 07 215 107 214 107
All Evaluated Accounting (ActualS) Among Expected Due Procedures
I C I C I C I C I C I C I C
(9) of procedures with any clinical data in interval 215 107 205 104 200 99 189 95 176 94 163 83 162 86
(10) An Evaluated Visit Cornpliance() 000 W00 99 0 V00 98 0[ 980 969 979 93 989 90b 922 42 968
(1) ChangeinDswestry Dsabily Score 215 107 202 102 196 96 187 95 176 92 163 83 162 86
(12) Radiographic evaluation 215 107 2 2 102 196 98 186 95 171 93 149 79 139 68
(13) CCS at Month 24 204 104
(14)Actuala Follow-upforCCSattnth24 M0 00 976 98 9895 950 959 979 9354 968 906 922 953 972 or for change in OI at other tins
Within Window Accounting (Actual t) Among Expected Due
II C I C IC i C I C IC I C
(15) ChangeinOswestry Cisability Score 215 107 184 93 187 92 165 82 168 88 151 72 149 78
(16) adigraphic evaiuaion 215 107 183 94 188 94 162 82 164 88 137 69 131 63
(17) CS at Ms 24 191 95
(18) ActualADFollow-upfor CCS0at tnth24 00 o0 N9 094 9t7 9t 5461845 889 926 839 800 89 3888 or and change in 001 at other tines
PMA P110008 FDA Sunimary of Safety and Effectiveness Data 16
Subjeicts Randomized
Subjects Treated Withdrawn nPrior to TreatmentIntraoperatively
384- 5
Randomnizi d Radmize Ro -In coflex
ProtclVoltr Rerrotocol Cohort -Non-Ranoie
22224 (16 coflex 7 Fusion)
icoflex Fusion-Raaoii ed Per Protocol Randomized Per Protocol
215 107
-Fusioncoflexreg Evguable coflexregLTFU at Evaluable at Fusion LTFUat atM 4 M24lt I24 M24gt 7t2 t1 amp104 3ltV
Figure 3 Patient Accounting Tree for coflex IDE Study Reasons for withdrawal prior to treatment 17 patients failed to meet inclusion and exclusion criteria 22 patients withdrew consent and 13 patients elected not to have surgery
Table 5 24 Month Data Accounting for coflex IDE Parameter coflexreg Fusion Control Randomized 262 136 Withdrawn Prior to Treatment 32 22 Subjects Treated (mlTT) 230 114 Protocol Violators 15 7 Per Protocol Cohort 215 107
Radiologic Assessments Foraminal Height 180(837) na ROM 187 (870) 102 (953) Translation 185 (860) 95(888) Fusiont na 102 (953)
Clinical Failures Among Implanted 42 18 Expected (Per Protocol) 172 89
ODI 162 (942) 86 (966) ZCQ 161 (936) 86 (966) VAS Leg and Back Pain 162 (942) 85 (955) SF-12 Physical Component Score 132 (767) 70(787) Mental Component Score 139 (808) 75(843)
This measurement taken only on coflexreg patients tThis measurement taken only on fusion patients and defined as bridging bone Patients with Reoperations Revisions and Epidural Steroid Injection
PMA P110008 FDA Summary of Safety and Effectiveness Data 17
In the tables that follow throughout this summary the randomized per protocol cohort is used for safety and efficacy analyses unless otherwise indicated
C Study Population Demographics and Baseline Parameters The clinical study sites represent a mix between academic and community hospital settings urban and regional settings of care and were selected from varied geographic regions of the country
Table 6 Summary of Baseline and Demographic Variables - coflexreg and Fusion Control Efficacy Evaluable (PP) Co orts
coflex Fusion Control
Demographics -All N Mean SD N Mean SD Age at surgery (yrs) 215 62 1 92 107 641 90
Height (inches) 215 670 41 107 666 41
Weight (lbs) 215 gt1903 354 107 1877 381 BMI (kit) 215 297 45 107 296 49
Demographics - Male N Mean SD N Mean SD Age at surgery (yrs) 109 617 93 49 1 642 104
Height (inches) 109 699 27 49 699 29
Weight (lbs) 109 2071 273 49 2076 323
BM (kin2) 109 298 37 49 297 44
Demographic - Female N Mean i SD N Mean SD Age at surgery (yrs) 106 626 91 58 641 77
Height (inches) 106 640 29 58 1 638 25
Weight (Ibs) 106 1731 346 58 1708 345
BMI (krr) 106 296 52 58 295 54
Baseline Functional Status N Mean SD N Mean SD Oswestry (O) 215 608 118 1071 607 115
Zurich Claudication Qx Severity 214 36 06 107 36 06
Zurich audication Ox Physical 214 27 04 107 2 1 0 4
SF-12 PCS(ihysical-) -195 281 66 95 282 60
SF-12 rvcrS(riintal Health) 195 455 130 95 449 122
VAS Back pain 215 795 150 106 792 135
VAS Leg pain (worse lg) 215 760 204 106 78 j 184
PMA P110008 FDA Summary of Safety and Effectiveness Data 18
Table 7 Summary of Baseline and Demographic Categorical Variables - coflexreg and Fusion Control Efficacy Evaluable (PP) Cohorts
coflex Control
n n
Number of subjects 215 107
Males 109 507 49 458
Females 106 493 58 542
Number of levels n I n 1-level decompression 138 1 642 68 636 2-eve ecomression 77 358 39 364
Current smoker n n Yes 22 102 15 140
No 193 898 92 860
Comorbidities n n Cardiovascular 137 637 74 692 Musculoskeletal 112 521 61 570 Endocrine 55 256 35 327
Duration of Back Pain n n None 0 00 0 00
Fewer than 6 months 3214 1 09 6 monthstoa year 24 112 14 131 More than one year 188 874 92 860
Duration of Leg Pain (maximum) None
n 1
05
n 1
09
Fewerthan 6 months 6 28 8 75 6 months to a year 38 177 22 206 More than one year 170 1 791 76 710shy
Duration of Buttock Pain n n
None 32 149 21 196
Fewer than6 moths- 11 51 7 65
monts to a ye 41 11V22 206 Mre than one year 131 609 57 533
Duration of Groin Pain n n None 157 1 730 74 692
Fewer than 6 months 28 5 47
6 months to a year 13 60 12 112
More than one year 39 181 16 150
PMA P 110008 FDA Summary of Safety and Effectiveness Data 19
Table 8 Summary of Baseline and Demographic Categorical Variables - coflexreg and Fusion Control Efficacy Evaluable (PP) Cohorts (Continued)
coflexreg Control
Previous Conservative Treatment of the Spine n n None 28 130 9 84 Physical therapy 132 614 70 654
NSAJDsASNAcetinomphen only 121 563 65 607 Chiropractic 82 381 41 383 CorsetBrace 37 172 22 206 Anynarcoticuse 107 498 5 514 Other 34 158 15 140
Previous Surgical Treatment of the Spine n n
None 0 00 0 00 Discectomy - 4 19 0 00
Fusion 3 14 0 00 IDET 1 05 i 09 Epidural injections 210 977 105 1 981 Other injections 35 163 18 168 Laminotomy 10 47 2 19
Race n n American Indian Alaskan Native 1 05 3 28 Aian 4 19 3 28 BackorAricanAm-erican 11 51 6 56 White 191 888 93 869 Other 8 37 2 19
D Safety and Effectiveness Results
1 Safety Results The analysis of safety was based on the per protocol cohort of 322 patients (215 coflex patients and 107 fusion patients) Adverse events reported by the investigating surgeons and adjudicated by the CEC are reported in Table 9 to Table 11 The key safety outcomes for this study are presented below in Table 12 through Table 16
PMA P1 10008 FDA Summary of Safety and Effectiveness Data 20
Table 9 Incidence of Adverse Events coflex and Fusion Control Efficacy Evaluable (PP) Cohort
Operative Site Pain new + frequency worsening Wound problems Fracture2
Other Component loosening Component migration Component breakage Infection (deep) Component deformation Incidental durotomy (c= 5 mm) Tear gt5mm Heterotopic ossification Hematoma requiring drainage
Non-Operative Site
Musculoskeleta 4
Neurological Other Cardioascular Gastrointestinal Skin and Subcutaneous Tissue Genitourinary Respiratory EndocrineMetabolic CancerNeoplasm EENT Hematological
Immune PsychiatricSubstance abuse
coflex (N=215)
n
71 330 30 140 11 51 9 42 3 14 3 14 2 09 2 09 0 00 0 00 0 00 0 00 0 00
121 563 51 237
29 135 21 98
15 70 14 65 13 60 9 4 2 8 37 6 28 6 28 5 23 1 05 1 05
Control (N=107)
n
37 346 9 84 2 19 3 28 4 37 1 09 2 19 0 00 0 00 0 00 0 00 0 00 1 09
65 607 23 215
16 150 11 103
12 112 9 84 9 84 6 56 4 37 9 84 4 37 4 37 0 00 7 65
Wound problems Include wound drainage superficial infections dehiscence seroma and delayed healing of incision 2Fracture Includes spinous process fracture pars fracture and other fractures of the vertebral bodies reported by investigators 3Other Operative Site Includes events not placed into a specific category by investigators including clicking sound spondylolisthesis drain complications incisional pain spinal swelling and cellulitis 4Musculoskeletal Includes weakness cramping joint pain joint surgery or replacement and other non-lumbar spinal musculoskeletal tissues Neurological Includes balance problems headaches numbness andor tingling and
changes in sensation 6Other Non-Operative Site Includes psychological disorders infectious diseases insomnia and fever
Table 9 shows the comparison of percentages of complications between the coflex and fusion Per Protocol cohorts at specific operative and non-operative
PMA P1 10008 FDA Summary of Safety and Effectiveness Data 21
sites With the exception of wound problems adverse events rates were
comparable between coflex and fusion control The numerical difference of wound complications between coflexreg 140 (30215) and control 84 (9107) was 56 This difference was not statistically significant Table 10 demonstrates the time course of all adverse events
Table 10 Time Course of Adverse Events coflex (I) and Fusion Control (C) Efficacy Evaluable (PP) Cohort
immed Post-Op gtMo 3 gtMo 6 gtMo 12 ay of Surgery to Month 3 to Mo 6 to Mo12 to Mo 24
Relative Day 0 (Reliy 1-90) (RelDoy 91-180) (RelDay 181-365) (RelDay 365-730)
1 C I C I C I C j- C
Expected Due 215 107 204 101 s 97 189 95 89
Operative Site Pain new +frequency worsening 0 Q 1 21 10 13 11 25 7 - tt24 T17T
Wound problems - 2 0 29 10 0 0 0 0 t 0 Fracture 0 4 0 3 2 1 1 0
Other- -- 2_i 2 0 2 1 4 0
Device component loosening 0 0 0 o0 0 1 1 2 2
Device component migration 0 2 0 0 1 T0 0 1 0
Deoce component breakage 0 0 0 1 4 0 0
Infection (deep) 0 2 0 0 0 0 0
Hematoma requiring drainage 0 1 0 0 0N 0 0 0
Non-Operative Site Musculoskeletal 1 61 27 26 27 i9 24 72 34
Neurological o 0 25 i I 9 1 3 25 11 Other 0 0 12- 3 3 2 1 2 4 6 Cardiovascular w 1 2gt 4 0 8 4 9 3
Gastrointestinal 0 3- 2 3 2 0 1 5
Skin and Subcutaneous Tssue 0O 1 - 5 1 1 t 2 2
Genitourinary _0 2 4 4 1 I 0 0 5 2 Respiratory 0 0 3 3 0 2 1 3 EndocrineMetabolic t 0 -A 0 0 1 0- 0 -lt5 1
CancerNeoplasm 0 0 1 0 1 0 1 2 5
EENT 0jo024o - o 0 2o 01 Hematological i- 0swlt 1 2 1 t il 0 0 1 2 2
Immune lto0 0 -o- 0 0 0 0 0 i 0
PsychiatrcSubstance abuse 0 0 O 3 1 1 0 0 0- 2
Total 6- -7 178 81gt74 -59 132 53 180 9W
PMA P110008 FDA Summary of Safety and Effectiveness Data 22
) wI0N~cN tQO -
U om0
0 (36 - 0 4-CU
C
-4 - ai o - ~ 6 S toj~
CL
00
u
NW IL( (
C CJ C 0 C 0 -0 0 0 0 -
0
-4
oc
0 C
~D tB-gt 000
uc o-2
4) gt
CL MshyE a LLo
N- shy odoEcoo -0)c ( 0 0000 0Z 0
Cr~~~ H-n r4
qc-LL
O 0O 0 -
( 0 00O3000 0 (Nm4o ) )
4)0 w D~ 0 w wV D
z)I md - -a 0 40
Spinous Process Fractures Spinous process fractures were observed by the core radiographic laboratory in 30 coflex patients (140) and 8 fusion patients (119 of patients with spinous processes retained by partial laminectomy) Spinous process fractures were also observed by the investigator surgeons The incidence of fractures observed by the surgeons differed from that observed by the core radiographic laboratory as 8 coflex patients (37) and no fusion patients (00) had spinous process fractures noted by the investigational sites 83 of patients in the coflex group and 75 of patients in fusion group who had spinous process fractures observed by the radiographic laboratory did not have any associated symptoms at the time the fracture was observed Table 12 and Table 13 detail the incidence of spinous process fractures in coflex and fusion patients
Table 12 Spinous Process Fracture Incidence in coflex IDE Study coflex Fusion Control
nN nN S inous Process Fracture 30215 140 867 119 Fusion patients with spinous processes retained by partial laminectomy
Table 13 Time Course of Spinous Process FractureIncidence in coflex IDE Study
Group i Time of Initial Fracture Observation TotalPost-op 6W 3M 6M 12M 118M 24M
coflex 5 13 6 1 - - 5 30 Fusion Control 4 2 2 - - - - 8
f 3 out of the 5 observations at 24 months had unreadable or missing 6 week 3 month 6 month 12 month and 18 month X-rays
By month 24 48 of the coflex spinous process fractures were resolved Of the unresolved spinous process fractures 75 were asymptomatic and resulted in no clinical sequelae or loss of foraminal height during the study None (0) of the fusion spinous process fractures were resolved by month 24 and 75 of these patients were asymptomatic
The adverse event rate associated with spinous process fractures was not significantly higher than the patients without spinous process fractures The long term effects of these spinous process fractures past 24 months are unknown
PMA P110008 FDA Summary of Safety and Effectiveness Data 24
Surgery and Hospitalization Data
Table 14 Summary of Operative Details Continuous Variables coflex and Fusion Control Efficacy Evaluable (PP) Cohorts
coflexreg Fusion Control 95 Cl 95 Cl
1-and 2-level procedures N Mean SD (LB UB) N Mean SD (LB UB)
Hospital LOS (days) 215 190 108 (175 204) 107 319 161 (288 350)
Estimated blood loss (cc) 215 1097 1200 (9351258) 105 3486 2818 (2940 4031)
Operative time (minutes) 214 980 411 (925 1036) 107 1532 555 (1425 1638)
95 Cl 95 C1 N Mean SD (LB UB)1-level procedures N Mean SD (LB UB)
Hospital LOS (days) 138 186 114 (166 205) 68 287 145 (252 322)
Estimated blood loss (cc) 138 980 963 (8181143) 66 2909 2070 (2400 3418)
Operative time (minutes) 137 908 440 (834 982) 68 1420 560 (1284 1555)
95 Cl 95 Cl 2-level procedures N Mean SD (LB UB) N Mean SD (LB UB)
Hospital LOS (days) 77 197 095 (176 219) 39 374 174 (318 431)
Estimated blood loss (cc) 77 1305 1521 (959 1650) 39 4462 3584 (3300 5623)
Operative time (minutes) 77 1109 318 (10371181) 39 1727 493 (15671887)
The 95 confidence interval is provided as a measure of the statistical precision of the estimated treatment group mean or percentage Non-overlapping confidence intervals imply statistically reliable device group differences
Table 14 demonstrates that the average operating time in the fusion patients was 552 minutes greater than the coflexreg patients Average blood loss in fusion patients was 2389 cc greater in the fusion patients than in coflexreg patients The average hospital length of stay was 129 days longer in the fusion patients
Reoperations and Revisions
Through 24 months of follow up the overall reoperation rate was 107 in the coflex group and 75 in the fusion control Reoperations where the device was maintained are summarized in Table 15 and revision surgeries are summarized in Table 16
PMA P110008 FDA Summary of Safety and Effectiveness Data 25
Table 15 Reoperation Events in the coflex Clinical Trial
Reoperation Treatment Event Time Course (months) Total Reasons Type Group lt15 15-3 3-6 6-12 12-24 24-36 36-48 (events)
Irrigation and 2 wound dehiscence Debridement ______ 2 deep infections
SupplementalDecomesion Decompression
coflexreg - - - 1 1 1 1 4
3 leg andor low back pain I herniation
CSF Repair coflexreg I - - - - - - I I CSF leak
Non-Index 2 leg andor low back
Lumbar Fusion pain Hematoma Drainage Fusion I - - - - - - II wound hematoma
Irrigation and Fusion 2 - 2 2 deep infections1
Debridement Supplemental I synovial cyst Decomression herniation
A single fusion patient had 2 operations for deep infection
Table 16 Revision Events in the coflex Clinical Trial
Revision Type Treatment Event Time Course (months) Total Reasons Group lt15 15-3 3-6 6-12 12-24 24-36 36-48 (events)
Device I bone-related fracturereplacement (with coflexreg - 2 - - - - - 2 seroma coflexreg)
Decompression 2 leg andor low back and Device coflexreg - - - I I - - 2
Removal pain 14 leg andor low back
pain2 Transition to 4 bone-related fracture fusioncoflex 2 4 7 6 3 22 2 component loosening
I herniation I synovial cyst
Debridement and coflexreg I - - - - - I I deep infection Device Removal
shy
I component looseningDevice Removal Fusion - shy 2 2 1 back andor leg pain
2 broken pedicle reacem Fusion - - - 1 3 - I 5 screwst
3 component loosening
back andor leg painAdjacent level F7enFusion 1 2 3 2 10 2 pseudoarthrosisextension II bone-related fracture
A single fusion patient had 2 revisions for broken pedicle screws 2Three coflex patients had a transition to fusion after a previous reoperation or replacement of coflex
Through 24 months the reoperations and revisions in the coflex group included 5 irrigation and debridement procedures (including 1 cerebrospinal fluid leak) 2 supplemental decompression surgeries retaining the device 2 revisions for coflex removal amp replacement 2 decompressions and device removal 1debridement and device removal and 13 (60 13215) conversions to primary fusion Two patients had a reoperation prior to a revision There were no revisions related to device breakage
Through 24 months the reoperations and revisions in the fusion control group included 1 reoperation due to post-operative hematoma 4 revisions of the fusion system due to
PMA P110008 FDA Summary of Safety and Effectiveness Data 26
device breakage or component loosening and 5 extensions of the fusion to an adjacent level
Between 24 months and 48 months of follow up there were 13 additional reoperations or revisions in 12 coflex patients (63 (12192)) and 12 additional reoperations or revisions in 10 fusion patients (101 (1099)) One of each of the coflexreg and fusion revisions was in a patient who had a reoperation prior to 2 years Based on available patient data through 48 months the coflexreg revision rate is 158 and the fusion control revision rate is 159
2 Effectiveness Results
Primary Effectiveness Analysis The analysis of effectiveness was based on the per protocol cohort of 322 patients (215 coflex patients and 107 fusion patients) evaluable at the 24-month time point Key effectiveness outcomes are presented in Table 17 through Table 32
Table 17 Posterior Probabilities of Success at 24 Months in cotlex Clinical Trial
Number and Percentage Achieving Month 24 CCS Posterior Probability
coflexreg Fusion Control of Non-Inferiority _ ~ I _-___Fn IN IT _ _ _ _
Month 24 204 135 662 104 60 577 0999
Composite Clinical Success
Non-inferiority of the coflexreggroup compared to the control group was demonstrated for the Composite Clinical Success (CCS) at 24 months
Table 18 Posterior Means and 95 Credible Intervals for Month 24 CCS
Mean SD 95 Bayesian Credible Interval
coflex 662 33 595 to 724
fusion 577 48 481 to 669
difference 85 58 -29 to 200
Mean SD and 95 Bayesian Credible Interval computed as the mean standard deviation 25th percentile and 975th percentile of 10000 draws from the posterior distributions
The Bayesian posterior means standard deviations and 95 credible intervals were determined from 10000 draws from the posterior distributions based on the final per protocol population The credible intervals are defined so that there is a095 probability that the true success likelihoods are contained within the interval The estimated difference is
85 The lower bound of Bayesian posterior credible interval for the device group difference in success rates is equal to -29 which is larger than the pre-specified non-inferiority margin of -10
PMA P110008 FDA Summary of Safety and Effectiveness Data 27
The Statistical Analysis Plan specified that primary non-inferiority evaluation would be performed in a per protocol population All protocol violations (PV) were confirmed by an Independent Clinical Events Committee Among the 230 randomized patients receiving coflex 15 (65) had a protocol violation leading to exclusion Similarly among the 114 randomized patients undergoing fusion 7 (61) had a protocol violation leading to exclusion The primary efficacy variable was evaluable for all 22 PVs in this study Among 15 coflexreg PVs 6 (400) met the study success criterion Similarly among 7 fusion PVs 3 (429) met the study success criterion The clinical results for the PVs were pooled with the per protocol population to construct a modified Intent-to-Treat (mITT) population defined as all randomized patients receiving a study procedure The Bayesian posterior probability that coflexreg is clinically non-inferior to fusion is 0999 essentially the same as in the primary per protocol population
Table 19 Posterior Probabilities of Success at 24 Months in coflex Clinical Trial (mITT Cohort)
Number and Percentage Achieving Month 24 CCS
coflex Fusion Control Posterior Probability
of Non-Inferiority N n _ N n
Month 24 219 141 644 111 63 568 0999
Non-inferiority of the coflex group compared to the control group was demonstrated for the CCS at 24 months in the mITT cohort
Table 20 Posterior Means and 95 Credible Intervals for Month 24 CCS (mITT Cohort)
Mean SD 95 Bayesian Credible Interval
coflexreg 644 32 579 to 705
fusion 568 47 474 to 657
difference 76 56 -34 to 189
Mean SD and 95 Bayesian Credible Interval computed as the mean standard deviation 25th percentile and 975th percentile of 10000 draws from the posterior distributions
For the per protocol population Table 21 demonstrates the time course of success in the coflexregclinical trial
PMA P110008 FDA Summary of Safety and Effectiveness Data 28
Table 21 Time Course of Composite Clinical Success in coflex Clinical Trial
Number and Percentage Meeting Criteria with 95 Cl2
coflex Fusion Control
95 CI 95 CIN n (LB UB) N n (LB UB)
Week 6 210 172 819 (767 871) 105 69 657 (566 748)
Month 3 207 171 826 (774 878) 102 72 706 (617 794)
Month 6 207 162 783 (726 839) 105 81 771 (691 852)
Month 12 202 151 748 (688 807) 104 74 712 (624 799)
Month 18 198 135 682 (617 747) 100 68 680 (589 771)
Month 24 204 135 662 (597 727) 104 60 577 (482 672)
Notes 1 The composite clinical success criteria at times points prior to Month 24 did not include the no persistent new or worsening sensory or motor deficit since persistence was established by identifying new or worsening deficits at Month 18 that did not resolve by Month 24 otherwise the CCS criteria at earlier time points were consistent with the primary Month 24 CCS 2The 95 confidence interval is provided as a measure of the statistical precision of the estimated treatment group mean or percentage Non-overlapping confidence intervals imply statistically reliable device group differences
Table 21 demonstrates the CCS at each timepoint The CCS at 24 months is determined by the ODI improvement compared to baseline absence of secondary surgeries or epidural pain management and neurologic success It should be noted that neurologic success endpoint is based on comparing changes from baseline to both Month 18 and Month 24 and thus is not definable prior to the 24 month timepoint ODI measurements and success may fluctuate over time while discrete events endpoints such as secondary surgeries and epidural injections were assessed as time to event variables
Patients in the coflex group demonstrated a 819 CCS at 6 weeks which increased to 826 at 3 months and gradually fell to 662 at 24 months Patients in the control group demonstrated 657 CCS at 6 weeks which rose gradually from 6 Weeks to 6 Months to 771 CCS fell to 577 at 24 months At every assessment time period the percentage of coflex patients achieving CCS was greater than fusion with the largest differences occurring at week 6 and month 3 demonstrating statistical significance at those time points The final CCS at 24 months demonstrates numerical success that is 85 higher in the coflexreg group when compared to the fusion control
PMA P110008 FDA Summary of Safety and Effectiveness Data 29
Table 22 Treatment Success at 24 Month Follow- p in coflexreg Clinical Trial Number and Percentage Meeting
Criteria
coflex Fusion Control
N n N n Improvement of at least 15 points in ODI at Month 24 162 139 858 86 66 767 compared to baseline No reop or epidural (Up to Day 730) 215 173 805 107 89 832
No reoperations revisions removals or supplemental 215 192 893 107 99 925 fixation No epidural injection at any lumbar level 215 190 884 107 94 879
No persistent new or increasing sensory or motor 179 169 944 97 89 918 deficit at 24 months
No persistent new or increasing sensory deficit at 24 mo 199 191 960 99 96 970
No persistent new or increasing motor deficit at 24 mo 180 177 983 97 91 938
No major device-related complications 215 212 986 107 103 963
Composite Clinical Success 1204 4135 662 104160 577
With regard to the functional parameter of the CCS the coflexc device group demonstrated a greater proportion of patients with a clinically significant improvement in ODI score compared to the fusion control In the neurological and device related complications components of the primary endpoint the coflex group demonstrated similar or higher patient success percentages compared to the fusion control Success in the reoperations and revisions component of the primary endpoint is higher in the fusion control group than inthe coflex group
Sensitivity Analysis
Table 23 Posterior Probabilities of Success at 24 Months in coflex Clinical Trial Number and Percentage Achieving
Month 24 CCS Posterior Probability coflex Fusion Control of Non-Inferiority
N n N n
Per Protocol Analysis 204 135 662 104 60 577 0999
Unresolved Spinous Process 204 119 583 104 56 0993538 Fractures as Failures2
Unresolved Spinous Process fractures counted as failures regardless of clinical significance 83 of patients in the coflex group and 75 of patients in fusion group who had spinous process fractures observed by the radiographic laboratory did not have any associated symptoms at the time the fracture was observed
In sensitivity analyses the 24 Month Composite Clinical Success endpoint was modified to include as failures patients with an unresolved spinous process fracture at 24 months Review of the spinous process fractures and the resolution of these fractures were performed by an independent radiographic core laboratory for the purpose of this analysis With this
PMA P 110008 FDA Summary of Safety and Effectiveness Data 30
modification in the success definition the Composite Clinical Success rate decreased from 66 (135 of 204) to 58 (119 of 204) in the coflex group and from 58 (60 of 104) to 54 (56 of 104) in the fusion group and the Bayesian posterior probability changed from 0999 to 0993 still meeting the a priori defined criterion for success Therefore including unresolved spinous process fractures in the failure definition had no appreciable impact on the comparison between the devices
A tipping point analysis was also performed to determine the effect on the primary endpoint of missing Month 24 data Results of the tipping point
analysis demonstrated that the finding of non-inferiority was insensitive to missing data at Month 24
Poolability Analysis Analyses were conducted to assess poolability of data across sites and between patients with I versus 2 level implants There was no statistical evidence of site-to-site differences in the comparisons between coflexreg and fusion Similarly patients receiving 2 level implants had clinical outcomes that were generally comparable to those receiving a I level implant
Secondary Effectiveness Analysis In addition to the components of the primary endpoint presented above secondary effectiveness variables were also assessed and the results are
provided below The following secondary endpoints were specified
ZCQ Symptom Severity ZCQ Physical Function ZCQ Composite Success VAS Leg Pain VAS Back Pain SF-12
ZCQ Symptom Severity
Table 24 ZCQ Symptom Severity at 24 Month Follow-Up in coflex Clinical Trial
Number and Percentage Meeting Criteria with 95 Cl
coflex Fusion Control
95 CI 95 ClN n (LB UB) N n -9L B
ZCQ Symptom Severity 161 142 882 (832 932) 86 67 779 (691 867)Improvement gt05 points The 95 confidence interval isprovided as a measure of the statistical precision of the estimated treatment group mean or percentage Non-overlapping confidence intervals imply statistically reliable device group differences
PMA P110008 FDA Summary of Safety and Effectiveness Data 31
Table 24 shows the subjects achieving success defined as a decrease in ZCQ Symptom Severity of at least 05 points in the Per Protocol cohort Month 24 data demonstrates a higher percentage of coflex patients meeting the success threshold compared to the fusion control (882 vs 779)
ZCQ Physical Function
Table 25 ZCQ Ph ysical Function at 24 Month Follow-Up in coflex Clinical Trial
Number and Percentage Meeting Criteria with 95 Cl
coflexreg Fusion Control
(LB UB) N (LB UB) ZCQ Physical Function 161 138 857 (803 911) 86 63 733 (639 826)Improvement gt05 points1The 95 confidence interval is provided as a measure of the statistical precision of the estimated treatment group mean or percentage Non-overlapping confidence intervals imply statistically reliable device group differences
Table 25 shows the subjects achieving success defined as a decrease in ZCQ Physical Function of at least 05 points in the Per Protocol cohort Month 24 data demonstrates a higher percentage of coflext patients meeting the success threshold compared to fusion (857 vs 733)
ZCQ Composite Success
Table 26 ZCQ Composite Success at 24 Month Follow-Up in coflex Clinical Trial
Number and Percentage Meeting Criteria with 95 Cl
coflex Fusion Control
95 CI 95 Cl (LB UB) (LB UB)
ZCQ Composite Success at Month 24
161 126 783 (719 847) 86 58 674 (575 773)
The 95 confidence interval is provided as a measure of the statistical precision of the estimated treatment group mean or percentage Non-overlapping confidence intervals imply statistically reliable device group differences
Table 26 shows the subjects achieving a Composite ZCQ Success in the Per Protocol cohort defined as a decrease in ZCQ Physical Function of at least 05 points a decrease in ZCQ Symptom Severity of at least 05 points and ZCQ Satisfaction score gt25 Month 24 data demonstrates a higher percentage of coflexreg patients meeting the success threshold compared to the fusion control (783 vs 674)
PMA P110008 FDA Summary of Safety and Effectiveness Data 32
VAS Leg Pain
Table 27 VAS Leg Pain Success at 24 Month Follow-Up in coflex Clinical Trial
Number and Percentage Meeting Criteria with 95 ClO
coflexreg Fusion Control
95C N 95 ClN n 5C N n (LB(LBUB)(LB UB)
Decrease of at least 20 mm 162 134 827 (769 885) 85 67 788 (701 875)VAS leg Pain (Max)
The 95 confidence interval is provided as a measure of the statistical precision of the estimated treatment group mean or percentage Non-overlapping confidence intervals imply statistically reliable device group differences
Table 27 shows the subjects achieving success defined as a decrease in VAS Leg Pain of at least 20mm in the Per Protocol cohort Month 24 data demonstrates a higher percentage of coflexreg patients meeting the success threshold compared to the fusion control (827 vs 788)
VAS Back Pain
Table 28 VAS Back Pain at 24 Month Follow-Up in coflex Clinical Trial
Number and Percentage Meeting Criteria with 95 Cl
coflexreg Fusion Control
N 95 Cl (LB UB) N
95 CI (LB UB)
Decrease of at least 20 mm VAS Back Pain
162 143 883 (833 932) 85 68 800 (715 885)
1The 95 confidence interval is provided as a measure of the statistical precision of the estimated treatment group mean or percentage Non-overlapping confidence intervals imply statistically reliable device group differences
Table 28 shows the subjects achieving success defined as a decrease in VAS Back Pain of at least 20mm in the Per Protocol cohort Month 24 data demonstrates a higher percentage of coflex patients meeting the success threshold compared to the fusion control (883 vs 800)
PMA P110008 FDA Summary of Safety and Effectiveness Data 33
SF-12
Table 29 SF-12 Success at 24 Month Follow-Up in coflex Clinical Trial
Number and Percentage Meeting Criteria with 95 Cl
coflex Fusion Control
95CI 95 Cl (LB UB) N n LB UB)
Maintenance or improvement 132 92 697 (619 775) 70 48 686 (577 794)inSF-12 MCS Maintenance or improvement 132 121 91-7 (870 964) 70 58 829 (740 917) in SF-12 PCS
The 95 confidence interval isprovided as a measure of the statistical precision of the estimated treatment group mean or percentage
Table 29 shows the percentages of subjects meeting success defined as maintaining or improving in the SF-12 Physical Function and Mental Health components of the per protocol cohort The percentage of patients meeting SF-12 Physical Function success criterion is higher for coflexreg at month 24 compared to the fusion control (917 vs 829)
Radiographic Assessments Maintenance or improvement of foraminal height was a radiographic endpoint in the study This is a measure of the mechanism of action of the coflexreg device which is to maintain foraminal height coflexreg was able to improve or maintain foraminal height in 100 of patients measured at 24 months This measurement was taken only on the coflex patients
Range of motion at the index level was measured at 24 months The average range of motion was 45 in the coflexreg group and less than 20 in the control The analysis of the mean range of motion at the index and adjacent levels demonstrates that motion was maintained in the coflex patients
Translational motion as a measure of instability was assessed at 24 months in both coflexreg and fusion patients At the index level the sagittal plane translation is reduced with fusion The coflexreg group maintained a similar sagittal plane translation from pre-op to 24 months (see Table 30 and Table 3 1 for radiographic results)
The control group received the current standard of care posterolateral fusion with pedicle screws The radiographic endpoint in this group the presence of fusion was compared to the absence of bridging trabecular bone in the coflexreg group No coflexreg patients had bridging bone at 24 months 673 of control patients had radiographic fusion at 24 months There were 327 of control patients who were not fused at 24 months and 202 of control patients had screw loosening however many of these patients were asymptomatic
PMA P110008 FDA Summary of Safety and Effectiveness Data 34
The device condition through 24 months demonstrated I device wing fracture of coflexreg and 3 device breakages and 21 patients with loose screws in the control patients
As discussed above during the study a number of spinous process fractures were observed in the coflexreg patients by the independent radiologists which were asymptomatic at the 24 month timepoint and not observed by the investigator surgeons
Table 30 Range of Motion Results in coflex IDE Study (0Flexion to Extension)
Number and Percentage Meeting Criteria with 95 CI coflex Fusion Control
At Level(s) of Implant (per level)
SD 95 Cl 95 ClN Mean (LBSUS) N Mean SD (LUS
(LB UB) (LB UB) Pre-Op 281 455 386 (410 501) 145 415 333 (361 470) Month 24 254 417 390 (369465) 140 159 197 (126192)
Above Level of Implant (per patient) 95 Cl 95 ClN Mean SD (LB UB N Mean SD (LB UB
(LB UB) (LB UB) Pre-Op 207 417 349 (369465) 104 368 299 (310 426) Month 24 186 408 357 (356459) 102 560 462 (470 651)
Below Level of Implant (per patient)
95 Cl 95 ClN Mean SD (LB US N Mean SD (LB UB (LB UB) (LB UB)
Pre-Op 195 581 414 (522 639) 101 565 384 (489 641) Month 24 176 653 466 (584 722) 96 695 442 (605 784)
The 95 confidence interval is provided as a measure of the statistical precision of the estimated treatment group mean or percentage Non-overlapping confidence intervals imply statistically reliable device group differences
PMA P1 10008 FDA Summary of Safety and Effectiveness Data 35
Table 31 Translation Results in coflex IDE Study (mm Flexion to Extension)
Number and Percentage Meeting Criteria with 95 ClO coflexreg Fusion Control
At Level(s) of Implant (per level)
95 CI 95 ClN Mean SD (LB US N Mean SD (LB UB
(LB UB) (LB UB)
Pre-Op 274 097 088 (086 107) 134 097 085 (083 112) Month 24 251 093 089 (082 104) 130 039 050 (030 048)
Above Level of Implant (per patient)
95 Cl 95 ClN Mean SD (LB US) N Mean SD
Pre-Op 202 087 074 (077 097) 96 077 076 (062 092) Month 24 184 089 082 (077 101) 95 108 094 (089 127)
Below Level of Implant (per patient) 95 Cl 95 ClN Mean SD (LB US N Mean SD 9LB UB
(LB UB) II(LB UB) Pre-Op 190 056 053 (048 063) 93 055 046 (045 064) Month 24 174 065 057 (056 073) 89 080 085 (062 098)
The 95 confidence interval is provided as a measure of the statistical precision of the estimated treatment group mean or percentage Non-overlapping confidence intervals imply statistically reliable device group differences
Table 30 and Table 31 reflect the radiographic Range of Motion and Translation analyses by the core radiographic laboratory and they demonstrate coflex preserves index and adjacent level motion compared to pedicle screw fusion
PMA P110008 FDA Summary of Safety and Effectiveness Data 36
3 Subgroup Analyses Preoperative characteristics were evaluated for potential association with overall success outcomes as demonstrated in Table 32
Table 32 Composite Clinical Success at 24 Month Follow-Up in coflex Clinical Trial by Pr operative Characteristics
Number and Percentage Achieving Month 24 CCS
coflex Fusion Control
Central stenosis (CS) alone CS + foraminal stenosis CS + subarticular stenosis CS+ftormaminal +subaricular
Levels Treated One Levels Treated Two
Males
Age 40 to 60 Age 60
Heightlt 67 inches Height= 67 inches
Weightlt 191 Weight= 191
BMI lt29 B~IVI-29
Prior Surgery No pror surgery
Smoker Non Smoker
Spondylolisthesis-Grade I None
Any severe complication No severe complication
N n N n 18 13 722 4 2 500 57 38 667 21 14 667 32 21 656 22 11 500 97 63 649 57 33 579
130 83 638 65 38 585 74 52 7036 39 22 5640
104 69 663 48 31 646 100ema06s66 60 56 29 518
90 54 600 39 22 564 114 81 711 65 38 585
90 61 678 57 29 509 114 74 649 47 31 660
109 75 688 61 34 557 95 60 632 43 26 605
95 62 653 42 22 524 109 73 670 62 38 613
202 134 663 102 58 569 2 1 500 2 2 100 0
22 13 591 14 6 429
182 122 670 90 54 600
94 59 628 48 30 625 110 76 691 56 30 536
70 33 471 46 19 41 3 134 102 761 58 41 707
There were 40 non-randomized roll-in patients enrolled in the coflexe
study consisting of first one or two patients treated at each site Of these
40 patients 6 patients were designated as protocol violators by the independent Clinical Events Committee Thirty-two (32 941) per protocol patients had Composite Clinical Success data at 24 Months The
per protocol roll-in patient cohort achieved a 563 Composite Clinical Success at Month 24
PMA P110008 FDA Summary of Safety and Effectiveness Data 37
XI PANEL MEETING RECOMMENDATION AND FDAS POST-PANEL ACTION
In accordance with the provisions of section 515(c)(2) of the act as amended by the Safe Medical Devices Act of 1990 this PMA was not referred to the Orthopaedic and Rehabilitation Devices Panel an FDA advisory committee for review and recommendation because the information in the PMA substantially duplicates information previously reviewed by this panel
XII CONCLUSIONS DRAWN FROM PRECLINICAL AND CLINICAL STUDIES
Safety Conclusions The adverse effects of the device are based on data collected in a clinical study conducted to support PMA approval as described above The coflex device was found to have a reasonable assurance of safety and to be at least as safe as the control treatment With the exception of wound complications the rate of coflexreg patients having at least one adverse event an event classified by the Clinical Events Committee (CEC) as a surgery-related adverse event a device-related adverse event or an event classified by the CEC as a severe or life threatening adverse event was comparable to the control group rate The rate of wound complications was numerically greater in the coflexreg group The rate of secondary surgery (revisions and reoperations) for coflexreg were higher than the control group at 24 months
The study noted the presence of additional spinous process fractures in a number of patients identified by the core laboratory and not by the investigator surgeons in both coflex and the fusion control groups These fractures were asymptomatic at 24 months and the evaluation of the CCS ODI and ZCQ endpoints for these patients did not demonstrate the clinical significance of these spinous process fractures at 24 months The long term significance of these fractures is unknown
In conclusion the clinical study data indicate that at 24 months post-operatively the coflex device has a reasonable assurance of safety and is at least as safe as the control with regard to adverse events It also demonstrates a numerically greater incidence of wound complications when compared to control and an incidence of spinous process fractures which are asymptomatic and of no clinical significance at 24 months but the long term effects are unknown
Effectiveness Conclusions In this study patients were enrolled treated and followed up through the 24 month postshyoperative visit 957 had data available for analysis at the completion of the study Statistical analysis demonstrated that the results from all sites were poolable to determine safety and effectiveness Analysis of patient demographic and baseline data showed the treatment groups to be comparable Mean surgery time was longer for the randomized control group than for the coflexreggroup by 552 minutes Blood loss was also greater for the control group by 2389 cc as was length of hospital stay by 129 days
PMA P1 10008 FDA Summary of Safety and Effectiveness Data 38
Overall success was defined in the study protocol as improvement of at least 15 points in the ODI at 24 months compared to baseline no reoperations revisions removals or supplemental fixation and no major device related complications including but not limited to permanent new or increasing sensory or motor deficit
The results of overall success indicate that the coflex device is statistically non-inferior to the control group at 24 months To assess the impact of patients with unknown outcomes at 24 months or other potential biases various sensitivity analyses were conducted At every assessment time period the percentage of coflex patients achieving composite success was greater than fusion with the largest differences occurring at week 6 and month 3 Sensitivity analyses show that the coflex devices non-inferiority to fusion is not sensitive to missing data In addition all components of overall success of the coflex group are comparable to or better than the control group At 24 months 858 of coflex patients compared with 767 of fusion patients experienced at least a 15 point reduction in ODI
Additional analysis requested by FDA was an analysis of all unresolved spinous process fractures being analyzed as study failures The study met its endpoint of non-inferiority with this additional analysis
The Zurich Claudication Questionnaire measures the pain and function associated with spinal stenosis and was the assessment tool for a secondary endpoint in the study The study demonstrated that protocol-defined symptom improvement and functional improvement was greater in patients that received coflex compared to fusion
The study data indicate that the coflexreg device is at least as effective as the control for individual success components and is statistically non-inferior to the control for the composite definition of overall success
Benefit-Risk Conclusions The coflexreg device met the primary clinical study endpoint for success The implant resulted in a similar percentage of complications compared to posterolateral fusion The coflexreg implantation procedure is a shorter operation with less blood loss The data and analysis provided in this PMA support a conclusion that the probable risks are outweighed by the probable benefits of the coflexreg device for patients with one or two level lumbar stenosis from L1-L5 with at least moderate impairment in function who experience relief in flexion from their symptoms of legbuttocksgroin pain with or without back pain and who have undergone at least 6 months of unsuccessful non-operative treatment
Overall Conclusions Among 204 coflexreg patients 135 (662) achieved Month 24 CCS while among 104 fusion patients 60 (577) achieved Month 24 CCS Statistical analysis demonstrated
PMA P110008 FDA Summary of Safety and Effectiveness Data 39
that coflex was non-inferior to fusion with a posterior probability of 0999 which is greater than the success criterion of 0975
The preclinical and clinical data in this application support the reasonable assurance of safety and effectiveness of the coflexreg device when used in accordance with the Indications for Use Based on the clinical study results it is reasonable to conclude that a significant portion of the indicated patient population will achieve clinically significant results The clinical benefits of the use of the coflexreg device in terms of functional improvement reduction in pain and maintenance or improvement in neurological status outweigh the risks associated with the device and surgical procedure through 2 years follow-up when used in the indicated population and in accordance with the directions for use In conclusion the coflexreg device represents a reasonable alternative to posterolateral fusion for the treatment of spinal stenosis
XIII CDRH DECISION
CDRH issued an approval order on October 17 2012 The final conditions of approval cited in the approval order are described below
In addition to the Annual Report requirements the sponsor must conduct two Post-Approval Studies to provide long-term device performance and to evaluate device performance under actual conditions of use
1 Extended Follow-up of Premarket Cohort The sponsor must perform a 5-year post-approval study (PAS) to evaluate the longer term safety and effectiveness of the coflexreg Interlaminar Technology as compared to posterolateral fusion by following all patients from the pivotal investigational device exemption (IDE) study with device survival to 24 months (191 coflex subjects and 104 fusion subjects) annually through 5 years At each annual (+4 month) visit the sponsor will collect the following data Oswestry Disability Index (ODI) leg (right left and max) and back pain Visual Analog Scale (VAS) Zurich Claudication Questionnaire (ZCQ) health status survey (SF-12) neurological status as determined by physical exam radiographic information and all adverse events regardless of cause Radiographic information collected will include range of motion on lateral standing flexionextension films (at implanted and adjacent level(s)) radiolucency device displacement or migration and radiographic observations such as spinous process fractures or heterotopic ossification Any coflexreg patients with radiographic observations of spinous process fracture will be examined via CT at 5 years
The primary objective of the study is to evaluate the overall success rate where an individual patient is considered a success if all the following criteria are met
Improvement of at least 15 points in the Oswestry Low Back Pain Disability Index (ODI) at 5 years compared to baseline
No reoperations revisions removals or supplemental fixation
PMA P110008 FDA Summary of Safety and Effectiveness Data 40
No major device-related complications including but not limited to permanent new or increasing sensory or motor deficit at 5 years and
No epidural steroid injections in the lumbar spine
Success rates between the randomized investigational and control groups will be compared and assessed for non-inferiority based on a ten percent non-inferiority margin for the overall success analysis at 5 years Several sensitivity analyses will also be done to better assess success rates FDA will expect at least 85 follow-up at the 5-year time point to provide sufficient data to evaluate safety and effectiveness
2 Real Conditions of Use The sponsor must perform a 5-year real conditions of use study of the coflexreg Interlaminar Technology to fully characterize safety and efficacy when the coflex device is used in the intended patient population under general conditions of use The sponsor will evaluate the safety and efficacy of the coflex device by comparing at 5 years decompression alone versus decompression with additional stabilization with the coflex Interlaminar Technology in 230 patients (115 each in the device and comparison group) at 5 study centers in Germany and 5 US centers (20-30 patients per site) Clinical visits will occur pre-operatively the day of surgery and 3 months 6 months 12 months 24 months 36 months 48 months and 60 months postoperatively At each visit the sponsor will collect the following data Oswestry Disability Index (ODI) leg (right left and max) and back pain Visual Analog Scale (VAS) Zurich Claudication Questionnaire (ZCQ) neurological status as determined by physical exam radiographic information and all adverse events regardless of cause Radiographic information collected will include range of motion on lateral standing flexionextension films (at implanted and adjacent level(s)) radiolucency device displacement or migration and radiographic observations such as spinous process fractures or heterotopic ossification All coflex patients at US sites will be examined with CT at 24 months Any coflex patients with any radiographic observations of spinous process fracture will be again be examined via CT at 5 years The sponsor will also assess improvement of walking distance on a treadmill after 24 and 60 months
The primary objective of the study is to assess the treatment group for superiority compared to the control group considering
Mean improvement of Oswestry Low Back Pain Disability Index (ODI) after 24 months and
Rates of reoperations revisions removals or supplemental fixation
Means and rates between the randomized investigational and control groups will be compared and assessed for superiority for the overall success analysis Patients with reoperations revisions removals and supplemental fixations will not be assessed for Oswestry Disability Index Several sensitivity analyses will also be done to assess impact on success rates FDA will expect at least 85 follow-up at the 5-year time point to provide sufficient data to evaluate safety and effectiveness
PMA P110008 FDA Summary of Safety and Effectiveness Data 41
Please be advised that the results from these studies should be included in the labeling as these data become available Any updated labeling must be submitted to FDA in the form of a PMA Supplement
The applicants manufacturing facilities were inspected and found to be in compliance with the device Quality System (QS) regulation (21 CFR 820)
XIV APPROVAL SPECIFICATIONS Directions for Use See device labeling
Hazards to Health from Use of the Device See Indications Contraindications Warnings Precautions and Adverse Events in the device labeling
Post-approval Requirements and Restrictions See approval order
PMA P110008 FDA Summary of Safety and Effectiveness Data 42
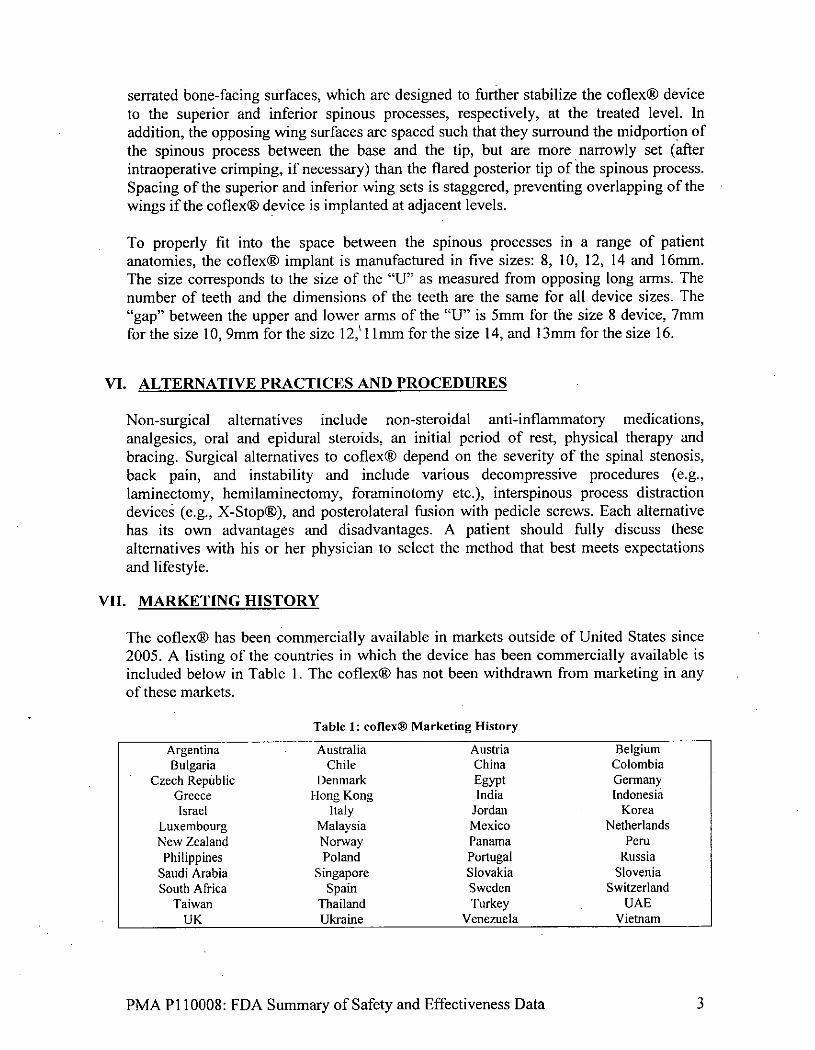

Test Purpose
Cadaveric To evaluate the Biomechanical effect of the Testing coflexreg
Interlaminar Technology on range of motion
Functional To ensure that the Testing of Pliers coflex bending
and crimping pliers allow the opening and closing ofthe device wings without damage to the implant
Method
Eight (8) cadaveric specimens (L4L5) were tested The center of rotation was established to minimize off-axis bending Specimens were preconditioned for 1000 cycles at 500N Compression (900N at 25cmmin) fexionextension (+12 Nm) lateral bending (Il2Nm) and axial rotation (+9 Nm) were applied under a 600 N preload
Six (6) coflexreg implants (8mm) were tested All separation distances were measured
Criteria Restoration of spine to normal flexionlextension axial rotation and lateral bending ranges of motion
Wings are required to be opened 50 compared to the baseline separation distance without damage to the implant following maximal spring back
Results
Partial destabilization increased flexionextension relative to intact spine by 121 Implantation of the coflex reduced this ratio to nearly 11 representing nearly complete restoration -In axial rotation a significant increase in ROM was observed after partial destabilization (-151) but it was restored to nearly normal (-121) after the implantation of coflexreg device -In lateral bending the results ofthe cadaveric testing confirm that the coflex device does not impose any significant limitation on lateral bending -Crimping produced an average decrease in wing separation distance of 424 (39-44) compared to open dimension after bending -Compared to baseline (before bending) an increase of 53 (-03-9) of the separation distance was produced No distances showed evidence of damage
Note that during the course of the clinical trial the wings were modified slightly for ease of stacking two devices at adjacent levels The holes in the wings were also removed The modification was not the result of any clinical problems safety issues or adverse events product complaints or surgeon requests from within or outside the United States As this
PMA P110008 FDA Summary of Safety and Effectiveness Data 8
modification was minor it did not affect the mechanical behavior of the device or the anticipated clinical outcome
Figure 2 Original coflexreg IDE Design (left) and Modified coflex Design (right)
Table 3 provides a summary of the laboratory studies for the modified coflex device
Table 3 Laboratory Studies on Modified coflex Device
Test Purpose
Static Axial To evaluate the Compression performance of
the modified coflexreg Interlaminar Technology under static axial compressive loading under worst-case conditions
Dynamic Axial To evaluate the Compression performance of
the modified coflexreg Interlaminar Technology under dynamic axial compressive loading under worst-case conditions
Dynamic Torsion To evaluate the maximum torsional load that the modified coflexreg Interlaminar Technology can withstand
Method
Five (5) samples ofthe coflexreg implant were tested under static compression
Fifteen (15) samples of the coflexregimplant were tested under dynamic compression to 10 million cycles at 10 Hz
Fi_
Fifteen (15) samples of the coflexreg implant were tested under dynamic torsion to 10 million cycles at 22 Hz and I8 Hz
AcceptanceCriteria The maximum compressive strength of the original IDE device 239 N
Run out load equal to or greater than original IDE device 150 N
Run out load equal to or greater than original IDE device 75 N
Results
The mean yield load was 309 N
The maximum run-out load to 10 million cycles was 150 N
The maximum run-out load to 10 million cycles was 75 N
PMA P110008 FDA Summary of Safety and Effectiveness Data 9
B Additional Studies
1 Biocompatibility
The coflex implant is manufactured from standard medical grade Ti alloy Ti6Al4V per ASTM F136 and ISO 5832-3 This is a standard material used in permanently implanted orthopaedic devices However cytotoxicity testing was performed to verify that the manufacturing process did not introduce any contaminants that could impact biocompatibility in accordance with ISO 10993-5 Biological evaluation of medical devices Part 5 Tests for in vitro cytotoxicity The test results demonstrated that the finished device passed the cytotoxicity test with the score of
The coflexreg surgical instruments are manufactured from titanium alloy per ASTM F136 stainless steel and an acetal copolymer Biocompatibility testing for the coflex trials was performed as recommended in ISO 10993-1 for devices having limited duration contact with tissue or bone Cytotoxicity Sensitization and Irritation testing was performed in accordance with ISO 10993-5 and ISO 10993-10 The test results demonstrate that all the trials (each with a different colorant) meet the acceptance criteria and are biocompatible for their intended use
2 Sterilization
Sterilization validation according to EN556-1 Sterilization of medical devices shyRequirements for terminally sterilized devices to be labeled Sterile and ISO 11137 Sterilization of Health Care Products Parts 1 2 and 3 was conducted to confirm that the sterility of the device is maintained through a sterile barrier
3 Shelf Life and Packaging Validation
Shelf life and packaging validation studies including packaging seal and integrity accelerated aging and real-time aging testing were conducted to demonstrate that the device packaging can maintain a sterile barrier with a shelf life of 5 years
4 MRI Compatibility
Non-clinical testing has demonstrated that the coflex Interlaminar Technology is MR Conditional It can be scanned safely under the following conditions
Static magnetic field of 15-Tesla (15T) or 30-Tesla (30T) Spatial gradient field of up to
o 11230 Gcm (1123 Tm) for 15T systems o 5610 Gcm (561 Tm) for 3OT systems
Maximum whole body averaged specific absorption rate (SAR) of o 20 Wkg for 15 minutes of scanning in Normal Operating Mode at 15T o 20 Wkg for 15 minutes of scanning in Normal Operating Mode at 3OT
PMA P110008 FDA Summary of Safety and Effectiveness Data 10
30T RF heating In non-clinical testing with body coil excitation the coflex Interlaminar Technology produced a temperature rise of less than 350 C at a maximum whole body averaged specific absorption rate (SAR) of 20 Wkg as assessed by calorimetry for 15 minutes of scanning in a 30T Siemens Trio (MRC20587) MR scanner with SYNGO MR A30 4VA30A software
15T RF heating In non-clinical testing with body coil excitation the coflexreg Interlaminar Technology produced a temperature rise of less than 350 C at a maximum whole body averaged specific absorption rate (SAR) of 20 Wkg as assessed by calorimetry for 15 minutes of scanning in a 15T Siemens Espree (MRC30732) MR scanner with SYNGO MR B17 software
Caution The RF heating behavior does not scale with static field strength Devices which do not exhibit detectable heating at one field strength may exhibit high values of localized heating at another field strength
MR Artifact In testing using a 3OT system with spin-echo sequencing the shape of the image artifact follows the approximate contour of the device and extends radially up to 19 mm from the implant
X SUMMARY OF CLINICAL STUDIES
The applicant performed a clinical study to establish a reasonable assurance of safety and effectiveness of coflex Interlaminar Technology for the treatment of moderate to severe spinal stenosis with back pain in the US under IDE G060059 Data from this clinical study were the basis for the PMA approval decision A summary of the clinical study is presented beloW
A Study Design
Patients were treated between October 2006 and March 2010 The database for this PMA reflected data collected through March 2012 A total of 384 patients were enrolled consisting of up to 40 non-randomized roll-in patients and 344 randomized patients Excluding 22 protocol violators 215 randomized coflex patients and 107 randomized control patients were enrolled There were 21 investigational sites
The study was a prospective randomized multi-center concurrently controlled clinical study Surgeons were blinded prior to patient randomization and patients were blinded until after surgery The control group was posterolateral fusion with autograft bone and pedicle screw fixation following surgical decompression Based on the well-established performance of posterolateral fusion in the medical literature a 21 randomization ratio was applied with block randomization and a randomly
PMA P110008 FDA Summary of Safety and Effectiveness Data 11
changing block size A Bayesian statistical plan utilizing Jeffries non-informative priors and a single late-information time interim analysis was used to analyze the success of the device After 70 of patients were evaluable for month 24 composite clinical success the Bayesian posterior probability was to be computed and compared to 0975 If larger than 0975 the interim analysis sample was to be used to support approval If not the data on the remaining patients would be included in the analysis cohort after they complete 24 months of follow-up and again the posterior probability would be compared to 0975 in a final analysis Subsequently FDA requested submission of the patient data for the entire cohort
An independent Data Safety Monitoring Board (DSMB) evaluated all safety events on a quarterly basis during the course of the study to ensure patient safety was not compromised All adverse events were independently reviewed and adjudicated by a Clinical Events Committee (CEC) with their decision binding on the study sponsor All radiographs were analyzed by an independent core lab (Medical Metrics Inc)
The control group was the accepted standard of care for this indication posterolateral fusion with pedicle screw fixation The systems utilized were the Expedium (Johnson and Johnson Inc) and the CD Horizon LegacyTM (Medtronic Inc)
I Clinical Inclusion and Exclusion Criteria
Enrollment in the coflex study was limited to patients who met the following inclusion criteria
Radiographic confirmation of at least moderate lumbar stenosis which narrows the central spinal canal at one or two contiguous levels from LI -L5 that require surgical decompression Moderate stenosis is defined as gt 25 reduction of the antero-posterior dimension compared to the next adjacent normal level with nerve root crowding compared to the normal level as determined by the investigator on CT Scan or MRI The patient may have but is not required to have for inclusion in the study
Facet hypertrophy and subarticular recess stenosis at the affected level(s) o Foraminal stenosis at the affected level(s) o Up to Grade I stable degenerative spondylolisthesis (Meyerding
classification) or equivalent retrolisthesis as determined by flexionextension X-ray
For single level disease there may be up to a Grade I stable spondylolisthesis or equivalent retrolisthesis at the affected level as determined on flexionextension films by the investigator
For two level disease there may be up to a Grade I stable spondylolisthesis or equivalent retrolisthesis at only one of the two contiguous affected levels as determined on flexionextension films by the investigator Patients with up to Grade I stable spondylolisthesis at two contiguous levels are excluded but patients with up to Grade I stable spondylolisthesis at one level and equivalent retrolisthesis at the adjacent level may be included
PMA P110008 FDA Summary of Safety and Effectiveness Data 12
o Mild lumbar scoliosis (Cobb angle up to 250) Radiographic confirmation of the absence of angular or translatory instability of
the spine at index or adjacent levels (instability as defined by White amp Panjabi Sagittal plane translation gt45mm or 15 or sagittal plane rotation gt150 at Ll-L2 L2-L3 and L3-L4 gt200 at L4-L5 based on standing flexionextension X-rays)
VAS back pain score of at least 50 mm on a 100 mm scale Neurogenic claudication as defined by legbuttocks or groin pain that can be
relieved by flexion such as sitting in a chair Patient has undergone at least one epidural injection at any prior time point AND
at least 6 months of prior conservative care without adequate and sustained symptom relief
Age between 40 to 80 years Oswestry Low Back Pain Disability Questionnaire score of at least 2050 (40) Appropriate candidate for treatment using posterior surgical approach Psychosocially mentally and physically able to fuly comply with this protocol
including adhering to scheduled visits treatment plan completing forms and other study procedures
o Personally signed and dated informed consent document prior to any study-related procedures indicating that the patient has been informed of all pertinent aspects of the trial
Patients were not permitted to enroll in the coflex study if they met any of the following exclusion criteria
More than two vertebral levels requiring surgical decompression Prior surgical procedure that resulted in translatory instability of the lumbar spine
[as defined by White amp Panjabi] More than one surgical procedure at any combination of lumbar levels Prior fusion implantation of a total disc replacement complete laminectomy or
implantation of an interspinous process device at any lumbar level Radiographically compromised vertebral bodies at any lumbar level(s) caused by
current or past trauma or tumor (eg compression fracture) Severe facet hypertrophy that requires extensive bone removal which would cause
instability Isthmic spondylolisthesis or spondylolysis (pars fracture) Degenerative lumbar scoliosis (Cobb angle of greater than 250) Disc herniation at any lumbar level requiring surgical intervention Osteopenia A screening questionnaire for osteopenia SCORE (Simple
Calculated Osteoporosis Risk Estimation) will be used to screen patients who require a DEXA bone mineral density measurement If DEXA is required exclusion will be defined as a DEXA bone density measured T score of -10 (The World Health Organization definition of osteopenia)
Back or leg pain of unknown etiology Axial back pain onlywith no leg buttock or groin pain Morbid obesity defined as a body mass index gt 40 Pregnant or interested in becoming pregnant in the next three years
PMA P110008 FDA Summary of Safety and Effectiveness Data 13
Known allergy to titanium titanium alloys or MR contrast agents Active or chronic infection - systemic or local Chronically taking medications or any drug known to potentially interfere with
bonesoft tissue healing (eg steroids) not including a medrol dose pack History of significant peripheral neuropathy Significant peripheral vascular disease (eg with diminished dorsalis pedis or
posterior tibial pulses) Unremitting back pain in any position Uncontrolled diabetes Known history of Pagets disease osteomalacia or any other metabolic bone
disease (excluding osteopenia which is addressed above) Cauda equina syndrome defined as neural compression causing neurogenic bowel
(rectal incontinence) or bladder (bladder retention or incontinence) dysfunction Fixed and complete motor sensory or reflex deficit Rheumatoid arthritis or other autoimmune diseases Known or documented history of communicable disease including AIDS HIV
active Hepatitis Active malignancy a patient with a history of any invasive malignancy (except
nonmelanoma skin cancer) unless heshe has been treated with curative intent and there has been no clinical signs or symptoms of the malignancy for at least five years Patients with a primary bony tumor are excluded as well
Prisoner or ward of the state Subject has a history of substance abuse (eg recreational drugs narcotics or
alcohol) Subject is currently involved in a study of another investigational product for
similar purpose Currently seeking or receiving workmans compensation In active spinal litigation
2 Follow-up Schedule
All patients were scheduled to return for follow-up examinations at 6 weeks 3 months 6 months 12 months 18 months and 24 months postoperatively
Patients were evaluated for Oswestry Disability Index (ODI) Zurich Claudication Questionnaire (ZCQ) SF-12 back and leg pain (via visual analog scale (VAS)) and neurological assessment at preoperative visit and at all postoperative visits Radiographic evaluation was performed at all timepoints Adverse events and complications were recorded at all visits
The key time points are shown below in the tables summarizing safety and effectiveness
PMA P110008 FDA Summary of Safety and Effectiveness Data 14
3 Clinical Endpoints
The safety of the coflexreg Interlaminar Technology was assessed by comparing adverse event incidence epidural steroid injections reoperations revisions and neurological function in comparison to the posterolateral fusion control group
The effectiveness of the coflexreg Interlaminar Technology was assessed by evaluating clinical pain and function (evaluated by ODI) compared to the posterolateral fusion control group
Per the protocol an individual patient was considered a Composite Clinical Success (CCS) if all of the following criteria were met at 24 months Improvement of at least 15 points in the Oswestry Low Back Pain Disability
Index (ODI) at 24 months compared to baseline No reoperations revisions removals or supplemental fixation and No major device-related complications including but not limited to permanent
new or increasing sensory or motor deficit at 24 months and No epidural steroid injections in the lumbar spine
Overall study success criteria were based on a comparison of individual patient success rates such that the patient success rate for the coflexreg investigational group must be non-inferior to that of the posterolateral fusion control group Bayesian statistical methods were used to obtain the posterior probabilities of non-inferiority and superiority According to the statistical analysis plan if non-inferiority was demonstrated then superiority would be evaluated as defined more
specifically in the analysis plan The posterior probability threshold of 0975 was used to determine non-inferiority
Secondary effectiveness evaluations specified in the protocol included comparisons of the following ZCQ Symptom Severity ZCQ Physical Function ZCQ Patient Satisfaction Leg and Back Pain (via VAS) SF-12 time to recovery and patient satisfaction
In addition several radiographic endpoints were considered in evaluating both safety and effectiveness including index level and adjacent level range of motion translation instability and device-related effects (eg device fracture or migration fusionnon-fusion spinous process fracture)
B Accountability of PMA Cohort
At the time of database lock (March 11 2012) of 322 per protocol patients (215 coflex and 107 fusion) enrolled in PMA study 957 (204 coflex and 104 fusion) had data available for analysis at the completion of the study Patient accountability is
shown in Table 4 a patient accounting tree is shown in Figure 3 and a summary of data available at 24 months for each specific evaluation is provided in Table 5
PMA P110008 FDA Summary of Safety and Effectiveness Data 15
Table 4 Patient Accounting and Follow-Up Compliance Table- Efficacy Evaluable (PP) coflex (1) and Fusion Control Patients (C)
Date of data transfer 03112012 Pro-Op Week 6 Month 3 Month 6 Month 12 Month 18 Month 24
I C I C I C I C I C I C
(1)Theoreticalfolow-up 215 107 215 107 215 107 215 107 215 107 215 107 215 107
(2) Cumrulative deaths 0 o a 0 00 0 0 0 0 0 0 0 0
(3) CurnlativeStudy Failures 0 0 8 3 11 6 20j10 26 12 35 17 42 18
(4) Nat Yet Overdue 0 0 a 0 0 0 0 0 0 0 0 0 1 0
(5)Deaths-failuresaringtheoreticaldue 0 0 8 3 11 6 20 10 26 12 35 17 42 18
() Expected duefor clinic visit6 215 107 207 104 204 101 195 97 189 95 180 90 172 89
(7) Failures arng theoretical due 0 0 8 3 11 6 20 10 26 12 35 17 42 I8
(8) Rpected due+failures among theoretical due 215 107 2151 107 15 1 1 f67 215 07 215 107 214 107
All Evaluated Accounting (ActualS) Among Expected Due Procedures
I C I C I C I C I C I C I C
(9) of procedures with any clinical data in interval 215 107 205 104 200 99 189 95 176 94 163 83 162 86
(10) An Evaluated Visit Cornpliance() 000 W00 99 0 V00 98 0[ 980 969 979 93 989 90b 922 42 968
(1) ChangeinDswestry Dsabily Score 215 107 202 102 196 96 187 95 176 92 163 83 162 86
(12) Radiographic evaluation 215 107 2 2 102 196 98 186 95 171 93 149 79 139 68
(13) CCS at Month 24 204 104
(14)Actuala Follow-upforCCSattnth24 M0 00 976 98 9895 950 959 979 9354 968 906 922 953 972 or for change in OI at other tins
Within Window Accounting (Actual t) Among Expected Due
II C I C IC i C I C IC I C
(15) ChangeinOswestry Cisability Score 215 107 184 93 187 92 165 82 168 88 151 72 149 78
(16) adigraphic evaiuaion 215 107 183 94 188 94 162 82 164 88 137 69 131 63
(17) CS at Ms 24 191 95
(18) ActualADFollow-upfor CCS0at tnth24 00 o0 N9 094 9t7 9t 5461845 889 926 839 800 89 3888 or and change in 001 at other tines
PMA P110008 FDA Sunimary of Safety and Effectiveness Data 16
Subjeicts Randomized
Subjects Treated Withdrawn nPrior to TreatmentIntraoperatively
384- 5
Randomnizi d Radmize Ro -In coflex
ProtclVoltr Rerrotocol Cohort -Non-Ranoie
22224 (16 coflex 7 Fusion)
icoflex Fusion-Raaoii ed Per Protocol Randomized Per Protocol
215 107
-Fusioncoflexreg Evguable coflexregLTFU at Evaluable at Fusion LTFUat atM 4 M24lt I24 M24gt 7t2 t1 amp104 3ltV
Figure 3 Patient Accounting Tree for coflex IDE Study Reasons for withdrawal prior to treatment 17 patients failed to meet inclusion and exclusion criteria 22 patients withdrew consent and 13 patients elected not to have surgery
Table 5 24 Month Data Accounting for coflex IDE Parameter coflexreg Fusion Control Randomized 262 136 Withdrawn Prior to Treatment 32 22 Subjects Treated (mlTT) 230 114 Protocol Violators 15 7 Per Protocol Cohort 215 107
Radiologic Assessments Foraminal Height 180(837) na ROM 187 (870) 102 (953) Translation 185 (860) 95(888) Fusiont na 102 (953)
Clinical Failures Among Implanted 42 18 Expected (Per Protocol) 172 89
ODI 162 (942) 86 (966) ZCQ 161 (936) 86 (966) VAS Leg and Back Pain 162 (942) 85 (955) SF-12 Physical Component Score 132 (767) 70(787) Mental Component Score 139 (808) 75(843)
This measurement taken only on coflexreg patients tThis measurement taken only on fusion patients and defined as bridging bone Patients with Reoperations Revisions and Epidural Steroid Injection
PMA P110008 FDA Summary of Safety and Effectiveness Data 17
In the tables that follow throughout this summary the randomized per protocol cohort is used for safety and efficacy analyses unless otherwise indicated
C Study Population Demographics and Baseline Parameters The clinical study sites represent a mix between academic and community hospital settings urban and regional settings of care and were selected from varied geographic regions of the country
Table 6 Summary of Baseline and Demographic Variables - coflexreg and Fusion Control Efficacy Evaluable (PP) Co orts
coflex Fusion Control
Demographics -All N Mean SD N Mean SD Age at surgery (yrs) 215 62 1 92 107 641 90
Height (inches) 215 670 41 107 666 41
Weight (lbs) 215 gt1903 354 107 1877 381 BMI (kit) 215 297 45 107 296 49
Demographics - Male N Mean SD N Mean SD Age at surgery (yrs) 109 617 93 49 1 642 104
Height (inches) 109 699 27 49 699 29
Weight (lbs) 109 2071 273 49 2076 323
BM (kin2) 109 298 37 49 297 44
Demographic - Female N Mean i SD N Mean SD Age at surgery (yrs) 106 626 91 58 641 77
Height (inches) 106 640 29 58 1 638 25
Weight (Ibs) 106 1731 346 58 1708 345
BMI (krr) 106 296 52 58 295 54
Baseline Functional Status N Mean SD N Mean SD Oswestry (O) 215 608 118 1071 607 115
Zurich Claudication Qx Severity 214 36 06 107 36 06
Zurich audication Ox Physical 214 27 04 107 2 1 0 4
SF-12 PCS(ihysical-) -195 281 66 95 282 60
SF-12 rvcrS(riintal Health) 195 455 130 95 449 122
VAS Back pain 215 795 150 106 792 135
VAS Leg pain (worse lg) 215 760 204 106 78 j 184
PMA P110008 FDA Summary of Safety and Effectiveness Data 18
Table 7 Summary of Baseline and Demographic Categorical Variables - coflexreg and Fusion Control Efficacy Evaluable (PP) Cohorts
coflex Control
n n
Number of subjects 215 107
Males 109 507 49 458
Females 106 493 58 542
Number of levels n I n 1-level decompression 138 1 642 68 636 2-eve ecomression 77 358 39 364
Current smoker n n Yes 22 102 15 140
No 193 898 92 860
Comorbidities n n Cardiovascular 137 637 74 692 Musculoskeletal 112 521 61 570 Endocrine 55 256 35 327
Duration of Back Pain n n None 0 00 0 00
Fewer than 6 months 3214 1 09 6 monthstoa year 24 112 14 131 More than one year 188 874 92 860
Duration of Leg Pain (maximum) None
n 1
05
n 1
09
Fewerthan 6 months 6 28 8 75 6 months to a year 38 177 22 206 More than one year 170 1 791 76 710shy
Duration of Buttock Pain n n
None 32 149 21 196
Fewer than6 moths- 11 51 7 65
monts to a ye 41 11V22 206 Mre than one year 131 609 57 533
Duration of Groin Pain n n None 157 1 730 74 692
Fewer than 6 months 28 5 47
6 months to a year 13 60 12 112
More than one year 39 181 16 150
PMA P 110008 FDA Summary of Safety and Effectiveness Data 19
Table 8 Summary of Baseline and Demographic Categorical Variables - coflexreg and Fusion Control Efficacy Evaluable (PP) Cohorts (Continued)
coflexreg Control
Previous Conservative Treatment of the Spine n n None 28 130 9 84 Physical therapy 132 614 70 654
NSAJDsASNAcetinomphen only 121 563 65 607 Chiropractic 82 381 41 383 CorsetBrace 37 172 22 206 Anynarcoticuse 107 498 5 514 Other 34 158 15 140
Previous Surgical Treatment of the Spine n n
None 0 00 0 00 Discectomy - 4 19 0 00
Fusion 3 14 0 00 IDET 1 05 i 09 Epidural injections 210 977 105 1 981 Other injections 35 163 18 168 Laminotomy 10 47 2 19
Race n n American Indian Alaskan Native 1 05 3 28 Aian 4 19 3 28 BackorAricanAm-erican 11 51 6 56 White 191 888 93 869 Other 8 37 2 19
D Safety and Effectiveness Results
1 Safety Results The analysis of safety was based on the per protocol cohort of 322 patients (215 coflex patients and 107 fusion patients) Adverse events reported by the investigating surgeons and adjudicated by the CEC are reported in Table 9 to Table 11 The key safety outcomes for this study are presented below in Table 12 through Table 16
PMA P1 10008 FDA Summary of Safety and Effectiveness Data 20
Table 9 Incidence of Adverse Events coflex and Fusion Control Efficacy Evaluable (PP) Cohort
Operative Site Pain new + frequency worsening Wound problems Fracture2
Other Component loosening Component migration Component breakage Infection (deep) Component deformation Incidental durotomy (c= 5 mm) Tear gt5mm Heterotopic ossification Hematoma requiring drainage
Non-Operative Site
Musculoskeleta 4
Neurological Other Cardioascular Gastrointestinal Skin and Subcutaneous Tissue Genitourinary Respiratory EndocrineMetabolic CancerNeoplasm EENT Hematological
Immune PsychiatricSubstance abuse
coflex (N=215)
n
71 330 30 140 11 51 9 42 3 14 3 14 2 09 2 09 0 00 0 00 0 00 0 00 0 00
121 563 51 237
29 135 21 98
15 70 14 65 13 60 9 4 2 8 37 6 28 6 28 5 23 1 05 1 05
Control (N=107)
n
37 346 9 84 2 19 3 28 4 37 1 09 2 19 0 00 0 00 0 00 0 00 0 00 1 09
65 607 23 215
16 150 11 103
12 112 9 84 9 84 6 56 4 37 9 84 4 37 4 37 0 00 7 65
Wound problems Include wound drainage superficial infections dehiscence seroma and delayed healing of incision 2Fracture Includes spinous process fracture pars fracture and other fractures of the vertebral bodies reported by investigators 3Other Operative Site Includes events not placed into a specific category by investigators including clicking sound spondylolisthesis drain complications incisional pain spinal swelling and cellulitis 4Musculoskeletal Includes weakness cramping joint pain joint surgery or replacement and other non-lumbar spinal musculoskeletal tissues Neurological Includes balance problems headaches numbness andor tingling and
changes in sensation 6Other Non-Operative Site Includes psychological disorders infectious diseases insomnia and fever
Table 9 shows the comparison of percentages of complications between the coflex and fusion Per Protocol cohorts at specific operative and non-operative
PMA P1 10008 FDA Summary of Safety and Effectiveness Data 21
sites With the exception of wound problems adverse events rates were
comparable between coflex and fusion control The numerical difference of wound complications between coflexreg 140 (30215) and control 84 (9107) was 56 This difference was not statistically significant Table 10 demonstrates the time course of all adverse events
Table 10 Time Course of Adverse Events coflex (I) and Fusion Control (C) Efficacy Evaluable (PP) Cohort
immed Post-Op gtMo 3 gtMo 6 gtMo 12 ay of Surgery to Month 3 to Mo 6 to Mo12 to Mo 24
Relative Day 0 (Reliy 1-90) (RelDoy 91-180) (RelDay 181-365) (RelDay 365-730)
1 C I C I C I C j- C
Expected Due 215 107 204 101 s 97 189 95 89
Operative Site Pain new +frequency worsening 0 Q 1 21 10 13 11 25 7 - tt24 T17T
Wound problems - 2 0 29 10 0 0 0 0 t 0 Fracture 0 4 0 3 2 1 1 0
Other- -- 2_i 2 0 2 1 4 0
Device component loosening 0 0 0 o0 0 1 1 2 2
Device component migration 0 2 0 0 1 T0 0 1 0
Deoce component breakage 0 0 0 1 4 0 0
Infection (deep) 0 2 0 0 0 0 0
Hematoma requiring drainage 0 1 0 0 0N 0 0 0
Non-Operative Site Musculoskeletal 1 61 27 26 27 i9 24 72 34
Neurological o 0 25 i I 9 1 3 25 11 Other 0 0 12- 3 3 2 1 2 4 6 Cardiovascular w 1 2gt 4 0 8 4 9 3
Gastrointestinal 0 3- 2 3 2 0 1 5
Skin and Subcutaneous Tssue 0O 1 - 5 1 1 t 2 2
Genitourinary _0 2 4 4 1 I 0 0 5 2 Respiratory 0 0 3 3 0 2 1 3 EndocrineMetabolic t 0 -A 0 0 1 0- 0 -lt5 1
CancerNeoplasm 0 0 1 0 1 0 1 2 5
EENT 0jo024o - o 0 2o 01 Hematological i- 0swlt 1 2 1 t il 0 0 1 2 2
Immune lto0 0 -o- 0 0 0 0 0 i 0
PsychiatrcSubstance abuse 0 0 O 3 1 1 0 0 0- 2
Total 6- -7 178 81gt74 -59 132 53 180 9W
PMA P110008 FDA Summary of Safety and Effectiveness Data 22
) wI0N~cN tQO -
U om0
0 (36 - 0 4-CU
C
-4 - ai o - ~ 6 S toj~
CL
00
u
NW IL( (
C CJ C 0 C 0 -0 0 0 0 -
0
-4
oc
0 C
~D tB-gt 000
uc o-2
4) gt
CL MshyE a LLo
N- shy odoEcoo -0)c ( 0 0000 0Z 0
Cr~~~ H-n r4
qc-LL
O 0O 0 -
( 0 00O3000 0 (Nm4o ) )
4)0 w D~ 0 w wV D
z)I md - -a 0 40
Spinous Process Fractures Spinous process fractures were observed by the core radiographic laboratory in 30 coflex patients (140) and 8 fusion patients (119 of patients with spinous processes retained by partial laminectomy) Spinous process fractures were also observed by the investigator surgeons The incidence of fractures observed by the surgeons differed from that observed by the core radiographic laboratory as 8 coflex patients (37) and no fusion patients (00) had spinous process fractures noted by the investigational sites 83 of patients in the coflex group and 75 of patients in fusion group who had spinous process fractures observed by the radiographic laboratory did not have any associated symptoms at the time the fracture was observed Table 12 and Table 13 detail the incidence of spinous process fractures in coflex and fusion patients
Table 12 Spinous Process Fracture Incidence in coflex IDE Study coflex Fusion Control
nN nN S inous Process Fracture 30215 140 867 119 Fusion patients with spinous processes retained by partial laminectomy
Table 13 Time Course of Spinous Process FractureIncidence in coflex IDE Study
Group i Time of Initial Fracture Observation TotalPost-op 6W 3M 6M 12M 118M 24M
coflex 5 13 6 1 - - 5 30 Fusion Control 4 2 2 - - - - 8
f 3 out of the 5 observations at 24 months had unreadable or missing 6 week 3 month 6 month 12 month and 18 month X-rays
By month 24 48 of the coflex spinous process fractures were resolved Of the unresolved spinous process fractures 75 were asymptomatic and resulted in no clinical sequelae or loss of foraminal height during the study None (0) of the fusion spinous process fractures were resolved by month 24 and 75 of these patients were asymptomatic
The adverse event rate associated with spinous process fractures was not significantly higher than the patients without spinous process fractures The long term effects of these spinous process fractures past 24 months are unknown
PMA P110008 FDA Summary of Safety and Effectiveness Data 24
Surgery and Hospitalization Data
Table 14 Summary of Operative Details Continuous Variables coflex and Fusion Control Efficacy Evaluable (PP) Cohorts
coflexreg Fusion Control 95 Cl 95 Cl
1-and 2-level procedures N Mean SD (LB UB) N Mean SD (LB UB)
Hospital LOS (days) 215 190 108 (175 204) 107 319 161 (288 350)
Estimated blood loss (cc) 215 1097 1200 (9351258) 105 3486 2818 (2940 4031)
Operative time (minutes) 214 980 411 (925 1036) 107 1532 555 (1425 1638)
95 Cl 95 C1 N Mean SD (LB UB)1-level procedures N Mean SD (LB UB)
Hospital LOS (days) 138 186 114 (166 205) 68 287 145 (252 322)
Estimated blood loss (cc) 138 980 963 (8181143) 66 2909 2070 (2400 3418)
Operative time (minutes) 137 908 440 (834 982) 68 1420 560 (1284 1555)
95 Cl 95 Cl 2-level procedures N Mean SD (LB UB) N Mean SD (LB UB)
Hospital LOS (days) 77 197 095 (176 219) 39 374 174 (318 431)
Estimated blood loss (cc) 77 1305 1521 (959 1650) 39 4462 3584 (3300 5623)
Operative time (minutes) 77 1109 318 (10371181) 39 1727 493 (15671887)
The 95 confidence interval is provided as a measure of the statistical precision of the estimated treatment group mean or percentage Non-overlapping confidence intervals imply statistically reliable device group differences
Table 14 demonstrates that the average operating time in the fusion patients was 552 minutes greater than the coflexreg patients Average blood loss in fusion patients was 2389 cc greater in the fusion patients than in coflexreg patients The average hospital length of stay was 129 days longer in the fusion patients
Reoperations and Revisions
Through 24 months of follow up the overall reoperation rate was 107 in the coflex group and 75 in the fusion control Reoperations where the device was maintained are summarized in Table 15 and revision surgeries are summarized in Table 16
PMA P110008 FDA Summary of Safety and Effectiveness Data 25
Table 15 Reoperation Events in the coflex Clinical Trial
Reoperation Treatment Event Time Course (months) Total Reasons Type Group lt15 15-3 3-6 6-12 12-24 24-36 36-48 (events)
Irrigation and 2 wound dehiscence Debridement ______ 2 deep infections
SupplementalDecomesion Decompression
coflexreg - - - 1 1 1 1 4
3 leg andor low back pain I herniation
CSF Repair coflexreg I - - - - - - I I CSF leak
Non-Index 2 leg andor low back
Lumbar Fusion pain Hematoma Drainage Fusion I - - - - - - II wound hematoma
Irrigation and Fusion 2 - 2 2 deep infections1
Debridement Supplemental I synovial cyst Decomression herniation
A single fusion patient had 2 operations for deep infection
Table 16 Revision Events in the coflex Clinical Trial
Revision Type Treatment Event Time Course (months) Total Reasons Group lt15 15-3 3-6 6-12 12-24 24-36 36-48 (events)
Device I bone-related fracturereplacement (with coflexreg - 2 - - - - - 2 seroma coflexreg)
Decompression 2 leg andor low back and Device coflexreg - - - I I - - 2
Removal pain 14 leg andor low back
pain2 Transition to 4 bone-related fracture fusioncoflex 2 4 7 6 3 22 2 component loosening
I herniation I synovial cyst
Debridement and coflexreg I - - - - - I I deep infection Device Removal
shy
I component looseningDevice Removal Fusion - shy 2 2 1 back andor leg pain
2 broken pedicle reacem Fusion - - - 1 3 - I 5 screwst
3 component loosening
back andor leg painAdjacent level F7enFusion 1 2 3 2 10 2 pseudoarthrosisextension II bone-related fracture
A single fusion patient had 2 revisions for broken pedicle screws 2Three coflex patients had a transition to fusion after a previous reoperation or replacement of coflex
Through 24 months the reoperations and revisions in the coflex group included 5 irrigation and debridement procedures (including 1 cerebrospinal fluid leak) 2 supplemental decompression surgeries retaining the device 2 revisions for coflex removal amp replacement 2 decompressions and device removal 1debridement and device removal and 13 (60 13215) conversions to primary fusion Two patients had a reoperation prior to a revision There were no revisions related to device breakage
Through 24 months the reoperations and revisions in the fusion control group included 1 reoperation due to post-operative hematoma 4 revisions of the fusion system due to
PMA P110008 FDA Summary of Safety and Effectiveness Data 26
device breakage or component loosening and 5 extensions of the fusion to an adjacent level
Between 24 months and 48 months of follow up there were 13 additional reoperations or revisions in 12 coflex patients (63 (12192)) and 12 additional reoperations or revisions in 10 fusion patients (101 (1099)) One of each of the coflexreg and fusion revisions was in a patient who had a reoperation prior to 2 years Based on available patient data through 48 months the coflexreg revision rate is 158 and the fusion control revision rate is 159
2 Effectiveness Results
Primary Effectiveness Analysis The analysis of effectiveness was based on the per protocol cohort of 322 patients (215 coflex patients and 107 fusion patients) evaluable at the 24-month time point Key effectiveness outcomes are presented in Table 17 through Table 32
Table 17 Posterior Probabilities of Success at 24 Months in cotlex Clinical Trial
Number and Percentage Achieving Month 24 CCS Posterior Probability
coflexreg Fusion Control of Non-Inferiority _ ~ I _-___Fn IN IT _ _ _ _
Month 24 204 135 662 104 60 577 0999
Composite Clinical Success
Non-inferiority of the coflexreggroup compared to the control group was demonstrated for the Composite Clinical Success (CCS) at 24 months
Table 18 Posterior Means and 95 Credible Intervals for Month 24 CCS
Mean SD 95 Bayesian Credible Interval
coflex 662 33 595 to 724
fusion 577 48 481 to 669
difference 85 58 -29 to 200
Mean SD and 95 Bayesian Credible Interval computed as the mean standard deviation 25th percentile and 975th percentile of 10000 draws from the posterior distributions
The Bayesian posterior means standard deviations and 95 credible intervals were determined from 10000 draws from the posterior distributions based on the final per protocol population The credible intervals are defined so that there is a095 probability that the true success likelihoods are contained within the interval The estimated difference is
85 The lower bound of Bayesian posterior credible interval for the device group difference in success rates is equal to -29 which is larger than the pre-specified non-inferiority margin of -10
PMA P110008 FDA Summary of Safety and Effectiveness Data 27
The Statistical Analysis Plan specified that primary non-inferiority evaluation would be performed in a per protocol population All protocol violations (PV) were confirmed by an Independent Clinical Events Committee Among the 230 randomized patients receiving coflex 15 (65) had a protocol violation leading to exclusion Similarly among the 114 randomized patients undergoing fusion 7 (61) had a protocol violation leading to exclusion The primary efficacy variable was evaluable for all 22 PVs in this study Among 15 coflexreg PVs 6 (400) met the study success criterion Similarly among 7 fusion PVs 3 (429) met the study success criterion The clinical results for the PVs were pooled with the per protocol population to construct a modified Intent-to-Treat (mITT) population defined as all randomized patients receiving a study procedure The Bayesian posterior probability that coflexreg is clinically non-inferior to fusion is 0999 essentially the same as in the primary per protocol population
Table 19 Posterior Probabilities of Success at 24 Months in coflex Clinical Trial (mITT Cohort)
Number and Percentage Achieving Month 24 CCS
coflex Fusion Control Posterior Probability
of Non-Inferiority N n _ N n
Month 24 219 141 644 111 63 568 0999
Non-inferiority of the coflex group compared to the control group was demonstrated for the CCS at 24 months in the mITT cohort
Table 20 Posterior Means and 95 Credible Intervals for Month 24 CCS (mITT Cohort)
Mean SD 95 Bayesian Credible Interval
coflexreg 644 32 579 to 705
fusion 568 47 474 to 657
difference 76 56 -34 to 189
Mean SD and 95 Bayesian Credible Interval computed as the mean standard deviation 25th percentile and 975th percentile of 10000 draws from the posterior distributions
For the per protocol population Table 21 demonstrates the time course of success in the coflexregclinical trial
PMA P110008 FDA Summary of Safety and Effectiveness Data 28
Table 21 Time Course of Composite Clinical Success in coflex Clinical Trial
Number and Percentage Meeting Criteria with 95 Cl2
coflex Fusion Control
95 CI 95 CIN n (LB UB) N n (LB UB)
Week 6 210 172 819 (767 871) 105 69 657 (566 748)
Month 3 207 171 826 (774 878) 102 72 706 (617 794)
Month 6 207 162 783 (726 839) 105 81 771 (691 852)
Month 12 202 151 748 (688 807) 104 74 712 (624 799)
Month 18 198 135 682 (617 747) 100 68 680 (589 771)
Month 24 204 135 662 (597 727) 104 60 577 (482 672)
Notes 1 The composite clinical success criteria at times points prior to Month 24 did not include the no persistent new or worsening sensory or motor deficit since persistence was established by identifying new or worsening deficits at Month 18 that did not resolve by Month 24 otherwise the CCS criteria at earlier time points were consistent with the primary Month 24 CCS 2The 95 confidence interval is provided as a measure of the statistical precision of the estimated treatment group mean or percentage Non-overlapping confidence intervals imply statistically reliable device group differences
Table 21 demonstrates the CCS at each timepoint The CCS at 24 months is determined by the ODI improvement compared to baseline absence of secondary surgeries or epidural pain management and neurologic success It should be noted that neurologic success endpoint is based on comparing changes from baseline to both Month 18 and Month 24 and thus is not definable prior to the 24 month timepoint ODI measurements and success may fluctuate over time while discrete events endpoints such as secondary surgeries and epidural injections were assessed as time to event variables
Patients in the coflex group demonstrated a 819 CCS at 6 weeks which increased to 826 at 3 months and gradually fell to 662 at 24 months Patients in the control group demonstrated 657 CCS at 6 weeks which rose gradually from 6 Weeks to 6 Months to 771 CCS fell to 577 at 24 months At every assessment time period the percentage of coflex patients achieving CCS was greater than fusion with the largest differences occurring at week 6 and month 3 demonstrating statistical significance at those time points The final CCS at 24 months demonstrates numerical success that is 85 higher in the coflexreg group when compared to the fusion control
PMA P110008 FDA Summary of Safety and Effectiveness Data 29
Table 22 Treatment Success at 24 Month Follow- p in coflexreg Clinical Trial Number and Percentage Meeting
Criteria
coflex Fusion Control
N n N n Improvement of at least 15 points in ODI at Month 24 162 139 858 86 66 767 compared to baseline No reop or epidural (Up to Day 730) 215 173 805 107 89 832
No reoperations revisions removals or supplemental 215 192 893 107 99 925 fixation No epidural injection at any lumbar level 215 190 884 107 94 879
No persistent new or increasing sensory or motor 179 169 944 97 89 918 deficit at 24 months
No persistent new or increasing sensory deficit at 24 mo 199 191 960 99 96 970
No persistent new or increasing motor deficit at 24 mo 180 177 983 97 91 938
No major device-related complications 215 212 986 107 103 963
Composite Clinical Success 1204 4135 662 104160 577
With regard to the functional parameter of the CCS the coflexc device group demonstrated a greater proportion of patients with a clinically significant improvement in ODI score compared to the fusion control In the neurological and device related complications components of the primary endpoint the coflex group demonstrated similar or higher patient success percentages compared to the fusion control Success in the reoperations and revisions component of the primary endpoint is higher in the fusion control group than inthe coflex group
Sensitivity Analysis
Table 23 Posterior Probabilities of Success at 24 Months in coflex Clinical Trial Number and Percentage Achieving
Month 24 CCS Posterior Probability coflex Fusion Control of Non-Inferiority
N n N n
Per Protocol Analysis 204 135 662 104 60 577 0999
Unresolved Spinous Process 204 119 583 104 56 0993538 Fractures as Failures2
Unresolved Spinous Process fractures counted as failures regardless of clinical significance 83 of patients in the coflex group and 75 of patients in fusion group who had spinous process fractures observed by the radiographic laboratory did not have any associated symptoms at the time the fracture was observed
In sensitivity analyses the 24 Month Composite Clinical Success endpoint was modified to include as failures patients with an unresolved spinous process fracture at 24 months Review of the spinous process fractures and the resolution of these fractures were performed by an independent radiographic core laboratory for the purpose of this analysis With this
PMA P 110008 FDA Summary of Safety and Effectiveness Data 30
modification in the success definition the Composite Clinical Success rate decreased from 66 (135 of 204) to 58 (119 of 204) in the coflex group and from 58 (60 of 104) to 54 (56 of 104) in the fusion group and the Bayesian posterior probability changed from 0999 to 0993 still meeting the a priori defined criterion for success Therefore including unresolved spinous process fractures in the failure definition had no appreciable impact on the comparison between the devices
A tipping point analysis was also performed to determine the effect on the primary endpoint of missing Month 24 data Results of the tipping point
analysis demonstrated that the finding of non-inferiority was insensitive to missing data at Month 24
Poolability Analysis Analyses were conducted to assess poolability of data across sites and between patients with I versus 2 level implants There was no statistical evidence of site-to-site differences in the comparisons between coflexreg and fusion Similarly patients receiving 2 level implants had clinical outcomes that were generally comparable to those receiving a I level implant
Secondary Effectiveness Analysis In addition to the components of the primary endpoint presented above secondary effectiveness variables were also assessed and the results are
provided below The following secondary endpoints were specified
ZCQ Symptom Severity ZCQ Physical Function ZCQ Composite Success VAS Leg Pain VAS Back Pain SF-12
ZCQ Symptom Severity
Table 24 ZCQ Symptom Severity at 24 Month Follow-Up in coflex Clinical Trial
Number and Percentage Meeting Criteria with 95 Cl
coflex Fusion Control
95 CI 95 ClN n (LB UB) N n -9L B
ZCQ Symptom Severity 161 142 882 (832 932) 86 67 779 (691 867)Improvement gt05 points The 95 confidence interval isprovided as a measure of the statistical precision of the estimated treatment group mean or percentage Non-overlapping confidence intervals imply statistically reliable device group differences
PMA P110008 FDA Summary of Safety and Effectiveness Data 31
Table 24 shows the subjects achieving success defined as a decrease in ZCQ Symptom Severity of at least 05 points in the Per Protocol cohort Month 24 data demonstrates a higher percentage of coflex patients meeting the success threshold compared to the fusion control (882 vs 779)
ZCQ Physical Function
Table 25 ZCQ Ph ysical Function at 24 Month Follow-Up in coflex Clinical Trial
Number and Percentage Meeting Criteria with 95 Cl
coflexreg Fusion Control
(LB UB) N (LB UB) ZCQ Physical Function 161 138 857 (803 911) 86 63 733 (639 826)Improvement gt05 points1The 95 confidence interval is provided as a measure of the statistical precision of the estimated treatment group mean or percentage Non-overlapping confidence intervals imply statistically reliable device group differences
Table 25 shows the subjects achieving success defined as a decrease in ZCQ Physical Function of at least 05 points in the Per Protocol cohort Month 24 data demonstrates a higher percentage of coflext patients meeting the success threshold compared to fusion (857 vs 733)
ZCQ Composite Success
Table 26 ZCQ Composite Success at 24 Month Follow-Up in coflex Clinical Trial
Number and Percentage Meeting Criteria with 95 Cl
coflex Fusion Control
95 CI 95 Cl (LB UB) (LB UB)
ZCQ Composite Success at Month 24
161 126 783 (719 847) 86 58 674 (575 773)
The 95 confidence interval is provided as a measure of the statistical precision of the estimated treatment group mean or percentage Non-overlapping confidence intervals imply statistically reliable device group differences
Table 26 shows the subjects achieving a Composite ZCQ Success in the Per Protocol cohort defined as a decrease in ZCQ Physical Function of at least 05 points a decrease in ZCQ Symptom Severity of at least 05 points and ZCQ Satisfaction score gt25 Month 24 data demonstrates a higher percentage of coflexreg patients meeting the success threshold compared to the fusion control (783 vs 674)
PMA P110008 FDA Summary of Safety and Effectiveness Data 32
VAS Leg Pain
Table 27 VAS Leg Pain Success at 24 Month Follow-Up in coflex Clinical Trial
Number and Percentage Meeting Criteria with 95 ClO
coflexreg Fusion Control
95C N 95 ClN n 5C N n (LB(LBUB)(LB UB)
Decrease of at least 20 mm 162 134 827 (769 885) 85 67 788 (701 875)VAS leg Pain (Max)
The 95 confidence interval is provided as a measure of the statistical precision of the estimated treatment group mean or percentage Non-overlapping confidence intervals imply statistically reliable device group differences
Table 27 shows the subjects achieving success defined as a decrease in VAS Leg Pain of at least 20mm in the Per Protocol cohort Month 24 data demonstrates a higher percentage of coflexreg patients meeting the success threshold compared to the fusion control (827 vs 788)
VAS Back Pain
Table 28 VAS Back Pain at 24 Month Follow-Up in coflex Clinical Trial
Number and Percentage Meeting Criteria with 95 Cl
coflexreg Fusion Control
N 95 Cl (LB UB) N
95 CI (LB UB)
Decrease of at least 20 mm VAS Back Pain
162 143 883 (833 932) 85 68 800 (715 885)
1The 95 confidence interval is provided as a measure of the statistical precision of the estimated treatment group mean or percentage Non-overlapping confidence intervals imply statistically reliable device group differences
Table 28 shows the subjects achieving success defined as a decrease in VAS Back Pain of at least 20mm in the Per Protocol cohort Month 24 data demonstrates a higher percentage of coflex patients meeting the success threshold compared to the fusion control (883 vs 800)
PMA P110008 FDA Summary of Safety and Effectiveness Data 33
SF-12
Table 29 SF-12 Success at 24 Month Follow-Up in coflex Clinical Trial
Number and Percentage Meeting Criteria with 95 Cl
coflex Fusion Control
95CI 95 Cl (LB UB) N n LB UB)
Maintenance or improvement 132 92 697 (619 775) 70 48 686 (577 794)inSF-12 MCS Maintenance or improvement 132 121 91-7 (870 964) 70 58 829 (740 917) in SF-12 PCS
The 95 confidence interval isprovided as a measure of the statistical precision of the estimated treatment group mean or percentage
Table 29 shows the percentages of subjects meeting success defined as maintaining or improving in the SF-12 Physical Function and Mental Health components of the per protocol cohort The percentage of patients meeting SF-12 Physical Function success criterion is higher for coflexreg at month 24 compared to the fusion control (917 vs 829)
Radiographic Assessments Maintenance or improvement of foraminal height was a radiographic endpoint in the study This is a measure of the mechanism of action of the coflexreg device which is to maintain foraminal height coflexreg was able to improve or maintain foraminal height in 100 of patients measured at 24 months This measurement was taken only on the coflex patients
Range of motion at the index level was measured at 24 months The average range of motion was 45 in the coflexreg group and less than 20 in the control The analysis of the mean range of motion at the index and adjacent levels demonstrates that motion was maintained in the coflex patients
Translational motion as a measure of instability was assessed at 24 months in both coflexreg and fusion patients At the index level the sagittal plane translation is reduced with fusion The coflexreg group maintained a similar sagittal plane translation from pre-op to 24 months (see Table 30 and Table 3 1 for radiographic results)
The control group received the current standard of care posterolateral fusion with pedicle screws The radiographic endpoint in this group the presence of fusion was compared to the absence of bridging trabecular bone in the coflexreg group No coflexreg patients had bridging bone at 24 months 673 of control patients had radiographic fusion at 24 months There were 327 of control patients who were not fused at 24 months and 202 of control patients had screw loosening however many of these patients were asymptomatic
PMA P110008 FDA Summary of Safety and Effectiveness Data 34
The device condition through 24 months demonstrated I device wing fracture of coflexreg and 3 device breakages and 21 patients with loose screws in the control patients
As discussed above during the study a number of spinous process fractures were observed in the coflexreg patients by the independent radiologists which were asymptomatic at the 24 month timepoint and not observed by the investigator surgeons
Table 30 Range of Motion Results in coflex IDE Study (0Flexion to Extension)
Number and Percentage Meeting Criteria with 95 CI coflex Fusion Control
At Level(s) of Implant (per level)
SD 95 Cl 95 ClN Mean (LBSUS) N Mean SD (LUS
(LB UB) (LB UB) Pre-Op 281 455 386 (410 501) 145 415 333 (361 470) Month 24 254 417 390 (369465) 140 159 197 (126192)
Above Level of Implant (per patient) 95 Cl 95 ClN Mean SD (LB UB N Mean SD (LB UB
(LB UB) (LB UB) Pre-Op 207 417 349 (369465) 104 368 299 (310 426) Month 24 186 408 357 (356459) 102 560 462 (470 651)
Below Level of Implant (per patient)
95 Cl 95 ClN Mean SD (LB US N Mean SD (LB UB (LB UB) (LB UB)
Pre-Op 195 581 414 (522 639) 101 565 384 (489 641) Month 24 176 653 466 (584 722) 96 695 442 (605 784)
The 95 confidence interval is provided as a measure of the statistical precision of the estimated treatment group mean or percentage Non-overlapping confidence intervals imply statistically reliable device group differences
PMA P1 10008 FDA Summary of Safety and Effectiveness Data 35
Table 31 Translation Results in coflex IDE Study (mm Flexion to Extension)
Number and Percentage Meeting Criteria with 95 ClO coflexreg Fusion Control
At Level(s) of Implant (per level)
95 CI 95 ClN Mean SD (LB US N Mean SD (LB UB
(LB UB) (LB UB)
Pre-Op 274 097 088 (086 107) 134 097 085 (083 112) Month 24 251 093 089 (082 104) 130 039 050 (030 048)
Above Level of Implant (per patient)
95 Cl 95 ClN Mean SD (LB US) N Mean SD
Pre-Op 202 087 074 (077 097) 96 077 076 (062 092) Month 24 184 089 082 (077 101) 95 108 094 (089 127)
Below Level of Implant (per patient) 95 Cl 95 ClN Mean SD (LB US N Mean SD 9LB UB
(LB UB) II(LB UB) Pre-Op 190 056 053 (048 063) 93 055 046 (045 064) Month 24 174 065 057 (056 073) 89 080 085 (062 098)
The 95 confidence interval is provided as a measure of the statistical precision of the estimated treatment group mean or percentage Non-overlapping confidence intervals imply statistically reliable device group differences
Table 30 and Table 31 reflect the radiographic Range of Motion and Translation analyses by the core radiographic laboratory and they demonstrate coflex preserves index and adjacent level motion compared to pedicle screw fusion
PMA P110008 FDA Summary of Safety and Effectiveness Data 36
3 Subgroup Analyses Preoperative characteristics were evaluated for potential association with overall success outcomes as demonstrated in Table 32
Table 32 Composite Clinical Success at 24 Month Follow-Up in coflex Clinical Trial by Pr operative Characteristics
Number and Percentage Achieving Month 24 CCS
coflex Fusion Control
Central stenosis (CS) alone CS + foraminal stenosis CS + subarticular stenosis CS+ftormaminal +subaricular
Levels Treated One Levels Treated Two
Males
Age 40 to 60 Age 60
Heightlt 67 inches Height= 67 inches
Weightlt 191 Weight= 191
BMI lt29 B~IVI-29
Prior Surgery No pror surgery
Smoker Non Smoker
Spondylolisthesis-Grade I None
Any severe complication No severe complication
N n N n 18 13 722 4 2 500 57 38 667 21 14 667 32 21 656 22 11 500 97 63 649 57 33 579
130 83 638 65 38 585 74 52 7036 39 22 5640
104 69 663 48 31 646 100ema06s66 60 56 29 518
90 54 600 39 22 564 114 81 711 65 38 585
90 61 678 57 29 509 114 74 649 47 31 660
109 75 688 61 34 557 95 60 632 43 26 605
95 62 653 42 22 524 109 73 670 62 38 613
202 134 663 102 58 569 2 1 500 2 2 100 0
22 13 591 14 6 429
182 122 670 90 54 600
94 59 628 48 30 625 110 76 691 56 30 536
70 33 471 46 19 41 3 134 102 761 58 41 707
There were 40 non-randomized roll-in patients enrolled in the coflexe
study consisting of first one or two patients treated at each site Of these
40 patients 6 patients were designated as protocol violators by the independent Clinical Events Committee Thirty-two (32 941) per protocol patients had Composite Clinical Success data at 24 Months The
per protocol roll-in patient cohort achieved a 563 Composite Clinical Success at Month 24
PMA P110008 FDA Summary of Safety and Effectiveness Data 37
XI PANEL MEETING RECOMMENDATION AND FDAS POST-PANEL ACTION
In accordance with the provisions of section 515(c)(2) of the act as amended by the Safe Medical Devices Act of 1990 this PMA was not referred to the Orthopaedic and Rehabilitation Devices Panel an FDA advisory committee for review and recommendation because the information in the PMA substantially duplicates information previously reviewed by this panel
XII CONCLUSIONS DRAWN FROM PRECLINICAL AND CLINICAL STUDIES
Safety Conclusions The adverse effects of the device are based on data collected in a clinical study conducted to support PMA approval as described above The coflex device was found to have a reasonable assurance of safety and to be at least as safe as the control treatment With the exception of wound complications the rate of coflexreg patients having at least one adverse event an event classified by the Clinical Events Committee (CEC) as a surgery-related adverse event a device-related adverse event or an event classified by the CEC as a severe or life threatening adverse event was comparable to the control group rate The rate of wound complications was numerically greater in the coflexreg group The rate of secondary surgery (revisions and reoperations) for coflexreg were higher than the control group at 24 months
The study noted the presence of additional spinous process fractures in a number of patients identified by the core laboratory and not by the investigator surgeons in both coflex and the fusion control groups These fractures were asymptomatic at 24 months and the evaluation of the CCS ODI and ZCQ endpoints for these patients did not demonstrate the clinical significance of these spinous process fractures at 24 months The long term significance of these fractures is unknown
In conclusion the clinical study data indicate that at 24 months post-operatively the coflex device has a reasonable assurance of safety and is at least as safe as the control with regard to adverse events It also demonstrates a numerically greater incidence of wound complications when compared to control and an incidence of spinous process fractures which are asymptomatic and of no clinical significance at 24 months but the long term effects are unknown
Effectiveness Conclusions In this study patients were enrolled treated and followed up through the 24 month postshyoperative visit 957 had data available for analysis at the completion of the study Statistical analysis demonstrated that the results from all sites were poolable to determine safety and effectiveness Analysis of patient demographic and baseline data showed the treatment groups to be comparable Mean surgery time was longer for the randomized control group than for the coflexreggroup by 552 minutes Blood loss was also greater for the control group by 2389 cc as was length of hospital stay by 129 days
PMA P1 10008 FDA Summary of Safety and Effectiveness Data 38
Overall success was defined in the study protocol as improvement of at least 15 points in the ODI at 24 months compared to baseline no reoperations revisions removals or supplemental fixation and no major device related complications including but not limited to permanent new or increasing sensory or motor deficit
The results of overall success indicate that the coflex device is statistically non-inferior to the control group at 24 months To assess the impact of patients with unknown outcomes at 24 months or other potential biases various sensitivity analyses were conducted At every assessment time period the percentage of coflex patients achieving composite success was greater than fusion with the largest differences occurring at week 6 and month 3 Sensitivity analyses show that the coflex devices non-inferiority to fusion is not sensitive to missing data In addition all components of overall success of the coflex group are comparable to or better than the control group At 24 months 858 of coflex patients compared with 767 of fusion patients experienced at least a 15 point reduction in ODI
Additional analysis requested by FDA was an analysis of all unresolved spinous process fractures being analyzed as study failures The study met its endpoint of non-inferiority with this additional analysis
The Zurich Claudication Questionnaire measures the pain and function associated with spinal stenosis and was the assessment tool for a secondary endpoint in the study The study demonstrated that protocol-defined symptom improvement and functional improvement was greater in patients that received coflex compared to fusion
The study data indicate that the coflexreg device is at least as effective as the control for individual success components and is statistically non-inferior to the control for the composite definition of overall success
Benefit-Risk Conclusions The coflexreg device met the primary clinical study endpoint for success The implant resulted in a similar percentage of complications compared to posterolateral fusion The coflexreg implantation procedure is a shorter operation with less blood loss The data and analysis provided in this PMA support a conclusion that the probable risks are outweighed by the probable benefits of the coflexreg device for patients with one or two level lumbar stenosis from L1-L5 with at least moderate impairment in function who experience relief in flexion from their symptoms of legbuttocksgroin pain with or without back pain and who have undergone at least 6 months of unsuccessful non-operative treatment
Overall Conclusions Among 204 coflexreg patients 135 (662) achieved Month 24 CCS while among 104 fusion patients 60 (577) achieved Month 24 CCS Statistical analysis demonstrated
PMA P110008 FDA Summary of Safety and Effectiveness Data 39
that coflex was non-inferior to fusion with a posterior probability of 0999 which is greater than the success criterion of 0975
The preclinical and clinical data in this application support the reasonable assurance of safety and effectiveness of the coflexreg device when used in accordance with the Indications for Use Based on the clinical study results it is reasonable to conclude that a significant portion of the indicated patient population will achieve clinically significant results The clinical benefits of the use of the coflexreg device in terms of functional improvement reduction in pain and maintenance or improvement in neurological status outweigh the risks associated with the device and surgical procedure through 2 years follow-up when used in the indicated population and in accordance with the directions for use In conclusion the coflexreg device represents a reasonable alternative to posterolateral fusion for the treatment of spinal stenosis
XIII CDRH DECISION
CDRH issued an approval order on October 17 2012 The final conditions of approval cited in the approval order are described below
In addition to the Annual Report requirements the sponsor must conduct two Post-Approval Studies to provide long-term device performance and to evaluate device performance under actual conditions of use
1 Extended Follow-up of Premarket Cohort The sponsor must perform a 5-year post-approval study (PAS) to evaluate the longer term safety and effectiveness of the coflexreg Interlaminar Technology as compared to posterolateral fusion by following all patients from the pivotal investigational device exemption (IDE) study with device survival to 24 months (191 coflex subjects and 104 fusion subjects) annually through 5 years At each annual (+4 month) visit the sponsor will collect the following data Oswestry Disability Index (ODI) leg (right left and max) and back pain Visual Analog Scale (VAS) Zurich Claudication Questionnaire (ZCQ) health status survey (SF-12) neurological status as determined by physical exam radiographic information and all adverse events regardless of cause Radiographic information collected will include range of motion on lateral standing flexionextension films (at implanted and adjacent level(s)) radiolucency device displacement or migration and radiographic observations such as spinous process fractures or heterotopic ossification Any coflexreg patients with radiographic observations of spinous process fracture will be examined via CT at 5 years
The primary objective of the study is to evaluate the overall success rate where an individual patient is considered a success if all the following criteria are met
Improvement of at least 15 points in the Oswestry Low Back Pain Disability Index (ODI) at 5 years compared to baseline
No reoperations revisions removals or supplemental fixation
PMA P110008 FDA Summary of Safety and Effectiveness Data 40
No major device-related complications including but not limited to permanent new or increasing sensory or motor deficit at 5 years and
No epidural steroid injections in the lumbar spine
Success rates between the randomized investigational and control groups will be compared and assessed for non-inferiority based on a ten percent non-inferiority margin for the overall success analysis at 5 years Several sensitivity analyses will also be done to better assess success rates FDA will expect at least 85 follow-up at the 5-year time point to provide sufficient data to evaluate safety and effectiveness
2 Real Conditions of Use The sponsor must perform a 5-year real conditions of use study of the coflexreg Interlaminar Technology to fully characterize safety and efficacy when the coflex device is used in the intended patient population under general conditions of use The sponsor will evaluate the safety and efficacy of the coflex device by comparing at 5 years decompression alone versus decompression with additional stabilization with the coflex Interlaminar Technology in 230 patients (115 each in the device and comparison group) at 5 study centers in Germany and 5 US centers (20-30 patients per site) Clinical visits will occur pre-operatively the day of surgery and 3 months 6 months 12 months 24 months 36 months 48 months and 60 months postoperatively At each visit the sponsor will collect the following data Oswestry Disability Index (ODI) leg (right left and max) and back pain Visual Analog Scale (VAS) Zurich Claudication Questionnaire (ZCQ) neurological status as determined by physical exam radiographic information and all adverse events regardless of cause Radiographic information collected will include range of motion on lateral standing flexionextension films (at implanted and adjacent level(s)) radiolucency device displacement or migration and radiographic observations such as spinous process fractures or heterotopic ossification All coflex patients at US sites will be examined with CT at 24 months Any coflex patients with any radiographic observations of spinous process fracture will be again be examined via CT at 5 years The sponsor will also assess improvement of walking distance on a treadmill after 24 and 60 months
The primary objective of the study is to assess the treatment group for superiority compared to the control group considering
Mean improvement of Oswestry Low Back Pain Disability Index (ODI) after 24 months and
Rates of reoperations revisions removals or supplemental fixation
Means and rates between the randomized investigational and control groups will be compared and assessed for superiority for the overall success analysis Patients with reoperations revisions removals and supplemental fixations will not be assessed for Oswestry Disability Index Several sensitivity analyses will also be done to assess impact on success rates FDA will expect at least 85 follow-up at the 5-year time point to provide sufficient data to evaluate safety and effectiveness
PMA P110008 FDA Summary of Safety and Effectiveness Data 41
Please be advised that the results from these studies should be included in the labeling as these data become available Any updated labeling must be submitted to FDA in the form of a PMA Supplement
The applicants manufacturing facilities were inspected and found to be in compliance with the device Quality System (QS) regulation (21 CFR 820)
XIV APPROVAL SPECIFICATIONS Directions for Use See device labeling
Hazards to Health from Use of the Device See Indications Contraindications Warnings Precautions and Adverse Events in the device labeling
Post-approval Requirements and Restrictions See approval order
PMA P110008 FDA Summary of Safety and Effectiveness Data 42
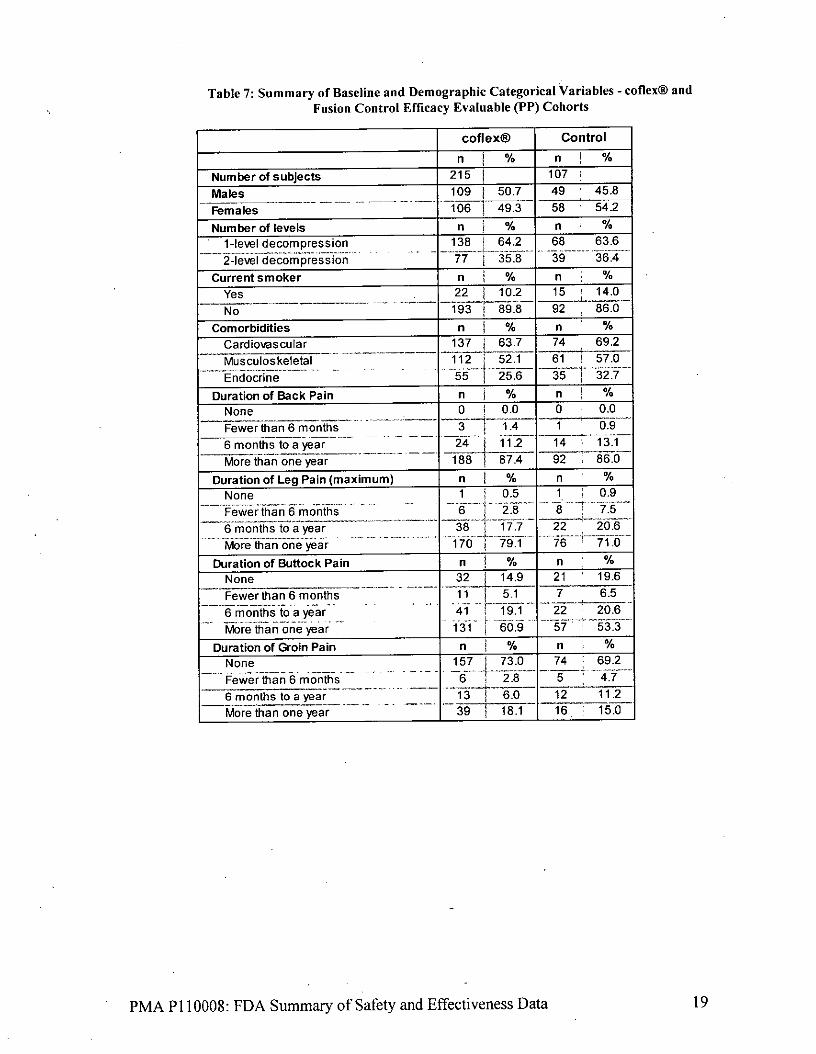
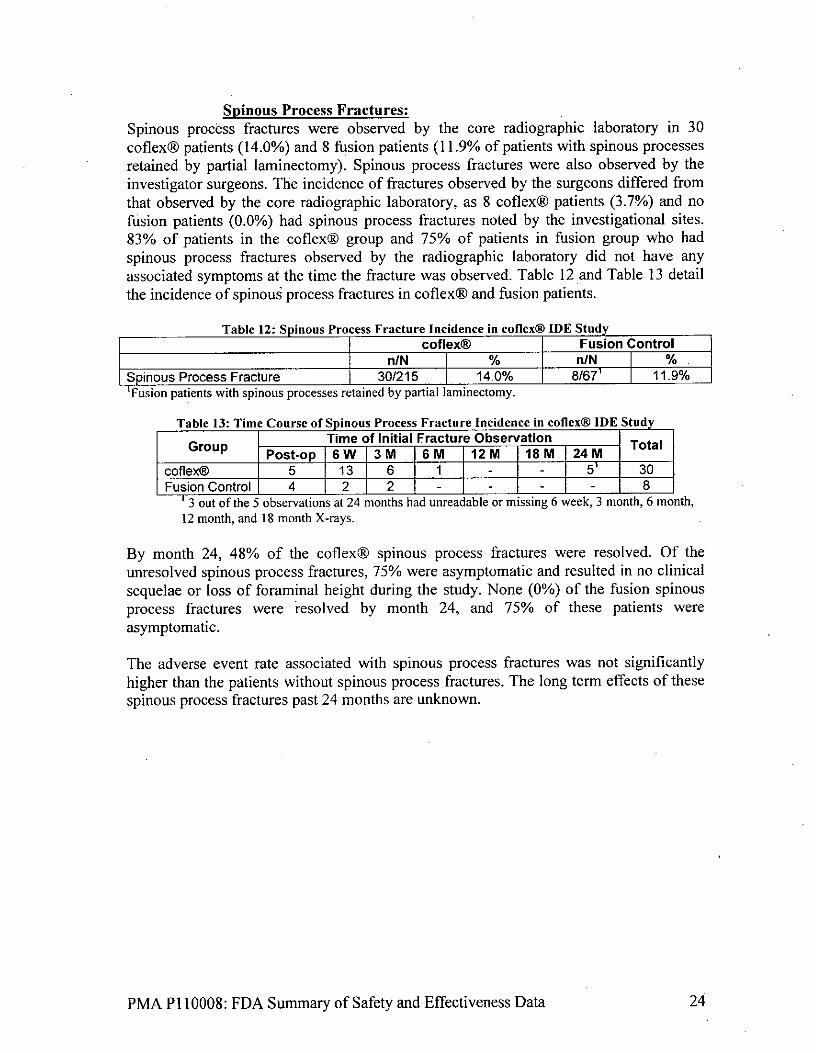