summary of the annual report 2015 - bankofgreece.gr 2016 summary of the annual report february 2016...
TRANSCRIPT

FEBRUARY 2016
SUMMARY OF THEANNUAL REPORT
2015
FE
BR
UA
RY
20
16
SU
MM
AR
Y O
F TH
E A
NN
UA
L R
EP
OR
T 2
015
BA
NK
OF
GR
EEC
E
EUR
OSY
STE
M


Presented to the General Meeting of Shareholders by Governor Yannis Stournaras
SUMMARY OF THEANNUAL REPORT
2015
FEBRUARY 2016

BANK OF GREECE
Address21, E. Venizelos AvenueGR-102 50 Athens
Websitehttp://www.bankofgreece.gr
Telephone+30 210 320.2393
Fax+30 210 323.3025
Printed in Athens, Greeceat the Bank of Greece Printing Works
ISSN 1105 - 0527

Summary ofthe Annual Report
2015 5
THE COMPLETION OF THE REVIEW ISESSENTIAL FOR AN EXIT FROM THE CRISIS
1 2016: A year of pragmatism andadjustment 7
2 2015 saw risks of default and exit fromthe euro area, averted in the end 7
3 The major challenge of 2015:Safeguarding financial stability 9
4 The international and Europeanenvironment 10
5 The single monetary policy 10
6 The financial system 11
7 The outlook for 2016 12
8 Preconditions for an exit from thecrisis and for sustainable growth 14
APPENDIX 19
ANNUAL ACCOUNTS OF THE BANKOF GREECE 39
C ON T ENT S

Summary ofthe Annual Report20156

1 2016: A YEAR OF PRAGMATISM ANDADJUSTMENT
According to Bank of Greece estimatesincluded in the present report, the conditionsshaping the path of the Greek economy in2016 appear to be more favourable than theydid a year ago. It is therefore reasonable toanticipate that the recession will bottom outand that the economy will see a slight recov-ery during the second half of this year, pro-vided that political stability is maintained anduncertainty, which hurts investor confidence,is eliminated.
This outlook is subject to strong uncertaintiesand high risks, associated both with interna-tional developments and with the pace at whichthe Greek economy will return to normalityand adjust to the new conditions.
Risks from the international environmentrelate to: the refugee crisis and the manner inwhich the European Union (EU) as a wholewill address it; the possibility of a British exitfrom the EU; the rise in terrorist attacks; aslowdown in global economic growth; and per-haps a new Asian crisis. These internationaldevelopments could reinforce centrifugaltrends in the EU and undermine Europeancohesion.
On the domestic front, the prospect of recov-ery hinges crucially upon a number of prereq-uisites, including reaching an agreement on thefirst review of the programme, credible com-mitment to implementing the programme, andaction to restore political and economic sta-bility and foster a return to normality. In orderto respond and adjust to the fast changingglobal environment, the Greek economy, inte-grated into a globalised economy and exposedas it is to international competition, must firstof all consolidate its position by effectivelyaddressing its own problems. Any country thatfails to keep up with European developmentsand lags behind is bound to be the one hard-est hit in the event that the global environmentshould take a turn for the worse.
2 2015 SAW RISKS OF DEFAULT AND EXIT FROMTHE EURO AREA, AVERTED IN THE END
Τhe conditions prevailing at the start of 2015augured poorly for economic developments.Economic uncertainty, already widespreadsince end-2014, increased further and peakedwith the proclamation of the referendum, thelaunching of the bank holiday and the imposi-tion of capital controls in late June. By thattime, the risk of a devastating downslide hadcome into view, confirming the repeated warn-ings from the Bank of Greece, internationalorganisations and the global community.
The worst was avoided with the agreementreached at the Euro Summit of 12 July 2015,with the Greek authorities committing to a setof measures as prior actions for negotiating anew programme with the European StabilityMechanism (ESM). The agreement confirmedthe country’s will to remain on its Europeanpath. At a political level, this will was expressedthrough two major developments. First, in sign-ing the agreement, the government signalledthat it was opting for a path of cooperation andmutual understanding over one of confronta-tion with our partners. Second, the agreementwas backed by the overwhelming majority ofthe opposition. This effective alignment on thecommon goal of keeping Greece in the euroarea and the EU is unprecedented in Greece’srecent political history, so often riven by acuteconfrontation and sharp division. If this broadalignment can be maintained despite thedifferences in approaches and views betweenthe political parties, it could guarantee thepolitical stability that Greece so drasticallyneeds in order to break free of the crisis, returnto normality and implement growth-conducivereforms.
Macroeconomic developments in 2015
Between 2008 and the end of 2013, the Greekeconomy lost a cumulative 26% of its GrossDomestic Product (GDP). After a short-livedrebound in 2014, it fell back into recession inthe third quarter of 2015 (-1.9%). The rate of
Summary ofthe Annual Report
2015 7
TH E COMPL E T I ON O F THE R EV I EW I SE S S EN T I A L FOR AN EX I T F ROM THE CR I S I S

change in GDP remained negative (-1.9%) inthe fourth quarter, coming to -0.7% for 2015as a whole. Underlying this new downturn werepolitical instability from the end of 2014onwards, the protracted negotiations with ourcreditors in the first half of 2015, the bank hol-iday and the imposition of capital controls, aswell as the new fiscal adjustment measuresunder the new Financial Assistance FacilityAgreement, considered necessary to achievethe revised fiscal targets. The strengths of theGreek economy and of the domestic bankingsystem were put to the test. However, the econ-omy showed remarkable resilience, with thenegative impact proving more moderate andshorter-lived than initially expected.
This resilience is associated with the imple-mentation of the adjustment programmes since2010, which ―in spite of several delays andmissteps― have succeeded in sharply reducingthe major macroeconomic and fiscal imbal-ances. More specifically, the high fiscal deficithas been reduced, covering three quarters ofthe adjustment path towards the ultimate fis-cal target (for a primary surplus of 3.5% ofGDP by 2018, compared with a primary deficitof 10.1% of GDP in 2009).
The current account deficit and the loss of com-petitiveness have been addressed, while labourmarket rigidities and constraints have beenreduced, leading to an increase in exports.There have also been signs of sectoral reallo-cation towards tradable goods and services and,more generally, towards the more productivebusinesses across all economic sectors.
As opposed to the substantial progress madein recent years with fiscal adjustment, therehave been delays with privatisations and theimplementation of growth-enhancing reformsin the area of public sector functioning and inthe products and services markets. As a result,the beneficial effects on growth and employ-ment were also slow in making themselves feltand only emerged in the course of 2014, withGDP growth returning to positive territory forthe year as a whole (+0.7%) and in the first
two quarters of 2015. The recovery would havegained traction and the overall outcome for2015 and 2016 would have undoubtedly beenpositive and stronger, in line with the projec-tions, if it had not been undercut by height-ened uncertainty from the last months of 2014until a new agreement was reached with ourpartners at the Euro Summit of 12 July 2015.
After a primary surplus of 1.2% of GDP in2013, well above the target for a balanced pri-mary budget, Greece’s fiscal position deterio-rated in 2014, on the back of political and eco-nomic uncertainty in the late part of the year,even though the primary balance remainedpositive, albeit small and falling considerablyshort of the targeted 1.5% of GDP. In thecourse of 2015, fiscal aggregates showed strongfluctuations, reflecting developments in taxrevenue, public investment expenditure andgovernment arrears. Following a downwardrevision of the primary balance target to adeficit of 0.25% of GDP (from an earlier tar-get for a 3.0% surplus) and the adoption ofadditional fiscal measures, the primary budgetin 2015 is expected to have been balanced orslightly in surplus.
Moderate GDP growth in the first half of 2015,back into recession in the second half
The performance of the Greek economy in thefirst half of last year was driven mainly by a risein private consumption and an improvement inthe external sector with an increase in goodsexports and tourism and a decline in imports.By contrast, investment demand dropped fur-ther amid a worsening economic and financialenvironment. Meanwhile, employment rosereflecting sustained positive growth in certainsectors of the economy and buoyant tourism.Other factors that supported job creation werethe restructuring of the labour markettowards more flexible forms of employmentand the maintenance of unit labour costs at lowlevels. As a result of the above, the unem-ployment rate fell to 24.6% in November 2015,still the highest in the EU.
Summary ofthe Annual Report20158

Inflation, at -1.1%, remained in negative ter-ritory for the third consecutive year, althoughthe general level of prices has been showingpositive changes since December 2015 for thefirst time in 33 months, mainly on account ofthe increase in VAT rates.
Positive growth in the first half of 2015 can beattributed to continued momentum from the2014 rebound. However, the adverse develop-ments that unfolded in the first half of the yearfuelled conditions of extreme economicuncertainty, putting Greece’s growth course onhold and sending the economy back into reces-sion from the third quarter onwards.
Nevertheless, the growth prospects for Greeceremain positive. Key macroeconomic indica-tors tracking the economy’s fundamentals sug-gest that the output losses, mainly arising fromthe negative impact of economic instabilityprevailing last year, may have been smallerthan initially expected.
3 THE MAJOR CHALLENGE OF 2015:SAFEGUARDING FINANCIAL STABILITY
Against the background of uncertainty thatprevailed in the first half of 2015, it becamecrucially important to safeguard financial sta-bility under threat from a pick-up in depositoutflows, a spike in non-performing loans(reversing the picture that had begun toemerge in the course of 2014), the non-eligi-bility of Greek securities as collateral inEurosystem monetary policy operations and,above all, the heated debate over a possibleGreek exit from the euro area.
At these most difficult of times, the Bank ofGreece fulfilled its primary duty arising fromits participation in the Eurosystem and from itsStatute, namely to safeguard monetary stabil-ity and support liquidity in the domestic bank-ing system. To this end, the Bank providedfunding to the banking system through theemergency liquidity assistance (ELA) mecha-nism. The bank holiday and the capital controls
succeeded in containing the deposit outflowsand the capital flight, but not without creatingnew problems. The ensuing distortions in thecapital market, as well as in the goods and serv-ices markets, have had indirect repercussionsthat cannot be gauged as yet. On a positivenote, however, the capital controls haveencouraged the use of electronic money. Thereis already strong evidence that the widespreaduse of e-money has supported private con-sumption and tax revenue, by reducing theinformal economy. Thus, one first policy impli-cation is that the use of e-money needs to bestrengthened further, through appropriateincentives, mainly tax-related.
Once the agreement was reached on 12 July,steps were taken to relax the capital controlsas soon as possible and decentralise decisions,in an aim to minimise the inevitable impacton the real economy. Meanwhile, the Bank ofGreece contributed decisively to the suc-cessful recapitalisation of banks, necessaryafter the new challenges posed by the massdeposit withdrawals and rising non-perform-ing loans.
In these dire circumstances, the Bank ofGreece took a number of additional actionsaimed foremost at safeguarding financial sta-bility. More specifically, the Bank (i) ensuredthe unobstructed and prompt supply of ban-knotes to the banking system in response to themarked increase in cash withdrawals in the firsthalf of 2015; (ii) has participated in and housedthe Committee for the Approval of BankTransactions, staffed mostly with Bank ofGreece personnel, and continues to workclosely with the European Central Bank andthe relevant ministries on the gradual lifting ofthe capital controls; (iii) conducted stress testson those banks that are outside the scopeof the Single Supervisory Mechanism (SSM);(iv) imposed stricter reporting requirementson banks with regard to non-performing loansand activated the Code of Conduct for themanagement of such loans; (v) remained asource of reliable information for internationalinvestors, thereby contributing to the success-
Summary ofthe Annual Report
2015 9

ful recapitalisation of banks. Furthermore, theBank of Greece assisted private insurancecompanies with preparations ahead of theentry into force of the Solvency II frameworkas from January 2016.
With regard to the formulation and imple-mentation of macroprudential policy, the Bankof Greece defined a policy strategy for theexercise of its macroprudential tasks. Theobjective of this strategy is to enable the timelyidentification of systemic risks and the use ofappropriate macroprudential instruments fortheir prevention and mitigation. In this con-text, the Bank of Greece developed a method-ology to define the capital buffer rate forGreece. This macroprudential instrumentneeds to be countercyclical, i.e. it should helpto smooth out the business cycle, so as to mit-igate the risks from excessive credit growth,typically observed during upturns, and encour-age lending during downturns.
4 THE INTERNATIONAL AND EUROPEANENVIRONMENT
Despite maintaining its growth momentum, theworld economy recorded a weaker perform-ance in 2015 relative to the previous year andto initial projections. This modest performancestemmed mainly from a slowdown in emergingmarket economies and notably China. Growthin the advanced economies as a whole pickedup, driven by higher real disposable income ofhouseholds and private consumption, as well asby lower unemployment. The continued down-ward trend in international oil prices also hada positive impact on world economic growth,by drastically containing energy costs. Inflationin the advanced economies declined signifi-cantly to nearly zero (0.3%). The existence ofa sizeable output gap at the global level and thedrop in oil prices were the main factors behindvery low inflation.
The economic recovery in the euro area pickedup pace in 2015. For the third consecutive year,GDP growth in the euro area was positive
(1.5%) and significantly higher than in 2014(0.9%). The recovery was supported by astrengthening in private consumption and anincrease, albeit small, in investment. Thesefavourable developments are attributable tocontinued monetary policy accommodationfrom the ECB and to the launch of a quanti-tative easing programme in March 2015,designed to steer inflation closer to 2% in themedium term and to boost economic growth inthe euro area, as well as to the ensuing weak-ening of the euro.
The outlook for 2016 is positive on the whole,although subject to significant risks. Economicactivity is expected to pick up slightly in boththe advanced and the emerging marketeconomies, while world trade is projected toincrease on the back of progress with furthertrade liberalisation. More optimistic are thegrowth forecasts for the US and euro areaeconomies. However, increasing incomeinequalities in advanced economies remain asource of concern.
On the other hand, considerable uncertaintiesarise from macroeconomic and financial inter-actions, the potential negative economic reper-cussions of the refugee-migrant flows toEurope, the possibility of a British exit fromthe EU, the risk of a greater slowdown of theChinese economy and an escalation of geopo-litical tensions among the Asian oil-producingcountries, a surge in global terrorist attacksand a gradual tightening of monetary policy inthe US, although the latest indications suggestthat this is likely to be pushed back.
5 THE SINGLE MONETARY POLICY
In 2015, the Eurosystem’s asset purchase pro-gramme was expanded to include bonds issuedby euro area central governments, agenciesand European institutions. Through this shiftto a more accommodative stance, the singlemonetary policy had a favourable impact onmonetary and credit dynamics, inflation expec-tations and inflation.
Summary ofthe Annual Report201510

During the first months of the programme’simplementation, the downward trend ofmedium to long-term inflation expectationswas halted, bank interest rates and theexchange rate of the euro fell, money andcredit growth strengthened further and infla-tion returned to positive territory.
More specifically, the implementation of theexpanded asset purchase programme as ofMarch 2015 served to contain the cost of bor-rowing from banks and relax the non-interestrate terms and conditions applicable to loans.Differences in bank financing costs across euroarea Member States narrowed, and the avail-ability of bank credit to businesses and house-holds increased.
Furthermore, the downward trend of inflationexpectations in the euro area was halted.Market-based measures of medium to long-term inflation expectations followed a slightlyupward path through almost all of 2015.
In December 2015, the Governing Council ofthe ECB, seeing that the return of inflation tolevels consistent with price stability in themedium term had slowed, decided to increasethe degree of monetary accommodation. Inthis context, the duration of the expanded assetpurchase programme (APP) was extendeduntil the end of March 2017 or beyond, in con-junction with the decision to reinvest the prin-cipal payments on the securities purchasedunder the APP, and the interest rate on thedeposit facility, already in negative territory,was further lowered.
6 THE FINANCIAL SYSTEM
Capital markets
During the first half of 2015, developments inGreek government bond yields reflected thedragging-on of the government’s negotiationswith our international creditors. The sur-rounding uncertainty drove Greek governmentbond yields sharply upward, especially in
shorter maturities, despite the favourableEuropean environment arising from the adop-tion by the Eurosystem of a quantitative eas-ing policy. With the agreement of 12 July 2015,uncertainty receded and the yields on Greekgovernment bonds gradually fell back to thelevels prevailing at end-2014.
Corporate bond yields also trended sharplyupwards in the first half of the year, more areflection of the climate of uncertainty than ofa worsening of issuers’ fundamentals. Once theagreement was reached, corporate bond yieldsdeclined in the second half of 2015, but stillremain high. Stock valuations were particularlyvolatile, especially in the banking sector whilethe stocks of manufacturing firms showedresilience.
However, the situation started to deteriorateat the beginning of the current year. The delaysin reaching a completion of the first review ofthe stabilisation programme triggered a newbout of investor uncertainty, as reflected insharp drops in valuations both for shares, espe-cially those of banks, and government bonds,whose yield spread once again widened to over1,000 basis points.
A stronger banking system in the wake of recapi-talisation
The main developments in the banking systemin 2015 were the strengthening of banks’ cap-ital base through capital increases with a strongprivate investor uptake, the bank holiday andthe imposition of restrictions on cash with-drawals, cross-border payments and capitalmovements and other bank transactions, andthe smaller-than-anticipated impact of theserestrictions on bank aggregates.
The recapitalisation of Greek banks was suc-cessfully completed in December 2015, with asubstantial participation of private investors.Greece's four significant banks managed tocover the capital needs identified by the ECB’sstress tests. The necessary funds came from: (a)foreign investors, who placed around €5.3 bil-
Summary ofthe Annual Report
2015 11

lion; (b) capital mitigating actions amounting to€0.6 billion; and (c) liability management exer-cises (voluntary bond swap offers to bank bond-holders) that yielded about €2.7 billion.
For the two banks that did not fully cover theircapital needs, based on the adverse scenario,from private sources (totalling about €5.4 bil-lion), the necessary additional funds weredrawn from the HFSF. Thus, the publicresources used proved to be far less than theamount of €25 billion foreseen by theEurogroup in August 2015.
Moreover, banks’ reliance on ELA hasdecreased, and the ceiling has been reduced byabout €18.5 billion since end-August. Thelower ceiling reflects the improved liquidity sit-uation of Greek banks amid easing uncertaintyand a stabilisation of private sector depositflows, as well as, to a large extent, progress withthe recapitalisation of Greek banks.
The gradual restoration of confidence resultedin an, albeit small, return of deposits. Morethan €2.5 billion returned to the banking sys-tem from 20 July 2015 onward, date on whichbanks reopened, with the restrictions on thebanking system and on capital movementsremaining in force to this day.
An effective management of non-performing loansis urgently needed
2015 saw a halt in the decline of new NPL for-mation. Non-performing exposures as a per-centage of total exposures (NPE ratio) rose to43.6% by end-September 2015 (December2014: 39.9%). This deterioration was visibleand similar in size (roughly 4 percentagepoints) across all loan categories. In particular,the NPE ratio reached 55.4% for consumerexposures, 43.3% for business exposures and39.8% for housing exposures. This can in partbe attributed to the postponement of theimplementation of the Code of Conduct on themanagement of NPLs and to the less activeloan portfolio management on the part ofbanks, which seemed to focus mostly on short-
term solutions. However, from the third quar-ter onwards, especially after recapitalisation,banks appeared to step up their efforts towardsmore active NPL management. The efforttowards long-term solutions to this major prob-lem, tailored to the profile of borrowers,should benefit from the high-level operationaltargets for NPL resolution to be set by theBank of Greece, in consultation with banks,applicable as from June 2016 and subject tomonitoring on a quarterly basis. The require-ment on banks to achieve these targets, cou-pled with the newly enacted legal and institu-tional framework, concerning, among otherthings, the establishment of a secondary mar-ket for NPLs, the speeding-up of judicial pro-ceedings and the streamlining of the real estatecollateral liquidation process, is expected tocontribute to a gradual decline in the NPLratio. In any event, the banks need to continueto pursue prudent provisioning policies andmaintain capital adequacy ratios safely abovethe regulatory minimums.
Turning to the private insurance market, 2015was marked by efforts from companies toadjust their governance systems and infra-structures to the requirements of the opera-tional and supervisory framework for insuranceand reinsurance undertakings, known as Sol-vency II, applicable as from 1 January 2016.
7 THE OUTLOOK FOR 2016
The completion of the first review will enhance theprospect of recovery
Contrary to 2015, 2016 could mark the begin-ning of a way out of the crisis and onto a pathof sustainable growth. As mentioned previ-ously, however, there are a number of majorchallenges, arising not only from unpredictabledevelopments in the international environmentbut also, more importantly, from potential risksto the domestic macroeconomy, such as delaysin the completion of the first review of the newstabilisation programme or failure to imple-ment the programme’s actions.
Summary ofthe Annual Report201512

Real GDP growth is expected to be negative,at least during the first half of 2016, largelyreflecting a carry-over effect from 2015. How-ever, as already mentioned, the objective con-ditions are in place for Greece to exit recessionand come closer to positive growth from thesecond half of the year. This is also conditionalon a number of steps that will help to avertrisks and strengthen the prospect of recovery.
The first step, and the one with the most cru-cial bearing on future developments, is the suc-cessful completion of the first review of theprogramme, currently in progress. This, in aninitial phase, will require the completion of thesocial security reform and the alignment offarmer income taxation. These are not justprior actions for the review of the programme.They are necessary to ensure the sustainabil-ity of the social security system and of publicdebt and to restore social and tax equity bothacross generations and across taxpayer groups.
A positive review would boost the real economy andopen the way for discussions on debt relief
A positive completion of the review would ben-efit the real economy in a number of ways:
− by bringing about a major improvement inconfidence, thereby contributing to a fasterreturn of deposits to the Greek banking sys-tem;
− by enabling a decision to reinstate Greeksecurities as eligible collateral in Eurosystemmonetary policy operations, providing Greekbanks with access to lower-cost funding fromthe ECB;
− by allowing Greek government bonds to beincluded in the ECB’s quantitative easing pro-gramme;
− by bringing forward the further relaxationand ultimate lifting of capital controls.
All of the above, coupled with the successfulrecapitalisation of banks and the more efficient
management of non-performing loans, willrestore normality to the banking system. Thebanks’ higher funding capacity will in turnboost their capacity to lend to the real econ-omy, translating into lower borrowing costs forbusinesses and households. These morefavourable financing conditions will bolstergrowth.
Over the medium term, the successful com-pletion of the first review will prove to be deci-sive, in that it will open the way for discussionswith our partners on further debt relief meas-ures. Such measures would ensure the sus-tainability of public debt in a manner that con-tains the government’s annual financing needsat manageable levels. Among other beneficialeffects, this would directly ensue in a relaxationof the ultimate fiscal target and free up fundsfor channelling into investment, thereby sup-porting output and employment.
For the first time in 33 months, the change inthe general level of prices turned positive(0.4%) in December 2015, mainly on accountof increases in indirect taxes, in particular VATrates. These recent increases are expected tocause prices to rise in 2016 as well, owingmainly to a carry-over effect from 2015. On theother hand, the anticipated downturn in thefirst half of this year and, more importantly,the continuous drop in international oil pricesshould largely offset these increases. For 2016as a whole, inflation is projected to turn out atpositive levels, assuming that international oilprices partially recover.
Risks and uncertainties
The forecast of a recovery in the secondhalf of this year is, at present, clouded by con-siderable uncertainty, which on the domesticfront relates to the outcome of the long-pending first review. Any setback or extensivefurther delay in this area would weaken and,in a worst case scenario, even ruin theprospects outlined above. This would triggera new cycle of economic destabilisation,financing constraints, even deeper recession
Summary ofthe Annual Report
2015 13

and serious impasses, similar to the ones expe-rienced in the summer of 2015.
A second set of uncertainties and risks relatesto the refugee-migrant inflows and the mannerin which this serious problem will beaddressed not only by Greece, but more impor-tantly by the EU as whole. Should we, as anation, fail to stay in sync with European pol-icy choices and to promptly deliver on our com-mitments, there is no telling what the Euro-pean reaction might be. Nor, for that matter,can we forecast what the stance of the EUMember States will be, even if Greece fullydelivers on its commitments. In any event, thepossibility of restrictions being imposed on thefree movement of persons and goods cannot beruled out, with the following serious implica-tions for the Greek economy:
− For one, Greek tourism would be the firstsector to suffer from a delay or, worse yet, fail-ure to effectively manage the refugee crisis,with the refugee flows expected to continueand even intensify in the months ahead.
− Second, the possibility that large numbers ofrefugees could end up stranded on Greek soilcalls for timely planning and preparations, inorder to among other things address any socialcohesion concerns. Furthermore, publicexpenditure would need to be increased tocover the costs of healthcare and provisional ormore permanent housing for an increasingnumber of refugees and migrants.
− Third, moving goods from Greece wouldbecome much more costly, thereby hurting thecountry’s international competitiveness.
− Fourth, foreign investors could be deterredfrom choosing Greece as a gateway for theirgoods into Europe.
The presence of these risks is all the more rea-son for the first review to be rapidly completedand for implementation of the programme tocontinue unobstructed.
8 PRECONDITIONS FOR AN EXIT FROM THECRISIS AND FOR SUSTAINABLE GROWTH
An end to the recession and recovery from thesecond half of 2016 are within reach, providedthat the problems and risks outlined above areeffectively addressed. However, moving furtheralong from recovery to sustainable growth willrequire long-term policies and strong commit-ment to implementing the new financial assis-tance agreement. The factors that will ulti-mately determine success are: acceptance andownership of the programme; perseverance andconsistency in implementing the necessaryactions; open dialogue; and political and socialconsensus.
Over the past years, the Greek economy hasbeen following an arduous road of adjustment,at great social cost, but also with tangibleresults. Little remains to be done, compared tothe bulk of the effort already made. In orderto cover the remaining ground, the followingsteps need to be taken:
• Acceleration of reforms
The programmes implemented over the pastyears were focused on fiscal adjustment andsucceeded in sharply reducing the twin deficits.However, there were delays in the implemen-tation of reforms, which, if made outright,would have reduced the extent and severity ofthe recession. This is the area on which we nowneed to focus. Specifically, the reforms neededin the services sector (transport, energy,telecommunications, trade) involve liftingrestrictive regulations that stifle competition.In the labour market, as envisaged in theagreement, the reforms involve bringing thecollective dismissal and industrial actionframeworks and collective bargaining into linewith best practices internationally and in theEU. They also involve legislating a modernquality framework for vocational educationand training (VET)/Apprenticeships, tacklingundeclared work and streamlining existinglabour laws and consolidating them into aLabour Law Code. Finally, in the field of
Summary ofthe Annual Report201514

public administration, a reform programmeneeds to be implemented, geared towardscapacity-building and de-politicisation. Con-crete steps need to be taken towards simplify-ing administrative processes, overhaulingstructures, expanding modern technologyusage, optimising human resources, andstrengthening transparency and accountability.
• Further strengthening of the banking system
The completion of the recapitalisation ofGreek banks with a strong participation of pri-vate investors was successful. As mentionedpreviously, the banks only used €5.4 billion ofpublic funds, compared with an initially esti-mated €25 billion. Meanwhile, banks’ relianceon Emergency Liquidity Assistance (ELA)decreased in the second half of 2015. Lookingforward, a return to financial normality wouldhelp restore public confidence in the domesticbanking system, thereby leading to a gradualreturn of deposits. Moreover, the new institu-tional framework for the management of non-performing loans (NPLs) will help banks toconsolidate their assets, thereby enabling themto finance the real economy and contribute toa shift to a growth model that favours com-petitive and outward-oriented businesses. Fur-thermore, steps have been taken to clearlydefine the terms and conditions for the pro-tection of primary residence, to streamlinebankruptcy and insolvency procedures and torestore honest relations between creditors anddebtors. All of the above have already beenenacted, but need to be implemented withoutany faltering, wavering or parallel decisionsthat would undermine their effectiveness.
• Privatisations and utilisation of public real estate
The scaling-up and successful implementationof the privatisations and public real estate util-isation programme will have a multiplier effect,with long-lasting gains for the domestic econ-omy. First, privatisation proceeds can be usedto gradually pay off public debt, supporting fis-cal adjustment. Furthermore, when accompa-nied by a strong commitment to future invest-
ment, privatisations enhance the inflow offunds for productive investments that stimulateemployment and aggregate active demand.
In the field of privatisations, some progress hasbeen made, but a number of decisions, stillpending, need to be made without further delay.As estimated by the Bank of Greece, privatisa-tions hold a huge potential, which, if properlyexploited, could yield far more revenue than thequantitative targets. This points to the need fora strategic plan that will map out the targets,uses and forms of the desired investments andprovide a stable and comprehensible frameworkfor prospective investors. The development ofthis plan will be assigned to the Hellenic Repub-lic Assets Development Fund, which accordingto the agreement must have been established bymid-2016. This is a commitment that must beadhered to, and, in this context, the objectivesof this fund, which will be reorganising the pri-vatisations and public real estate utilisation pro-gramme, need to be clearly outlined.
• Continued fiscal consolidation through aredefined fiscal policy mix
The revision of the primary surplus targetsfrees up resources for channelling into the realeconomy. However, the current policy mixremains a serious drag on growth. Withoutrelaxing the efforts towards budgetary disci-pline, the focus of fiscal policy needs to begrowth-friendly, i.e. cut taxes, reduce the con-sumption expenditure of the public sector andincrease public investment expenditure. Thelopsided focus, so far, on increasing labour andbusiness income tax rates, as well as socialsecurity contributions, provides incentives fortax and contribution evasion and encouragesundeclared work, erodes the competitiveadvantages of Greek firms and discourages jobcreation. As a result, any improvement in thefiscal balance is only temporary and self-reversing, preventing a lasting reduction of thedebt-to-GDP ratio. Instead, rationalisingpublic administration and cutting non-pro-ductive operating costs would prove to be moreeffective fiscal consolidation tools.
Summary ofthe Annual Report
2015 15

• Encouraging business investment and protectingprivate investors
Greece has been plagued by serious investmentinertia. Between 2007 and 2014, total invest-ment expenditure as a percentage of GDP fellby half. Underlying this disinvestment areanaemic demand, political and economicuncertainty, as well as financing constraints.The prompt rebound of business investmentexpenditure is key to sustainable growth. Therestoration of economic and political stabilitythat would strengthen investor confidence andencourage aggressive business investmentplans, a rapid shift of the domestic productionmodel from non-tradable to tradable goodsand services and an easing of financing con-straints would be instrumental in stimulatingbusiness investment expenditure. Actions suchas the enactment of a new development lawwith clear growth incentives, and initiativesfrom the financial system to ease financingconstraints are deemed necessary. Further-more, the Greek State must help restoreinvestor confidence and protect privateinvestors by ensuring a stable, business-friendlyeconomic environment. This can be achievedthrough the establishment of a simple, clear-cut and stable tax and legal regime fosteringhealthy entrepreneurship.
• Improving competitiveness – increasing exports
The competitiveness gains achieved by theGreek economy at considerable social cost donot seem to have been fully exploited. Thesegains, together with improved labour marketflexibility, are strong incentives for investmentinitiatives. Despite the recouping of losses ininternational competitiveness, mainly in unitlabour cost terms, exports have yet to recordthe anticipated upward dynamics. This can inpart be explained by the lack of financing,comparatively higher long-term borrowingcosts, as well as the higher tax burden, whichslows or even halts progress towards recover-ing overall competitiveness. However, it isalso due in part to a number of inherent struc-tural weaknesses that hamper the interna-
tional market penetration of Greek productsand involve non-cost aspects such as productquality, protected designation of origin andbranding, red tape, etc.
• Combatting high unemployment
The gradual decline observed in unemploy-ment and the continued recovery of theemployment rate have been supported by theactive employment policies implementedthrough programmes and actions usingresources from the National Strategic Refer-ence Framework (2014-2020).
In order to fight high unemployment, in par-ticular long-term and youth unemployment, theactive employment policies and the vocationaltraining programmes in place need to be con-stantly improved and expanded; their effec-tiveness also needs to be increased, with results-based review procedures and monitoring.Moreover, the enhancement of employmentsupport schemes should go hand in hand withaction against undeclared and uninsured work.
• Education reform
The road to growth entails knowledge,research, innovation and lifelong learning. Theexit of Greek society from the crisis can onlybe achieved through its transformation into asociety of creative citizens, capable of pre-serving and expanding its human capital stock.In this context, the education reform currentlybeing debated, which forms an integral part ofthe national growth strategy, must be based onfive pillars: (a) evaluation of the Greek edu-cation system at all levels with a view toenhancing innovation and entrepreneurship;(b) rationalisation of curricula across all edu-cational levels, as well as of the functioning andgovernance of higher education institutions,while enhancing the efficiency and autonomyof public educational units; (c) breaking thehold of corporatist interests on the educationsystem; (d) increasing funding, which stillremains low; and (e) transparency at all levels.
Summary ofthe Annual Report201516

• Halting the brain and human resource drain
Soaring unemployment and the deep economicrecession have caused part of Greece’s humanresources to migrate abroad, with alarmingimplications for the country’s demographics,public finances, pension system and, to theextent that those who leave are highly-skilled,the quality of the remaining labour force. Inorder to reverse this brain drain, the GreekState must take measures to: (a) redefine thetypes and forms of academic and vocationalspecialisation needed to improve skill match-ing for the young generations; (b) support busi-ness start-ups; (c) combat mediocracy, the lackof transparency and nepotism; (d) promoteexcellence; (e) expand apprenticeship andinternship schemes; and (f) foster a business-friendly environment.
• Supporting social cohesion and tackling poverty
Sustainable growth hinges upon social cohe-sion, under threat at present from risingpoverty, income inequality and social exclu-sion. Although based on the results of thelatest EU-SILC survey (2014), both indices,namely the poverty gap and the relative risk ofpoverty in Greece, decreased somewhat, therelative risk of poverty is still the third highestin the EU-28. Moreover, the number of house-holds living below the poverty line hasincreased. Public debate should thereforefocus on the need to redesign both the policyof social transfers, in order to increase theireffectiveness in tackling poverty, and the edu-cation system, to ensure that it provides equallearning opportunities at all levels of educationto those facing social exclusion. Under theagreement with our partners, Greece has com-
mitted to improving the planning of its socialwelfare system, to launching a complete revi-sion of the existing system with support fromthe World Bank, in order to set up a genuinesocial safety net. This will include the gradualnational roll-out of a Guaranteed MinimumIncome (GMI) as of 1 April 2016.
* * *
The Greek economy has already come a longway, and there is only a short distance fromhere to an exit from the crisis. In order to avertany setbacks and obstacles on the path towardsgrowth, all existing potential must be fullyexploited, avoiding past mistakes that only ledto vicious circles and impasses.
Today, the exit from the crisis is within sight,but remains subject to prerequisites. In orderto get there, we must remain committed to hon-ouring the terms of the agreement, which mustnot be seen as imposed on us by our creditors,but as fundamental and necessary reforms thatshould have been implemented years ago. TheGreek side must take ownership of the pro-gramme as a necessary means towards adjust-ment and reform. In addition, however, thechanges which must be incorporated into anational growth plan, are geared towards sup-porting (a) output; (b) investment; (c) the“knowledge triangle” (education, research,innovation); and (d) the new generation. Thisnational plan must be both a new growth anda social pact for the creation and mobilisationof resources to support productivity, new busi-nesses and jobs. These are the orientationsthat will enable the Greek economy to exit thecrisis once and for all and return to a virtuouscircle of growth and employment.
Summary ofthe Annual Report
2015 17

Summary ofthe Annual Report201518

APPEND IX
TABLES AND CHARTS
TABLES1 Demand and GDP 212 Indicators of consumer demand 223 Indicators of investment demand 234 Gross value added at basic prices 245 Industrial production 256 Activity indicators in the services
sector 267 Price developments in Greece
and the euro area 278 Price indices 289 Compensation of employees and
labour cost 2910 Balance of payments 3011 General government and state
budget balances 3112 Decomposition of changes in the
general government debt-to-GDPratio 32
CHARTS1 GDP (2008-2015) and the Economic
Sentiment Indicator 332 Employment 333 Unemployment rates 334 Harmonised index of consumer
prices (HICP) and core inflationin Greece and the euro area 34
5 Evolution of CPI/PPI fuel pricesand of Brent crude oil prices in euro 34
6 Sectoral breakdown of Greekexports of goods 35
7 Greek exports of goods,by destination 35
8 Structural primary balanceof general government 36
9 Sectoral breakdown of depositswith domestic credit institutions 36
10 Bank credit to the private sectorand general government 37
11 Yields on 10-year Greek andGerman government bonds 37
12 General government arrears tosuppliers 38
Summary ofthe Annual Report
2015 19

Summary ofthe Annual Report201520
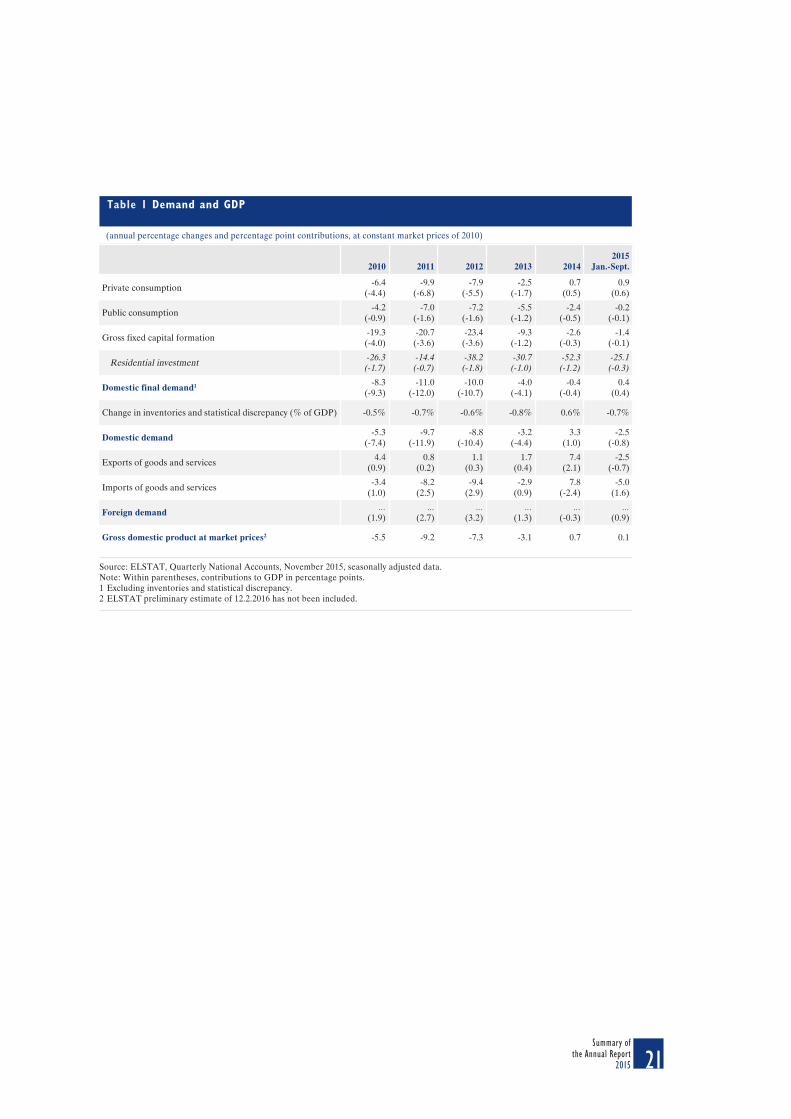
Table 1 Demand and GDP
(annual percentage changes and percentage point contributions, at constant market prices of 2010)
Source: ELSTAT, Quarterly National Accounts, November 2015, seasonally adjusted data.Note: Within parentheses, contributions to GDP in percentage points.1 Excluding inventories and statistical discrepancy.2 ELSTAT preliminary estimate of 12.2.2016 has not been included.
2010 2011 2012 2013 20142015
Jan.-Sept.
Private consumption-6.4
(-4.4)-9.9
(-6.8)-7.9
(-5.5)-2.5
(-1.7)0.7
(0.5)0.9
(0.6)
Public consumption-4.2
(-0.9)-7.0
(-1.6)-7.2
(-1.6)-5.5
(-1.2)-2.4
(-0.5)-0.2
(-0.1)
Gross fixed capital formation-19.3(-4.0)
-20.7(-3.6)
-23.4(-3.6)
-9.3(-1.2)
-2.6(-0.3)
-1.4(-0.1)
Residential investment -26.3(-1.7)
-14.4(-0.7)
-38.2(-1.8)
-30.7(-1.0)
-52.3(-1.2)
-25.1(-0.3)
Domestic final demand1 -8.3(-9.3)
-11.0(-12.0)
-10.0(-10.7)
-4.0(-4.1)
-0.4(-0.4)
0.4(0.4)
Change in inventories and statistical discrepancy (% of GDP) -0.5% -0.7% -0.6% -0.8% 0.6% -0.7%
Domestic demand-5.3
(-7.4)-9.7
(-11.9)-8.8
(-10.4)-3.2
(-4.4)3.3
(1.0)-2.5
(-0.8)
Exports of goods and services4.4
(0.9)0.8
(0.2)1.1
(0.3)1.7
(0.4)7.4
(2.1)-2.5
(-0.7)
Imports of goods and services-3.4
(1.0)-8.2
(2.5)-9.4
(2.9)-2.9
(0.9)7.8
(-2.4)-5.0
(1.6)
Foreign demand…
(1.9)…
(2.7)…
(3.2)…
(1.3)…
(-0.3)…
(0.9)
Gross domestic product at market prices2 -5.5 -9.2 -7.3 -3.1 0.7 0.1
Summary ofthe Annual Report
2015 21

Table 2 Indicators of consumer demand (2010-2016)
(annual percentage changes)1
2010 2011 2012 2013 20142015-2016
(available period)
Volume of retail trade (overall index) -6.2 -10.2 -12.2 -8.1 -0.4 -1.7 (Jan.-Nov.)
Volume of retail trade(excluding fuel and lubricants)
-6.9 -8.7 -11.8 -8.4 -0.7 -0.6 (Jan.-Nov.)
Food-beverages-tobacco2 -5.5 -6.0 -9.0 -9.1 0.5 -1.9 (Jan.-Nov.)
Clothing-footwear -11.4 -18.8 -20.6 -2.2 5.4 7.2 (Jan.-Nov.)
Furniture-electrical appliances-householdequipment
-12.7 -15.7 -16.3 -6.2 -1.4 -4.0 (Jan.-Nov.)
Books-stationery-other -4.3 -5.2 -12.1 -0.1 7.0 6.2 (Jan.-Nov.)
Revenue from VAT (at constant prices) 0.1 -5.9 -12.8 -6.5 -0.4 0.8 (Jan.-Nov.)
Retail trade confidence indicator -26.4 -0.5 -3.1 22.9 27.1 2.8 (Jan. 2016)
Consumer confidence index -63.4 -74.1 -74.8 -69.4 -54.0 -64 (Jan. 2016)
New private passenger car registrations -37.2 -29.8 -41.7 3.1 30.1 4.9 (Jan. 2016)
Tax revenue from mobile telephony3 37.1 -16.8 -7.9 -12.8 -10.4 -6.4 (Jan.-Dec.)
Credit for consumption4 -4.2 (Dec.) -6.4 (Dec.) -5.1 (Dec.) -3.9 (Dec.) -2.8 (Dec.) -2.3 (Dec.)
Sources: ELSTAT (retail trade, cars), Ministry of Finance (VAT revenue, tax revenue from mobile telephony), IOBE (retail confidence), IOBEand European Commission (consumer confidence), Bank of Greece (consumer credit).1 Excluding the consumer confidence indicator (weighted percentage balances of positive and negative answers).2 Comprising big food stores and specialised food-beverage-tobacco stores.3 Until July 2009, fixed monthly levy per subscription. Since August 2009, new scaled levy on mobile telephony subscriptions and a levy on pre-paid mobile telephony.4 Comprising bank loans and securitised loans. The rates of change are adjusted for loan reclassifications, loan write-offs/write-downs, foreignexchange valuation differences and, in 2009, the transfer of loans by one credit institution to a domestic subsidiary.
Summary ofthe Annual Report201522

Table 3 Indicators of investment demand (2010-2015)
(annual percentage changes)1
2010 2011 2012 2013 2014
2015(available
period)
Capital goods output -22.1 -13.5 -19.2 -0.5 -2.2 -6.6 (Jan.-Nov.)
Capacity utilisation in the capital goodsindustry
66.1 62.7 58.2 61.4 64.7 62.1
Credit to corporations2 1.1 (Dec.) -2.0 (Dec.) -4.4 (Dec.) -4.9 (Dec.) -3.7 (Dec.) -0.9 (Dec.)
Disbursements under the Public InvestmentProgramme3 -11.3 … -10.5 14.5 -0.9 -2.8
Production index in construction(at constant prices)
-29.2 -41.3 -33.4 -8.2 15.5 1.1 (Jan.-Sept.)
Volume of private construction activity(on the basis of permits issued)
-23.3 -37.7 -30.6 -25.6 -5.8 -6.3 (Jan.-Nov.)
Cement production -14.3 -37.8 -12.8 3.4 -3.4 3.6
Construction confidence indicator -27.4 -27.8 26.1 50.6 23.7 -29.9
Lending for house purchase4 -0.3 (Dec.) -2.9 (Dec.) -3.4 (Dec.) -3.3 (Dec.) -3.0 (Dec.) -3.5 (Dec.)
Sources: ELSTAT (capital goods output, volume of private construction activity, cement production, production in construction), IOBE (capac-ity utilisation, construction confidence), Bank of Greece (bank credit to domestic enterprises and housing, disbursements under the Public Invest-ment Programme).1 Except for capacity utilisation in the capital goods industry, which is measured in percentages.2 Comprising loans and corporate bonds, securitised loans and securitised corporate bonds but excluding (as of June 2010) loans to sole pro-prietors. The rates of change are adjusted for loan reclassifications, loan write-offs/write-downs, foreign exchange valuation differences, as wellas corporate bonds and loans transferred by credit institutions to foreign subsidiaries and, in 2009 the transfer of loans by one credit institu-tion to a domestic subsidiary.3 As of January 2012 actual cash payments and not appropriations under the public investment budget.4 Comprising loans and securitised loans. The rates of change are adjusted for loan reclassifications, loan write-offs/write-downs, foreignexchange valuation differences and, in 2009, the transfer of loans by one credit institution to a domestic subsidiary.
Summary ofthe Annual Report
2015 23

Annual percentage changes
2010 2011 2012 2013 20142015
Jan.-Sept.
Table 4 Gross value added at basic prices(2010-2015)
Source: ELSTAT, Quarterly National Accounts, November 2015, seasonally adjusted data.Note: Within parentheses, contributions in percentage points.
(annual percentage changes and sectoral contributions to gross value added; at constant prices of 2010)
1. Agriculture, forestry and fishing 5.1(0.1)
-1.5(-0.1)
9.1(0.3)
-2.3(-0.1)
10.2(0.4)
-1.0(0.0)
2. Secondary sector -13.3(-2.3)
-10.8(-1.7)
-6.8(-1.0)
-7.4(-1.1)
-8.9(-1.3)
-4.0(-0.5)
2.1 Industry including energy -14.9(-1.9)
-4.7(-0.5)
-6.3(-0.7)
-2.8(-0.3)
-10.0(-1.2)
-0.2(0.0)
2.2 Construction -8.9(-0.4)
-26.1(-1.2)
-8.3(-0.3)
-22.9(-0.8)
-4.3(-0.1)
-18.6(-0.5)
3. Tertiary sector -4.2(-3.4)
-9.3(-7.5)
-7.2(-5.8)
-1.9(-1.5)
1.9(1.5)
1.5(1.2)
3.1 Trade, hotels and restaurants, transport andcommunication
-4.2(-1.0)
-12.2(-3.0)
-15.6(-3.7)
-0.9(-0.2)
7.4(1.6)
2.6(0.6)
3.2 Information and communication -12.8(-0.5)
-18.8(-0.7)
-11.9(-0.4)
-5.4(-0.2)
-4.1(-0.1)
-4.0(-0.1)
3.3 Financial and insurance activities -7.8(-0.4)
-14.1(-0.7)
-5.1(-0.2)
-6.1(-0.3)
-4.3(-0.2)
-1.6(-0.1)
3.4 Real estate activities 10.8(1.5)
-7.1(-1.2)
5.4(0.9)
-0.5(-0.1)
1.6(0.3)
0.2(0.0)
3.5 Professional, scientific and technical activities -21.7(-1.4)
-10.8(-0.6)
-8.3(-0.4)
-7.6(-0.4)
-1.7(-0.1)
7.5(0.4)
3.6 Public administration and defence -2.3(-0.5)
-3.5(-0.8)
-9.1(-2.1)
-2.1(-0.5)
-0.4(-0.1)
2.2(0.5)
3.7 Arts, entertainment and recreation -23.2(-1.1)
-14.1(-0.5)
3.4(0.1)
1.3(0.1)
1.1(0.0)
-1.8(-0.1)
4. Gross value added at basic prices -5.6 -9.1 -6.5 -2.6 0.4 0.6
Summary ofthe Annual Report201524

Table 5 Industrial production
(2010=100)
Source: ELSTAT.
Industry 100.0 -5.9 -5.7 -2.0 -3.2 -1.9 0.6 88.3
1. Mining and quarrying 6.1 100.0 -6.5 -2.0 -0.9 -11.5 -0.3 -6.9 79.8
Mining of coal and lignite 56.6 -13.1 3.8 6.7 -14.4 -6.7 -8.6 80.8
Extraction of crude petroleum and natural gas 1.9 42.5 -24.3 -2.2 -7.9 -15.5 3.5 59.6
Mining of metal ores 9.1 16.2 11.2 -12.3 -15.3 2.9 -7.0 79.0
Other mining and quarrying 32.4 -0.1 -17.9 -16.1 0.8 19.2 -3.6 79.8
2. Manufacturing 69.5 100.0 -5.1 -9.1 -3.5 -1.1 1.8 1.2 89.3
Food 19.9 -4.0 -3.6 -2.0 -3.7 3.1 -0.2 93.6
Beverages 8.0 -7.6 -6.5 -6.1 -1.7 -0.6 3.0 88.4
Tobacco 1.7 -17.5 10.3 -8.9 2.7 -4.4 18.8 117.2
Textiles 1.5 -20.6 -14.5 -11.9 -10.0 -10.5 1.8 61.7
Wearing apparel 1.7 -23.1 -19.4 -11.2 -6.2 -6.7 -13.7 54.1
Leather and footwear 0.3 -36.9 -12.2 -29.0 -2.7 -12.8 -13.5 45.8
Wood and cork 0.7 9.4 -16.5 -27.0 -23.2 -10.3 -7.1 39.0
Paper and paper products 2.5 -3.4 -5.0 -8.7 2.7 8.3 2.0 98.4
Printing and reproduction of recorded media 2.1 -14.1 -22.9 -18.7 -5.9 -2.5 -6.5 53.8
Coke and refined petroleum products 15.1 5.7 -14.6 23.9 4.2 7.3 1.2 119.9
Chemicals and chemical products 6.3 1.5 -2.1 -9.4 2.2 1.2 2.5 94.0
Basic pharmaceuticals 4.9 2.4 -1.2 -5.3 9.8 -4.2 6.4 104.8
Rubber and plastic products 4.4 -7.0 -5.7 -6.0 -1.8 1.7 3.5 91.6
Non-metallic mineral products 7.9 -14.2 -34.0 -15.8 -1.9 2.0 -0.4 55.4
Basic metals 7.0 12.0 7.2 -5.0 -4.9 5.2 4.1 106.1
Metal products 4.5 0.2 -7.1 -7.3 -8.2 -1.4 -3.5 75.2
Computers, electronics and optical products 0.6 -26.6 -25.1 3.6 15.3 10.8 28.3 127.3
Electrical equipment 2.7 -4.1 -13.5 -5.4 -13.2 -10.7 5.4 66.9
Machinery and equipment n.e.c. 1.5 -21.0 -5.2 -12.0 1.4 0.0 0.6 85.1
Motor vehicles, trailers and semi-trailers 0.5 -1.6 -40.4 4.9 2.2 2.8 -11.5 58.1
Other transport equipment 1.0 -35.1 -22.2 -40.0 26.9 -51.9 7.2 30.6
Furniture 1.3 -19.0 -22.3 -28.1 -16.5 2.2 0.3 47.9
Other manufacturing activities 0.4 -10.5 -9.9 -15.0 1.5 4.7 8.2 88.1
Repair and installation of machineryand equipment
3.5 -22.8 -6.1 -22.1 -3.1 2.9 -17.8 60.0
3. Electricity 20.6 100.0 -9.2 4.0 1.8 -6.9 -13.6 0.3 85.4
4.Water supply 3.8 100.0 0.7 -2.0 1.1 -2.5 -0.5 1.8 97.8
Industry 100.0 -5.9 -5.7 -2.0 -3.2 -1.9 0.6 88.3
Main industrial groupings
Energy 38.7 -4.9 -1.8 7.4 -4.2 -5.6 0.0 95.4
Intermediate goods 26.0 -0.9 -9.5 -8.9 -3.8 2.6 1.2 82.3
Capital goods 6.1 -22.1 -13.5 -19.2 -0.5 -2.2 -6.4 63.7
Consumer durables 1.7 -13.4 -15.8 -19.0 -12.8 -6.8 2.7 57.0
Consumer non-durables 28.0 -7.2 -5.3 -5.0 -0.9 0.3 2.0 91.2
Weights2010
Average annualpercentage changes
Level2015
(2010=100)2010 2011 2012 2013 2014 2015
Summary ofthe Annual Report
2015 25
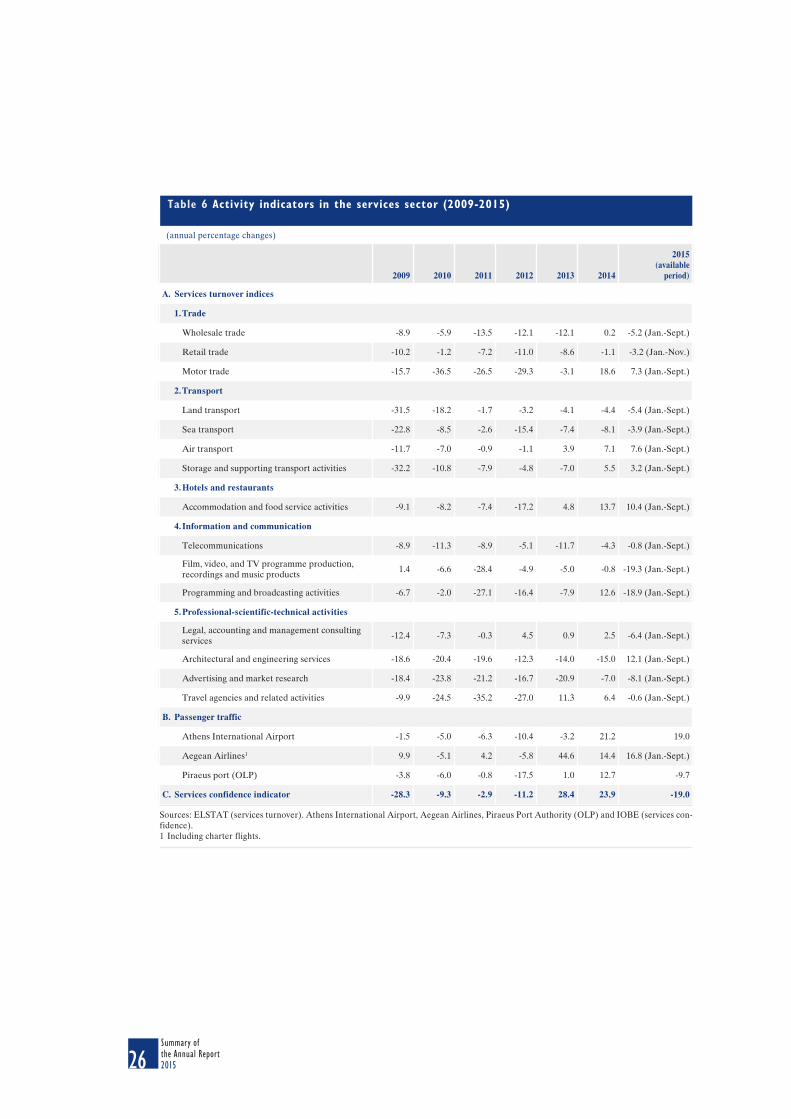
Table 6 Activity indicators in the services sector (2009-2015)
(annual percentage changes)
2009 2010 2011 2012 2013 2014
2015(available
period)
A. Services turnover indices
1.Trade
Wholesale trade -8.9 -5.9 -13.5 -12.1 -12.1 0.2 -5.2 (Jan.-Sept.)
Retail trade -10.2 -1.2 -7.2 -11.0 -8.6 -1.1 -3.2 (Jan.-Nov.)
Motor trade -15.7 -36.5 -26.5 -29.3 -3.1 18.6 7.3 (Jan.-Sept.)
2.Transport
Land transport -31.5 -18.2 -1.7 -3.2 -4.1 -4.4 -5.4 (Jan.-Sept.)
Sea transport -22.8 -8.5 -2.6 -15.4 -7.4 -8.1 -3.9 (Jan.-Sept.)
Air transport -11.7 -7.0 -0.9 -1.1 3.9 7.1 7.6 (Jan.-Sept.)
Storage and supporting transport activities -32.2 -10.8 -7.9 -4.8 -7.0 5.5 3.2 (Jan.-Sept.)
3.Hotels and restaurants
Accommodation and food service activities -9.1 -8.2 -7.4 -17.2 4.8 13.7 10.4 (Jan.-Sept.)
4. Information and communication
Telecommunications -8.9 -11.3 -8.9 -5.1 -11.7 -4.3 -0.8 (Jan.-Sept.)
Film, video, and TV programme production,recordings and music products
1.4 -6.6 -28.4 -4.9 -5.0 -0.8 -19.3 (Jan.-Sept.)
Programming and broadcasting activities -6.7 -2.0 -27.1 -16.4 -7.9 12.6 -18.9 (Jan.-Sept.)
5.Professional-scientific-technical activities
Legal, accounting and management consultingservices
-12.4 -7.3 -0.3 4.5 0.9 2.5 -6.4 (Jan.-Sept.)
Architectural and engineering services -18.6 -20.4 -19.6 -12.3 -14.0 -15.0 12.1 (Jan.-Sept.)
Advertising and market research -18.4 -23.8 -21.2 -16.7 -20.9 -7.0 -8.1 (Jan.-Sept.)
Travel agencies and related activities -9.9 -24.5 -35.2 -27.0 11.3 6.4 -0.6 (Jan.-Sept.)
Β. Passenger traffic
Athens International Airport -1.5 -5.0 -6.3 -10.4 -3.2 21.2 19.0
Aegean Airlines1 9.9 -5.1 4.2 -5.8 44.6 14.4 16.8 (Jan.-Sept.)
Piraeus port (OLP) -3.8 -6.0 -0.8 -17.5 1.0 12.7 -9.7
C. Services confidence indicator -28.3 -9.3 -2.9 -11.2 28.4 23.9 -19.0
Sources: ELSTAT (services turnover). Athens International Airport, Aegean Airlines, Piraeus Port Authority (OLP) and IOBE (services con-fidence).1 Including charter flights.
Summary ofthe Annual Report201526

Source: Calculations based on Eurostat and ELSTAT data.1 Including alcoholic beverages and tobacco.
Table 7 Price developments in Greece and the euro area
(annual percentage changes)
Α. Euro area
Harmonised Index of Consumer Prices (HICP) and its components
Overall index 2.7 2.5 1.4 0.4 0.0
Goods 3.3 3.0 1.3 -0.2 -0.8
Food 2.7 3.1 2.7 0.5 1.0
Processed food1 3.3 3.1 2.2 1.2 0.6
Unprocessed food 1.8 3.0 3.5 -0.8 1.6
Industrial goods 3.7 3.0 0.6 -0.5 -1.8
Non-energy industrial goods 0.8 1.2 0.6 0.1 0.3
Energy 11.9 7.6 0.6 -1.9 -6.8
Services 1.8 1.8 1.4 1.2 1.2
Industrial producer prices 5.7 2.8 -0.2 -1.5 -2.7
Β. Greece
Harmonised Index of Consumer Prices (HICP) and its components
Overall index 3.1 1.0 -0.9 -1.4 -1.1
Goods 4.0 1.9 0.7 -1.0 -2.0
Food 4.2 1.3 0.9 -1.0 1.7
Processed food1 4.7 1.2 0.7 0.6 1.8
Unprocessed food 3.4 1.4 1.3 -3.5 1.7
Industrial goods 3.9 2.3 0.4 -1.2 -5.3
Non-energy industrial goods -0.2 -0.6 -1.7 -1.0 -1.8
Energy 16.7 12.6 6.3 -2.0 -11.1
Services 1.9 -0.2 -2.9 -2.0 0.0
Industrial producer prices 7.4 4.9 -0.7 -0.8 -5.8
2011 2012 2013 2014 2015
Summary ofthe Annual Report
2015 27

Source: ELSTAT and calculations based on ELSTAT data.
Table 8 Price indices
(annual percentage changes)
2011 3.3 4.2 2.3 1.5 1.3 3.1 5.1 18.8
2012 1.5 2.2 0.5 0.3 0.1 1.5 1.5 12.0
2013 -0.9 0.1 -2.2 -1.7 -1.9 0.0 3.0 4.6
2014 -1.3 -1.3 -1.4 -0.7 -0.9 -1.7 -8.6 -4.1
2015 -1.7 -2.5 -0.7 -0.5 -0.9 1.8 6.5 -13.9
2011 7.4 2.7 4.8 1.1 8.8 3.8 7.6 1.5
2012 4.9 0.8 0.6 1.1 4.1 1.3 4.5 0.6
2013 -0.7 0.0 -1.1 1.1 -1.7 -0.2 -2.7 -0.4
2014 -0.8 -0.5 -1.4 0.2 -2.7 -1.2 -3.7 -0.9
2015 -5.8 0.0 0.0 0.0 -11.4 0.0 -10.5 0.0
Year
Consumer Price Index
Overallindex
Sub-indices
Goods Services
CPI excludingfuel & fresh
fruit andvegetables
CPIexcluding
food & fuel
Food andnon-
alcoholicbeverages
Fresh fruitand
vegetables Fuel
Year
Industrial Producer Price Index Importprice indexin industryDomestic market
Externalmarket
Overallindex
Sub-indices
Overallindex
Overall indexexcl. energy
Overall indexexcl. energy
Intermediategoods
Consumergoods
Overallindex
Overall indexexcl. energy
Summary ofthe Annual Report201528

Table 9 Compensation of employees and labour cost (2012-2016)
(annual percentage changes)
Total compensation of employees -9.8 -10.2 -2.0 -1.1 -1.3 1.4
Compensation per employee -3.0 -7.0 -2.1 -3.6 -2.7 0.9
Labour productivity (GDP/total employment) -1.1 0.4 0.5 -1.5 -1.1 -0.6
Unit labour cost (total economy) -2.0 -7.4 -2.6 -2.1 -1.1 1.5
2012 2013 20142015
Jan.-Sept.*2015
(estimate)2016
(forecast)
Source: For 2012-2014 and for January-September 2015: ELSTAT, National Accounts data for all aggregates. For 2015 and 2016: Bank of Greeceestimates/forecasts.* Seasonally adjusted data.
Summary ofthe Annual Report
2015 29

Table 10 Balance of payments
(million euro)
Source: Bank of Greece.1 (+) net inflow, (–) net outflow.2 (+) decrease, (–) increase.
I CURRENT ACCOUNT (Ι.Α+Ι.Β+Ι.C+Ι.D) -3,691.9 -3,767.4 -7.5BALANCE OF GOODS AND SERVICES (I.A+I.B) -5,030.9 -4,006.3 -234.6
Receipts 54,941.4 57,839.3 52,774.9Payments 59,972.3 61,845.5 53,009.5
Ι.A Trade balance (I.Α.1―I.Α.2) -20,780.3 -22,279.4 -17,247.8I.A.1 Exports of goods 26,895.6 26,788.0 24,787.2
Oil 9,485.1 9,049.8 6,713.7Ships (receipts) 443.0 626.0 175.5Goods excluding oil and ships 16,967.6 17,112.1 17,898.0
I.A.2 Imports of goods 47,675.9 49,067.4 42,035.0Oil 16,398.5 15,384.2 10,921.8Ships (payments) 1,926.2 2,799.2 623.2Goods excluding oil and ships 29,351.1 30,884.1 30,489.9
Ι.Β Services balance (I.Β.1―I.Β.2) 15,749.4 18,273.2 17,013.2I.B.1 Receipts 28,045.8 31,051.3 27,987.7
Travel 12,152.2 13,393.1 14,194.4Transport 12,060.9 13,130.8 9,968.3Other services 3,832.7 4,527.4 3,825.0
I.B.2 Payments 12,296.4 12,778.1 10,974.5Travel 1,835.2 2,076.4 2,025.1Transport 6,492.2 6,258.6 5,430.0Other services 3,969.1 4,443.1 3,519.4
Ι.C Income balance (I.C.1―I.C.2) -457.0 573.6 739.3I.C.1 Receipts 6,458.1 6,867.4 5,942.8
Wages, salaries 209.3 209.9 153.8Interest, dividends, profits 3,213.7 3,241.5 2,624.4Other primary income 3,035.1 3,416.1 3,164.6
I.C.2 Payments 6,915.1 6,293.8 5,203.5Wages, salaries 453.0 491.7 379.4Interest, dividends, profits 6,097.1 5,439.6 4,525.0Other primary income 365.0 362.6 299.1
Ι.D Current transfers balance (I.D.1–I.D.2) 1,796.1 -334.7 -512.2I.D.1 Receipts 4,652.8 2,550.7 1,908.7
General government 3,375.5 1,441.7 1,054.9Other sectors 1,277.3 1,109.0 854.9
I.D.2 Payments 2,856.7 2,885.5 2,421.9General government 2,068.1 2,054.7 1,695.0Other sectors 788.6 830.8 726.9
ΙΙ CAPITAL ACCOUNT (IΙ.1–IΙ.2) 3,040.8 2,510.6 1,988.6ΙΙ.1 Receipts 3,380.6 2,866.2 2,369.5
General government 3,298.9 2,789.8 2,319.3Other sectors 81.7 76.4 50.2
ΙΙ.2 Payments 339.8 355.6 380.9General government 9.7 8.8 4.1Other sectors 330.1 346.7 376.8
CURRENT AND CAPITAL ACCOUNT (I+II) -651.1 -1,256.8 1,981.1ΙII FINANCIAL ACCOUNT (III.A+III.B+III.C+III.D) 2,562.5 634.1 3,143.5
ΙII.Α Direct investment1 -2,713.6 -577.4 602.9Assets -534.2 685.0 345.4Liabilities 2,179.4 1,262.5 -257.6
ΙII.Β Portfolio investment1 6,583.1 6,978.0 8,348.3Assets -1,023.6 8,910.1 6,996.0Liabilities -7,606.7 1,932.1 -1,352.4
ΙII.C Other investment1 -1,414.0 -6,222.5 -6,162.2Assets -21,187.9 -6,888.7 16,699.8Liabilities -19,773.9 -666.2 22,861.9(General government borrowing) 30,061.2 4,000.2 11,921.6
ΙII.D Change in reserve assets2 107.0 456.0 354.4IV ERRORS AND OMISSIONS (Ι + ΙΙ - III + IV=0) 3,213.6 1,890.9 1,162.3RESERVE ASSETS 4,172 5,117 5,535
2013 2014 2015
Summary ofthe Annual Report201530

General government balance1
(national accounts data – convergence criterion)-10.2 -8.8 -12.4 -3.6 -3.2*
– Central government -9.3 -8.3 -14.7 -4.3 -
– Social security funds, local government, legal entitiesin public law -0.9 -0.5 2.3 0.7 -
General government balance adjusted for net supportto financial institutions1 -10.5 -6.1 -1.8 -3.6 -3.2*
General government primary balance adjusted for netsupport to financial institutions1 -3.3 -1.0 2.2 0.4 0.7*
General government primary balance(Financial Assistance Facility Agreement)2 -1.3 1.2 0.3 -0.2*
State budget balance
Administrative data2 -11.0 -8.2 -3.0 -2.1 -2.0
Cash data3 -11.1 -5.6 4 -7.15 -2.46 -1.97
2011 2012 2013 2014 2015
Table 11 General government and state budget balances
(as a percentage of GDP)
Sources: Bank of Greece, Ministry of Finance and ELSTAT.* Provisional data (State General Accounting Office, Introductory Report on the 2016 Budget).1 ELSTAT data, as notified to the European Commission (Excessive Deficit Procedure). Figures may not add up due to rounding.2 State General Accounting Office data (State Budget Execution Bulletins and Introductory Report on the 2016 Budget).3 Bank of Greece data. These data refer only to the state budget on a cash basis, excluding movements in the OPEKEPE account.4 Excluding accrued interest of €4,751 million, paid in the form of EFSF notes, on PSI bonds, as well as interest payments of €519 million asa result of the debt buyback through EFSF notes.5 Excluding revenue of €2.0 billion from the transfer of profits on Greek government bond holdings of Eurosystem central banks (SecuritiesMarkets Programme – SMP). Including expenditure of around €6,155 million for the payment of arrears.6 Excluding revenue of €62 million from the transfer of profits on Greek government bond holdings of Eurosystem central banks (SecuritiesMarkets Programme – SMP). Including expenditure of around €1,152 million for the payment of arrears.7 Excluding revenue of €55 million from the transfer of profits on Greek government bond holdings of Eurosystem central banks (SecuritiesMarkets Programme – SMP).
Summary ofthe Annual Report
2015 31

Summary ofthe Annual Report201532
Table 12 Decomposition of changes in the general government debt-to-GDP ratio1
(percentage points of GDP)
Source: Ministry of Finance, General Directorate of Economic Policy, “Hellas: Macroeconomic Aggregates”.* Provisional data.1 Changes in the debt ratio have been decomposed using the following formula:
Dt – Dt-1 = PBt + Dt-1 *it – gt + SFt Yt Yt-1 Yt Yt-1 1 + g Yt
where Dt = general government debtPBt = primary balance (deficit (+) or surplus (-))Yt = GDP at current pricesgt = nominal GDP growth rateit = average nominal interest rate on government debtSFt = deficit-debt adjustment
2 The deficit-debt adjustment includes expenditure or liability assumption by general government that does not affect the deficit but increasesdebt, as well as revenue (e.g. privatisation proceeds) that does not affect the deficit but reduces debt.
General government debt-to-GDPratio
107.3 103.5 103.1 109.4 126.7 146.2 172.0 159.4 177.0 178.6 180.2
Changes in the general governmentdebt-to-GDP ratio
4.6 -3.8 -0.5 6.3 17.3 19.5 25.8 -12.5 17.5 1.6 1.6
– Primary balance 1.5 1.5 2.2 5.4 10.1 5.4 3.0 3.7 8.4 -0.4 -0.7
– Change in GDP and change ininterest rates 1.8 -4.8 -2.1 0.9 7.1 12.3 20.7 19.3 13.6 6.8 5.9
– Deficit-debt adjustment2 1.3 -0.6 -0.6 0.1 0.1 1.8 2.1 -35.6 -4.5 -4.8 -3.5
2005 2006 2007 2008 2009 2010 2011 2012 2013 2014 2015*

Summary ofthe Annual Report
2015 3333

Summary ofthe Annual Report201534

Summary ofthe Annual Report
2015 35

Summary ofthe Annual Report201536

Summary ofthe Annual Report
2015 37

Summary ofthe Annual Report201538

Summary ofthe Annual Report
2015 39
ANNUAL ACCOUNTSOF THE BANK OF GREECE
FOR THE Y E AR 2015

Summary ofthe Annual Report201540
To the Shareholders of BANK OF GREECE A.E
Report on the Financial Statements
We have audited the accompanying financial statements of BANK OF GREECE A.E. (the“Bank”) which comprise the balance sheet as of 31 December 2015 and the statement of income,the appropriation account for the year then ended, and a summary of significant accounting poli-cies and other explanatory information.
Management’s Responsibility for the Financial Statements
Management is responsible for the preparation and fair presentation of these financial statementsin accordance with the accounting principles prescribed by the European Central Bank (ECB)as adopted by the Bank in Article 54A of its Statute and the Greek accounting principles, wherethe Guideline of the ECB does not provide specific direction, as well as for such internal con-trol as management determines is necessary to enable the preparation of financial statementsthat are free from material misstatement, whether due to fraud or error.
Auditor’s responsibility
Our responsibility is to express an opinion on these financial statements based on our audit. Weconducted our audit in accordance with International Standards on Auditing. Those standardsrequire that we comply with ethical requirements and plan and perform the audit to obtain rea-sonable assurance whether the financial statements are free from material misstatement.
An audit involves performing procedures to obtain audit evidence about the amounts and dis-closures in the financial statements. The procedures selected depend on the auditor’s judgment,including the assessment of the risks of material misstatement of the financial statements, whetherdue to fraud or error. In making those risk assessments, the auditor considers internal controlrelevant to the entity’s preparation and fair presentation of the financial statements in order todesign audit procedures that are appropriate in the circumstances, but not for the purpose ofexpressing an opinion on the effectiveness of the Bank’s internal control. An audit also includesevaluating the appropriateness of accounting policies used and the reasonableness of account-ing estimates made by management, as well as evaluating the overall presentation of the finan-cial statements.
We believe that the audit evidence we have obtained is sufficient and appropriate to provide abasis for our audit opinion.
Opinion
In our opinion, the financial statements give a true and fair view of the financial position of BANKOF GREECE A.E. as at 31 December 2015 and of its financial performance for the year thenended in accordance with the accounting principles prescribed by the ECB as adopted by the Bankin Article 54A of its Statute and the Greek accounting principles, where the Guideline of the ECBdoes not provide specific direction.
INDEPENDENT AUDITOR'S REPORT

Summary ofthe Annual Report
2015 41
Report on Other Legal and Regulatory Requirements
We verified that the contents of the Report of the General Council relating to the statement ofincome for 2015 to the Annual Shareholders Meeting are consistent and correspond with theaccompanying financial statements within the scope set by the provisions of C.L. 2190/1920.
Athens, 18 January 2016
KPMG Certified Auditors Α.Ε.AM SOEL 114
Nikolaos Vouniseas Ioannis AchilasCertified Auditor Accountant Certified Auditor Accountant
AM SOEL 18701 AM SOEL 12831

Summary ofthe Annual Report201542
BALANCE SHEET AS AT 31 DECEMBER 2015EIGHTY--EIGHTH YEAR
(in euro)
A S S E T S 31.12.2015 31.12.2014
1. Gold and gold receivables 4,655,876,333 4,720,522,384
2. Claims on non-euro area residents denominated in foreign currency 2,046,275,257 1,570,953,046
2.1 Receivables from the International Monetary Fund (IMF) 635,957,699 947,944,540
2.2 Balances with banks and security investments,
external loans and other external assets 1,410,317,558 623,008,506
3. Claims on euro area residents denominated in foreign currency 613,387,274 599,521,200
3.1 General government 306,522,843 288,310,529
3.2 Other claims 306,864,431 311,210,671
4. Claims on non-euro area residents denominated in euro 23,881 23,881
4.1 Balances with banks, security investments and loans 23,881 23,881
4.2 Claims arising from the credit facility under ERM II 0 0
5. Lending to euro area credit institutions related to
monetary policy operations denominated in euro 38,599,000,000 56,039,400,000
5.1 Main refinancing operations 26,570,000,000 47,149,400,000
5.2 Longer-term refinancing operations 12,000,000,000 8,890,000,000
5.3 Fine-tuning reverse operations 0 0
5.4 Structural reverse operations 0 0
5.5 Marginal lending facility 29,000,000 0
5.6 Credits related to margin calls 0 0
6. Other claims on euro area credit institutions denominated in euro 68,914,635,432 1,095,137
7. Securities of euro area residents denominated in euro 39,764,480,573 31,056,804,080
7.1 Securities held for monetary policy purposes 20,711,295,716 5,786,493,862
7.2 Other securities of euro area residents denominated in euro 19,053,184,857 25,270,310,218
8. General government long-term debt denominated in euro 4,843,627,573 5,249,170,866
9. Intra-Eurosystem claims 1,781,727,954 1,773,729,971
9.1 Participating interest in the ECB 564,765,496 564,765,496
9.2 Claims equivalent to the transfer of foreign reserves to the ECB 1,178,260,606 1,178,260,606
9.3 Net claims related to the allocation of euro banknotes
within the Eurosystem 0 0
9.4 Net claims arising from balances of TARGET2 accounts 0 0
9.5 Other claims within the Eurosystem (net) 38,701,852 30,703,869
10. Items in course of settlement 0 0
11. Other assets 2,294,067,038 2,146,353,296
11.1 Coins 58,024,469 56,067,754
11.2 Tangible and intangible fixed assets 801,561,779 809,329,992
11.3 Other financial assets 93,405,313 91,609,288
11.4 Off-balance-sheet instruments revaluation differences 82,318 229,653
11.5 Accruals and prepaid expenses 743,311,071 614,144,364
11.6 Sundry 597,682,088 574,972,245
T O T A L A S S E T S 163,513,101,315 103,157,573,861

Summary ofthe Annual Report
2015 43
(in euro)
L I A B I L I T I E S 31.12.2015 31.12.2014
1. Banknotes in circulation 28,792,125,675 27,172,060,740
2. Liabilities to euro area credit institutions related to
monetary policy operations denominated in euro 1,387,143,530 3,076,270,299
2.1 Current accounts (covering the minimum reserve system) 1,258,943,530 2,926,270,2992.2 Deposit facility 0 150,000,0002.3 Fixed-term deposits 0 02.4 Fine-tuning reverse operations 0 02.5 Deposits related to margin calls 128,200,000 0
3. Other liabilities to euro area credit institutions
denominated in euro 0 0
4. Liabilities to other euro area residents denominated in euro 5,085,184,765 4,377,583,848
4.1 General government 3,749,122,957 3,520,526,2644.2 Other liabilities 1,336,061,808 857,057,584
5. Liabilities to non-euro area residents denominated in euro 1,227,986,892 1,438,395,120
6. Liabilities to euro area residents denominated in foreign currency 646,431,879 302,447,427
7. Liabilities to non-euro area residents denominated in foreign currency 2,666 2,391
7.1 Deposits and other liabilities 2,666 2,3917.2 Liabilities arising from the credit facility under ERM II 0 0
8. Counterpart of special drawing rights allocated by the IMF 0 932,888,415
9. Intra-Eurosystem liabilities 113,977,496,400 54,502,387,704
9.1 Liabilities related to promissory notes backing
the issuance of ECB debt certificates 0 09.2 Net liabilities related to the allocation of euro
banknotes within the Eurosystem 19,590,587,680 5,183,480,7909.3 Net liabilities arising from balances of TARGET2 accounts 94,386,908,720 49,318,906,9149.4 Other liabilities within the Eurosystem (net) 0 0
10. Items in course of settlement 955,123 2,558,265
11. Other liabilities 1,310,063,399 706,238,137
11.1 Off-balance-sheet instruments revaluation differences 17,549,614 523,58211.2 Accruals and income collected in advance 16,430,532 14,007,24911.3 Sundry 1,276,083,253 691,707,306
12. Provisions 7,198,507,643 6,788,684,202
13. Revaluation accounts 3,071,705,530 3,042,557,641
14. Capital and reserves 815,497,813 815,499,672
14.1 Capital 111,243,362 111,243,36214.2 Ordinary reserve 111,243,362 111,243,36214.3 Extraordinary reserve 84,500,000 84,500,00014.4 Special reserve from the revaluation of land and buildings 507,247,856 507,247,85614.5 Other special reserves 1,263,233 1,265,092
T O T A L L I A B I L I T I E S 163,513,101,315 103,157,573,861
Summary ofthe Annual Report201544
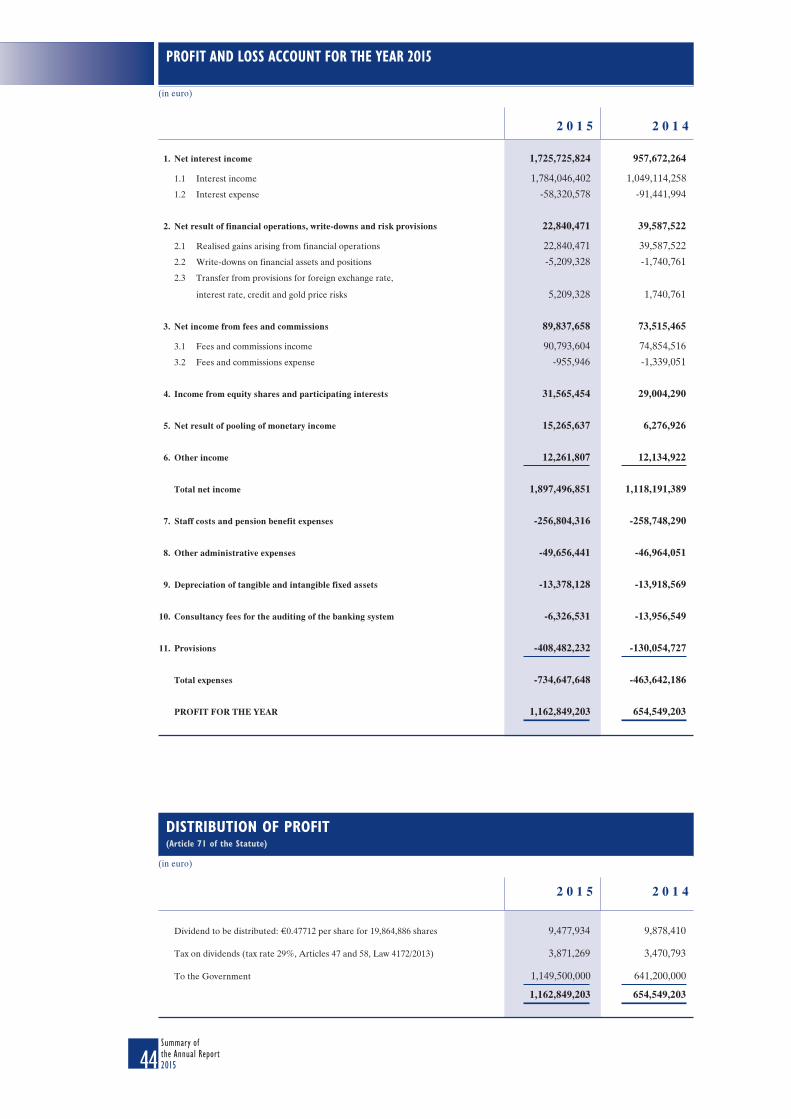
PROFIT AND LOSS ACCOUNT FOR THE YEAR 2015
(in euro)
2 0 1 5 2 0 1 4
1. Net interest income 1,725,725,824 957,672,264
1.1 Interest income 1,784,046,402 1,049,114,258
1.2 Interest expense -58,320,578 -91,441,994
2. Net result of financial operations, write-downs and risk provisions 22,840,471 39,587,522
2.1 Realised gains arising from financial operations 22,840,471 39,587,522
2.2 Write-downs on financial assets and positions -5,209,328 -1,740,761
2.3 Transfer from provisions for foreign exchange rate,
interest rate, credit and gold price risks 5,209,328 1,740,761
3. Net income from fees and commissions 89,837,658 73,515,465
3.1 Fees and commissions income 90,793,604 74,854,516
3.2 Fees and commissions expense -955,946 -1,339,051
4. Income from equity shares and participating interests 31,565,454 29,004,290
5. Net result of pooling of monetary income 15,265,637 6,276,926
6. Other income 12,261,807 12,134,922
Total net income 1,897,496,851 1,118,191,389
7. Staff costs and pension benefit expenses -256,804,316 -258,748,290
8. Other administrative expenses -49,656,441 -46,964,051
9. Depreciation of tangible and intangible fixed assets -13,378,128 -13,918,569
10. Consultancy fees for the auditing of the banking system -6,326,531 -13,956,549
11. Provisions -408,482,232 -130,054,727
Total expenses -734,647,648 -463,642,186
PROFIT FOR THE YEAR 1,162,849,203 654,549,203
2 0 1 5 2 0 1 4
Dividend to be distributed: €0.47712 per share for 19,864,886 shares 9,477,934 9,878,410
Tax on dividends (tax rate 29%, Articles 47 and 58, Law 4172/2013) 3,871,269 3,470,793
To the Government 1,149,500,000 641,200,000
1,162,849,203 654,549,203
DISTRIBUTION OF PROFIT(Article 71 of the Statute)
(in euro)

Summary ofthe Annual Report
2015 45

Summary ofthe Annual Report201546


FE
BR
UA
RY
20
16
SU
MM
AR
Y O
F TH
E A
NN
UA
L R
EP
OR
T 2
015
BA
NK
OF
GR
EEC
E
EUR
OSY
STE
M
ISSN: 1105 - 0527