summary - redmond
TRANSCRIPT
To: Greg Arms, Milestone Northwest LLC
From: William Kidder, Lead Ecologist, Perteet Jason Walker, PWS, Environmental Planning Manager, Perteet
Date: January 27, 2020
Re: Wetland Reconnaissance, Garbarino Property
Summary
On January 20, 2020, Perteet conducted a field reconnaissance of King County Tax Parcels 1246700329, 1246700321, and 1246700320. The site address is understood to be 10042 136th Ave NE, Redmond, Washington in the jurisdiction of City of Redmond, Washington.
The field reconnaissance was conducted to observe and evaluate general site characteristics in comparison to any mapped resource information and to preliminarily consider the current and probable extent of any wetland, stream, or fish and wildlife habitat conservation areas on the property or observable off-site from the property.
The following publicly available resource information was reviewed for this effort:
• City of Redmond Property Viewer• City of Redmond Standard PDF Maps – Wetlands; Stream Classifications; and Fish & Wildlife Habitat
Conservation Areas• King County GIS datasets• King County iMap Portal including Property Account Summaries• National Wetlands Inventory Wetland Mapper• Washington Department of Fish and Wildlife Salmonscape• Washington Department of Fish and Wildlife Priority Habitats and Species (PHS) on the Web• USDA NRCS Web Soil Survey• WDNR Forest Practices Application Mapping Tool (FPARS)
Wetlands are determined in accordance with the U.S. Army Corps of Engineers Wetland Delineation Manual (“Corps Manual”; Environmental Laboratory 1987), and the Regional Supplement to the Corps of Engineers Wetland Delineation Manual: Western Mountains, Valleys, and Coast Region (“2010 Regional Supplement”; Corps 2010). Pursuant to the Washington Administrative Code (WAC), section 173-22-035, wetland
Attachment 10
determinations under Growth Management Act (GMA) jurisdiction in the State of Washington should be done according to the currently approved federal manual and supplements.
The routine wetland determination method outlined in the Corps Manual and 2010 Regional Supplement was used. This methodology utilizes a three parameter approach for identifying and delineating wetlands. These parameters include positive indicators for hydrophytic vegetation, appropriate hydrology, and hydric soils. An evaluation of the vegetation, hydrology and soils was made along the interface of any probable wetlands and in uplands in order to evaluate potential wetland indicators. Plant species in the attached data forms were identified using the U.S. Army Corps of Engineers National Wetland Plant List (Lichvar et. al. 2016), USDA Plants Database, A Field Guide to the Common Wetland Plants of Western Washington and Northwest Oregon (Cooke 1997), and Plants of the Pacific Northwest (Pojar and MacKinnon 1994). Plant species wetland facultative status was assigned according to the U.S. Army Corps of Engineers National Wetlands Plant List (Lichvar et. al. 2016). Hydric soil conditions were observed in accordance with the Corps Wetland Delineation Manual, the 2010 Regional Supplement, and the USDA NRCS Field Indicators of Hydric Soils in the United States (USDA 2017) guidance. Soil colors were moistened and verified using Munsell Soil Color Charts.
Streams are determined in accordance with Determining the Ordinary High Water Mark on Streams in Washington State (Anderson et. al. 2016). Fish and wildlife habitat conservation areas were determined in accordance with the special status species and definitions for priority habitats described in the Washington State Priority Habitats and Species List (WDFW 2008, updated September 2018).
The subject property was observed for critical areas indicators. Visual observations of neighboring parcels’ existing conditions and/or critical area features (including potential buffers) as they may affect the subject property were also evaluated to the extent possible from the subject property and public spaces.
Findings
Perteet ecologists completed a site reconnaissance on January 20, 2020 of the subject parcels. Each parcel contained one residential dwelling with asphalt driveway, mowed lawns, and mixed coniferous/deciduous forest isolated by surrounding suburban development (Figure attached). The main parcel (1246700329) beyond the house and driveway is dominated by native and non-native tree and shrub forest habitat. The northwest parcel (1246700321) contains a small vacant residential dwelling, a job site trailer, piles of refuse and debris, and mowed lawn. The northeast parcel (1246700320) contains a single-family residence with large driveway, a small mowed lawn, and native and non-native tree and shrub forest habitat extending across from the main parcel. The main and northwest parcels are proposed for residential high intensity development. The northeast parcel may be proposed to receive driveway and utilities improvements along its south half adjacent to the main parcel.
Two sample plots (attached) were completed at the locations containing wetland vegetation conditions. The sample plots’ soils and hydrology did not contain wetland soil or hydrology parameters. Soils were dry to damp, but no saturation or inundation was observed within the soil’s upper 18 inches. The majority of the subject parcels contained a dominance of facultative upland vegetation (Douglas fir, big leaf maple, English holly, sword fern, English ivy).
On-site and adjacent off-site habitat conditions do not support the life history requirements of locally important or state / federal special status fish or wildlife species.
The three subject parcels contained no presence of wetlands, streams, or fish and wildlife habitat conversation areas. No critical areas or priority species/habitats were identified by Perteet beyond but within
Attachment 10
200 feet of the subject parcels. Publicly available background resource information identified no critical areas features on or within 200 feet of the subject parcels.
Regulatory Considerations
No wetland, stream, or fish and wildlife habitat conservation areas meeting the City of Redmond Chapter 20D.140.10 Critical Areas criteria are present on or adjacent to the three subject parcels that might encumber development opportunities of the subject parcels.
Attachments
• Critical areas assessment figure • Sample plot data forms
END OF MEMO
Attachment 10

Date: 1/28/2020 Source: Perteet Inc., King County; City of Redmond
Path
: \\p
erte
et.c
om\F
iles\
Clie
nts\
Mile
ston
e N
orth
wes
t LLC
\Pro
ject
s\20
2000
10 -
Gar
barin
o Si
te- C
ritic
al A
reas
Rec
on\G
IS\M
apdo
cs\G
arba
rino_
Wet
land
Ass
essm
ent.m
xd
NE 100TH ST
137TH
PL NE
NE 100TH CT
136TH
AVE N
E
NE 102ND PL
138TH
AVE N
E
12467003331246700333
1246700320124670032012467003211246700321
12467003291246700329
SP-1SP-1
SP-2SP-2
Pictometry, King County
I0 10050
Feet
LegendSamplePlotStreamWetland
Subject PropertyTax Parcels
Garbarino Property Critical Areas Site Assessment10042 136th Ave NE, Redmond, Washington
Milestone Northwest LLC
Attachment 10
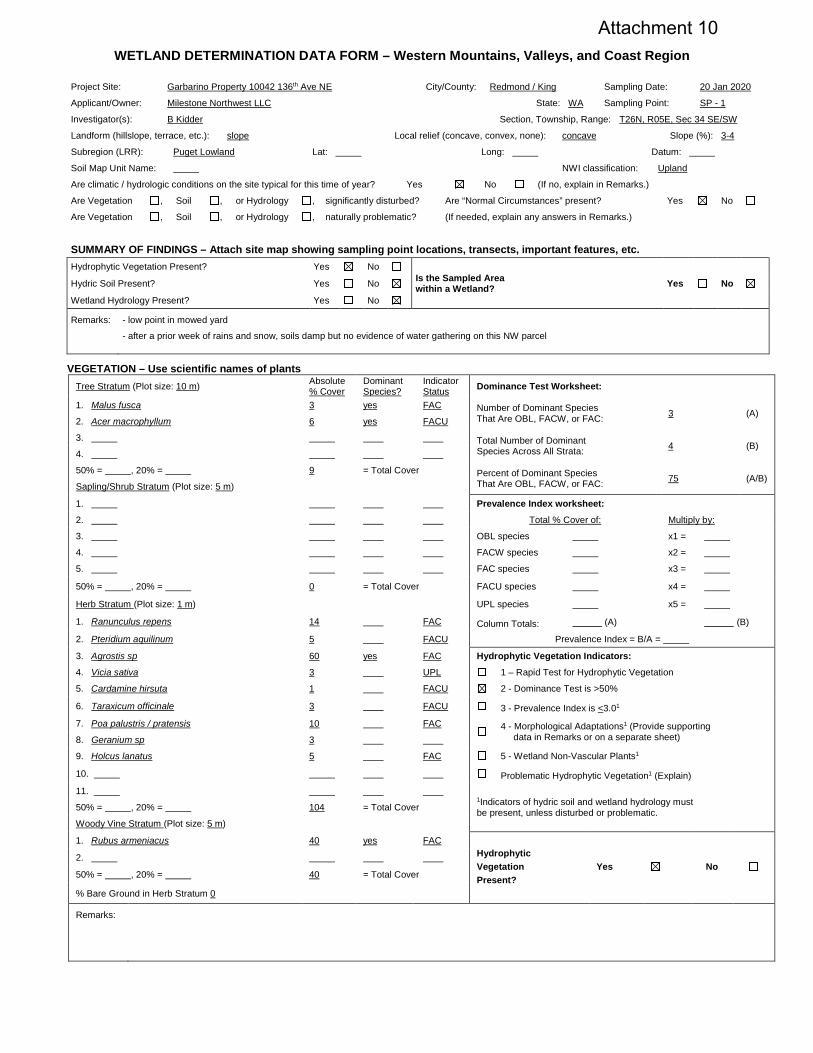
WETLAND DETERMINATION DATA FORM – Western Mountains, Valleys, and Coast Region
VEGETATION – Use scientific names of plants Tree Stratum (Plot size: 10 m) Absolute
% Cover Dominant Species?
Indicator Status Dominance Test Worksheet:
1. Malus fusca 3 yes FAC Number of Dominant Species That Are OBL, FACW, or FAC: 3 (A)
2. Acer macrophyllum 6 yes FACU
3. Total Number of Dominant Species Across All Strata: 4 (B)
4.
50% = , 20% = 9 = Total Cover Percent of Dominant Species That Are OBL, FACW, or FAC: 75 (A/B)
Sapling/Shrub Stratum (Plot size: 5 m)
1. Prevalence Index worksheet:
2. Total % Cover of: Multiply by:
3. OBL species x1 =
4. FACW species x2 =
5. FAC species x3 =
50% = , 20% = 0 = Total Cover FACU species x4 =
Herb Stratum (Plot size: 1 m) UPL species x5 =
1. Ranunculus repens 14 FAC Column Totals: (A) (B)
2. Pteridium aquilinum 5 FACU Prevalence Index = B/A =
3. Agrostis sp 60 yes FAC Hydrophytic Vegetation Indicators: 4. Vicia sativa 3 UPL 1 – Rapid Test for Hydrophytic Vegetation
5. Cardamine hirsuta 1 FACU 2 - Dominance Test is >50%
6. Taraxicum officinale 3 FACU 3 - Prevalence Index is <3.01 7. Poa palustris / pratensis 10 FAC
4 - Morphological Adaptations1 (Provide supporting data in Remarks or on a separate sheet) 8. Geranium sp 3
9. Holcus lanatus 5 FAC 5 - Wetland Non-Vascular Plants1
10. Problematic Hydrophytic Vegetation1 (Explain) 11.
1Indicators of hydric soil and wetland hydrology must be present, unless disturbed or problematic. 50% = , 20% = 104 = Total Cover
Woody Vine Stratum (Plot size: 5 m)
1. Rubus armeniacus 40 yes FAC Hydrophytic Vegetation Present?
Yes No 2.
50% = , 20% = 40 = Total Cover
% Bare Ground in Herb Stratum 0
Remarks:
Project Site: Garbarino Property 10042 136th Ave NE City/County: Redmond / King Sampling Date: 20 Jan 2020
Applicant/Owner: Milestone Northwest LLC State: WA Sampling Point: SP - 1
Investigator(s): B Kidder Section, Township, Range: T26N, R05E, Sec 34 SE/SW
Landform (hillslope, terrace, etc.): slope Local relief (concave, convex, none): concave Slope (%): 3-4
Subregion (LRR): Puget Lowland Lat: Long: Datum:
Soil Map Unit Name: NWI classification: Upland
Are climatic / hydrologic conditions on the site typical for this time of year? Yes No (If no, explain in Remarks.)
Are Vegetation , Soil , or Hydrology , significantly disturbed? Are “Normal Circumstances” present? Yes No
Are Vegetation , Soil , or Hydrology , naturally problematic? (If needed, explain any answers in Remarks.)
SUMMARY OF FINDINGS – Attach site map showing sampling point locations, transects, important features, etc. Hydrophytic Vegetation Present? Yes No
Is the Sampled Area within a Wetland? Yes No Hydric Soil Present? Yes No
Wetland Hydrology Present? Yes No
Remarks:
- low point in mowed yard
- after a prior week of rains and snow, soils damp but no evidence of water gathering on this NW parcel
Attachment 10
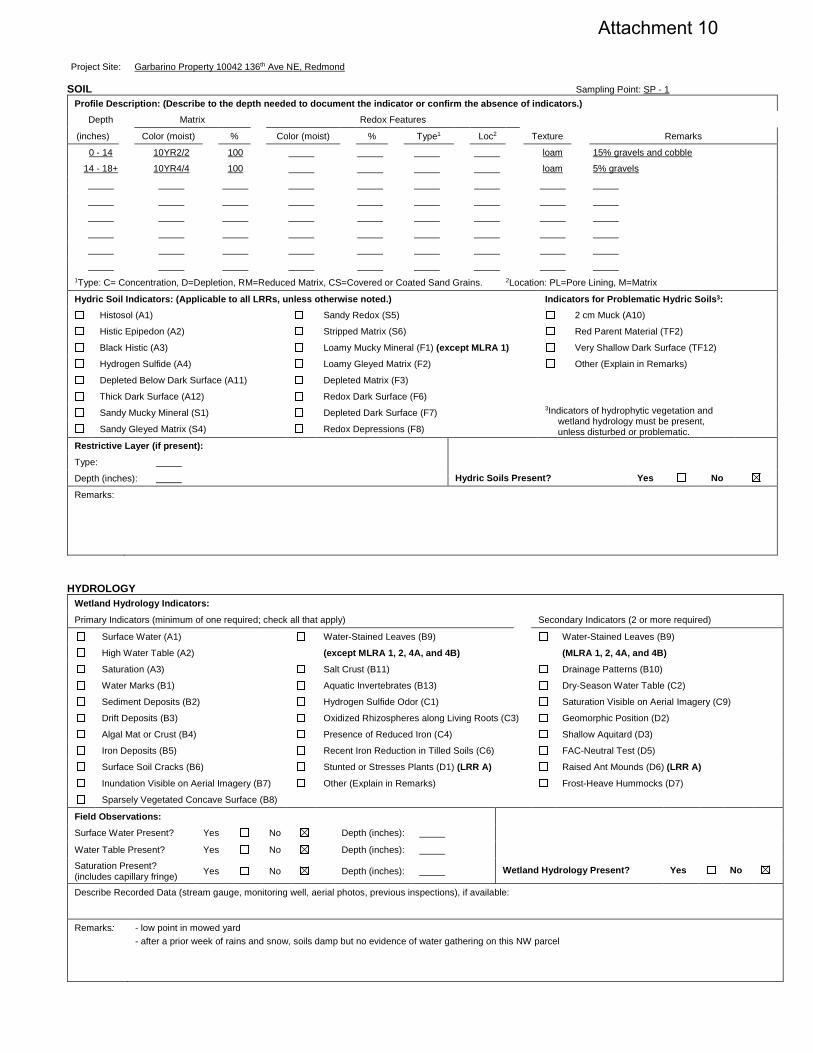
SOIL Sampling Point: SP - 1 Profile Description: (Describe to the depth needed to document the indicator or confirm the absence of indicators.)
Depth Matrix Redox Features
(inches) Color (moist) % Color (moist) % Type1 Loc2 Texture Remarks
0 - 14 10YR2/2 100 loam 15% gravels and cobble
14 - 18+ 10YR4/4 100 loam 5% gravels
1Type: C= Concentration, D=Depletion, RM=Reduced Matrix, CS=Covered or Coated Sand Grains. 2Location: PL=Pore Lining, M=Matrix
Hydric Soil Indicators: (Applicable to all LRRs, unless otherwise noted.) Indicators for Problematic Hydric Soils3: Histosol (A1) Sandy Redox (S5) 2 cm Muck (A10)
Histic Epipedon (A2) Stripped Matrix (S6) Red Parent Material (TF2)
Black Histic (A3) Loamy Mucky Mineral (F1) (except MLRA 1) Very Shallow Dark Surface (TF12)
Hydrogen Sulfide (A4) Loamy Gleyed Matrix (F2) Other (Explain in Remarks)
Depleted Below Dark Surface (A11) Depleted Matrix (F3)
3Indicators of hydrophytic vegetation and wetland hydrology must be present, unless disturbed or problematic.
Thick Dark Surface (A12) Redox Dark Surface (F6)
Sandy Mucky Mineral (S1) Depleted Dark Surface (F7)
Sandy Gleyed Matrix (S4) Redox Depressions (F8)
Restrictive Layer (if present):
Hydric Soils Present? Yes No
Type:
Depth (inches):
Remarks:
HYDROLOGY Wetland Hydrology Indicators: Primary Indicators (minimum of one required; check all that apply) Secondary Indicators (2 or more required)
Surface Water (A1) Water-Stained Leaves (B9) Water-Stained Leaves (B9)
High Water Table (A2) (except MLRA 1, 2, 4A, and 4B) (MLRA 1, 2, 4A, and 4B) Saturation (A3) Salt Crust (B11) Drainage Patterns (B10)
Water Marks (B1) Aquatic Invertebrates (B13) Dry-Season Water Table (C2)
Sediment Deposits (B2) Hydrogen Sulfide Odor (C1) Saturation Visible on Aerial Imagery (C9)
Drift Deposits (B3) Oxidized Rhizospheres along Living Roots (C3) Geomorphic Position (D2)
Algal Mat or Crust (B4) Presence of Reduced Iron (C4) Shallow Aquitard (D3)
Iron Deposits (B5) Recent Iron Reduction in Tilled Soils (C6) FAC-Neutral Test (D5)
Surface Soil Cracks (B6) Stunted or Stresses Plants (D1) (LRR A) Raised Ant Mounds (D6) (LRR A) Inundation Visible on Aerial Imagery (B7) Other (Explain in Remarks) Frost-Heave Hummocks (D7)
Sparsely Vegetated Concave Surface (B8)
Field Observations:
Surface Water Present? Yes No Depth (inches): Wetland Hydrology Present?
Yes
No
Water Table Present? Yes No Depth (inches):
Saturation Present? (includes capillary fringe) Yes No Depth (inches):
Describe Recorded Data (stream gauge, monitoring well, aerial photos, previous inspections), if available: Remarks: - low point in mowed yard
- after a prior week of rains and snow, soils damp but no evidence of water gathering on this NW parcel
Project Site: Garbarino Property 10042 136th Ave NE, Redmond
Attachment 10
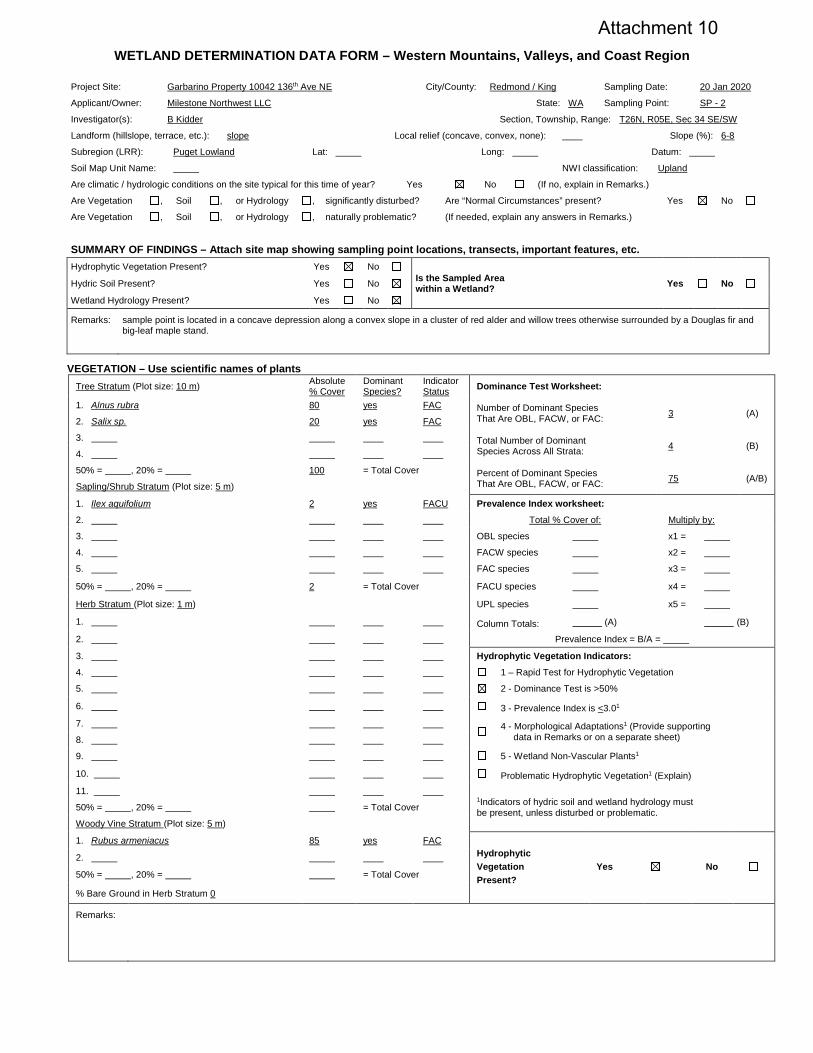
WETLAND DETERMINATION DATA FORM – Western Mountains, Valleys, and Coast Region
VEGETATION – Use scientific names of plants Tree Stratum (Plot size: 10 m) Absolute
% Cover Dominant Species?
Indicator Status Dominance Test Worksheet:
1. Alnus rubra 80 yes FAC Number of Dominant Species That Are OBL, FACW, or FAC: 3 (A)
2. Salix sp. 20 yes FAC
3. Total Number of Dominant Species Across All Strata: 4 (B)
4.
50% = , 20% = 100 = Total Cover Percent of Dominant Species That Are OBL, FACW, or FAC: 75 (A/B)
Sapling/Shrub Stratum (Plot size: 5 m)
1. Ilex aquifolium 2 yes FACU Prevalence Index worksheet:
2. Total % Cover of: Multiply by:
3. OBL species x1 =
4. FACW species x2 =
5. FAC species x3 =
50% = , 20% = 2 = Total Cover FACU species x4 =
Herb Stratum (Plot size: 1 m) UPL species x5 =
1. Column Totals: (A) (B)
2. Prevalence Index = B/A =
3. Hydrophytic Vegetation Indicators: 4. 1 – Rapid Test for Hydrophytic Vegetation
5. 2 - Dominance Test is >50%
6. 3 - Prevalence Index is <3.01 7.
4 - Morphological Adaptations1 (Provide supporting data in Remarks or on a separate sheet) 8.
9. 5 - Wetland Non-Vascular Plants1
10. Problematic Hydrophytic Vegetation1 (Explain) 11.
1Indicators of hydric soil and wetland hydrology must be present, unless disturbed or problematic. 50% = , 20% = = Total Cover
Woody Vine Stratum (Plot size: 5 m)
1. Rubus armeniacus 85 yes FAC Hydrophytic Vegetation Present?
Yes No 2.
50% = , 20% = = Total Cover
% Bare Ground in Herb Stratum 0
Remarks:
Project Site: Garbarino Property 10042 136th Ave NE City/County: Redmond / King Sampling Date: 20 Jan 2020
Applicant/Owner: Milestone Northwest LLC State: WA Sampling Point: SP - 2
Investigator(s): B Kidder Section, Township, Range: T26N, R05E, Sec 34 SE/SW
Landform (hillslope, terrace, etc.): slope Local relief (concave, convex, none): Slope (%): 6-8
Subregion (LRR): Puget Lowland Lat: Long: Datum:
Soil Map Unit Name: NWI classification: Upland
Are climatic / hydrologic conditions on the site typical for this time of year? Yes No (If no, explain in Remarks.)
Are Vegetation , Soil , or Hydrology , significantly disturbed? Are “Normal Circumstances” present? Yes No
Are Vegetation , Soil , or Hydrology , naturally problematic? (If needed, explain any answers in Remarks.)
SUMMARY OF FINDINGS – Attach site map showing sampling point locations, transects, important features, etc. Hydrophytic Vegetation Present? Yes No
Is the Sampled Area within a Wetland? Yes No Hydric Soil Present? Yes No
Wetland Hydrology Present? Yes No
Remarks:
sample point is located in a concave depression along a convex slope in a cluster of red alder and willow trees otherwise surrounded by a Douglas fir and big-leaf maple stand.
Attachment 10
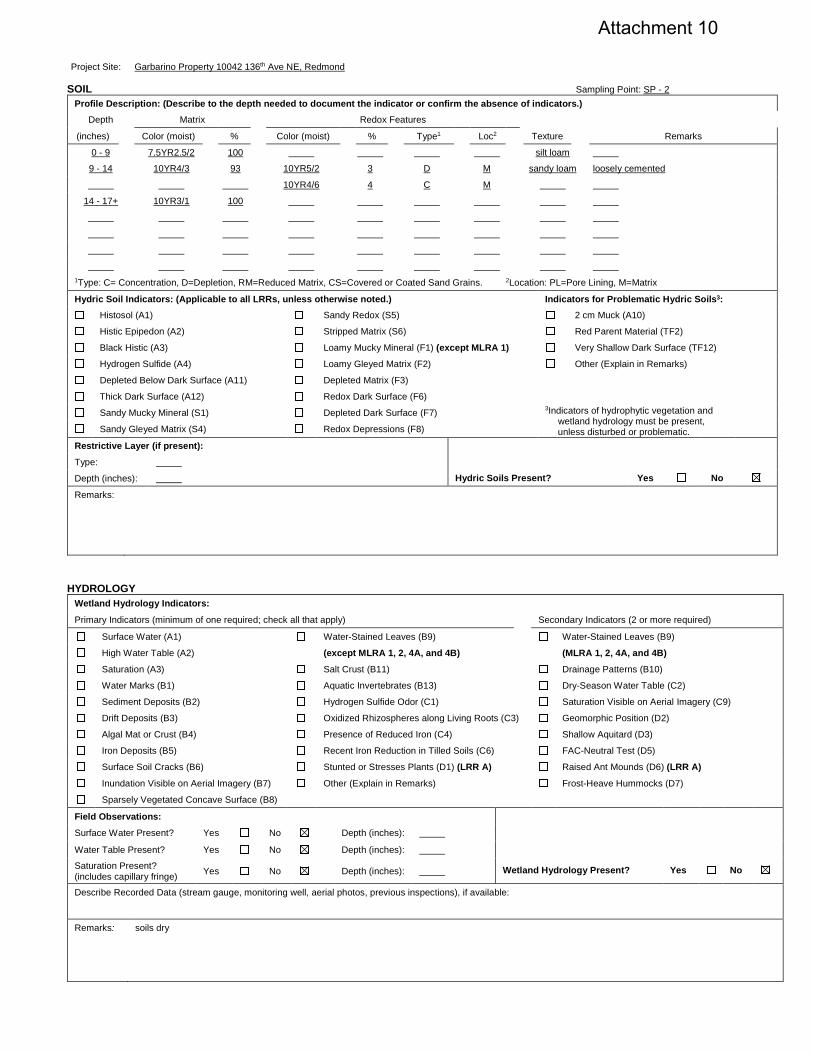
SOIL Sampling Point: SP - 2 Profile Description: (Describe to the depth needed to document the indicator or confirm the absence of indicators.)
Depth Matrix Redox Features
(inches) Color (moist) % Color (moist) % Type1 Loc2 Texture Remarks
0 - 9 7.5YR2.5/2 100 silt loam
9 - 14 10YR4/3 93 10YR5/2 3 D M sandy loam loosely cemented
10YR4/6 4 C M
14 - 17+ 10YR3/1 100
1Type: C= Concentration, D=Depletion, RM=Reduced Matrix, CS=Covered or Coated Sand Grains. 2Location: PL=Pore Lining, M=Matrix
Hydric Soil Indicators: (Applicable to all LRRs, unless otherwise noted.) Indicators for Problematic Hydric Soils3: Histosol (A1) Sandy Redox (S5) 2 cm Muck (A10)
Histic Epipedon (A2) Stripped Matrix (S6) Red Parent Material (TF2)
Black Histic (A3) Loamy Mucky Mineral (F1) (except MLRA 1) Very Shallow Dark Surface (TF12)
Hydrogen Sulfide (A4) Loamy Gleyed Matrix (F2) Other (Explain in Remarks)
Depleted Below Dark Surface (A11) Depleted Matrix (F3)
3Indicators of hydrophytic vegetation and wetland hydrology must be present, unless disturbed or problematic.
Thick Dark Surface (A12) Redox Dark Surface (F6)
Sandy Mucky Mineral (S1) Depleted Dark Surface (F7)
Sandy Gleyed Matrix (S4) Redox Depressions (F8)
Restrictive Layer (if present):
Hydric Soils Present? Yes No
Type:
Depth (inches):
Remarks:
HYDROLOGY Wetland Hydrology Indicators: Primary Indicators (minimum of one required; check all that apply) Secondary Indicators (2 or more required)
Surface Water (A1) Water-Stained Leaves (B9) Water-Stained Leaves (B9)
High Water Table (A2) (except MLRA 1, 2, 4A, and 4B) (MLRA 1, 2, 4A, and 4B) Saturation (A3) Salt Crust (B11) Drainage Patterns (B10)
Water Marks (B1) Aquatic Invertebrates (B13) Dry-Season Water Table (C2)
Sediment Deposits (B2) Hydrogen Sulfide Odor (C1) Saturation Visible on Aerial Imagery (C9)
Drift Deposits (B3) Oxidized Rhizospheres along Living Roots (C3) Geomorphic Position (D2)
Algal Mat or Crust (B4) Presence of Reduced Iron (C4) Shallow Aquitard (D3)
Iron Deposits (B5) Recent Iron Reduction in Tilled Soils (C6) FAC-Neutral Test (D5)
Surface Soil Cracks (B6) Stunted or Stresses Plants (D1) (LRR A) Raised Ant Mounds (D6) (LRR A) Inundation Visible on Aerial Imagery (B7) Other (Explain in Remarks) Frost-Heave Hummocks (D7)
Sparsely Vegetated Concave Surface (B8)
Field Observations:
Surface Water Present? Yes No Depth (inches): Wetland Hydrology Present?
Yes
No
Water Table Present? Yes No Depth (inches):
Saturation Present? (includes capillary fringe) Yes No Depth (inches):
Describe Recorded Data (stream gauge, monitoring well, aerial photos, previous inspections), if available: Remarks: soils dry
Project Site: Garbarino Property 10042 136th Ave NE, Redmond
Attachment 10