summary report 2014-2015 - portal.ct.gov · expressing high-level agreement with survey item 10....
TRANSCRIPT

Connecticut Special Education Parent Survey
Summary Report 2014-2015
PREPARED BY: GLEN MARTIN ASSOCIATES 41 STATE STREET, SUITE 604-02
ALBANY, NY 12207

CONTENTS
Executive Summary .................................................................................................................................................................. i
Introduction ............................................................................................................................................................................... 1
Section I: Survey Development & Dissemination ....................................................................................................... 2
Section II: Survey Delivery & Response Rate ............................................................................................................... 5
Section III: Summary of Survey Responses ................................................................................................................... 7
Section IV: Parent Comments ........................................................................................................................................... 12
Section V: Differences by Demographics ..................................................................................................................... 23
Section VI: Differences by Survey Year ......................................................................................................................... 32
Appendix A: Parent Survey Cohorts .............................................................................................................................. 35
Appendix B: Parent Survey Documents ....................................................................................................................... 37
Appendix C: Survey Delivery & Response Rate ......................................................................................................... 41
Appendix D: Methodological & Data Limitations ..................................................................................................... 44
Appendix E: Survey Responses ........................................................................................................................................ 51
Appendix E.1: Overall Survey Response Table ..................................................................................................... 52
Appendix E.2: Summary of Survey Agreement .................................................................................................... 54
Appendix F: Survey Responses by Child Demographics ....................................................................................... 57
Appendix F.1: Primary Eligibility for Services ...................................................................................................... 59
Appendix F.2: Age ............................................................................................................................................................. 63
Appendix F.3: Race/Ethnicity ...................................................................................................................................... 66
Appendix F.4 Eligibility for Free and Reduced Price Lunch (FRPL) ............................................................ 69
Appendix F.5: English Learner (EL) Status ............................................................................................................ 71
Appendix F.6: Gender ...................................................................................................................................................... 73
Appendix G: Survey Response by Year ......................................................................................................................... 75

~ i ~
EXECUTIVE SUMMARY
Introduction In summer 2015, the Connecticut State Department of Education (CSDE) Bureau of Special Education conducted a statewide survey of parents of students receiving special education services, ages 3 through 21. The statewide survey is the continuation of an ongoing collaborative effort between the Bureau of Special Education and the Connecticut Parent Work Group to collect information on family satisfaction and parents’ involvement in their child’s special education program. The survey also serves as the chief instrument for collecting parent involvement data for Indicator 8 of the state’s IDEA Part B State Performance Plan (SPP). The survey is in its tenth year, with the 2014-15 survey marking the first year of a new three-year cohort cycle. Survey Design and Distribution The parent survey questionnaire includes 38 items related to parents’ experience with their child’s special education program. Respondents are asked to answer based on their experiences over the past 12 months on a 6-point Likert scale ranging from “strongly agree” to “strongly disagree.” The questionnaire also includes one open-ended item regarding parents’ overall experiences with their child’s special education program and one demographic item asking parents to identify their child’s primary disability. The 2014-15 survey was mailed to a total of 18,634 parents of children receiving special education services across 56 school districts. The survey was also emailed to parents with available email addresses, roughly three in five (58.5%) parents. Overall, 3,965 surveys were returned for a response rate of 21.3%, with slightly more surveys completed on paper than online (55.7% compared to 44.3%). Key Findings Key findings of the 2014-2015 parent survey are presented for: SPP Indicator 8; areas of
strength; areas for improvement; and parents’ comments. SPP Indicator 8 The CSDE is required to report in its annual submission of the SPP evidence of school districts’ efforts to facilitate parent involvement in the area of special education. Survey item 10 is used as the primary measure of this effort.
Total Agreement: The majority (88.1%) of survey respondents agreed that administrators and teachers in their child’s school encourage parent involvement in order to improve services and results for children with disabilities [Q10]. This exceeded the state’s FFY 2014 target of 87.5%.
High-Level Agreement: The CSDE also elected to set an additional local monitoring target of 77.0% for high-level agreement (i.e., moderately + strongly). This target was not met, with 74.8% of parents expressing high-level agreement with survey item 10.
Areas of Strength In general, agreement levels across the survey were high, with more than 85.0% of parents agreeing with 24 of the 38 (63.2%) items.
General Satisfaction: The majority (87.5%) of survey respondents agreed they are satisfied with their child’s overall special education program [Q1]. Similar percentages of parents agreed their child’s IEP is meeting his or her educational needs [Q4] and all special education services identified in their child’s IEP have been provided [Q5] (85.5% and 87.4%, respectively).
Child Participation: When asked if their child has the opportunity to participate in school-sponsored activities [Q23], 95.3% of parents agreed and 81.5% of these parents strongly agreed. This was the most to strongly agree with any item on the survey. In addition, 90.0% of parents of students 15

~ ii ~
years of age or older agreed that the school district actively encourages their child to participate in PPT meetings [Q36].
Child Acceptance: When asked if their child is accepted within the school community [Q3], 91.7% of parents agreed and 60.0% strongly agreed.
Parents as Partners: Over 90.0% of parents indicated they have the opportunity to talk to their child’s teachers on a regular basis to discuss their questions and concerns [Q2] and are encouraged to give input and express their concerns at IEP meetings [Q11]. In addition, 90.0% of parents agreed their concerns and recommendations are documented in the development of their child’s IEP [Q13] and a similar percentage (88.8%) agreed they are encouraged to be an equal partner with their child’s teachers and other service providers in the implementation of their child’s IEP [Q17].
Parent-Friendly Materials and Processes: Over 95.0% of parents agreed they understand what is discussed at meetings to develop their child’s IEP [Q12]. This was the highest rated item on the survey. In addition, more than 90.0% of parents agreed their child’s evaluation report is written in terms they understand [Q14], PPT meetings have been scheduled at times and places that met their needs [Q15], and they have received a copy of their child’s IEP within 10 school days [Q18].
Areas for Improvement A few areas for improvement as indicated by relatively lower levels of agreement included the following topics:
Support for Extracurricular Activities: When asked if the school provides supports, such as the extra staff that are necessary for their child to participate in extracurricular activities [Q25], a much smaller majority (59.5%) agreed and one-quarter (25.0%) indicated that they did not know if such supports are available.
Parent Training: Roughly two in five (39.7%) parents indicated they attended parent training or information sessions that
addressed the needs of parents and of children with disabilities in the past year [Q26]. A similar percentage (39.8%) agreed that such opportunities are provided by their child’s school district [Q28], while almost one-third (32.2%) of parents did not know whether such opportunities exist.
Parent Support: Similarly, less than one-third (32.2%) of parents agreed when asked if they are involved in a support network for parents of students with disabilities [Q27], and 39.4% agreed a support network is available [Q29]. A sizeable percentage (36.2%) of parents did not know if such a network is available.
Transition to Adulthood: Fewer than three-quarters (72.8%) of parents of students 15 years of age or older agreed that the PPT introduced planning for their child’s transition to adulthood [Q35] and 73.5% agreed that the PPT developed individualized goals for their child related to employment/ postsecondary education, independent living, and community participation [Q38]. In addition, just over one-half (50.5%) of these parents agreed that outside agencies have been invited to participate in secondary transition planning [Q34] and 26.9% did not know whether this had occurred.
Parents’ Comments An open-ended comment section was included at the end of the survey to allow respondents to comment on their overall experiences with their child’s special education program. Of the surveys received, 38.4% (n=1,522) included written comments. Parents’ comments were distributed along a continuum where 31.5% expressed complete satisfaction, 29.5% expressed complete dissatisfaction, and 39.0% fell in the middle (expressing areas of both satisfaction and dissatisfaction).
Complete Satisfaction: Parents in this category often discussed general approval for their child’s educators and their child’s special education program. These parents also frequently discussed satisfaction with how their school district encourages parent involvement and communication. This

~ iii ~
included having input in their child’s education plans; positive and open communication with their child’s classroom teachers; and an overall feeling of being an equal partner in their child’s education.
Complete Dissatisfaction: Parents in this category also frequently mentioned parent involvement and communication but these parents felt they were not heard at PPT meetings, did not feel like an equal partner in the development of their child’s IEP, and did not feel like a true member of their child’s team. These parents also frequently expressed concerns related to the appropriateness of their child’s services and the implementation of their child’s IEP.
Summary This report presents summary data reflecting the broad views and opinions of parents of students with disabilities. Its purpose is to offer stakeholders the opportunity to review results of the statewide survey in the context of other data sources. District-level parent survey data were presented in supplemental individual reports which can be found on the CSDE website.

~ 1 ~
INTRODUCTION
In summer 2015, the Connecticut State Department of Education (CSDE) Bureau of Special Education conducted a statewide survey of parent of students receiving special education services, ages 3 through 21. The statewide survey is the continuation of an ongoing collaborative effort between the Bureau of Special Education and the Connecticut Parent Work Group to collect information on family satisfaction and parents’ involvement in their child’s special education program. The survey also serves as the chief instrument for collecting parent involvement data for Indicator 8 of the state’s IDEA Part B State Performance Plan. It is in its tenth year, with the 2014-15 survey marking the first year of a new three-year cohort cycle. This report summarizes findings from the 2014-15 survey and is organized into six sections.1 Section I presents an overview of survey development and dissemination, including a brief description of the survey design and the sampling methodology employed. Section II includes information on the survey delivery and response rate, as well as the demographics of survey respondents. Lastly, Sections III-VI provide a summary of overall responses, a summary of parents’ comments, differences by demographics, and differences across survey years.
1 District-level parent survey reports are provided to districts with 20 or more survey responses (45 of the 56 districts in this year’s survey cycle). The reports are available on the CSDE website at bit.ly/Ind8ctlea1415.
~ 2 ~
SURVEY DEVELOPMENT & DISSEMINATION Section I
Background In 2005, the U.S. Department of Education, Office of Special Education Programs (OSEP) mandated all states submit a six-year State Performance Plan (SPP) to evaluate states’ efforts to implement the requirements of the Individuals with Disabilities Education Improvement Act (IDEA). The SPP required each state to establish data sources and targets for 20 indicators, including Indicator 8: percent of parents with a child receiving special education services who report that schools facilitated parent involvement as a means of improving services and results for children with disabilities. In order to report on Indicator 8, the Connecticut State Department of Education (CSDE) implemented a six-year cycle to collect family outcome data using a statewide parent survey previously developed by the CSDE and the Parent Work Group.2 Survey data were collected from an initial sample of 21 districts in 2005-06, followed by a sample of approximately 30 districts per year thereafter. The six-year cycle was repeated once, continuing for a total of nine years. In 2014, distribution of the survey was changed to a three-year cycle, thus almost doubling the number of districts surveyed each year, beginning with the 2014-15 school year. The change was done as part of the state’s transition to a new six-year OSEP SPP directive, which reduced the total number of indicators to 17, and requires each state to develop, implement, and evaluate a State Systemic Improvement Plan to improve educational outcomes for students with disabilities.3 As part of this transition, and in consultation with survey recommendations from the Parent Work Group, the CSDE elected to reset the survey distribution cycle to align with its Focused Monitoring System.4 The reset was intended to facilitate a more timely and more frequent review of parent survey data, both as part of the CSDE’s compliance monitoring and program improvement activities, and as part of districts’ own local data review processes.
Sampling Design The sampling design for the new three-year cycle includes two stages. In the first stage, and as part of the CSDE’s special education monitoring cycle, each of the state’s 170 school districts were assigned to one of three cohorts. (See Appendix A for a list of districts in each cohort.) The cohorts include a statewide representative sample of districts, with connected “feeder” elementary districts and “receiver” secondary districts incorporated into the same year’s cycle.5 In the second stage, the overall number of parents of children with an Individualized Education Program (IEP) or Services Plan in each district was assessed to determine if all parents (i.e., a census) or a simple random sample of parents should be included in the survey distribution. In most districts (four out of five districts statewide), the sampling calculations showed that surveys should be sent to all parents of children with an IEP or Services Plan. 6
2 The Parent Work Group is a statewide stakeholder group that examines parent involvement data as an indicator of parent satisfaction for annual reporting to the OSEP. It includes parents of students with disabilities; representatives from state and local agencies who serve parents and students with disabilities, including the state’s Parent Training and Information Center; local school district leaders; and legal advocates for parents of students with disabilities, including a surrogate parent and legal organization representative.
3 OSEP’s new six-year SPP information collection period is from FFY 2013 through FFY 2018.
4 The CSDE’s Focused Monitoring System, managed by the Bureau of Special Education, monitors procedural compliance with the IDEA while providing support and technical assistance to LEAs toward their efforts to educate students with disabilities.
5 Connecticut State Department of Education (2015). Part B State Systemic Improvement Plan SPP/APR Report Indicator 17, Phase One. Retrieved from http://www.sde.ct.gov/sde/lib/sde/pdf/deps/special/ct_partb_ssip_phase1_report.pdf. 6 The number of parents selected was calculated using a 95.0% confidence level and a margin of error of 2.0%.
~ 3 ~
Survey Design The Connecticut Special Education Parent Survey questionnaire includes 38 items related to parents’ experience with their child’s special education program. Respondents are asked to answer based on their experiences over the past 12 months on a 6-point Likert scale ranging from “strongly agree” to “strongly disagree.” The response option “don’t know” is available on 11 items that request factual information. Survey item 10, “In my child’s school, administrators and teachers encourage parent involvement in order to improve services and results for children with disabilities” is used as the primary measure for SPP Indicator 8. The questionnaire also includes one open-ended item regarding parents’ overall experiences with special education (i.e., not limited to the past year) and one demographic item asking parents to identify their child’s primary disability.
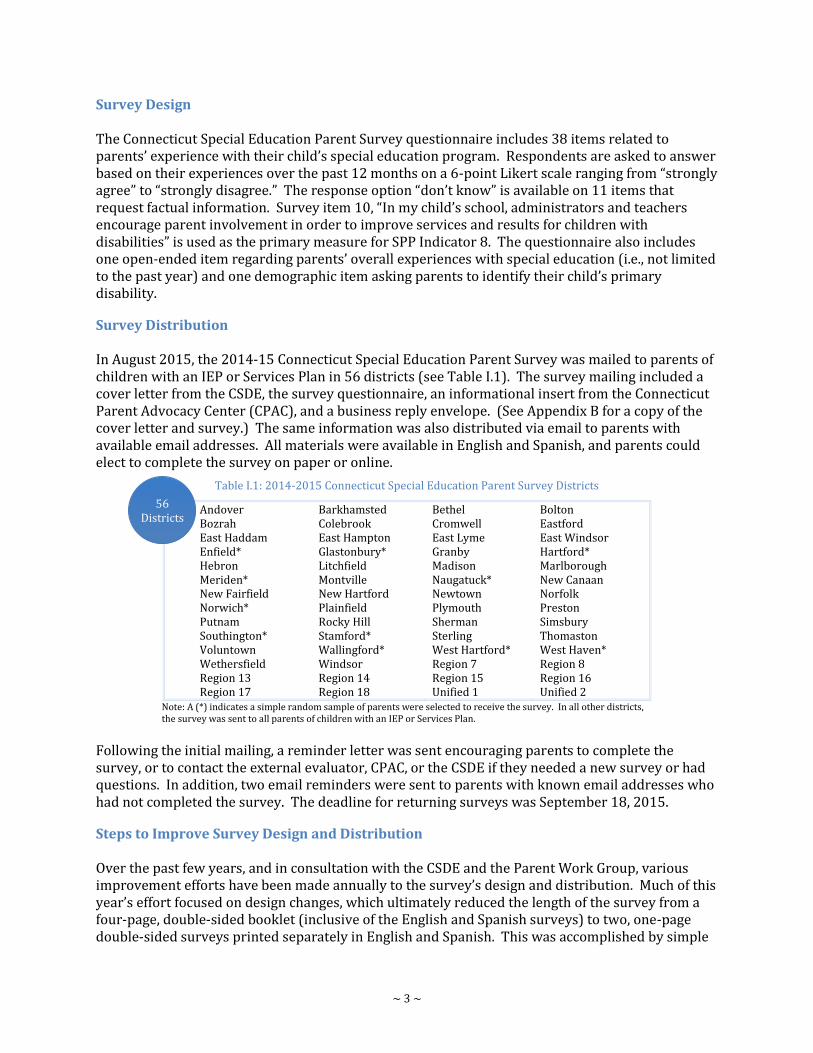
Survey Distribution In August 2015, the 2014-15 Connecticut Special Education Parent Survey was mailed to parents of children with an IEP or Services Plan in 56 districts (see Table I.1). The survey mailing included a cover letter from the CSDE, the survey questionnaire, an informational insert from the Connecticut Parent Advocacy Center (CPAC), and a business reply envelope. (See Appendix B for a copy of the cover letter and survey.) The same information was also distributed via email to parents with available email addresses. All materials were available in English and Spanish, and parents could elect to complete the survey on paper or online.
Table I.1: 2014-2015 Connecticut Special Education Parent Survey Districts
Andover Bozrah East Haddam Enfield* Hebron Meriden* New Fairfield Norwich* Putnam Southington* Voluntown Wethersfield Region 13 Region 17
Barkhamsted Colebrook East Hampton Glastonbury* Litchfield Montville New Hartford Plainfield Rocky Hill Stamford* Wallingford* Windsor Region 14 Region 18
Bethel Cromwell East Lyme Granby Madison Naugatuck* Newtown Plymouth Sherman Sterling West Hartford* Region 7 Region 15 Unified 1
Bolton Eastford East Windsor Hartford* Marlborough New Canaan Norfolk Preston Simsbury Thomaston West Haven* Region 8 Region 16 Unified 2
Note: A (*) indicates a simple random sample of parents were selected to receive the survey. In all other districts, the survey was sent to all parents of children with an IEP or Services Plan.
Following the initial mailing, a reminder letter was sent encouraging parents to complete the survey, or to contact the external evaluator, CPAC, or the CSDE if they needed a new survey or had questions. In addition, two email reminders were sent to parents with known email addresses who had not completed the survey. The deadline for returning surveys was September 18, 2015.
Steps to Improve Survey Design and Distribution Over the past few years, and in consultation with the CSDE and the Parent Work Group, various improvement efforts have been made annually to the survey’s design and distribution. Much of this year’s effort focused on design changes, which ultimately reduced the length of the survey from a four-page, double-sided booklet (inclusive of the English and Spanish surveys) to two, one-page double-sided surveys printed separately in English and Spanish. This was accomplished by simple
56 Districts

~ 4 ~
formatting changes (i.e., smaller font size); removing unnecessary demographic items7; removing “not applicable” as a response option; and eliminating two survey items that were known to be confusing to parents8. Efforts to improve the survey distribution process were mostly the same as in the prior year. This included providing all districts with an Excel file of state-assigned student identifiers (SASIDs) for special education students in their district and asking them to return the files with current mailing and email addresses for each student. All but four of the 56 districts provided emails for some or all parents, thus facilitating electronic distribution of the survey.
Confidentiality The external evaluation team has worked closely with the CSDE and the Parent Work Group since the first year of the annual statewide survey to ensure the confidentiality of all student level data. Student names, mailing addresses, and email addresses (when available) are provided to the external evaluator, and a unique confidential identification number is assigned to each child. This confidential system ensures non-duplicative completion of the survey (i.e., paper versus online, duplicate online submissions, etc.). It also facilitates the reporting of district-level data, while ensuring that no parent can be linked to his or her survey response. District-level survey results are only published for districts with 20 or more survey responses.
Strengths and Limitations The audience for this report includes parents, district personnel, CSDE staff and other stakeholders interested in special education outcomes in Connecticut. Its purpose is to provide an informative summary of the broad views and opinions of a select group of parents of children with disabilities. The data presented offers stakeholders the opportunity to generate hypotheses and explore potential causal relationships that could be compared with results from other data sources. The report is not meant to be a technical report and does not include a comprehensive statistical analysis of the survey data. As such, caution should be used in making inferences about the statewide special education population. (Further discussion regarding the representativeness of the sample, non-response bias, and measurement error is provided in Appendix D.)
7 Child demographic data previously asked about on the survey (gender, age, race/ethnicity, and disability) were provided directly from the CSDE Bureau of Data Collection, Research, and Evaluation. Parents were still asked to identify their child’s primary disability, as the CSDE is interested in differences between parents’ response and the disability on file with the state (see Appendix D).
8 The two deleted items were: “My child’s school day has been shortened to accommodate his/her transportation needs” and “My child has been denied access to non-school sponsored community activities due to his/her disability”.

~ 5 ~
SURVEY DELIVERY & RESPONSE RATE Section II
The 2014-2015 survey was distributed to 18,634 parents of children receiving special education services in 56 districts (see Figure II.1). The survey was mailed to all parents and was also emailed to parents with available email addresses, roughly three in five (58.5%) parents. The overall survey response rate was 21.3%, with slightly more surveys completed on paper than online, 55.7% compared to 44.3%. (See Appendix C for survey delivery and response rate statistics by district.)
Figure II.1: Delivery Method and Response Rate
DELIVERY METHOD
Mail 18,634 Also Emailed 58.5% (n=10,902)
Returned Non-Deliverable 4.8% (n=895) Returned as Bounced Email 7.7% (n=836)
RESPONSE RATE
Completed on Paper 55.7% (n=2,207)
Completed in English 96.6% (n=3,832)
Completed with Comments 38.4% (n=1,522)
Figure II.2 below (and on the following page) compares the demographics of children of survey respondents to the demographics of children of all intended survey recipients. As can be seen, the largest difference between the two groups occurred with respect to socioeconomic status, with parents of children eligible for free or reduced price lunch substantially under-represented in the respondent group. There were also smaller differences with respect to race/ethnicity and disability, with parents of Hispanic/Latino children, parents of Black or African American children, and parents of children with a specific learning disability all slightly under-represented in the respondent group.
Figure II.2: Child Demographics of Survey Respondents and Surveys Sent
CHILD DEMOGRAPHICS
Survey Respondents (n=3,965) Surveys Sent (n=18,634)
Figure is continued on the next page.
21.3%
31%
69%
Female
Male
33%
67%
14%
49%
15%
18%
4%
3-5 years
6-12 years
13-14 years
15-17 years
18-21 years
12%
45%
15%
22%
6%
70%
15%
8%
4%
2%
1%
White
Hispanic/Latino of any Race
Black or African American
Asian
Two or More Races
Other
61%
20%
13%
3%
3%
0%
3,965 completed

~ 6 ~
Figure II.2: Child Demographics of Survey Respondents and Surveys Sent
CHILD DEMOGRAPHICS
Survey Respondents (n=3,965) Surveys Sent (n=18,634)
CHILD DISABILITY
Note: The disability categories of deaf-blindness, traumatic brain injury, and hearing, visual, and orthopedic impairment are not displayed in the charts due to the small percentages (1% or less) of children in these categories.
26% Free & Reduced Price Lunch 41%
5% English Learner 7%
26%
17%
16%
12%
7%
7%
5%
4%
3%
Specific Learning Disabilities
Autism
Speech or Language Impaired
OHI - ADD/ADHD
Other Health Impairment (OHI)
Developmental Delay
Multiple Disabilities
Emotional Disturbance
Intellectual Disability
31%
12%
16%
13%
6%
6%
5%
7%
3%
~ 7 ~
SUMMARY OF SURVEY RESPONSES Section III
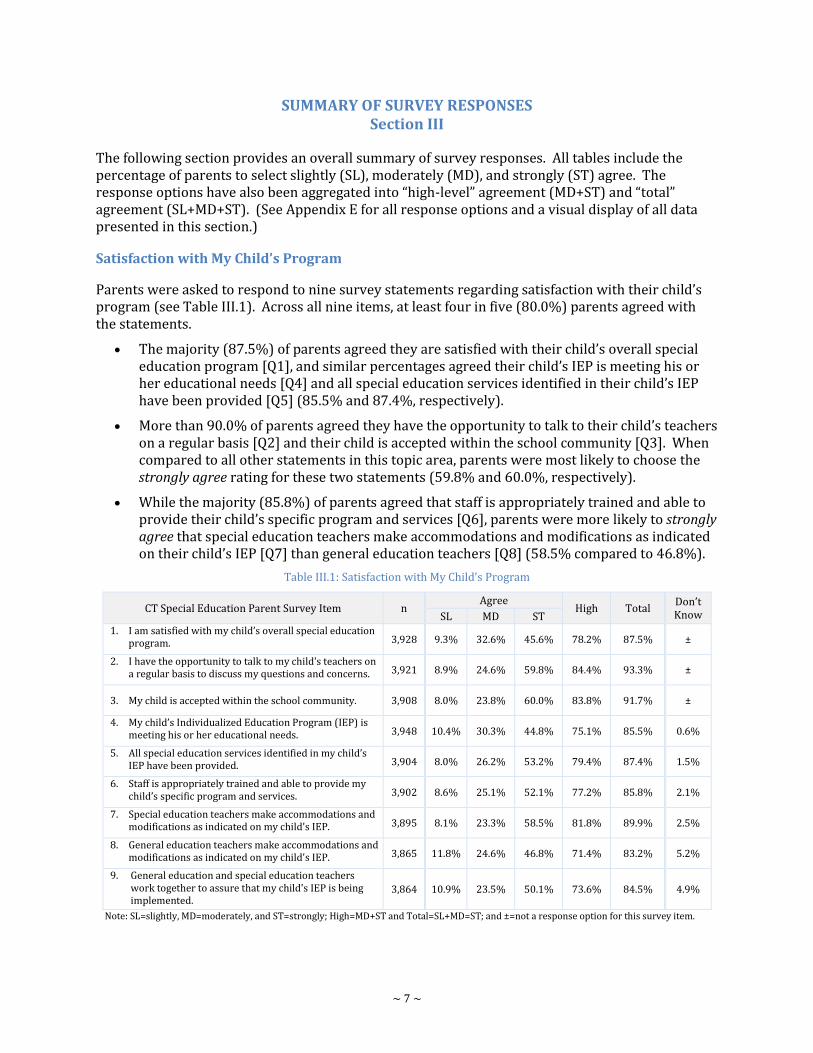
The following section provides an overall summary of survey responses. All tables include the percentage of parents to select slightly (SL), moderately (MD), and strongly (ST) agree. The response options have also been aggregated into “high-level” agreement (MD+ST) and “total” agreement (SL+MD+ST). (See Appendix E for all response options and a visual display of all data presented in this section.)
Satisfaction with My Child’s Program
Parents were asked to respond to nine survey statements regarding satisfaction with their child’s program (see Table III.1). Across all nine items, at least four in five (80.0%) parents agreed with the statements.
The majority (87.5%) of parents agreed they are satisfied with their child’s overall special education program [Q1], and similar percentages agreed their child’s IEP is meeting his or her educational needs [Q4] and all special education services identified in their child’s IEP have been provided [Q5] (85.5% and 87.4%, respectively).
More than 90.0% of parents agreed they have the opportunity to talk to their child’s teachers on a regular basis [Q2] and their child is accepted within the school community [Q3]. When compared to all other statements in this topic area, parents were most likely to choose the strongly agree rating for these two statements (59.8% and 60.0%, respectively).
While the majority (85.8%) of parents agreed that staff is appropriately trained and able to provide their child’s specific program and services [Q6], parents were more likely to strongly agree that special education teachers make accommodations and modifications as indicated on their child’s IEP [Q7] than general education teachers [Q8] (58.5% compared to 46.8%).
Table III.1: Satisfaction with My Child’s Program
CT Special Education Parent Survey Item n Agree
High Total Don’t Know SL MD ST
1. I am satisfied with my child’s overall special education program. 3,928 9.3% 32.6% 45.6% 78.2% 87.5% ±
2. I have the opportunity to talk to my child's teachers on a regular basis to discuss my questions and concerns. 3,921 8.9% 24.6% 59.8% 84.4% 93.3% ±
3. My child is accepted within the school community. 3,908 8.0% 23.8% 60.0% 83.8% 91.7% ±
4. My child’s Individualized Education Program (IEP) is meeting his or her educational needs. 3,948 10.4% 30.3% 44.8% 75.1% 85.5% 0.6%
5. All special education services identified in my child’s IEP have been provided. 3,904 8.0% 26.2% 53.2% 79.4% 87.4% 1.5%
6. Staff is appropriately trained and able to provide my child’s specific program and services. 3,902 8.6% 25.1% 52.1% 77.2% 85.8% 2.1%
7. Special education teachers make accommodations and modifications as indicated on my child's IEP. 3,895 8.1% 23.3% 58.5% 81.8% 89.9% 2.5%
8. General education teachers make accommodations and modifications as indicated on my child's IEP. 3,865 11.8% 24.6% 46.8% 71.4% 83.2% 5.2%
9. General education and special education teachers work together to assure that my child's IEP is being implemented.
3,864 10.9% 23.5% 50.1% 73.6% 84.5% 4.9%
Note: SL=slightly, MD=moderately, and ST=strongly; High=MD+ST and Total=SL+MD=ST; and ±=not a response option for this survey item.

~ 8 ~
Participation in Developing and Implementing My Child’s Program As discussed previously, the CSDE is required to report in its annual submission of the State Performance Plan (SPP) evidence of school districts’ efforts to facilitate parent involvement in the area of special education. Survey item 10 (referred to as Indicator 8 in the SPP) is used as the primary measure of this effort (see Table III.2).
The majority (88.1%) of survey respondents agreed that administrators and teachers in their child’s school encourage parent involvement in order to improve services and results for children with disabilities. This exceeded the state’s FFY 2014 target of 87.5%.
The CSDE also elected to set an additional local monitoring target of 77.0% for high-level agreement (i.e. moderately + strongly). This target was not met, with 74.8% of parents expressing high-level agreement.9
Table III.2: State Performance Plan (SPP) Indicator 8
CT Special Education Parent Survey Item n Agree
High Total Don’t Know SL MD ST
10. In my child's school, administrators and teachers encourage parent involvement in order to improve services and results for children with disabilities.
3,940 13.3% 23.5% 51.3% 74.8% 88.1% ±
Note: SL=slightly, MD=moderately, and ST=strongly; High=MD+ST and Total=SL+MD=ST; and ±=not a response option for this survey item.
An additional 11 statements in this topic area of the survey asked parents about the IEP/PPT process, translation services, and their child’s classroom placement. Ninety percent (90.0%) or more of parents agreed with six of the statements and a considerable number (ranging from 50.2% to 76.3%) of parents strongly agreed with all 11 statements (see Table III.3).
The overwhelming majority (95.4%) of parents agreed they understand what is discussed at meetings to develop their child’s IEP [Q12]. This was the largest percentage of parents to agree with any of the survey’s 38 items. In addition, approximately two-thirds (66.8%) of parents strongly agreed with this statement.
The smallest majority of parents to agree with any survey item in this section were the 82.3% of parents who indicated the school district proposed the regular classroom as the first placement option for their child [Q21]; with close to 10.0% of parents indicating they did not know if the regular classroom was the first placement option.
Table III.3: Participation in Developing and Implementing My Child’s Program
CT Special Education Parent Survey Item n Agree
High Total Don’t Know SL MD ST
11. At meetings to develop my child’s Individualized Education Program (IEP), I feel encouraged to give input and express my concerns.
3,920 7.4% 19.3% 64.8% 84.1% 91.5% ±
12. I understand what is discussed at meetings to develop my child’s IEP. 3,914 5.7% 22.8% 66.8% 89.6% 95.4% ±
13. My concerns and recommendations are documented in the development of my child's IEP. 3,892 8.5% 24.0% 57.5% 81.5% 90.0% ±
14. My child's evaluation report is written in terms I understand. 3,892 9.6% 25.8% 56.7% 82.5% 92.1% ±
Note: SL=slightly, MD=moderately, and ST=strongly; High=MD+ST and Total=SL+MD=ST; and ±=not a response option for this survey item. Table is continued on the next page.
9 High-level agreement has been included in the tables and figures throughout this report; however, for ease of reading, these percentages are not discussed in other parts of the narrative.

~ 9 ~
Table III.3: Participation in Developing and Implementing My Child’s Program - continued
CT Special Education Parent Survey Item n Agree
High Total Don’t Know SL MD ST
15. Planning and Placement Team (PPT) meetings for my child have been scheduled at times and places that met my needs.
3,913 6.6% 20.8% 64.9% 85.7% 92.2% ±
16. At my child’s PPT, the school district proposed programs and services to meet my child’s individual needs.
3,935 11.4% 25.8% 50.2% 76.0% 87.4% ±
17. When we implement my child’s IEP, I am encouraged to be an equal partner with my child's teachers and other service providers.
3,901 10.9% 23.4% 54.6% 77.9% 88.8% ±
18. I have received a copy of my child’s IEP within 10 school days after the PPT.
3,897 4.1% 14.0% 76.3% 90.3% 94.4% ±
19. If necessary, a translator was provided at the PPT meetings.
2,339 7.8% 12.6% 66.6% 79.2% 87.0% ±
20. The translation services provided at the PPT meetings were useful and accurate. 2,192 8.9% 14.6% 62.6% 77.2% 86.2% ±
21. The school district proposed the regular classroom for my child as the first placement option. 3,830 4.3% 15.0% 63.1% 78.1% 82.3% 8.1%
Note: SL=slightly, MD=moderately, and ST=strongly; High=MD+ST and Total=SL+MD=ST; and ±=not a response option for this survey item.
My Child’s Participation Parents were next asked to respond to statements concerning their child’s participation in school activities (see Table III.4). Compared to the topic areas discussed thus far, there was more variability in parent responses across these four items.
The overwhelming majority (95.3%) of parents agreed their child has the opportunity to participate in school-sponsored activities [Q23]. In addition, 81.5% of parents strongly agreed – the most to strongly agree with any item on the survey.
However, when asked if their child’s school provides supports, such as the extra staff that are necessary for their child to participate in extracurricular school activities [Q25], a much smaller majority (59.5%) agreed. In addition, one-quarter (25.0%) of parents did not know if such supports are available for their child.
Table III.4: My Child’s Participation
CT Special Education Parent Survey Item n Agree
High Total Don’t Know SL MD ST
22. My child has been sent home from school, but not suspended, due to behavioral difficulties. 3,312 3.2% 4.5% 10.3% 14.9% 18.1% ±
23. My child has the opportunity to participate in school-sponsored activities such as field trips, assemblies and social events (dances, sports events).
3,882 3.5% 10.3% 81.5% 91.8% 95.3% ±
24. My child has the opportunity to participate in extracurricular school activities such as sports or clubs with children without disabilities.
3,780 5.0% 11.0% 73.6% 84.6% 89.6% ±
25. My child’s school provides supports, such as extra staff, that are necessary for my child to participate in extracurricular school activities (for example, clubs and sports).
3,609 6.8% 12.6% 40.1% 52.7% 59.5% 25.0%
Note: SL=slightly, MD=moderately, and ST=strongly; High=MD+ST and Total=SL+MD=ST; and ±=not a response option for this survey item.

~ 10 ~
Parent Training and Support Parents were asked to respond to a series of four survey statements regarding their experiences with parent training and support. Compared to other areas of the survey, parents were less likely to agree with items in this section, while a considerable percentage indicated they did not know if such opportunities are available (see Table III.5).
When asked if they attended parent training or information sessions that addressed the needs of parents and of children with disabilities [Q26], roughly two in five (39.7%) parents agreed. In addition, just 39.8% of parents agreed that such opportunities are provided by their child’s school district and almost one-third (32.2%) of parents did not know whether such opportunities exist [Q28].
Similarly, less than one-third (32.2%) of parents agreed they are involved in a support network for parents of students with disabilities [Q27] and just 39.4% agreed there is a support network available through their child’s school district [Q29]. A sizeable percentage (36.2%) of parents did not know if such a network is available.
Table III.5: Parent Training and Support
CT Special Education Parent Survey Item n Agree
High Total Don’t Know SL MD ST
26. In the past year, I have attended parent training or information sessions (provided by my district, other districts, or agencies) that addressed the needs of parents and of children with disabilities.
3,502 9.4% 10.3% 20.1% 30.3% 39.7% ±
27. I am involved in a support network for parents of students with disabilities available through my school district or other sources.
3,421 9.2% 8.7% 14.2% 23.0% 32.2% ±
28. There are opportunities for parent training or information sessions regarding special education provided by my child’s school district.
3,753 9.5% 11.9% 18.4% 30.3% 39.8% 32.2%
29. A support network for parents of students with disabilities is available to me through my school district or other sources.
3,700 8.7% 10.5% 20.2% 30.7% 39.4% 36.2%
Note: SL=slightly, MD=moderately, and ST=strongly; High=MD+ST and Total=SL+MD=ST; and ±=not a response option for this survey item. My Child’s Skills This second-to-last section of the survey is comprised of two questions which ask parents whether they think their child is learning skills that will help him or her succeed later in life (see Table II.6).
The majority (86.6%) of respondents agreed their child is learning skills that will enable him/her to be as independent as possible [Q30]. Similarly, 87.1% of respondents agreed their child is learning skills that will lead to a high school diploma, further education, or a job [Q31].
Table III.6: My Child’s Skills
CT Special Education Parent Survey Item n Agree
High Total Don’t Know SL MD ST
30. My child is learning skills that will enable him/her to be as independent as possible. 3,834 10.4% 25.2% 51.0% 76.2% 86.6% ±
31. My child is learning skills that will lead to a high school diploma, further education, or a job. 3,735 10.7% 22.5% 53.8% 76.4% 87.1% ±
Note: SL=slightly, MD=moderately, and ST=strongly; High=MD+ST and Total=SL+MD=ST; and ±=not a response option for this survey item.
~ 11 ~
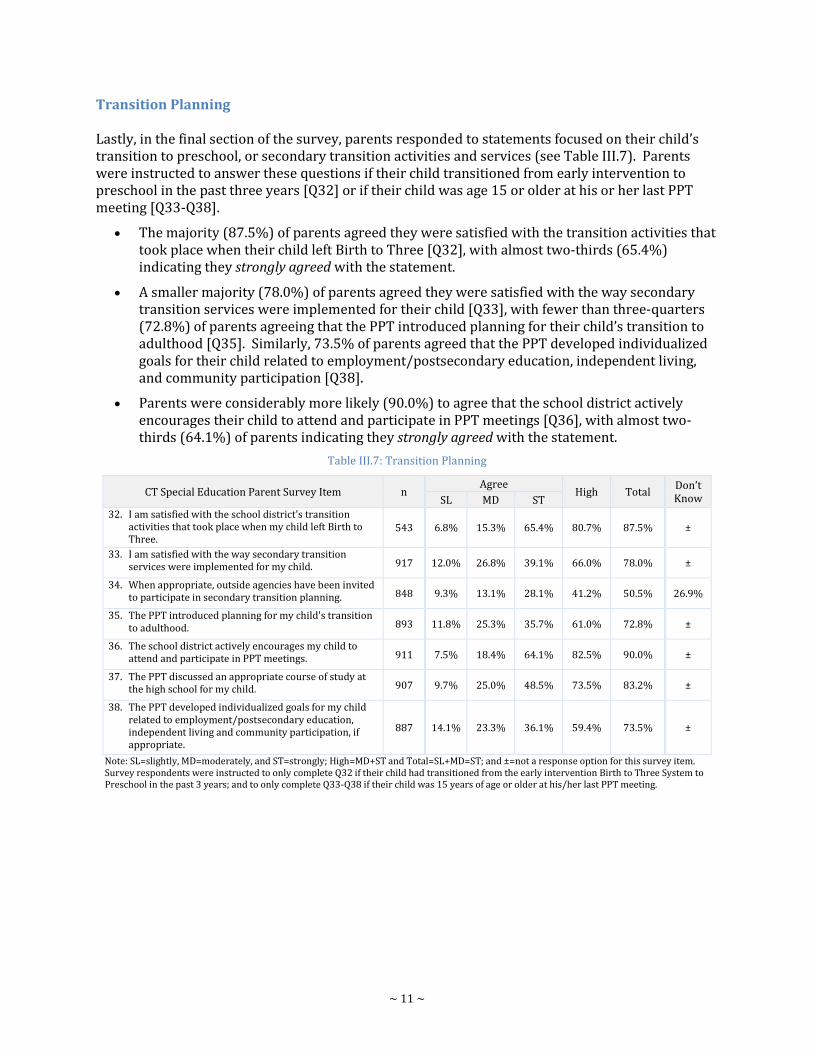
Transition Planning Lastly, in the final section of the survey, parents responded to statements focused on their child’s transition to preschool, or secondary transition activities and services (see Table III.7). Parents were instructed to answer these questions if their child transitioned from early intervention to preschool in the past three years [Q32] or if their child was age 15 or older at his or her last PPT meeting [Q33-Q38].
The majority (87.5%) of parents agreed they were satisfied with the transition activities that took place when their child left Birth to Three [Q32], with almost two-thirds (65.4%) indicating they strongly agreed with the statement.
A smaller majority (78.0%) of parents agreed they were satisfied with the way secondary transition services were implemented for their child [Q33], with fewer than three-quarters (72.8%) of parents agreeing that the PPT introduced planning for their child’s transition to adulthood [Q35]. Similarly, 73.5% of parents agreed that the PPT developed individualized goals for their child related to employment/postsecondary education, independent living, and community participation [Q38].
Parents were considerably more likely (90.0%) to agree that the school district actively encourages their child to attend and participate in PPT meetings [Q36], with almost two-thirds (64.1%) of parents indicating they strongly agreed with the statement.
Table III.7: Transition Planning
CT Special Education Parent Survey Item n Agree
High Total Don’t Know SL MD ST
32. I am satisfied with the school district's transition activities that took place when my child left Birth to Three.
543 6.8% 15.3% 65.4% 80.7% 87.5% ±
33. I am satisfied with the way secondary transition services were implemented for my child. 917 12.0% 26.8% 39.1% 66.0% 78.0% ±
34. When appropriate, outside agencies have been invited to participate in secondary transition planning. 848 9.3% 13.1% 28.1% 41.2% 50.5% 26.9%
35. The PPT introduced planning for my child's transition to adulthood. 893 11.8% 25.3% 35.7% 61.0% 72.8% ±
36. The school district actively encourages my child to attend and participate in PPT meetings. 911 7.5% 18.4% 64.1% 82.5% 90.0% ±
37. The PPT discussed an appropriate course of study at the high school for my child. 907 9.7% 25.0% 48.5% 73.5% 83.2% ±
38. The PPT developed individualized goals for my child related to employment/postsecondary education, independent living and community participation, if appropriate.
887 14.1% 23.3% 36.1% 59.4% 73.5% ±
Note: SL=slightly, MD=moderately, and ST=strongly; High=MD+ST and Total=SL+MD=ST; and ±=not a response option for this survey item. Survey respondents were instructed to only complete Q32 if their child had transitioned from the early intervention Birth to Three System to Preschool in the past 3 years; and to only complete Q33-Q38 if their child was 15 years of age or older at his/her last PPT meeting.
~ 12 ~
PARENT COMMENTS Section IV
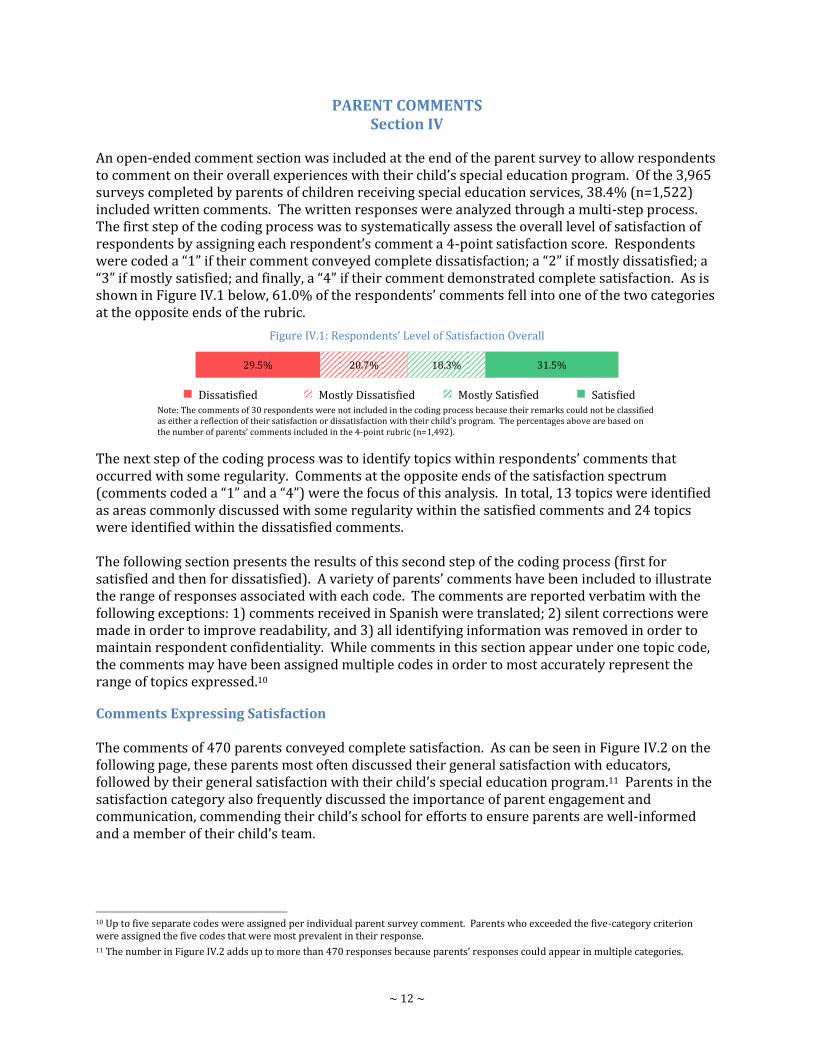
An open-ended comment section was included at the end of the parent survey to allow respondents to comment on their overall experiences with their child’s special education program. Of the 3,965 surveys completed by parents of children receiving special education services, 38.4% (n=1,522) included written comments. The written responses were analyzed through a multi-step process. The first step of the coding process was to systematically assess the overall level of satisfaction of respondents by assigning each respondent’s comment a 4-point satisfaction score. Respondents were coded a “1” if their comment conveyed complete dissatisfaction; a “2” if mostly dissatisfied; a “3” if mostly satisfied; and finally, a “4” if their comment demonstrated complete satisfaction. As is shown in Figure IV.1 below, 61.0% of the respondents’ comments fell into one of the two categories at the opposite ends of the rubric.
Figure IV.1: Respondents’ Level of Satisfaction Overall
Dissatisfied Mostly Dissatisfied Mostly Satisfied Satisfied
Note: The comments of 30 respondents were not included in the coding process because their remarks could not be classified as either a reflection of their satisfaction or dissatisfaction with their child’s program. The percentages above are based on the number of parents’ comments included in the 4-point rubric (n=1,492).
The next step of the coding process was to identify topics within respondents’ comments that occurred with some regularity. Comments at the opposite ends of the satisfaction spectrum (comments coded a “1” and a “4”) were the focus of this analysis. In total, 13 topics were identified as areas commonly discussed with some regularity within the satisfied comments and 24 topics were identified within the dissatisfied comments.
The following section presents the results of this second step of the coding process (first for satisfied and then for dissatisfied). A variety of parents’ comments have been included to illustrate the range of responses associated with each code. The comments are reported verbatim with the following exceptions: 1) comments received in Spanish were translated; 2) silent corrections were made in order to improve readability, and 3) all identifying information was removed in order to maintain respondent confidentiality. While comments in this section appear under one topic code, the comments may have been assigned multiple codes in order to most accurately represent the range of topics expressed.10
Comments Expressing Satisfaction The comments of 470 parents conveyed complete satisfaction. As can be seen in Figure IV.2 on the following page, these parents most often discussed their general satisfaction with educators, followed by their general satisfaction with their child’s special education program.11 Parents in the satisfaction category also frequently discussed the importance of parent engagement and communication, commending their child’s school for efforts to ensure parents are well-informed and a member of their child’s team.
10 Up to five separate codes were assigned per individual parent survey comment. Parents who exceeded the five-category criterion were assigned the five codes that were most prevalent in their response.
11 The number in Figure IV.2 adds up to more than 470 responses because parents’ responses could appear in multiple categories.
29.5% 20.7% 18.3% 31.5%

~ 13 ~
Figure IV.2: Satisfied Comments by Number of Parents
General Satisfaction with Educators (n=136)
A total of 136 parents, or 28.9% of parents who provided satisfied comments, discussed their general satisfaction with their child’s teachers, support staff, and administrators. Examples of comments included:
My child received extremely good special education services. The teachers are wonderful and my daughter has a great team of professional helpers. They do a great job!
My child's special education teacher/case manager has been fundamental in providing a wonderful program. She has been proactive rather than reactive. The school’s special education director has been very accommodating to my child's needs.
Everyone within the school system has been extremely helpful and accepting of my son and his needs. They have worked very hard to make sure he has what he needs to enjoy every minute of his school days.
Overall, my child's experience with the special education program has been very helpful. I am grateful to the teachers and administrators that worked with him and me throughout the years.
I have found the school, teachers, and support staff to be very helpful in any way they could. I continue to be very happy with everyone in the school system that helps my granddaughter.
General Satisfaction with Program (n=111)
Approximately one-quarter (23.6%) of parents who provided satisfied comments discussed their general satisfaction with their child’s special education program. Examples included:
We have been 100% satisfied with the services we have received for our child at all levels of his education.
The school definitely took an interest and went above and beyond for my daughter.
As a parent with a child with autism, I am very pleased with the education system for my son.
Our school district is a role model for services and support.
Our district has been very supportive and has ensured an excellent educational experience for our daughter.
The special education program is outstanding! I truly believe that my child is getting the best education.
136
111
98
92
87
59
55
33
13
13
12
8
5
General Satisfaction with Educators
General Satisfaction with Program
Parent Engagement and Communication
Child’s Academic Success
Quality of Services
Individualized Services
Knowledgeable and Qualified Educators
Supportive and Caring Educators
IEP Process
Outplacement and Magnet Schools
Transition Services
Development of Life and Social Skills
Inclusion

~ 14 ~
Parent Engagement and Communication (n=98)
About one in five (20.9%) parents who provided satisfied comments discussed their satisfaction with how their school district encourages parent involvement and communication. This included comments about having input into their child’s education plans; positive and open communication with their child’s classroom teachers; and an overall feeling of being an equal partner in their child’s education. Examples of comments included:
We could not be more pleased with the services provided for our child by our district. They ensure that all of her needs are met and go beyond expectations when it comes to communication with us. We are always kept up-to-date on her progress and are given exercises that we can work on with her at home. We feel it is a true "team" with our daughter's best interest and success in mind.
We are very pleased with the services we are being provided. Our IEP meetings are productive and I feel listened to as a parent. It's definitely a team approach and very supportive. The school staff are very accommodating if I have any questions or concerns.
Our experience has been good. We have worked together with the school as a team, and because of that our child’s future is bright. We couldn't ask for more support. This special education system is truly wonderful.
The teachers and mentors involved are always very helpful and make themselves available for any questions or concerns I may have throughout the school year.
The staff at the school always asks my opinion and listens to what I think my child needs. My daughter is in high school and I know the program will continue to help her achieve her high school education.
I could not be happier with the support my daughter and I received. Everyone there was wonderful and helped us both through a process that could have been very difficult but instead was a pleasure. My daughter got wonderful encouragement from all the people with whom she interacted! Thanks so much.
From preschool right up to high school has been great. Teachers stay in touch with parents when there are concerns with anything. I had an IEP appointment I could not make because my job wouldn't allow me to take that particular day off. The school was very understanding and helpful. They set up a teleconference so I wouldn't miss anything. I always tell people how great my school district is and will continue to do so.
I entered the special education system fully expecting to have to be strong advocates for our child against the school. Instead we were immediately welcomed as partners with the school.
The preschool program has gone above and beyond my expectations for my child's special education needs. I have an ongoing dialogue with all teachers/therapists and staff involved, and feel very accepted as an integrated part of the PPT team. I honestly feel blessed to be part of this school district.
I was very happy with the special education services. The teachers and staff were very helpful and encouraging to my son and also to myself. I felt like we were a true team.
Child’s Academic Success (n=92)
Ninety-two (n=92) parents commented on their child’s overall academic achievement and progress; often times, attributing their child’s progress to educators and the excellent services and programs in place. Examples of comments included:
I am confident that the skills learned by my son under the program are a real benefit for his education and learning. He has been successful in middle school because of the consistent and ongoing assistance under the program.
Over the last few years, I have watched my daughter improve tremendously with her socialization skills. Most of her special education teachers, as well as her classroom teachers have gone above and beyond to help her.
The special education program has been excellent. We are extremely happy with all the teachers and support resources provided over the years. Our child has truly benefited from the services and is no longer a participant with the special education program. His progress with his education has enabled him to reach his goals and perform at expected grade level. He has become an independent student who really takes pride in his work.
My son has learned a lot since he has started school. I believe the school and teachers have helped him in many ways. I'm very thankful of how well he is doing and how far he has come.
~ 15 ~
Our school has gone above and beyond in trying to find ways to help my son. My son has done very well academically because of all the services that he received. I'm very happy with the staff and services at our school.
My son has shown a lot of gains. He has come a long way, from not talking to communicating in full sentences. It has been a very positive outcome. I'm so happy where we live.
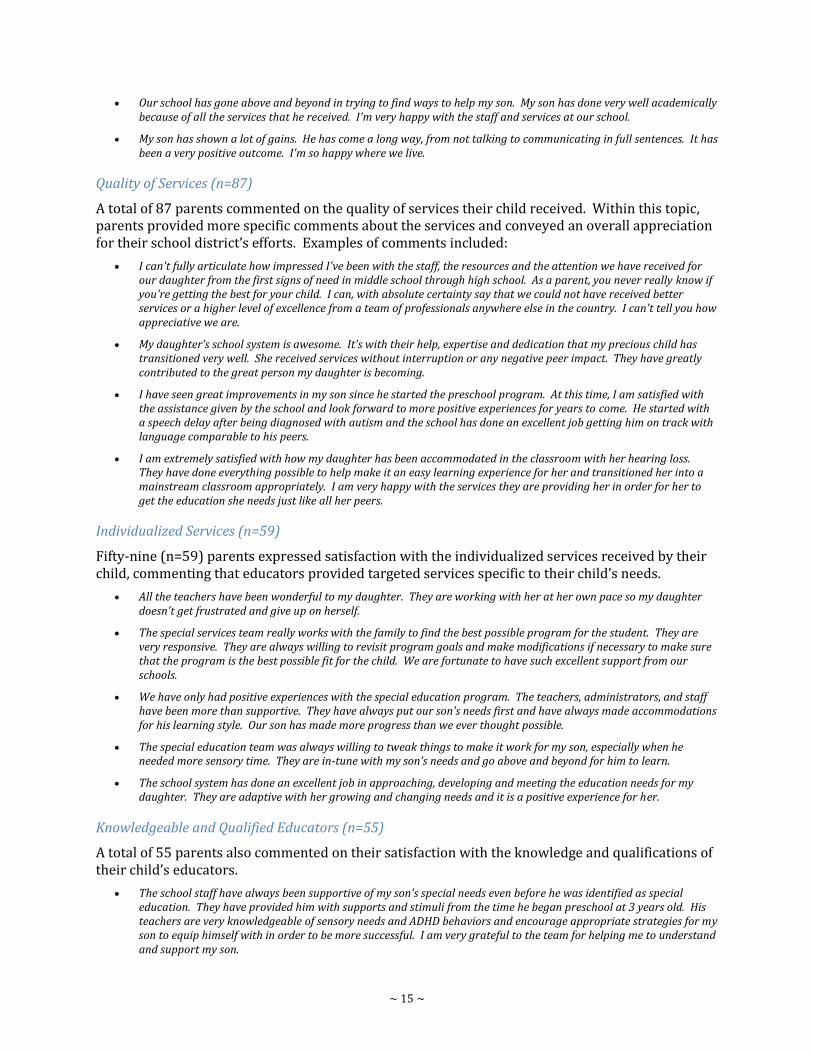
Quality of Services (n=87)
A total of 87 parents commented on the quality of services their child received. Within this topic, parents provided more specific comments about the services and conveyed an overall appreciation for their school district’s efforts. Examples of comments included:
I can't fully articulate how impressed I've been with the staff, the resources and the attention we have received for our daughter from the first signs of need in middle school through high school. As a parent, you never really know if you're getting the best for your child. I can, with absolute certainty say that we could not have received better services or a higher level of excellence from a team of professionals anywhere else in the country. I can't tell you how appreciative we are.
My daughter’s school system is awesome. It's with their help, expertise and dedication that my precious child has transitioned very well. She received services without interruption or any negative peer impact. They have greatly contributed to the great person my daughter is becoming.
I have seen great improvements in my son since he started the preschool program. At this time, I am satisfied with the assistance given by the school and look forward to more positive experiences for years to come. He started with a speech delay after being diagnosed with autism and the school has done an excellent job getting him on track with language comparable to his peers.
I am extremely satisfied with how my daughter has been accommodated in the classroom with her hearing loss. They have done everything possible to help make it an easy learning experience for her and transitioned her into a mainstream classroom appropriately. I am very happy with the services they are providing her in order for her to get the education she needs just like all her peers.
Individualized Services (n=59)
Fifty-nine (n=59) parents expressed satisfaction with the individualized services received by their child, commenting that educators provided targeted services specific to their child’s needs.
All the teachers have been wonderful to my daughter. They are working with her at her own pace so my daughter doesn't get frustrated and give up on herself.
The special services team really works with the family to find the best possible program for the student. They are very responsive. They are always willing to revisit program goals and make modifications if necessary to make sure that the program is the best possible fit for the child. We are fortunate to have such excellent support from our schools.
We have only had positive experiences with the special education program. The teachers, administrators, and staff have been more than supportive. They have always put our son's needs first and have always made accommodations for his learning style. Our son has made more progress than we ever thought possible.
The special education team was always willing to tweak things to make it work for my son, especially when he needed more sensory time. They are in-tune with my son’s needs and go above and beyond for him to learn.
The school system has done an excellent job in approaching, developing and meeting the education needs for my daughter. They are adaptive with her growing and changing needs and it is a positive experience for her.
Knowledgeable and Qualified Educators (n=55)
A total of 55 parents also commented on their satisfaction with the knowledge and qualifications of their child’s educators.
The school staff have always been supportive of my son's special needs even before he was identified as special education. They have provided him with supports and stimuli from the time he began preschool at 3 years old. His teachers are very knowledgeable of sensory needs and ADHD behaviors and encourage appropriate strategies for my son to equip himself with in order to be more successful. I am very grateful to the team for helping me to understand and support my son.

~ 16 ~
Overall, a well-organized process which included subject experts and teachers who were familiar with my daughter and her needs. They worked together to come up with a viable plan for high school, including co-taught classes and other accommodations to make her transition smooth.
My son has been blessed throughout his school years with highly educated and wonderful teachers who take my son’s issues seriously.
My son has severe multiple disabilities and is not able to participate in a general education classroom. He is attending a private special education school and we are very satisfied with this placement. We feel he is progressing to the best of his ability and is surrounded each day by professionals who are trained to teach and care for him.
The school is very beneficial for my son with autism. They are extremely supportive and are knowledgeable and understanding of his disorder and disability. I am grateful to have the school in my son's, as well as our family's life.
Additional Comments Expressing Satisfaction The topics provided above represented the top areas that parents commonly discussed when providing satisfied comments. However, parents also mentioned a variety of other topics, such as supportive and caring educators and the IEP process. A few examples of these comments are provided below.
My daughter came to this school with severe behavior issues and anxiety. Through patience, understanding and really getting to know her, the teachers turned school around for the positive. They were instrumental in building her self-esteem and working with her so she can start to form friendships and have the ability to do schoolwork in a regular class. Her teacher is a shining example of a special education teacher.
The teachers are so caring and really are great teachers and paraprofessionals. They love what they do. The patience they gave to our daughter, who can be difficult at times, cannot be explained in words. We get emotional about our daughter but the program was the best thing that happened to us and her.
The school encourages acceptance and respect. I feel that my child is gaining a wonderful education in an encouraging and accepting environment. His self-confidence and independence has certainly been very positively impacted due to the school system. As parents, we feel very blessed to be part of such an embracing community.
Our district is truly cutting edge with autism services and should be considered a model for other districts of success. They are willing to supplement on staff resources with experts for additional ideas to make IEP planning and execution even more robust and therefore, successful.
Our district has been very supportive regarding my child's educational needs. They offered and continued to support outplacement when it became clear that my child could not be educated in a public school setting.
My child is severely disabled and goes to a special school outside of our district. The special school we go to is amazing! We call them the special forces of the special needs community. The public school is too small to be able to deal with our son's severe disabilities adequately. Our school experience has been great!
Transitioning from Birth to Three into the public school system was seamless. We couldn't be happier with the education and support our children have received. We have seen a huge improvement from when they first enrolled. We feel as though they are able to keep up in a traditional classroom because of it.
I have found my child's special education program to be very instrumental in his overall social and academic growth. My son has grown with a deeper understanding of his handicap with the help of the special education professionals working with him. Although he is still uncertain what it is that he has exactly, he understands well enough how to cope with his disability when it begins to negatively impact his academic and social behavior. Overall, I am very pleased and indebted to the special education program in our school district.
~ 17 ~
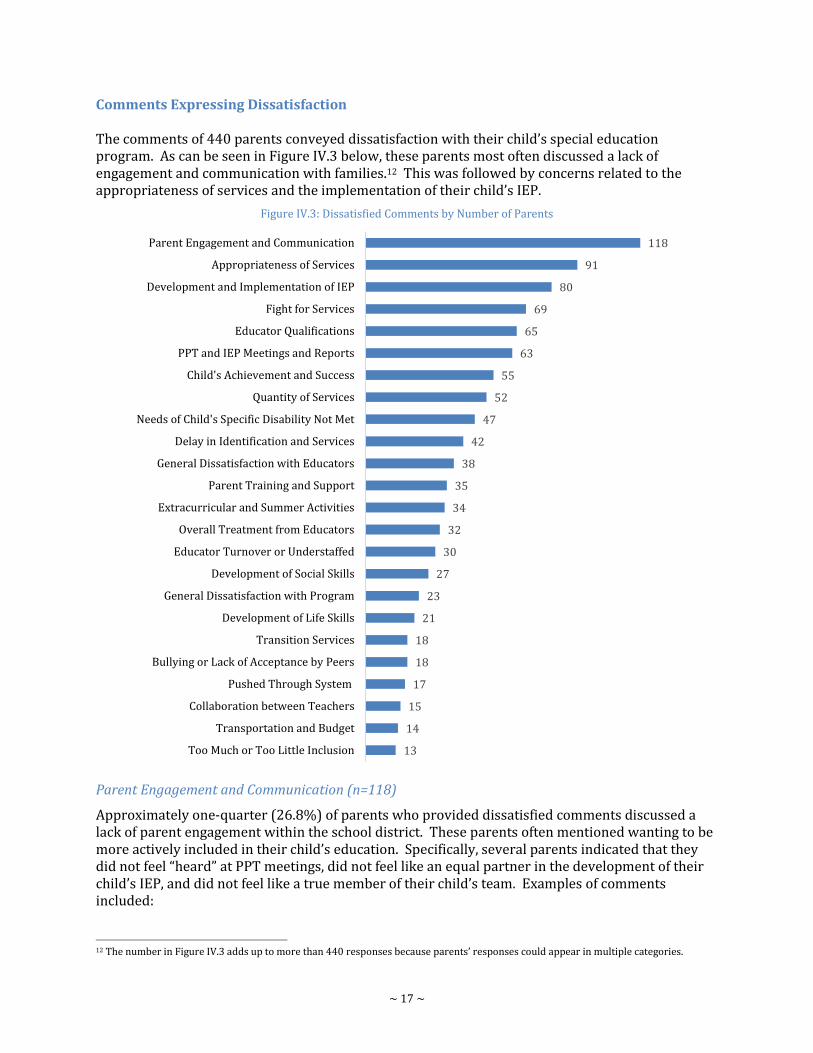
Comments Expressing Dissatisfaction The comments of 440 parents conveyed dissatisfaction with their child’s special education program. As can be seen in Figure IV.3 below, these parents most often discussed a lack of engagement and communication with families.12 This was followed by concerns related to the appropriateness of services and the implementation of their child’s IEP.
Figure IV.3: Dissatisfied Comments by Number of Parents
Parent Engagement and Communication (n=118)
Approximately one-quarter (26.8%) of parents who provided dissatisfied comments discussed a lack of parent engagement within the school district. These parents often mentioned wanting to be more actively included in their child’s education. Specifically, several parents indicated that they did not feel “heard” at PPT meetings, did not feel like an equal partner in the development of their child’s IEP, and did not feel like a true member of their child’s team. Examples of comments included:
12 The number in Figure IV.3 adds up to more than 440 responses because parents’ responses could appear in multiple categories.
13
14
15
17
18
18
21
23
27
30
32
34
35
38
42
47
52
55
63
65
69
80
91
118
Too Much or Too Little Inclusion
Transportation and Budget
Collaboration between Teachers
Pushed Through System
Bullying or Lack of Acceptance by Peers
Transition Services
Development of Life Skills
General Dissatisfaction with Program
Development of Social Skills
Educator Turnover or Understaffed
Overall Treatment from Educators
Extracurricular and Summer Activities
Parent Training and Support
General Dissatisfaction with Educators
Delay in Identification and Services
Needs of Child's Specific Disability Not Met
Quantity of Services
Child's Achievement and Success
PPT and IEP Meetings and Reports
Educator Qualifications
Fight for Services
Development and Implementation of IEP
Appropriateness of Services
Parent Engagement and Communication

~ 18 ~
Teachers, paraprofessionals, counselors, administrators, and parents all need to be educated on how everyone can work as a team. It really does take a village to raise a child. As parents, the knowledge we have regarding our children has not been valued. Many times it has been disregarded and discouraged.
There is a complete lack of cooperation with parents. Administrators have their own agenda and parental input is not encouraged or welcomed.
There needs to be more collaboration between educators and parents. Educators are too quick to say something can't be done instead of finding solutions or compromising.
Overall, as a parent I have felt isolated and certainly not a part of my child’s school community.
In general, we do not believe our position as experts on our daughter's needs is respected. Often times it appears as the district is disagreeing with a request just because they did not come up with the suggestion.
Communication with pupil services/special education staff is minimal, and usually only when I, the parent, initiate it. Information about new case workers (who have changed every year), schedules, and services are provided reluctantly. As a parent, I'm left in the dark most of the time.
I am disappointed when my child has not been provided an environment that was as "normal" as possible. I feel that they restricted students based on disabilities and ignored parents’ suggestions, knowledge, and expertise about their children. I wish we had another option for our child.
Appropriateness of Services (n=91)
Approximately one in five (20.7%) parents who provided dissatisfied comments conveyed concerns about the type of services provided for their child. Parents in this category often discussed a need for more individualized services. Examples of comments included:
My school system suggests very few, if any, new ways to teach my child anything. There is a "one size fits all” special education program at work. My school system seems very defensive when challenged to provide alternative programs or new methodology.
The school district did very little to provide services that truly suited my child's needs. Instead, they used a one size fit all approach. When that didn't work for my teen the school stopped trying. My child hates her school and can't wait to graduate. She feels unsupported by school staff.
My faith in my son’s school system has been totally eroded. I do not trust them and don't feel they put my son's or other special education students' best interests to use. The elementary program was great but it went from bad to worse after that. A "cookie-cutter" approach is used and one size does not fit all. The "I" in the "IEP" stands for individualized and that has been a joke in his education.
The school system thus far has been very frustrating to deal with. I have encountered people who prioritize their egos over my child's education. People who insist that they know all they need to know about my child’s disability. They refuse to consider very relevant information, and refuse to provide appropriate services.
Development and Implementation of the IEP (n=80)
Approximately one in five parents (18.2%) who provided dissatisfied comments expressed concerns with their child’s IEP. These parents often reported that modifications or accommodations as indicated on their child’s IEP were not being implemented. In some cases, parents expressed concerns related to their child’s access to a free and appropriate public education. Examples of comments included:
I found the middle school, the special education teacher, and support staff to be surprisingly disappointing in the implementation of our son’s IEP. We had to have numerous team meetings and PPTs to address areas they needed to improve upon and at times they were out of compliance. The connection/communication between the special education and general education teacher was poor and the teachers were not made aware of the accommodations and modifications our son was supposed to have.
Our experience with special education has been horrific. For years we tried to get help for our child. The district did nothing. We had to pay for an evaluation - the result - ASD (high functioning). The district insisted that they do their own testing. The testing proved to have similar results, however the district refused to interpret the results. They left us no choice but to obtain an attorney. After a failed mediation, we filed for due process over eligibility. We

~ 19 ~
were able to obtain an IEP. We are going on three years of having an attorney to protect our child's right to a free appropriate public education.
Requests for additional services have been denied. Internal testing does not seem thorough and is inconclusive. Additionally, limited and poorly documented internal observations were at odds with our extensive external and privately funded observations, and it did not seem to matter.
While many teachers follow the letter and spirit of the IEP, we have found that some "regular" teachers are very resistant to follow the accommodations outlined in our IEP. Some have overtly refused to follow some accommodations; only to be reminded that they are obligated by law to do so. More often we find that these teachers more subtlety ignore what they don't want to follow and need to be reminded (often several times) of the contents of the IEP.
Fight for Service (n=69)
A total of 69 parents specifically mentioned having to “fight” for services or having to use an advocate or lawyer to navigate the special education system. Examples of comments included:
I can say unequivocally, that I have had to fight every single inch, of every single school year for my son to receive appropriate services so that he may learn to read, decode and write. All I wanted was for my son to have the same opportunities that his peers have and nothing less. Unfortunately, it takes money and a very seasoned special education attorney to achieve just that. I am fortunate enough to have been able to make ends meet and hire a very good attorney. I cannot imagine what it must be like for families who cannot afford the "fight" because that is exactly what it is and what it takes in order for our school district to agree to anything appropriate.
I fought for 6 years through the school system to recognize my child’s needs and get specialized help. Only when I hired someone to represent me did the school act. Very upsetting to have my child subjected to teachers who disregarded him.
In order to get the testing and accommodations that my child needed, I had to hire a lawyer to push the school district to live up to their agreements. This isn’t inexpensive, but worth it since appropriate testing was done and my child is doing well. Generally, the paperwork required (reports with report cards) were not provided until I had a lawyer. A parent should not have to get a lawyer so that a school system follows the law.
My experience with my child’s school district has been hostile, fruitless, and exhausting. My experience has resulted in having to file a state complaint, and hiring an attorney.
We use an advocate and it makes a big difference in services received. Sad but true. Now that my child is older, I need to keep tabs on the teachers and service providers to make sure they are following the IEP.
Educator Qualifications (n=65)
Sixty-five (n=65) parents expressed concerns regarding educators’ training and knowledge, including general education teachers, special education teachers, paraprofessionals, administrators, speech therapists, and school psychologists. Examples of comments included:
Paraprofessionals who spend so much one-on-one time with our children are kind, wonderful people but need a lot more training in educational and behavioral methods. Also, I would suggest that more information about my child's needs be shared with special teachers and other school staff so they could interact with him better.
Our school system has historically scored very well on standardized testing and I believe is a good school for typical kids. When it comes to the special education population, they do not know what they're doing. Teachers are not properly trained and the school just lowers the bar.
Overall, my child's experience with special education has been poor. While some teachers (special and regular education) may have been personally invested, their professional knowledge and skills were strongly lacking in addressing special education needs of my child. When questions were presented that may delve into these areas that appeared weaker, the professionals' responses seemed arrogant and even obtuse (e.g. "I have been doing this for 20 years. I know what I am doing").
Deep deficits existed in well-trained special education staff and the speech therapist, and there was very little coordination with regular education for any inclusion opportunities during or after school. Aids who were with my daughter most of the day were neither specifically trained nor adequately supported.

~ 20 ~
PPT Meetings and IEP Reports (n=63)
A total of 63 parents commented on their dissatisfaction with their child’s PPT meetings, including the scheduling of the meetings, the usefulness of the meetings and the goals and objectives developed as part of the process. Examples of comments included:
I don't feel like I am an equal partner in my child's education in terms of the PPT meetings. When you are told it can be implemented with or without your approval or input, and they don't allow you to add things or adjust language then it makes no sense to waste the parents’ time to attend the meetings. The meetings are always worked around the teachers’ and administrators’ schedule with little to no regard for working parents.
The past 12 months of PPT meetings for my child have been a nightmare. The meetings never start on time. I have waited at least a half hour or more each time. The right people have never been to the meetings. They are always scrambling to find a fill in person who either doesn't know my child or doesn't know what is going on. My concerns are totally disregarded each time.
My son's IEP are created without my input and the progress reported is so generic that it is not meaningful at all. For example, the reports will simply just list the goals and then indicate the word satisfactory with no other details. When I ask about more details, I can't seem to get any. I really don't have a good gauge as to how he is improving especially now that the CMTs are no longer given. I know my son is given extra time for exams, but was unable to find out how much extra time he was actually using, and if it varies by subject.
The PPTs are painfully uncomfortable. It feels like you can cut the tension in the room with a knife and the school system personnel are often defensive when asked questions. I feel badly for all parents who have to go through this.
At PPT meetings, the staff is often quiet. When I have asked a specific question to a general education teacher, often I’ll get an answer from the school psychologist or administrator. The PPT team is often not able to individualize goals and objectives to the child. The team will often recycle the same goals and really do not keep track of data to measure progress. Goals and objectives are not achievable if they do not have scaffolding. I was often rushed through PPTs due to time constraints on the part of the staff at the schools.
Child’s Achievement and Success (n=55)
A total of 55 parents relayed concerns regarding their child’s lack of achievement and success in school. In many cases, parents felt their child’s level of achievement did not match their actual potential to succeed because the school district had not provided them with the services and support they needed. Examples of comments included:
My son will graduate without being able to fill out a job application. My son never established a genuine friendship.
I don't feel that my son's abilities are focused on. There are certain ways that he does things that are easier for him as far as testing is concerned. I understand what the goals are for my son, but at the same time I can see frustration from him at the number of unsuccessful attempts. Every child is different, and while I understand that resources are limited, I would like my son to feel successful and not say, "Its ok Mom, I know I am not that smart."
I am very disappointed at the school system. I continue to be amazed at what my son "has not learned." I am disappointed on what the future holds for my son due to the lack of special education provided.
I have supplied information regarding my child and it has been ignored. I do not feel that they are willing to use simple strategies I have suggested. They also do not seem to have the same high expectations that I have. They are not encouraging my child to be an independent learner.
Quantity of Services (n=52)
Fifty-two (n=52) parents indicated that their child needed more services than was being provided by their child’s school. Several of these parents expressed frustration that services were reduced or removed when their child began to demonstrate progress. Examples of comments included:
The district is very reluctant to give services. Even with my son being in Birth to Three, they denied services until I had him officially diagnosed with PDD-NOS. My suggestions and requests at the IEP are listened to, but any action is never taken. I feel they've reduced his services way too much!
Our school continues to be selective in what services they give, at times ignoring recommendations made by doctors or even as part of the evaluation diagnosis. My child has rights to services under the law (IDEA). The school should

~ 21 ~
not continue to provide the least amount of service to a bright child. It is because a child has support that they can continue to succeed!
I feel my daughter's academic special needs have been minimally met. She still has problems with reading, writing, math, and speech but was deemed at level, and was phased out of special education help in all these areas.
I had to push for more assistance and extra help for my child when he could not keep up with classroom learning. It was a struggle to get the help, but the school finally realized his grades were dropping from not getting the help.
Needs of Child’s Specific Disability Not Met (n=47)
A total of 47 parents mentioned comments about a lack of educator knowledge in the area of their child’s specific disability. These comments often included a need for more training in the area of dyslexia, autism, ADD/ADHD, or emotional disturbance. Examples of comments included:
My child has high functioning autism and I do not feel that the state or district has provided explicit training, professional development, or awareness programs on best practices in working with children that have great potential, yet deep/significant deficits in executive functioning.
Many professionals have no knowledge of PTSD or how to deal with this type of situation. There is a lack of training in this field. Our children are exposed to different type of trauma in our community. It’s crucial for professionals to be trained on PTSD symptoms, effects, and ways to provide healing hands.
It is my opinion that the directors of pupil services that have been a huge part of making decisions regarding the services being provided for my son, are not up-to-date on the issues that need to be addressed for most children on the autism spectrum. By not addressing the challenges in a proactive manner, the system is damaging a child's personal and academic development (it certainly has had a needlessly negative impact on our son over the years). By not being proactive the whole system is affected as teachers become reactionary which then incites defiance, meltdowns, and discontent and disrupts the educational process for all involved.
My son is being taught by a special education teacher that has a huge heart and is a wonderful caring individual, but she is not certified in Wilson programming and he has made little to no progress in the two years he has had Wilson in special education. He is pulled for special education with two other students that are at two very different points in their learning in Wilson. Instruction is not individualized. For years, we have known that dyslexic students need individualized, systematic, multi-sensory instruction by individuals that are specifically trained in dyslexia. The public schools are not doing this. They prescribe a one shoe fits all approach to any reading disability and very few of the special education teachers have training in dyslexia.
Delay in Identification and Services (n=42)
A few parents also discussed concerns related to a long delay in either the identification of their child’s disability or for their child to receive services.
I am still very disappointed that is took so long for my son to be identified as needing special services. I had expressed my concerns with his reading throughout elementary school and it wasn't until the beginning of middle school when testing finally took place and support services began. During the past two years, I feel as though plans have been followed, but I do not see huge growth and worry about the transition to high school.
It took a long time (3 1/2 years) to get my child identified as requiring an IEP. I was offered a 504 and then an IEE. Finally, he was made eligible for an IEP. It's hard for me to trust the school recommendations with this history.
I have been asking the school to test my child on a deeper level to see if she has more than ADHD. I would like to have her tested to see if she has autism, her doctor believe she does. The school has not helped in any way to guide or provide any services for testing.
I am strongly disappointed with the special education department. The system is purely reactive, not in any way proactive. Despite multiple diagnoses from medical professionals, the supervisor of special education disputed whether or not my child has autism. My husband and I requested behavioral and psychological evaluations multiple times. It took the district over a year to acknowledge that my daughter is indeed autistic. This is my child's fourth year attending the public schools, and they are just now having her evaluated by the district’s behavioral analyst.

~ 22 ~
Additional Comments Expressing Dissatisfaction
The topic areas presented above represented the most frequently discussed topics by parents who expressed dissatisfaction with their child’s special education program. However, these parents also discussed additional areas, such as general concerns with educators, a lack of parent support and training, and a lack of access to extracurricular activities. A few examples of these comments are provided below.
When my son moved from one elementary school option to the other option available in the district, I repeatedly felt very unwelcomed by the principal. I have to wonder if it was because of all of the extra services that my son would require. I also found the school nurse to be very unaccommodating with regards to school field trips.
As a parent with two children in the special education system, I have felt isolated, uninformed, and unsupported many times in the last 12 months. I wish there were more resources available.
My son cannot attend after school activities because he needs a one-on-one paraprofessional and the district will not pay the paraprofessional to stay after school with him.
I am very disappointed with the school system’s overall support to my child's needs. The teacher was very unsupportive and rude.
My district has had three special education directors, each time I have to start from scratch with every new director. Agreements made by prior directors are denied by new directors, leaving my child without services.
I feel the school is understaffed. Too much responsibility is put on the general education teacher, who is put in an unfortunate position. How can she possibly meet the needs of all her students when my child's behavior regularly disrupts the entire classroom? I love my daughter. She is brilliant, thoughtful and well intentioned, as well as autistic. Her behavior is typical of a child with autism. The school routinely minimizes how her condition impedes her learning, as well as her peers. My husband and I feel that she is receiving inadequate support.
Social training was not recommended or provided as my child is high functioning. He could have used a high level social group. The school district does a poor job of inclusion and acceptance of differences.
My child continues to fall behind. The school expectations are "met", but these expectations are so low that my child will never be expected to rise above these low level expectations. I am very dissatisfied with progress.
My child needs more vocational skills. He is in high school and reads on a 2nd-3rd grade level. The teacher still talks "college" to him which is totally unrealistic. He needs life skills, like carpentry, or masonry or anything else that will help him have a successful job that does not involve college. More "realism" and less “idealism" will help students in the long run. This is not shortchanging them, just giving them realistic and attainable goals.
My son is in high school. The transition from middle school to high school is severely lacking. He did not/does not have the tools he needs to be successful even though they are clearly stated in his IEP.
He is being bullied at school, and nobody is doing anything to help. There has been days he doesn't want to go back to school.
The school district is very difficult to work with in regards to special education. They have not addressed or provided any secondary transition services for our child. They are basically pushing him through school and providing him with credits in order to graduate without actually being prepared to enter the workforce or continue his education.
My experience has been regular education feels that my child issues are to be handled by special education exclusively. They take very little responsibility in upholding the accommodations in his IEP.
When my son entered high school it seemed like the teachers were completely unaware of the accommodations/modifications that my son needed. I got the feeling that they didn't cooperate with the case manager easily.
I was told by the director of the school at one point that the school had to see how the budget meeting goes before they know what they can or cannot offer my son.
The district continues to segregate students with more severe disabilities and do not encourage parents to choose more inclusive options. They rely on "safer" more manageable setting to provide instruction and services. In fact, schools should be providing students with all levels of disabilities to become more independent. This should be incorporated in IEP goals and objectives beginning in Pre-K.

~ 23 ~
DIFFERENCES BY DEMOGRAPHICS Section V
In this section, differences in parent responses are presented for four demographic groups: child’s primary eligibility for services, age, race/ethnicity, and eligibility for free or reduced price lunch.13 Select survey statements have been illustrated with a bar chart to highlight overall trends. Each chart includes the percentage of parents to express “high-level” agreement (i.e. moderately + strongly) and “total” agreement (i.e., slightly + moderately + strongly) with the statement.14 (See Appendix F for differences by all demographic groups for all survey items.)
Child’s Primary Eligibility for Services A child’s primary disability was a common determinant of variations found in parents’ responses to survey statements.15 In general, parents of children with a developmental delay, speech or language impairment, or specific learning disabilities tended to report higher levels of satisfaction than other parents, while parents of children with an emotional disturbance or ADD/HD tended to report some of the lowest levels of satisfaction. Due to the considerable number of differences, response patterns by disability category are presented by specific topical areas of the survey. Satisfaction with My Child’s Program In this section of the survey [Q1-Q9], parents of children with a developmental delay reported higher levels of satisfaction than other parents on 5 of the 9 statements. Parents of children with a speech or language impairment also tended to report relatively higher levels of satisfaction. In contrast, parents of children with an emotional disturbance had the lowest levels of satisfaction across 7 of the 9 statements, followed by parents of children with ADD/HD.
When asked if their child is accepted within the school community [Q3], the vast majority of parents of children with an intellectual disability and a developmental delay agreed (96.9% and 96.6%, respectively) compared to 83.3% of parents of children with an emotional disturbance.
The greatest variation across the 9 statements occurred when parents were asked if their child’s IEP is meeting his or her educational needs [Q4]. More than 90.0% of parents of children with a developmental delay agreed compared to just over three-quarters (76.7%) of parents of children with an emotional disturbance, a difference of 15 percentage points.
Similar response patterns were evident when parents were asked whether staff are appropriately trained and able to provide their child’s specific program and services [Q6]. Parents of children with a developmental delay and a speech or language impairment were the most likely to agree (93.5% and 90.8%, respectively), while parents of children with an emotional disturbance were again the least likely to agree (80.2%).
13 Differences by English Learner status are not presented as the total number of survey respondents varies considerably across the EL (n=211) and non-EL (n=3,754) categories, and differences by gender are not presented as there were no notable differences (see Appendix F for differences by these demographic groups).
14 High-level agreement has been included in the charts; however, for ease of reading, these percentages are not discussed in the narrative. Parents were given the option of selecting “don’t know” on 11 survey items (4-9, 21, 25, 28, 29 and 34). This should be considered when comparing agreement levels across items.
15 The disability categories of deaf-blindness, traumatic brain injury, and hearing, visual, and orthopedic impairment were not included in the analysis due to the small number of survey respondents in these categories. The total number of survey respondents for all other categories included: specific learning disabilities (SLD) (n=1,038); autism (n=687); speech or language impairment (n=633); ADD/HD (n=491); other health impairment (OHI) (n=282); developmental delay (DD) (n=267); multiple disabilities (n=214); emotional disturbance (ED) (n=172); and intellectual disability (ID) (n=130).

~ 24 ~
Figure V.1: Questions 3, 4, and 6 by Child’s Disability
Q3. My child is accepted within the school community.
Q4. My child’s Individualized Education Program (IEP) is meeting his or her educational needs.
Q6. Staff is appropriately trained and able to provide my child’s specific program and services.
Note: The diamond equals high-level agreement (i.e., moderately + strongly). The bar equals total agreement (i.e., plus slightly agree).
Participation in My Child’s Program
When compared to the topical area just discussed, statements concerning parents’ participation in their child’s program [Q10-Q21] generated somewhat smaller differences by disability category. However, response patterns were for the most part, still consistent with those just mentioned.
When asked if administrators and teachers encourage parent involvement in order to improve services and results for children with disabilities [Q10], 90.5% of parents of children with a developmental delay agreed compared to 83.1% of parents of children with an emotional disturbance, a difference of roughly 7 percentage points.
More than 90.0% of parents of children with a developmental delay and a speech or language impairment agreed that the district proposed programs and services to meet their child’s individual needs [Q16] compared to 82.2% of parents of children with an other health impairment.
One of the largest disparities across the 12 statements occurred when parents were asked if the district proposed the regular classroom for their child as the first placement option [Q21]. A sizeable majority (87.7%) of parents of children with a speech or language impairment agreed compared to approximately two-thirds (66.5%) of parents of children with multiple disabilities, a difference of roughly 21 percentage points.
Figure V.2: Questions 10, 16, and 21 by Child’s Disability
Q10. In my child's school, administrators and teachers encourage parent involvement in order to improve services and results for children with disabilities.
Q16. At my child’s PPT, the school district proposed programs and services to meet my child’s individual needs.
Q21. The school district proposed the regular classroom for my child as the first placement option.
Note: The diamond equals high-level agreement (i.e., moderately + strongly). The bar equals total agreement (i.e., plus slightly agree).
96.9%
96.6%
94.8%
94.8%
90.9%
89.5%
87.5%
86.3%
83.3%
82.2%
93.6%
90.2%
88.3%
81.8%
78.9%
79.2%
77.2%
70.2%
ID
DD
Speech
SLD
Multiple
Autism
OHI
ADD/HD
ED
91.7%
89.7%
86.9%
83.4%
83.1%
83.1%
82.3%
82.2%
76.7%
86.1%
79.3%
78.1%
73.0%
69.2%
71.4%
68.5%
75.1%
62.2%
DD
Speech
SLD
Multiple
ADD/HD
Autism
ID
OHI
ED
93.5%
90.8%
86.6%
84.5%
83.7%
83.2%
82.9%
82.1%
80.2%
88.5%
84.5%
78.8%
71.5%
72.9%
75.1%
73.0%
72.2%
66.5%
DD
Speech
SLD
OHI
ID
Autism
Multiple
ADD/HD
ED
90.5%
90.4%
90.4%
89.9%
87.9%
85.5%
85.1%
84.9%
83.1%
80.7%
78.8%
77.7%
69.0%
72.2%
71.0%
72.4%
68.9%
71.5%
DD
Speech
SLD
ID
OHI
Autism
ADD/HD
Multiple
ED
92.1%
91.5%
88.9%
86.8%
86.7%
84.3%
83.8%
83.0%
82.2%
85.0%
81.3%
78.0%
74.4%
73.3%
68.6%
71.1%
73.1%
71.5%
DD
Speech
SLD
ID
ADD/HD
ED
Autism
Multiple
OHI
87.7%
86.2%
86.1%
85.2%
80.4%
77.9%
72.1%
70.8%
66.5%
85.1%
82.7%
82.1%
80.4%
77.3%
72.1%
68.0%
63.2%
61.6%
Speech
SLD
OHI
ADD/HD
DD
Autism
ID
ED
Multiple
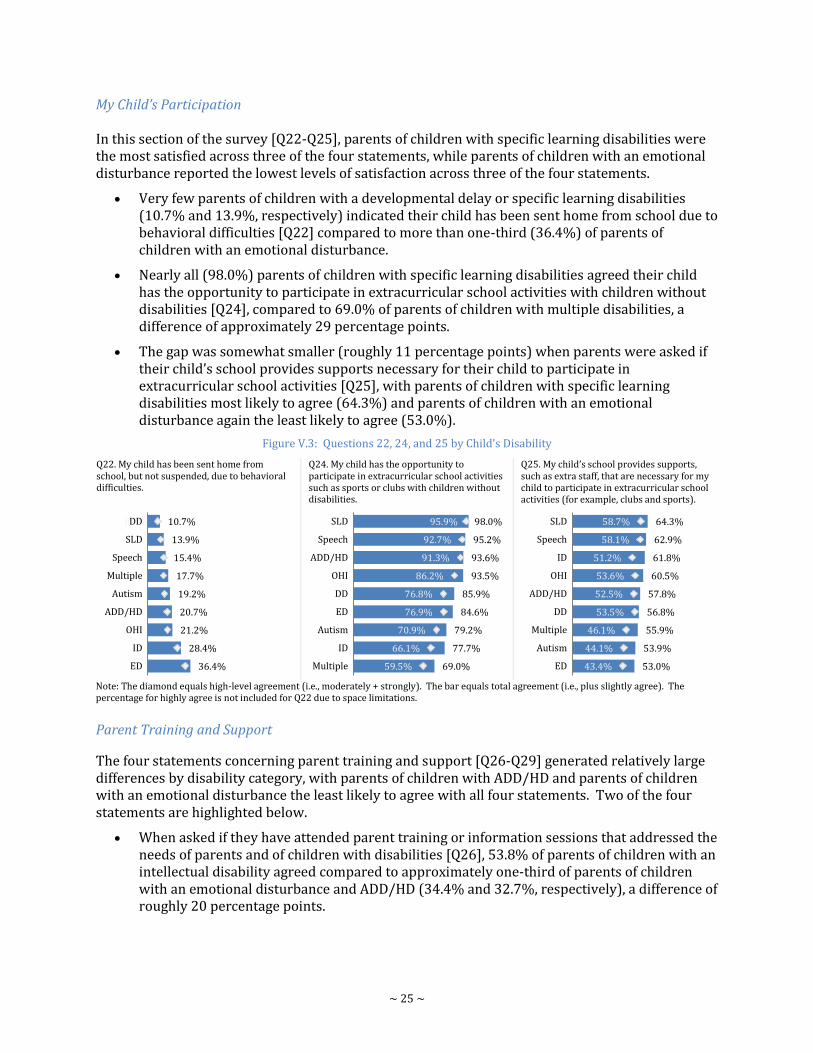
~ 25 ~
My Child’s Participation In this section of the survey [Q22-Q25], parents of children with specific learning disabilities were the most satisfied across three of the four statements, while parents of children with an emotional disturbance reported the lowest levels of satisfaction across three of the four statements.
Very few parents of children with a developmental delay or specific learning disabilities (10.7% and 13.9%, respectively) indicated their child has been sent home from school due to behavioral difficulties [Q22] compared to more than one-third (36.4%) of parents of children with an emotional disturbance.
Nearly all (98.0%) parents of children with specific learning disabilities agreed their child has the opportunity to participate in extracurricular school activities with children without disabilities [Q24], compared to 69.0% of parents of children with multiple disabilities, a difference of approximately 29 percentage points.
The gap was somewhat smaller (roughly 11 percentage points) when parents were asked if their child’s school provides supports necessary for their child to participate in extracurricular school activities [Q25], with parents of children with specific learning disabilities most likely to agree (64.3%) and parents of children with an emotional disturbance again the least likely to agree (53.0%).
Figure V.3: Questions 22, 24, and 25 by Child’s Disability
Q22. My child has been sent home from school, but not suspended, due to behavioral difficulties.
Q24. My child has the opportunity to participate in extracurricular school activities such as sports or clubs with children without disabilities.
Q25. My child’s school provides supports, such as extra staff, that are necessary for my child to participate in extracurricular school activities (for example, clubs and sports).
Note: The diamond equals high-level agreement (i.e., moderately + strongly). The bar equals total agreement (i.e., plus slightly agree). The percentage for highly agree is not included for Q22 due to space limitations.
Parent Training and Support
The four statements concerning parent training and support [Q26-Q29] generated relatively large differences by disability category, with parents of children with ADD/HD and parents of children with an emotional disturbance the least likely to agree with all four statements. Two of the four statements are highlighted below.
When asked if they have attended parent training or information sessions that addressed the needs of parents and of children with disabilities [Q26], 53.8% of parents of children with an intellectual disability agreed compared to approximately one-third of parents of children with an emotional disturbance and ADD/HD (34.4% and 32.7%, respectively), a difference of roughly 20 percentage points.
10.7%
13.9%
15.4%
17.7%
19.2%
20.7%
21.2%
28.4%
36.4%
8.9% DD
SLD
Speech
Multiple
Autism
ADD/HD
OHI
ID
ED
98.0%
95.2%
93.6%
93.5%
85.9%
84.6%
79.2%
77.7%
69.0%
95.9%
92.7%
91.3%
86.2%
76.8%
76.9%
70.9%
66.1%
59.5%
SLD
Speech
ADD/HD
OHI
DD
ED
Autism
ID
Multiple
64.3%
62.9%
61.8%
60.5%
57.8%
56.8%
55.9%
53.9%
53.0%
58.7%
58.1%
51.2%
53.6%
52.5%
53.5%
46.1%
44.1%
43.4%
SLD
Speech
ID
OHI
ADD/HD
DD
Multiple
Autism
ED
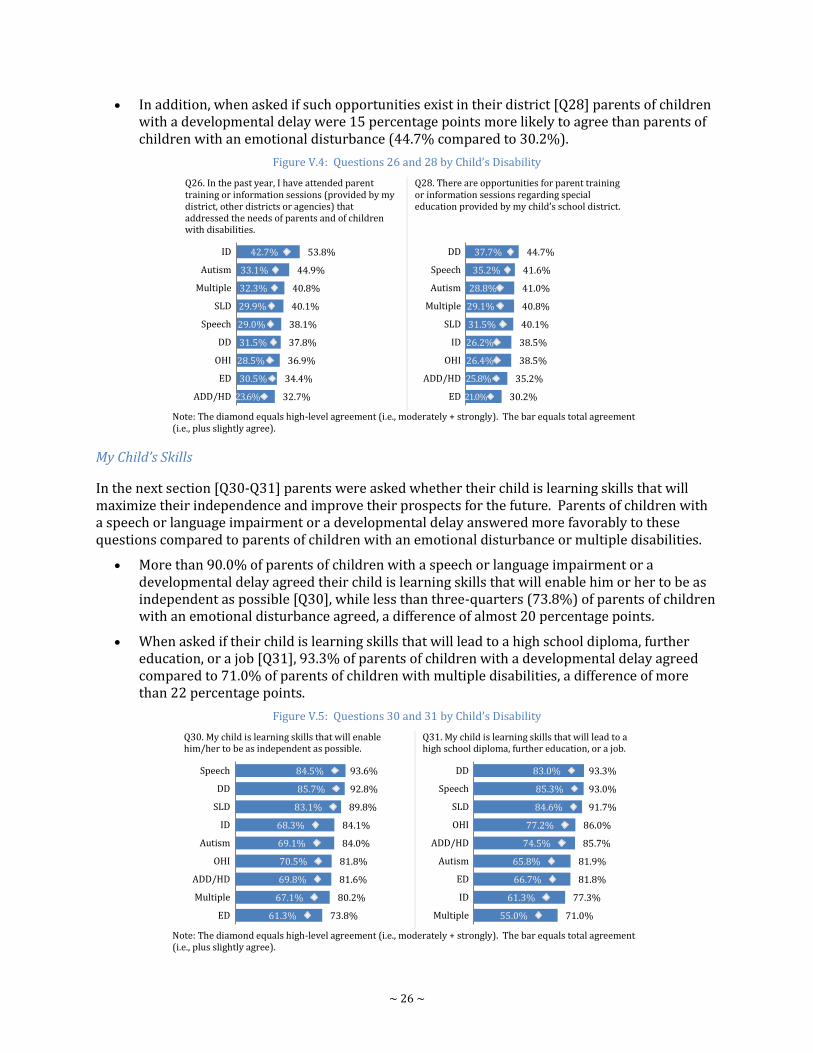
~ 26 ~
In addition, when asked if such opportunities exist in their district [Q28] parents of children with a developmental delay were 15 percentage points more likely to agree than parents of children with an emotional disturbance (44.7% compared to 30.2%).
Figure V.4: Questions 26 and 28 by Child’s Disability
Q26. In the past year, I have attended parent training or information sessions (provided by my district, other districts or agencies) that addressed the needs of parents and of children with disabilities.
Q28. There are opportunities for parent training or information sessions regarding special education provided by my child’s school district.
Note: The diamond equals high-level agreement (i.e., moderately + strongly). The bar equals total agreement (i.e., plus slightly agree).
My Child’s Skills
In the next section [Q30-Q31] parents were asked whether their child is learning skills that will maximize their independence and improve their prospects for the future. Parents of children with a speech or language impairment or a developmental delay answered more favorably to these questions compared to parents of children with an emotional disturbance or multiple disabilities.
More than 90.0% of parents of children with a speech or language impairment or a developmental delay agreed their child is learning skills that will enable him or her to be as independent as possible [Q30], while less than three-quarters (73.8%) of parents of children with an emotional disturbance agreed, a difference of almost 20 percentage points.
When asked if their child is learning skills that will lead to a high school diploma, further education, or a job [Q31], 93.3% of parents of children with a developmental delay agreed compared to 71.0% of parents of children with multiple disabilities, a difference of more than 22 percentage points.
Figure V.5: Questions 30 and 31 by Child’s Disability
Q30. My child is learning skills that will enable him/her to be as independent as possible.
Q31. My child is learning skills that will lead to a high school diploma, further education, or a job.
Note: The diamond equals high-level agreement (i.e., moderately + strongly). The bar equals total agreement (i.e., plus slightly agree).
53.8%
44.9%
40.8%
40.1%
38.1%
37.8%
36.9%
34.4%
32.7%
42.7%
33.1%
32.3%
29.9%
29.0%
31.5%
28.5%
30.5%
23.6%
ID
Autism
Multiple
SLD
Speech
DD
OHI
ED
ADD/HD
44.7%
41.6%
41.0%
40.8%
40.1%
38.5%
38.5%
35.2%
30.2%
37.7%
35.2%
28.8%
29.1%
31.5%
26.2%
26.4%
25.8%
21.0%
DD
Speech
Autism
Multiple
SLD
ID
OHI
ADD/HD
ED
93.6%
92.8%
89.8%
84.1%
84.0%
81.8%
81.6%
80.2%
73.8%
84.5%
85.7%
83.1%
68.3%
69.1%
70.5%
69.8%
67.1%
61.3%
Speech
DD
SLD
ID
Autism
OHI
ADD/HD
Multiple
ED
93.3%
93.0%
91.7%
86.0%
85.7%
81.9%
81.8%
77.3%
71.0%
83.0%
85.3%
84.6%
77.2%
74.5%
65.8%
66.7%
61.3%
55.0%
DD
Speech
SLD
OHI
ADD/HD
Autism
ED
ID
Multiple

~ 27 ~
Transition Planning Finally, the last section of the survey [Q32-Q38] asked parents about their child’s transition to preschool, or secondary transition activities and services.16 Differences emerged by disability category; however, there was no discernible trend of one group consistently answering more or less favorably than another.
Parents of children with multiple disabilities were the most likely to indicate that outside agencies have been invited to participate in secondary transition planning [Q34]. Almost two-thirds (62.7%) of these parents agreed compared to 42.7% of parents of children with specific learning disabilities, a difference of 20 percentage points.
However, when asked if the school district actively encourages their child to attend and participate in PPT meetings [Q36], parents of children with multiple disabilities were the least likely to agree, 75.0% compared to 94.7% of parents of children with ADD/HD.
Figure V.6: Questions 34 and 36 by Child’s Disability
Q34. When appropriate, outside agencies have been invited to participate in secondary transition planning.
Q36. The school district actively encourages my child to attend and participate in PPT meetings.
Note: The diamond equals high-level agreement (i.e., moderately + strongly). The bar equals total agreement (i.e., plus slightly agree).
Child’s Age The age of respondents’ children was also a determinant of variations in responses across survey statements, with parents of children ages 3-5 generally expressing more satisfaction.17 These parents ranked first or second in satisfaction across 26 of the 31 statements analyzed.18 In contrast, parents of children ages 13-14 and 15-17 tended to report lower levels of satisfaction.
When asked if all special education services identified in their child’s IEP have been provided [Q5], more than 90.0% of parents of children ages 3-5 agreed compared to 83.0% of parents of children ages 13-14 and 15-17.
Similarly, when respondents were asked if staff are appropriately trained and able to provide their child’s specific program and services [Q6], parents of children ages 3-5 were roughly 12 percentage points more likely to agree than parents of children ages 15-17.
16 The age-specific nature of transition planning naturally restricts the number of parents for which these questions are applicable and as a result, considerably fewer parents answered questions in this section. The total number of respondents for the secondary transition questions by primary disability included: SLD (n=279), autism (n=158), ADD/HD (n=137), OHI (n=86), emotional disturbance (n=83), multiple disabilities (n=77), speech or language impairment (n=48) and intellectual disability (n=51). 17 The total number of survey respondents by child’s age included: 3-5 years (n=544); 6-12 years (n=1,924); 13-14 years (n=599); 15-17 years (n=721); and 18-21 years (n=177).
18 Seven age-specific questions (Q32-Q38) were not included in this analysis.
62.7%
60.5%
55.9%
54.3%
47.6%
46.7%
45.8%
42.7%
53.3%
49.4%
44.7%
45.7%
45.2%
40.0%
37.3%
32.4%
Multiple
ED
Autism
ID
Speech
ADD/HD
OHI
SLD
94.7%
94.0%
92.8%
91.7%
90.5%
86.7%
85.9%
75.0%
92.4%
85.5%
87.0%
79.2%
79.8%
84.4%
75.6%
63.2%
ADD/HD
ED
SLD
Speech
OHI
ID
Autism
Multiple

~ 28 ~
Lastly, parents of children ages 6-12 were the most likely to agree that general education teachers make accommodations and modifications as indicated on their child’s IEP [Q8], while parents of children ages 13-14 were the least likely to agree (86.8% compared to 77.5%, respectively).
Figure V.7: Questions 5, 6, and 8 by Child’s Age
Q5. All special education services identified in my child’s IEP have been provided.
Q6. Staff is appropriately trained and able to provide my child’s specific program and services.
Q8. General education teachers make accommodations and modifications as indicated on my child's IEP.
Note: The diamond equals high-level agreement (i.e., moderately + strongly). The bar equals total agreement (i.e., plus slightly agree).
A gap in satisfaction was also evident when parents were asked about their child’s first placement option, whether their child has been sent home from school due to behavioral difficulties, and about opportunities for their child to participate in school activities. A slightly different response pattern was seen across these statements, with parents of children ages 18-21 answering the least favorably.
One of the largest disparities was on the statement that asked parents if the school district proposed the regular classroom as the first placement option for their child [Q21]. A sizeable majority (85.2%) of parents of children ages 6-12 agreed compared to approximately two-thirds (67.3%) of parents of children ages 18-21, a difference of almost 18 percentage points.
Similarly, parents of children ages 18-21 were roughly twice as likely as parents of children ages 3-5 to indicate their child has been sent home from school due to behavioral difficulties [Q22], 28.5% compared to 13.5%, respectively.
When asked if their child has the opportunity to participate in extracurricular school activities with children without disabilities [Q24], parents of children ages 18-21 were again the least likely to agree, 80.1% compared to 91.3% of parents of children ages 15-17.
Figure V.8: Questions 21, 22, and 24 by Child’s Age
Q21. The school district proposed the regular classroom for my child as the first placement option.
Q22. My child has been sent home from school, but not suspended, due to behavioral difficulties.
Q24. My child has the opportunity to participate in extracurricular school activities such as sports or clubs with children without disabilities.
Note: The diamond equals high-level agreement (i.e., moderately + strongly). The bar equals total agreement (i.e., plus slightly agree). The percentage for highly agree is not included for Q22 due to space limitations.
92.4%
89.0%
86.9%
83.0%
83.0%
87.9%
80.8%
77.1%
74.4%
74.1%
3-5 yrs
6-12 yrs
18-21 yrs
13-14 yrs
15-17 yrs
92.3%
87.0%
85.2%
82.4%
80.8%
87.1%
78.8%
72.2%
71.2%
71.7%
3-5 yrs
6-12 yrs
18-21 yrs
13-14 yrs
15-17 yrs
86.8%
83.3%
79.5%
78.8%
77.5%
76.2%
75.9%
63.5%
64.8%
63.4%
6-12 yrs
3-5 yrs
15-17 yrs
18-21 yrs
13-14 yrs
85.2%
81.1%
81.0%
80.3%
67.3%
81.6%
77.3%
76.2%
74.5%
62.3%
6-12 yrs
3-5 yrs
13-14 yrs
15-17 yrs
18-21 yrs
13.5%
16.5%
18.0%
20.5%
28.5%
3-5 yrs
13-14 yrs
6-12 yrs
15-17 yrs
18-21 yrs
91.3%
90.7%
90.3%
85.3%
80.1%
85.6%
86.3%
86.4%
79.0%
71.1%
15-17 yrs
6-12 yrs
13-14 yrs
3-5 yrs
18-21 yrs

~ 29 ~
In contrast, when asked about parent training opportunities and support networks [Q26-Q29], parents of children ages 18-21 were the most likely to agree across all four statements. Two of the four statements are highlighted below.
More than one-half (52.3%) of parents of children ages 18-21 agreed they have attended parent training or information sessions in the past year that addressed the needs of parents and of children with disabilities [Q26] compared to 36.5% of parents of children ages 6-12, a difference of almost 16 percentage points.
In addition, two in five (40.7%) parents of children ages 18-21 agreed they are involved in a support network for parents of students with disabilities [Q27] compared to about one-quarter (27.7%) of parents of children ages 15-17, a difference of 13 percentage points.
Figure V.9: Questions 26 and 27 by Child’s Age
Q26. In the past year, I have attended parent training or information sessions (provided by my district, other districts or agencies) that addressed the needs of parents and of children with disabilities.
Q27. I am involved in a support network for parents of students with disabilities available through my school district or other sources.
Note: The diamond equals high-level agreement (i.e., moderately + strongly). The bar equals total agreement (i.e., plus slightly agree).
Child’s Race/Ethnicity Overall, parents of Hispanic children and parents of Black children tended to answer survey statements slightly more favorably than parents of White children.19 However, the differences were often very small, with less than five percentage points separating the three racial/ethnic groups on 23 (60.5%) of the survey’s 38 statements. There was just one survey statement [Q22] that did not adhere to this general trend.
Almost one-third (31.8%) of parents of Hispanic children indicated their child has been sent home from school due to behavioral difficulties [Q22] compared to 13.8% of parents of White children, a difference of 18 percentage points.
Figure V.10: Question 22 by Child’s Race/Ethnicity
Q22. My child has been sent home from school, but not suspended, due to behavioral difficulties.
Note: The diamond equals high-level agreement (i.e., moderately + strongly). The bar equals total agreement (i.e., plus slightly agree). The percentage for highly agree is not included due to space limitations.
19 The race/ethnicity categories of Asian, Native Hawaiian/Other Pacific Islander, American Indian/Alaskan Native, and Two or More Races were not included in the analysis due to the small number of survey respondents in these categories. The total number of survey respondents for all other categories included: White (n=2,789); Hispanic/Latino of Any Race (n=608); and Black or African American (n=308).
52.3%
45.7%
39.8%
39.4%
36.5%
41.9%
33.9%
31.4%
31.1%
27.4%
18-21 yrs
15-17 yrs
3-5 yrs
13-14 yrs
6-12 yrs
40.7%
35.5%
32.1%
31.9%
27.7%
29.3%
27.2%
22.5%
22.2%
19.9%
18-21 yrs
3-5 yrs
6-12 yrs
13-14 yrs
15-17 yrs
13.8%
21.8%
31.8%
White
Black
Hispanic

~ 30 ~
Examples of statements more aligned with the general trend first noted (i.e., parents of Hispanic children and parents of Black children slightly more satisfied than parents of White children) include those from the parent training and support, and secondary transition sections of the survey.20 A few of the items are highlighted below.
Almost one-half (48.1%) of parents of Hispanic children indicated they have attended a parent training or information session in the past year that addressed the needs of parents and of children with disabilities [Q26] compared to approximately one-third (36.1%) of parents of White children, a difference of 12 percentage points.
Similarly, when asked if they are involved in support network for parents of students with disabilities [Q27], parents of Hispanic children were almost 15 percentage points more likely to agree than parents of White children (43.2% compared to 28.4%).
Figure V.11: Questions 26 and 27 by Child’s Race/Ethnicity
Q26. In the past year, I have attended parent training or information sessions (provided by my district, other districts or agencies) that addressed the needs of parents and of children with disabilities.
Q27. I am involved in a support network for parents of students with disabilities available through my school district or other sources.
Note: The diamond equals high-level agreement (i.e., moderately + strongly). The bar equals total agreement (i.e., plus slightly agree).
When asked if they are satisfied with the way secondary transition services were implemented for their child [Q33], more than 90.0% of parents of Black children agreed compared to approximately three-quarters (75.6%) of parents of White children, a difference of roughly 15 percentage points.
Parents of White children were also the least likely to agree that outside agencies have been invited to participate in secondary transition planning [Q34], 46.5% compared to 64.0% of parents of Hispanic children (a difference of almost 17 percentage points).
Figure V.12: Questions 33 and 34 by Child’s Race/Ethnicity
Q33. I am satisfied with the way secondary transition services were implemented for my child.
Q34. When appropriate, outside agencies have been invited to participate in secondary transition planning.
Note: The diamond equals high-level agreement (i.e., moderately + strongly). The bar equals total agreement (i.e., plus slightly agree).
20 The age-specific nature of transition planning naturally restricts the number of parents for which these questions are applicable and as a result, considerably fewer parents answered questions in this section. The total number of survey respondents for the secondary transition questions by race/ethnicity included: White (n=664); Hispanic/Latino of Any Race (n=123); and Black or African American (n=86).
48.1%
45.2%
36.1%
36.9%
36.4%
27.3%
Hispanic
Black
White
43.2%
33.5%
28.4%
31.4%
20.6%
20.4%
Hispanic
Black
White
90.7%
82.9%
75.6%
80.2%
75.6%
62.0%
Black
Hispanic
White
64.0%
59.8%
46.5%
56.1%
52.4%
36.7%
Hispanic
Black
White

~ 31 ~
Child’s Eligibility for Free and Reduced Price Lunch Overall, similar response patterns occurred across parents of children eligible for free and reduced price lunch (FRPL) and parents of children not eligible, with no discernible trend of one group consistently answering more or less favorably than the other group.21 In fact, there was less than a five percentage point difference between the two groups across more than three-quarters (78.9%, n=30) of the items. However, similar to the race/ethnicity demographic category, a large variation in responses was evident for survey item 22.
Parents of children eligible for free and reduced price lunch were more than twice as likely than parents of children not eligible to indicate that their child has been sent home from school due to behavioral difficulties [Q22], 30.2% compared to 13.7%.
Figure V.13: Question 22 by Child’s Eligibility for FRPL
Q22. My child has been sent home from school, but not suspended, due to behavioral difficulties.
Note: The diamond equals high-level agreement (i.e., moderately + strongly). The bar equals total agreement (i.e., plus slightly agree). The percentage for highly agree is not included due to space limitations.
Beyond this one question, there were a few small differences in response patterns by FRPL eligibility, particularly in the parent training and support section of the survey [Q26-Q29].
Parents of children eligible for free and reduced price lunch were slightly more likely to indicate they have attended parent training or information sessions during the past year [Q26] compared to parents of children not eligible (44.3% and 38.1%, respectively).
In addition, when asked if they are involved in a support network for parents of students with disabilities [Q27], parents of children eligible for free and reduced price lunch were again slightly more likely to agree than parents of children not eligible (38.2% and 30.0%, respectively).
Figure V.14: Questions 26 and 27 by Child’s Eligibility for FRPL
Q26. In the past year, I have attended parent training or information sessions (provided by my district, other districts or agencies) that addressed the needs of parents and of children with disabilities.
Q27. I am involved in a support network for parents of students with disabilities available through my school district or other sources.
Note: The diamond equals high-level agreement (i.e., moderately + strongly). The bar equals total agreement (i.e., plus slightly agree).
21 The total number of survey respondents by FRPL eligibility included: Non-FRPL (n=2,946) and FRPL (n=1,019).
13.7%
30.2%
Non-FRPL
FRPL
44.3%
38.1%
33.9%
29.1%
FRPL
Non-FRPL
38.2%
30.0%
27.8%
21.3%
FRPL
Non-FRPL

~ 32 ~
DIFFERENCES BY SURVEY YEAR Section VI
This final section of the report presents survey trends across the past three years - first for survey delivery and response rate, and then for parent responses. Any notable year-over-year changes are presented, as well as any identifiable three-year trends. Trends in parent responses are illustrated as stacked line graphs, with the first line representing the percentage of parents to express “total” agreement (i.e., slightly + moderately + strongly) in each year, followed by a second line that illustrates the percentage of parents to express “high-level” agreement (i.e., moderately +strongly). The discussion is brief as most differences were of a relatively small magnitude. (See Appendix G for differences across years for all survey items.) Survey Delivery and Response Rate As was previously discussed, implementation of this year’s survey was done on a larger scale, with the survey sent to 56 school districts; an increase from 31 districts in 2013-14 and 29 districts in 2012-13 (see Table VI.1). As is shown in the table, this year’s response rate fell by almost five percentage points, returning to the same rate as the 2012-13 survey. Similarly, there was also a small uptick in this year’s non-deliverable mail rate, also comparable to the 2012-13 survey.
Table VI.1: Survey Response Rate by Year
Year Districts Surveys
Sent Surveys
Received Response
Rate Non-Deliverable
Mail Rate
2012-2013 29 9,811 2,091 21.3% 4.7%
2013-2014 31 10,545 2,761 26.2% 2.3%
2014-2015 56 18,634 3,965 21.3% 4.8%
Summary of Survey Responses A comparison of parent responses across the past three years revealed mostly incremental changes. Although there was a general downward trend when this year’s responses were compared to last year, most of the changes were very small, with the difference exceeding more than five percentage points on only two survey items. However, these two items were part of an overall trend that showed lower levels of satisfaction with secondary transition services this year compared to both of the prior two years. Four of the statements from that section are highlighted below.22
The largest across year disparity occurred when parents were asked if outside agencies have been invited to participate in secondary transition planning [Q34]. About one-half (50.5%) of parents agreed in 2014-15 compared to 61.1% of parents in 2013-14, a decrease of almost 11 percentage points. In addition, parents in 2014-15 were also about 6 percentage points less likely to agree than parents in 2012-13.
The next largest difference was evident when parents were asked if the PPT discussed an appropriate course of study at the high school [Q37], with 83.2% of parents in agreement in 2014-15 compared to 89.5% of parents in 2013-14, a decrease of about 6 percentage points. Parents in 2014-15 were also about 3 percentage points less likely to agree than parents in 2012-13.
22 The age-specific nature of transition planning naturally restricts the number of parents for which these questions are applicable, and as a result, considerably fewer parents answered questions in this section. The total number of respondents for the secondary transition questions by year included: 2012-13 (n=676), 2013-14 (n=765), and 2014-15 (n=917).

~ 33 ~
While the gap was somewhat smaller when parents were asked if the PPT introduced planning for their child’s transition to adulthood [Q35], parents in 2014-15 were again the least likely to agree. Less than three-quarters (72.8%) of parents in 2014-15 agreed compared to 77.6% of parents in 2013-14 and 75.2% of parents in 2012-13, a decline of about 5 percentage points and 2 percentage points, respectively.
Lastly, when asked if the PPT developed individualized goals for their child related to employment/ postsecondary education, independent living, and community participation [Q38], less than three-quarters (73.5%) of parents agreed in 2014-15 compared to 78.3% of parents in 2013-14 and 75.3% of parents in 2012-13. This was again a decline of about 5 percentage points and 2 percentage points, respectively.
Figure VI.2: Questions 34, 35, 37, and 38 by Year
Q34. When appropriate, outside agencies have been invited to participate in secondary transition planning.
Q35. The PPT introduced planning for my child's transition to adulthood.
Q37. The PPT discussed an appropriate course of study at the high school for my child.
Q38. The PPT developed individualized goals for my child related to employment/ postsecondary education, independent living and community participation, if appropriate.
2012-13 2013-14 2014-15 2012-13 2013-14 2014-15
Total Agree (Slightly + Moderately + Strongly) High-Level Agree (Moderately + Strongly)
In contrast, the parent training and support section of the survey showed evidence of a two-year upward trend on the two statements related to the availability of training supports and networks. Although the statements related to attendance were down from last year, agreement levels were still higher than they had been in 2012-13.
About two in five (39.8%) parents in 2014-15 agreed that opportunities are available in their district for parent training sessions [Q28] compared to 36.6% of parents in 2013-14 and 34.8% of parents in 2012-13, a two-year increase of 5 percentage points.
Similarly, roughly two in five (39.4%) parents in 2014-15 agreed that a support network is available for parents of students with disabilities in their district [Q29] compared to 37.4% of parents in 2013-14 and 34.4% of parents in 2012-13. This was again a two-year increase of 5 percentage points.
The pattern was slightly different when parents were asked about their involvement in training [Q26] or support networks [Q27], with parents in 2014-15 slightly less likely to agree with these two statements than parents in 2013-14. However, this year’s parents were still more likely to agree than parents in 2012-13, about a 5 percentage point increase in regards to attendance at parent training (39.7% and 34.6%, respectively) and about a 2 percentage point increase in regards to their involvement in a support network (32.2% and 30.1%, respectively).
56.1% 61.1% 50.5%
46.4% 48.2% 41.2%
75.2% 77.6% 72.8%
58.9% 62.4% 61.0%
86.4% 89.5% 83.2%
76.3% 78.7% 73.5%
75.3% 78.3% 73.5%
60.5% 62.7% 59.4%

~ 34 ~
Figure VI.2: Questions 26, 27, 28, and 29 by Year
Q26. In the past year, I have attended parent training or information sessions (provided by my district, other districts or agencies) that addressed the needs of parents and of children with disabilities.
Q27. I am involved in a support network for parents of students with disabilities available through my school district or other sources.
Q28. There are opportunities for parent training or information sessions regarding special education provided by my child’s school district.
Q29. A support network for parents of students with disabilities is available to me through my school district or other sources.
2012-13 2013-14 2014-15 2012-13 2013-14 2014-15
Total Agree (Slightly + Moderately + Strongly) High-Level Agree (Moderately + Strongly)
Lastly, there was also a two year positive trend on the survey item that asked parents if their child had been sent home from school, but not suspended, due to behavioral difficulties. (Note that on this question, a decline in agreement is evidence of parent satisfaction).
In 2014-15, 18.1% of parents agreed that their child has been sent home from school due to behavioral difficulties [Q22] compared to 20.5% of parents in 2013-14 and 23.0% of parents in 2012-13. This was a two-year improvement of almost 5 percentage points.
Figure VI.1: Question 22 by Year
Q22. My child has been sent home from school, but not suspended, due to behavioral difficulties.
2012-13 2013-14 2014-15
Total Agree (Slightly + Moderately + Strongly) High-Level Agree (Moderately + Strongly)
34.6% 40.7% 39.7%
27.9% 32.3% 30.3%
30.1% 34.2% 32.2%
22.3% 25.4% 23.0%
34.8% 36.6% 39.8%
25.0% 26.4% 30.3%
34.4% 37.4% 39.4%
26.7% 28.9% 30.7%
23.0% 20.5% 18.1%
17.3% 14.5% 14.9%

~ 35 ~ Appendix A
APPENDIX A PARENT SURVEY COHORTS

~ 36 ~ Appendix A
Appendix A: Parent Survey Cohorts
In 2014, the parent survey distribution cycle was changed from a six–year rotation to a three-year rotation to align with the CSDE’s Focused Monitoring System. Each of the state’s 170 school districts were assigned to one of three cohorts (see Table A.1). Districts in Cohort A (n=56) received the parent survey during the 2014-2015 school year; while districts in Cohort B (n=51) and Cohort C (n=63) will receive the survey in 2015-2016 and 2016-2017, respectively.
Table A.1: Parent Survey Cohorts
COHORT A 2014-2015
(n=56)
Andover Barkhamsted Bethel Bolton Bozrah Colebrook Cromwell Eastford East Haddam East Hampton East Lyme East Windsor Enfield* Glastonbury*
Granby Hartford* Hebron Litchfield Madison Marlborough Meriden* Montville Naugatuck* New Canaan New Fairfield New Hartford Newtown Norfolk
Norwich* Plainfield Plymouth Preston Putnam Rocky Hill Sherman Simsbury Southington* Stamford* Sterling Thomaston Voluntown Wallingford*
West Hartford* West Haven* Wethersfield Windsor Region 7 Region 8 Region 13 Region 14 Region 15 Region 16 Region 17 Region 18 Unified 1 Unified 2
COHORT B 2015-2016
(n=51)
Ansonia Avon Berlin Bethany Bloomfield Canterbury Cheshire Chester Clinton Columbia Danbury* Darien Deep River
East Granby East Haven Essex Fairfield* Franklin Greenwich* Groton* Guilford Lebanon Lisbon Middletown* Milford* New Haven*
Newington New Milford* North Branford Norwalk* Old Saybrook Orange Pomfret Portland Ridgefield Seymour Somers Stafford Stonington
Tolland Torrington* Union Waterbury* Windham Wolcott Woodbridge Woodstock Region 4 Region 5 Region 10 Region 12
COHORT C 2016-2017
(n=63)
Ashford Branford Bridgeport* Bristol* Brookfield Brooklyn Canaan Canton Chaplin Colchester Cornwall Coventry Derby East Hartford* Easton Ellington
Farmington Griswold Hamden* Hampton Hartland Kent Killingly Ledyard Manchester* Mansfield Monroe New Britain* New London* North Canaan North Haven North Stonington
Oxford Plainville Redding Salem Salisbury Scotland Sharon Shelton* South Windsor Sprague Stratford* Suffield Thompson Trumbull* Vernon Waterford
Watertown Westbrook Weston Westport Willington Wilton Winchester Windsor Locks Region 1 Region 6 Region 9 Region 11 Region 19 DMHAS CTHSS*
Note: A (*) indicates that a simple random sample of parents of children with an IEP or Services Plan were/will be selected to receive the survey. A confidence level of 95.0% and a margin of error of 2.0% were used to determine the sample size. DMHAS=Department of Mental Health and Addiction Services and CTHSS=Connecticut Technical High School System.

~ 37 ~ Appendix B
APPENDIX B PARENT SURVEY DOCUMENTS
B.1 2014-15 Cover Letter B.2 2014-15 Parent Survey

~ 38 ~ Appendix B.1
S T A T E O F C O N N E C T I C U T DEPARTMENT OF EDUCATION
P.O. BOX 2219 | HARTFORD, CONNECTICUT 06145 An Equal Opportunity Employer
«SurveyID» Appendix B.1: Parent Survey Cover Letter
To the Parent/Guardian of: «FirstName» «LastName» «Address1» «Address2» «City», «State» «Zip» Dear Parent/Guardian,
We need your help. You have been selected to participate in the 2014-2015 Connecticut Special Education Parent Survey. Information from this statewide survey will be used to monitor parent engagement as a way to improve services and results for Connecticut students with disabilities. Please complete the survey according to your experiences with the child identified above. If you have more than one child with a disability, you may receive additional surveys in the mail. If you are a foster parent and your child was appointed a surrogate parent, please complete the survey together.
Participation is easy. Please complete the attached paper survey and return it in the enclosed prepaid envelope to Glen Martin Associates, the independent evaluator, or complete it online at bit.ly/CTparent1415. It should only take 10-15 minutes to complete the survey. If you complete it online, all you will need is the seven-digit survey code located in the upper right hand corner of this letter (or in the upper right hand corner of the survey). This survey code is unique to your child. All of your responses will be kept strictly confidential. Only Glen Martin Associates and the Connecticut State Department of Education (CSDE) will have direct access to this information. The responses will be combined and there will be no identification of individuals.
Questions? If you have any questions, please contact Marcus E. Rivera, Education Consultant, Bureau of Special Education, CSDE at 860.713.6932 or by e-mail at [email protected]. Or, if you need assistance completing the survey, please contact the Connecticut Parent Advocacy Center (CPAC) at 1.800.445.CPAC or by e-mail at [email protected]. All CPAC services are free for parents and all information is kept confidential.
Thank you for your participation! Your feedback is essential to help your school district to continue to advance parent engagement as a fundamental way to improve services and results for children with disabilities. In an effort to improve outcomes for students, the CSDE and CPAC would like to share educational resources that may be helpful to you. Information about how to access these resources is at the end of the online version of the survey, and is also included in the enclosed materials.
Sincerely,
Marcus E. Rivera Education Consultant Bureau of Special Education
*****Al otro lado de esta página se encuentra esta carta en español. *****

Appendix B.2: 2014–2015 Connecticut Special Education Parent Survey
Continue on the next page
~ 39 ~ Appendix B.2
Please share your thoughts and experiences regarding your child’s special education program. If you have more than one child who receives special
education services, please locate the name of the child on the cover letter you received with this survey and complete the survey according to your
experiences with this child. All of your responses will be confidential. Only Glen Martin Associates and the Connecticut State Department of
Education will have direct access to this information.
Please return your survey in the prepaid envelope to: Glen Martin Associates, 41 State Street, Suite 604-02, Albany, NY 12207.
This survey is also available online. Please go to bit.ly/CTparent1415 and log in using the seven-digit number located in the upper right
hand corner of this page.
The survey due date is September 18, 2015. Thank you for completing this important survey!
Please report your experience with your child’s special education program over the past 12 months. Please note additional questions are on the
back of this survey.
1. I am satisfied with my child’s overall special education program. ⃝ ⃝ ⃝ ⃝ ⃝ ⃝
2. I have the opportunity to talk to my child’s teachers on a regular basis to discuss my questions and
concerns. ⃝ ⃝ ⃝ ⃝ ⃝ ⃝
3. My child is accepted within the school community. ⃝ ⃝ ⃝ ⃝ ⃝ ⃝
4. My child’s Individualized Education Program (IEP) is meeting his or her educational needs. ⃝ ⃝ ⃝ ⃝ ⃝ ⃝ ⃝
5. All special education services identified in my child’s IEP have been provided. ⃝ ⃝ ⃝ ⃝ ⃝ ⃝ ⃝
6. Staff is appropriately trained and able to provide my child’s specific program and services. ⃝ ⃝ ⃝ ⃝ ⃝ ⃝ ⃝
7. Special education teachers make accommodations and modifications as indicated on my child’s IEP. ⃝ ⃝ ⃝ ⃝ ⃝ ⃝ ⃝
8. General education teachers make accommodations and modifications as indicated on my child’s IEP. ⃝ ⃝ ⃝ ⃝ ⃝ ⃝ ⃝
9. General education and special education teachers work together to assure that my child’s IEP is
being implemented. ⃝ ⃝ ⃝ ⃝ ⃝ ⃝ ⃝
10. In my child’s school, administrators and teachers encourage parent involvement in order to improve
services and results for children with disabilities. ⃝ ⃝ ⃝ ⃝ ⃝ ⃝
11. At meetings to develop my child’s Individualized Education Program (IEP), I feel encouraged to give
input and express my concerns. ⃝ ⃝ ⃝ ⃝ ⃝ ⃝
12. I understand what is discussed at meetings to develop my child’s IEP. ⃝ ⃝ ⃝ ⃝ ⃝ ⃝
13. My concerns and recommendations are documented in the development of my child’s IEP. ⃝ ⃝ ⃝ ⃝ ⃝ ⃝
14. My child’s evaluation report is written in terms I understand. ⃝ ⃝ ⃝ ⃝ ⃝ ⃝
15. Planning and Placement Team (PPT) meetings for my child have been scheduled at times and places
that met my needs. ⃝ ⃝ ⃝ ⃝ ⃝ ⃝
16. At my child’s PPT, the school district proposed programs and services to meet my child’s individual
needs. ⃝ ⃝ ⃝ ⃝ ⃝ ⃝
17. When we implement my child’s IEP, I am encouraged to be an equal partner with my child’s teachers
and other service providers. ⃝ ⃝ ⃝ ⃝ ⃝ ⃝
18. I have received a copy of my child’s IEP within 10 school days after the PPT. ⃝ ⃝ ⃝ ⃝ ⃝ ⃝
19. If necessary, a translator was provided at the PPT meetings. ⃝ ⃝ ⃝ ⃝ ⃝ ⃝
20. The translation services provided at the PPT meetings were useful and accurate. ⃝ ⃝ ⃝ ⃝ ⃝ ⃝
21. The school district proposed the regular classroom for my child as the first placement option. ⃝ ⃝ ⃝ ⃝ ⃝ ⃝ ⃝
22. My child has been sent home from school, but not suspended, due to behavioral difficulties. ⃝ ⃝ ⃝ ⃝ ⃝ ⃝
23. My child has the opportunity to participate in school-sponsored activities such as field trips,
assemblies and social events (dances, sports events). ⃝ ⃝ ⃝ ⃝ ⃝ ⃝
«SurveyID»

Thank you for your valuable response!
~ 40 ~ Appendix B.2
24. My child has the opportunity to participate in extracurricular school activities such as sports or clubs
with children without disabilities. ⃝ ⃝ ⃝ ⃝ ⃝ ⃝
25. My child’s school provides supports, such as extra staff, that are necessary for my child to participate
in extra-curricular school activities (for example, clubs and sports). ⃝ ⃝ ⃝ ⃝ ⃝ ⃝ ⃝
26. In the past year, I have attended parent training or information sessions (provided by my district,
other districts, or agencies) that addressed the needs of parents and of children with disabilities. ⃝ ⃝ ⃝ ⃝ ⃝ ⃝
27. I am involved in a support network for parents of students with disabilities available through my
school district or other sources. ⃝ ⃝ ⃝ ⃝ ⃝ ⃝
28. There are opportunities for parent training or information sessions regarding special education
provided by my child’s school district. ⃝ ⃝ ⃝ ⃝ ⃝ ⃝ ⃝
29. A support network for parents of students with disabilities is available to me through my school
district or other sources. ⃝ ⃝ ⃝ ⃝ ⃝ ⃝ ⃝
30. My child is learning skills that will enable him/her to be as independent as possible. ⃝ ⃝ ⃝ ⃝ ⃝ ⃝
31. My child is learning skills that will lead to a high school diploma, further education, or a job. ⃝ ⃝ ⃝ ⃝ ⃝ ⃝
Only complete the following question if: your child has transitioned from the early intervention Birth to Three System to Preschool in the past 3
years.
32. I am satisfied with the school district’s transition activities that took place when my child left Birth to
Three. ⃝ ⃝ ⃝ ⃝ ⃝ ⃝
Only complete the following questions if: your child was 15 years of age or older at his/her last PPT meeting.
33. I am satisfied with the way secondary transition services were implemented for my child. ⃝ ⃝ ⃝ ⃝ ⃝ ⃝
34. When appropriate, outside agencies have been invited to participate in secondary transition
planning. ⃝ ⃝ ⃝ ⃝ ⃝ ⃝ ⃝
35. The PPT introduced planning for my child’s transition to adulthood. ⃝ ⃝ ⃝ ⃝ ⃝ ⃝
36. The school district actively encourages my child to attend and participate in PPT meetings. ⃝ ⃝ ⃝ ⃝ ⃝ ⃝
37. The PPT discussed an appropriate course of study at the high school for my child. ⃝ ⃝ ⃝ ⃝ ⃝ ⃝
38. The PPT developed individualized goals for my child related to employment/postsecondary
education, independent living, and community participation, if appropriate. ⃝ ⃝ ⃝ ⃝ ⃝ ⃝
Primary Disability: (Choose only one.) Please mark the primary disability listed on page 1 of your child’s Individualized Education Program (IEP)
or Services Plan. (Please note that Specific Learning Disabilities/Dyslexia will be added to the survey after the first State collection of this category
in October 2015.)
⃝ Autism ⃝ Specific Learning Disabilities
⃝ Deaf-Blindness ⃝ Speech or Language Impaired
⃝ Developmental Delay (ages 3-5 only) ⃝ Traumatic Brain Injury
⃝ Emotional Disturbance ⃝ Visual Impairment
⃝ Hearing Impairment (Deaf or Hard of Hearing) ⃝ Other Health Impairment (OHI)
⃝ Intellectual Disability ⃝ OHI – ADD/ADHD
⃝ Multiple Disabilities ⃝ To Be Determined
⃝ Orthopedic Impairment ⃝ Don’t Know
Additional Feedback: Please use this space to comment on your experiences with your child’s special education program. These comments may
refer to your experiences overall and are not limited to the past 12 months. You may include an additional page for comments, as needed.

~ 41 ~ Appendix C
APPENDIX C SURVEY DELIVERY & RESPONSE RATE

~ 42 ~ Appendix C
Appendix C: Survey Delivery & Response Rate
The 2014-2015 survey was sent to a total of 18,634 parents of children receiving special education services across 56 districts. The overall survey response rate was 21.3% (n=3,965), with the response rate by district ranging from a low of 2.4% in Unified School District 2 to a high of 59.3% in the Eastford School District. A total of 895 surveys were returned non-deliverable, representing 4.8% of the total mailing. One-third (33.3%, n=298) of those returned non-deliverable were from the Hartford School District.
Table C.1: Survey Response Rate by District
District
Surveys Completed
Of Surveys Completed Surveys Sent Non-Deliverable Rate
Online In
Spanish With
Comments Mailed
Also Emailed
Mailed Emailed
n % % % % n % % %
Eastford 16 59.3% 37.5% 0.0% 31.3% 27 92.6% 0.0% 4.0%
Rocky Hill 103 37.9% 52.4% 0.0% 43.7% 272 82.7% 4.4% 4.9%
Region 15 203 37.7% 60.6% 0.0% 46.3% 538 90.5% 0.7% 3.1%
Region 13 106 37.1% 37.7% 0.9% 38.7% 286 94.4% 1.0% 20.0%
Marlborough 19 33.9% 52.6% 0.0% 31.6% 56 94.6% 1.8% 17.0%
New Hartford 20 33.9% 55.0% 0.0% 50.0% 59 91.5% 3.4% 3.7%
Sherman 24 32.4% 50.0% 0.0% 62.5% 74 98.6% 5.4% 2.7%
Litchfield 39 31.7% 51.3% 0.0% 48.7% 123 83.7% 1.6% 7.8%
New Canaan 127 30.5% 56.7% 0.8% 43.3% 417 99.5% 1.0% 0.2%
Region 8 67 30.2% 47.8% 0.0% 37.3% 222 92.8% 0.9% 1.5%
Southington* 189 30.1% 63.5% 1.1% 43.9% 627 87.1% 2.1% 4.2%
Sterling 24 30.0% 45.8% 0.0% 45.8% 80 55.0% 1.3% 4.5%
Newtown 140 29.7% 57.1% 0.0% 50.0% 471 90.7% 1.1% 2.1%
Barkhamsted 13 28.9% 30.8% 0.0% 23.1% 45 40.0% 0.0% 5.6%
Simsbury 175 28.6% 54.3% 0.6% 52.0% 612 84.8% 1.5% 5.4%
Bolton 27 28.4% 66.7% 0.0% 55.6% 95 96.8% 4.2% 21.7%
West Hartford* 231 28.1% 48.5% 4.8% 39.0% 821 82.3% 1.5% 6.4%
Region 14 50 27.8% 42.0% 0.0% 44.0% 180 91.1% 0.6% 6.1%
Hebron 34 27.0% 35.3% 0.0% 41.2% 126 91.3% 2.4% 21.7%
Bozrah 10 26.3% 0.0% 10.0% 50.0% 38 73.7% 2.6% 21.4%
East Haddam 47 26.3% 57.4% 0.0% 42.6% 179 88.3% 1.7% 16.5%
Wallingford* 146 25.7% 49.3% 6.8% 37.0% 568 72.4% 2.6% 4.9%
Glastonbury* 130 25.6% 56.9% 1.5% 38.5% 508 95.9% 2.0% 1.4%
New Fairfield 66 25.3% 57.6% 0.0% 53.0% 261 97.3% 0.4% 0.4%
Region 16 86 25.3% 47.7% 0.0% 33.7% 340 91.5% 2.9% 10.6%
Granby 55 25.2% 67.3% 0.0% 40.0% 218 95.0% 2.8% 6.8%
Region 18 46 25.0% 45.7% 0.0% 47.8% 184 92.4% 0.0% 8.2%
Thomaston 39 24.8% 35.9% 2.6% 35.9% 157 59.9% 1.9% 4.3%
Wethersfield 138 24.3% 50.7% 0.0% 33.3% 568 83.5% 1.1% 7.0%
Region 17 80 23.5% 58.8% 0.0% 27.5% 340 97.1% 1.5% 12.1%
East Lyme 85 23.2% 37.6% 1.2% 36.5% 366 49.5% 2.2% 4.4%
Bethel 78 23.1% 41.0% 2.6% 25.6% 338 89.6% 0.9% 14.2%
Table is continued on the next page.

~ 43 ~ Appendix C
Table C.1: Survey Response Rate by District (continued)
District
Surveys Completed
Of Surveys Completed Surveys Sent Non-Deliverable Rate
Online In
Spanish With
Comments Mailed
Also Emailed
Mailed Emailed
n % % % % n % % %
East Windsor 48 20.8% 27.1% 6.3% 33.3% 231 44.6% 9.1% 4.9%
Region 7 23 19.8% 34.8% 0.0% 43.5% 116 29.3% 0.9% 17.6%
Madison 74 19.3% 18.9% 0.0% 44.6% 384 0.0% 1.8% --
Andover 4 19.0% 25.0% 0.0% 75.0% 21 100.0% 0.0% 19.0%
Naugatuck* 96 18.1% 34.4% 4.2% 30.2% 530 65.1% 3.4% 8.4%
Stamford* 189 18.1% 38.6% 10.6% 37.6% 1,044 41.7% 4.1% 9.0%
Windsor 113 17.9% 52.2% 0.9% 34.5% 633 73.8% 2.8% 9.4%
Preston 18 15.9% 50.0% 0.0% 33.3% 113 63.7% 1.8% 11.1%
Plymouth 40 15.8% 37.5% 0.0% 37.5% 253 62.8% 5.9% 6.9%
Meriden* 143 15.1% 34.3% 12.6% 30.1% 950 33.9% 9.4% 8.1%
East Hampton 26 14.6% 23.1% 0.0% 42.3% 178 55.1% 0.6% 9.2%
Norfolk 3 14.3% 33.3% 0.0% 0.0% 21 85.7% 4.8% 0.0%
Montville 46 13.7% 17.4% 2.2% 21.7% 336 17.6% 3.6% 13.6%
Cromwell 33 13.6% 42.4% 0.0% 39.4% 242 85.5% 3.7% 22.2%
Enfield* 79 12.9% 22.8% 0.0% 30.4% 613 4.7% 3.8% 6.9%
West Haven* 95 12.9% 13.7% 13.7% 26.3% 736 0.0% 7.2% --
Putnam 25 12.8% 40.0% 4.0% 28.0% 196 57.1% 3.1% 8.0%
Colebrook 3 12.5% 33.3% 0.0% 0.0% 24 8.3% 4.2% 0.0%
Plainfield 37 12.0% 13.5% 0.0% 27.0% 308 23.4% 2.6% 16.7%
Norwich* 78 11.2% 19.2% 7.7% 35.9% 694 16.1% 12.5% 10.7%
Voluntown 7 10.8% 0.0% 0.0% 14.3% 65 20.0% 1.5% 23.1%
Hartford* 152 10.3% 23.0% 21.1% 27.6% 1,481 20.4% 20.1% 15.6%
Unified 1 18 9.8% 0.0% 5.6% 5.6% 184 0.0% 6.5% --
Unified 2 2 2.4% 0.0% 0.0% 50.0% 85 0.0% 18.8% --
Total 3,965 21.3% 44.3% 3.4% 38.4% 18,634 58.5% 4.8% 7.7%
Note: Districts have been sorted in descending order based on their response rate. A (*) indicates that a simple random sample of parents of children with an IEP or Services Plan were selected to receive the survey. A confidence level of 95.0% and a margin of error of 2.0% were used to determine the sample size.

~ 44 ~ Appendix D
APPENDIX D METHODOLOGICAL & DATA LIMITATIONS

~ 45 ~ Appendix D
Appendix D: Methodological & Data Limitations
There are a number of important methodological and data issues that should be considered when interpreting the Connecticut Special Education Parent Survey results. Like all sample surveys, the data collected in the parent survey are an estimate of the true proportion in the population and consequently are subject to some degree of error. Survey error is defined as the “systematic deviation of the survey-estimated value from the true population value; typically composed of two components – sampling error and nonsampling error.23” The following section discusses two potential sources of nonsampling survey error – nonresponse bias and measurement error – followed by a discussion of sample bias and its relationship to the representativeness of the parent survey sample. Nonresponse Bias Nonresponse bias is associated with two factors – the response rate and the degree to which those who respond to a survey are systematically different from those who do not respond. This year’s parent survey response rate was 21.3% and although comparable to other statewide parent survey response rates; it would still be considered relatively low and suggests the potential for nonresponse bias exists.24 The second factor of nonresponse bias is much more difficult to measure as it requires estimating the degree to which differences in respondent and nonrespondent characteristics (such as the child’s disability) may affect the variable of interest (survey response). However, by comparing the response rates of the key subgroups of the target population, we can gain insight as to differences that do exist and theorize where the potential for bias may be greatest. The following tables include demographic characteristics of students with disabilities included in the 2014-15 survey sample.25 “Respondents” include all students with disabilities whose parents returned a completed survey; whereas “nonrespondents” include all students with disabilities whose parents were mailed, but did not return, a completed survey. The differences in percentage points between the respondent and the nonrespondent groups are provided, as well as the margin of error of the differences.26
23 Office of Management and Budget. Standards and Guidelines for Statistical Surveys. (September 2006).
24 The National Center for Education Statistics (NCES) suggests that any survey with a response rate less than 80% be evaluated for nonresponse bias.
25 In order to compare the response rates of key subgroups, the CSDE demographic data were aligned with confidential IDs included on all survey mailings. All demographic data presented in this section reflects state-reported data.
26 The margin of error of the difference represents the 95% confidence interval around the estimate such that if the difference is +5% with a margin of error of ±1%, we can be 95% confident that the true difference is between +4% and +6%.

~ 46 ~ Appendix D
Tables D.1 and D.2 include a comparison of the gender and age of students with disabilities for 2014-15 parent survey respondents and nonrespondents. These data suggest that parents of male students were slightly more likely to respond to the survey (i.e., over-represented in the respondent group) compared to parents of female students, whom are slightly under-represented in the respondent group. In addition, parents of younger children (ages 3 to 5 and 6 to 12) were slightly more likely to respond to the survey compared to parents of children ages 15 to 17 and ages 18-21, whom are slightly under-represented in the respondent group.
Table D.1: Response Rate by Gender
Child’s Gender Surveys Sent (n=18,634)
Respondents (n=3,965)
Nonrespondents (n=14,669)
Difference (Resp.-Nonresp.)
Margin of Error of Difference
Male* 67.3% 69.2% 66.8% 2.4% ± 1.6%
Female* 32.7% 30.8% 33.2% (2.4%) ± 1.6%
Note: A * denotes statistical significance at 95% confidence interval; χ2=8.3, df=1, p=.004.
Table D.2: Response Rate by Age
Child’s Age Surveys Sent (n=18,634)
Respondents (n=3,965)
Nonrespondents (n=14,669)
Difference (Resp.-Nonresp.)
Margin of Error of Difference
3 to 5* 11.9% 13.7% 11.4% 2.3% ± 1.2%
6 to 12* 45.2% 48.5% 44.3% 4.2% ± 1.8%
13 to 14 15.0% 15.1% 15.0% 0.1% ± 1.3%
15 to 17* 22.0% 18.2% 23.1% (4.9%) ± 1.4%
18 to 21* 5.8% 4.5% 6.1% (1.7%) ± 0.8%
Note: A * denotes statistical significance at 95% confidence interval; χ2=75.5, df=4, p=.000.
The next three tables includes a comparison of the race distribution, socioeconomic status and EL status of students with disabilities for parent survey respondents and nonrespondents. As can be seen in Table D.3 below, parents of white students were more likely to respond to the survey (i.e., over-represented in the respondent group) compared to parents of Hispanic/Latino and Black/African American students, whom are slightly under-represented in the respondent group. Meanwhile, Table D.4 on the next page illustrates a significant inverse relationship between socioeconomic status and parent survey response rates where parents of students with disabilities that are eligible for free or reduced price lunch are substantially under-represented in the respondent group. Differences are less evident in Table D.5 where parents of an English Learner are just slightly under-represented in the respondent group.
Table D.3: Response Rate by Race/Ethnicity
Child’s Race/Ethnicity Surveys Sent (n=18,634)
Respondents (n=3,965)
Nonrespondents (n=14,669)
Difference (Resp.-Nonresp.)
Margin of Error of Difference
White* 61.2% 70.3% 58.7% 11.7% ± 1.6%
Hispanic/Latino of Any Race* 20.2% 15.3% 21.6% (6.2%) ± 1.3%
Black or African American* 12.9% 7.8% 14.2% (6.5%) ± 1.0%
Asian* 2.6% 3.7% 2.3% 1.4% ± 0.6%
American Indian/Alaskan Native 0.4% 0.4% 0.4% 0.1% ± 0.2%
Native Hawaiian or Other Pacific Is. 0.1% 0.2% 0.1% 0.0% ± 0.1%
Two or More Races 2.6% 2.3% 2.7% (0.4%) ± 0.5%
Note: A * denotes statistical significance at 95% confidence interval; χ2=256.2, df=6, p=.000.

~ 47 ~ Appendix D
Table D.4: Response Rate by Free and Reduced Price Lunch
Eligible for Free and Reduced Price Lunch
Surveys Sent (n=18,634)
Respondents (n=3,965)
Nonrespondents (n=14,669)
Difference (Resp.-Nonresp.)
Margin of Error of Difference
Free & Reduced Lunch* 41.4% 25.7% 45.6% (19.9%) ± 1.6%
Not Eligible* 58.6% 74.3% 54.4% 19.9% ± 1.6%
Note: A * denotes statistical significance at 95% confidence interval; χ2=509.0, df=1, p=.000.
Table D.5: Response Rate by English Learner Status
English Learner Surveys Sent (n=18,634)
Respondents (n=3,965)
Nonrespondents (n=14,669)
Difference (Resp.-Nonresp.)
Margin of Error of Difference
Yes* 6.7% 5.3% 7.1% (1.7%) ± 0.8%
No* 93.3% 94.7% 92.9% 1.7% ± 0.8%
Note: A * denotes statistical significance at 95% confidence interval; χ2=15.3, df=1, p=.000.
Lastly, the final table includes a comparison of the primary eligibility for services of students with disabilities for parent survey respondents and nonrespondents. Among particular disability categories, parents of children with autism showed the largest over-representation of parents in the respondent group, while parents of children with specific learning disabilities showed the largest under-representation among respondents.
Table D.6: Response Rate by Disability
Child’s Disability Surveys Sent (n=18,634)
Respondents (n=3,965)
Nonrespondents (n=14,669)
Difference (Resp.-Nonresp.)
Margin of Error of Difference
Specific Learning Disabilities* 30.6% 26.2% 31.8% (5.6%) ± 1.6%
Speech or Language Impaired 16.3% 16.0% 16.4% (0.4%) ± 1.3%
OHI - ADD/ADHD 12.8% 12.4% 12.9% (0.5%) ± 1.2%
Autism* 12.2% 17.3% 10.8% 6.5% ± 1.3%
Emotional Disturbance* 7.0% 4.3% 7.8% (3.4%) ± 0.8%
Other Health Impairment (OHI)* 6.3% 7.1% 6.1% 1.1% ± 0.9%
Developmental Delay (ages 3-5 only)* 5.9% 6.7% 5.7% 1.0% ± 0.9%
Multiple Disabilities* 4.6% 5.4% 4.4% 1.0% ± 0.8%
Intellectual Disability 3.0% 3.3% 3.0% 0.3% ± 0.6%
Hearing Impairment 0.7% 0.8% 0.7% 0.1% ± 0.3%
Visual Impairment 0.2% 0.2% 0.2% 0.0% ± 0.2%
Deaf-Blindness 0.0% 0.0% 0.0% 0.0% ± 0.0%
Orthopedic Impairment 0.1% 0.1% 0.1% (0.1%) ± 0.1%
Traumatic Brain Injury 0.2% 0.2% 0.2% 0.1% ± 0.2%
Note: A * denotes statistical significance at 95% confidence interval; χ2=217.0, df=13, p=.000.

~ 48 ~ Appendix D
Measurement Error Measurement error is typically characterized as the difference between the observed value of a variable and the true value of that variable. In general, the source of measurement error can come from four primary sources; the questionnaire, the data collection method, the interviewer (if applicable) and the respondent.27 Although the following examples from the 2014-15 parent survey do not necessarily identify a “source of error,” they do provide evidence of reporting inconsistencies that could potentially bias survey results. Both examples refer to the instructions given on the survey as to how parents should select the appropriate disability for their child. On the survey questionnaire, parents were asked to select only one disability category to identify their child’s disability. However, as can be seen in the following table, although the majority (92.1%, n=3,432) of survey respondents did select just one disability, 294 parents identified at least two disabilities for their child. Of those respondents who selected multiple categories, OHI-ADD/ADHD was chosen almost one-half (52.4%) of the time; followed by specific learning disability (45.9%) and a speech or language impairment (38.8%) (see Table D.7).
Table D.7: Surveys with Single and Multiple Disability Selections
Child’s Disability
Number of Disabilities Selected by Parent
One More than One
n % n %
Specific Learning Disabilities 713 20.8% 135 45.9%
Autism 676 19.7% 74 25.2%
OHI - ADD/ADHD 566 16.5% 154 52.4%
Speech or Language Impaired 470 13.7% 114 38.8%
Multiple Disabilities 163 4.7% 44 15.0%
Intellectual Disability 144 4.2% 45 15.3%
Other Health Impairment (OHI) 132 3.8% 31 10.5%
Emotional Disturbance 114 3.3% 54 18.4%
Developmental Delay (ages 3-5 only) 105 3.1% 37 12.6%
Hearing Impairment 33 1.0% 14 4.8%
Traumatic Brain Injury 17 0.5% 4 1.4%
Visual Impairment 13 0.4% 18 6.1%
Orthopedic Impairment 9 0.3% 12 4.1%
Deaf-Blindness 3 0.1% 2 0.7%
To Be Determined 50 1.5% 12 4.1%
Don’t Know 224 6.5% 17 5.8%
Total Disability Categories Selected 3,432 100.0% 767 --
Note: Percentages are based on the number of respondents in each column: 3,432 respondents selected one disability for their child; whereas 294 respondents identified multiple (n=767) disabilities (and 239 respondents did not answer the question).
In selecting a disability for their child, the survey questionnaire asked parents to choose the disability category that corresponds with the disability category listed on their child’s IEP form (which school districts report to the CSDE). The responses indicated by parents were compared (through a confidential ID system) to the disability of the child as reported to the CSDE. Again,
27 Office of Management and Budget. Statistical Working Paper 31: Measuring and Reporting Sources of Error in Surveys. (July 2001).
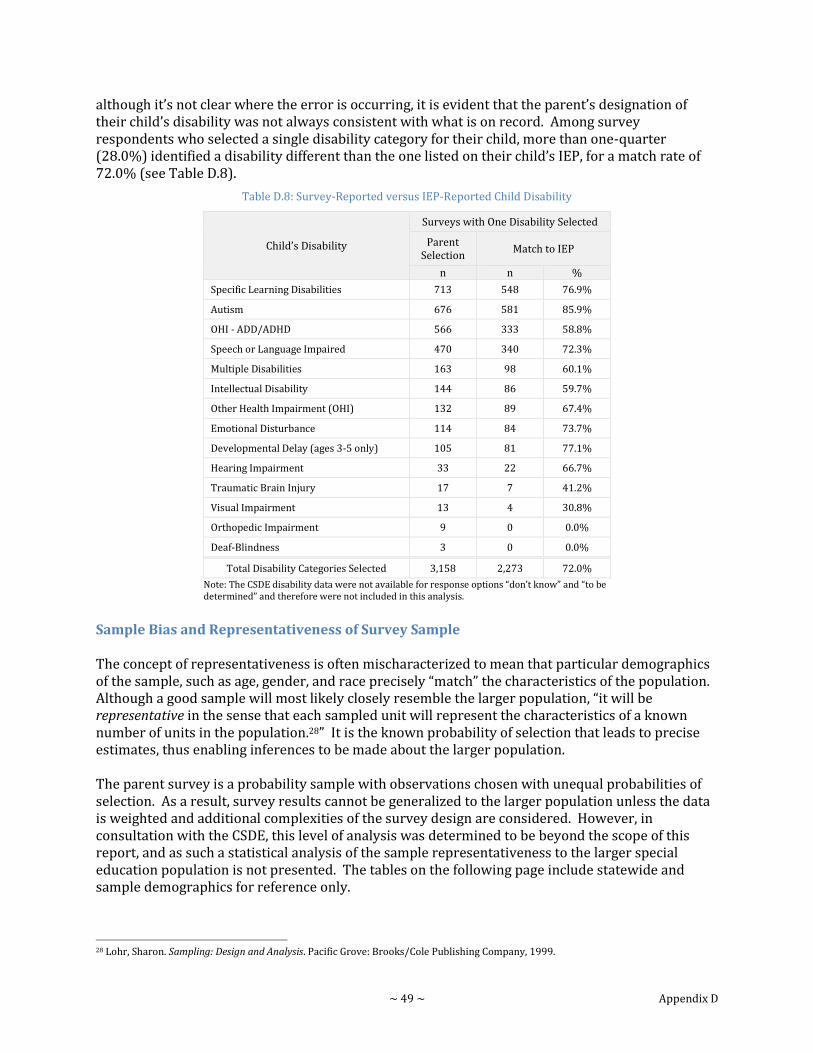
~ 49 ~ Appendix D
although it’s not clear where the error is occurring, it is evident that the parent’s designation of their child’s disability was not always consistent with what is on record. Among survey respondents who selected a single disability category for their child, more than one-quarter (28.0%) identified a disability different than the one listed on their child’s IEP, for a match rate of 72.0% (see Table D.8).
Table D.8: Survey-Reported versus IEP-Reported Child Disability
Child’s Disability
Surveys with One Disability Selected
Parent Selection
Match to IEP
n n %
Specific Learning Disabilities 713 548 76.9%
Autism 676 581 85.9%
OHI - ADD/ADHD 566 333 58.8%
Speech or Language Impaired 470 340 72.3%
Multiple Disabilities 163 98 60.1%
Intellectual Disability 144 86 59.7%
Other Health Impairment (OHI) 132 89 67.4%
Emotional Disturbance 114 84 73.7%
Developmental Delay (ages 3-5 only) 105 81 77.1%
Hearing Impairment 33 22 66.7%
Traumatic Brain Injury 17 7 41.2%
Visual Impairment 13 4 30.8%
Orthopedic Impairment 9 0 0.0%
Deaf-Blindness 3 0 0.0%
Total Disability Categories Selected 3,158 2,273 72.0%
Note: The CSDE disability data were not available for response options “don’t know” and “to be determined” and therefore were not included in this analysis.
Sample Bias and Representativeness of Survey Sample The concept of representativeness is often mischaracterized to mean that particular demographics of the sample, such as age, gender, and race precisely “match” the characteristics of the population. Although a good sample will most likely closely resemble the larger population, “it will be representative in the sense that each sampled unit will represent the characteristics of a known number of units in the population.28” It is the known probability of selection that leads to precise estimates, thus enabling inferences to be made about the larger population. The parent survey is a probability sample with observations chosen with unequal probabilities of selection. As a result, survey results cannot be generalized to the larger population unless the data is weighted and additional complexities of the survey design are considered. However, in consultation with the CSDE, this level of analysis was determined to be beyond the scope of this report, and as such a statistical analysis of the sample representativeness to the larger special education population is not presented. The tables on the following page include statewide and sample demographics for reference only.
28 Lohr, Sharon. Sampling: Design and Analysis. Pacific Grove: Brooks/Cole Publishing Company, 1999.

~ 50 ~ Appendix D
Table D.9: Child’s Gender: Statewide and Sample
Child’s Gender Surveys Sent (n=18,634)
Statewide (n=73,293)
Difference
Male 67.3% 67.7% (0.4%)
Female 32.7% 32.3% 0.4%
Table D.10: Child’s Age: Statewide and Sample
Child’s Age Surveys Sent (n=18,634)
Statewide (n=73,293)
Difference
3 to 5 11.9% 11.5% 0.4%
6 to 12 45.2% 45.5% (0.3%)
13 to 14 15.0% 15.6% (0.6%)
15 to 17 22.0% 22.0% 0.1%
18 to 21 5.8% 5.4% 0.4%
Table D.11: Child’s Race/Ethnicity: Statewide and Sample
Child’s Race/Ethnicity Surveys Sent (n=18,634)
Statewide (n=73,293)
Difference
White 61.2% 52.8% 8.4%
Hispanic/Latino of Any Race 20.2% 26.1% (5.9%)
Black or African American 12.9% 15.9% (3.1%)
Asian 2.6% 2.3% 0.3%
American Indian/Alaskan Native 0.4% 0.3% 0.0%
Native Hawaiian or Other Pacific Is. 0.1% 0.1% 0.0%
Two or More Races 2.6% 2.4% 0.2%
Table D.12: Child’s Grade Level: Statewide and Sample
Child’s Grade Level Surveys Sent (n=18,634)
Statewide (n=73,293)
Difference
Preschool (PreK) 6.9% 6.6% 0.3%
Elementary (K-5) 35.6% 36.3% (0.7%)
Middle (6-8) 23.9% 23.8% 0.1%
High (9-12) 33.5% 33.3% 0.2%
Table D.13: Child’s Disability: Statewide and Sample
Child’s Disability Surveys Sent (n=18,634)
Statewide (n=73,293)
Difference
Specific Learning Disabilities 30.6% 31.9% (1.3%)
Speech or Language Impaired 16.3% 15.5% 0.9%
OHI - ADD/ADHD 12.8% 13.3% (0.5%)
Autism 12.2% 11.3% 0.9%
Emotional Disturbance 7.0% 7.4% (0.3%)
Other Health Impairment (OHI) 6.3% 5.8% 0.5%
Developmental Delay (ages 3-5 only) 5.9% 6.3% (0.4%)
Multiple Disabilities 4.6% 3.9% 0.7%
Intellectual Disability 3.0% 3.3% (0.2%)
Hearing Impairment 0.7% 0.9% (0.1%)
Visual Impairment 0.2% 0.2% 0.0%
Traumatic Brain Injury 0.2% 0.2% 0.0%
Orthopedic Impairment 0.1% 0.1% 0.0%
Deaf-Blindness 0.0% 0.0% 0.0%

~ 51 ~ Appendix E
APPENDIX E SURVEY RESPONSES
E.1 Overall Survey Response Table E.2 Summary of Survey Agreement

~ 52 ~ Appendix E.1
Appendix E.1: Overall Survey Response Table
Parent Survey Item n DISAGREE AGREE
Don’t Know
TOTALS High Level Agree
Strongly Moderately Slightly Slightly Moderately Strongly Disagree Agree
Satisfaction with My Child’s Program
1. I am satisfied with my child’s overall special education program. 3,928 5.8% 3.6% 3.1% 9.3% 32.6% 45.6% ± 12.5% 87.5% 78.2%
2. I have the opportunity to talk to my child's teachers on a regular basis to discuss my questions and concerns.
3,921 2.2% 1.9% 2.7% 8.9% 24.6% 59.8% ± 6.7% 93.3% 84.4%
3. My child is accepted within the school community. 3,908 2.5% 2.5% 3.3% 8.0% 23.8% 60.0% ± 8.3% 91.7% 83.8%
4. My child’s Individualized Education Program (IEP) is meeting his or her educational needs.
3,948 5.9% 4.0% 4.1% 10.4% 30.3% 44.8% 0.6% 13.9% 85.5% 75.1%
5. All special education services identified in my child’s IEP have been provided. 3,904 4.1% 3.4% 3.6% 8.0% 26.2% 53.2% 1.5% 11.1% 87.4% 79.4%
6. Staff is appropriately trained and able to provide my child’s specific program and services.
3,902 4.9% 3.6% 3.6% 8.6% 25.1% 52.1% 2.1% 12.1% 85.8% 77.2%
7. Special education teachers make accommodations and modifications as indicated on my child's IEP.
3,895 2.5% 2.4% 2.6% 8.1% 23.3% 58.5% 2.5% 7.6% 89.9% 81.8%
8. General education teachers make accommodations and modifications as indicated on my child's IEP.
3,865 4.0% 3.3% 4.2% 11.8% 24.6% 46.8% 5.2% 11.6% 83.2% 71.4%
9. General education and special education teachers work together to assure that my child's IEP is being implemented.
3,864 3.6% 3.2% 3.8% 10.9% 23.5% 50.1% 4.9% 10.6% 84.5% 73.6%
Participation in Developing and Implementing My Child’s Program
10. In my child's school, administrators and teachers encourage parent involvement in order to improve services and results for children with disabilities.
3,940 4.5% 2.9% 4.5% 13.3% 23.5% 51.3% ± 11.9% 88.1% 74.8%
11. At meetings to develop my child’s Individualized Education Program (IEP), I feel encouraged to give input and express my concerns.
3,920 3.1% 2.7% 2.8% 7.4% 19.3% 64.8% ± 8.5% 91.5% 84.1%
12. I understand what is discussed at meetings to develop my child’s IEP. 3,914 1.3% 1.1% 2.3% 5.7% 22.8% 66.8% ± 4.6% 95.4% 89.6%
13. My concerns and recommendations are documented in the development of my child's IEP.
3,892 3.7% 2.7% 3.6% 8.5% 24.0% 57.5% ± 10.0% 90.0% 81.5%
14. My child's evaluation report is written in terms I understand. 3,892 2.2% 2.4% 3.3% 9.6% 25.8% 56.7% ± 7.9% 92.1% 82.5%
15. Planning and Placement Team (PPT) meetings for my child have been scheduled at times and places that met my needs.
3,913 2.4% 2.0% 3.3% 6.6% 20.8% 64.9% ± 7.8% 92.2% 85.7%
16. At my child’s PPT, the school district proposed programs and services to meet my child’s individual needs.
3,935 4.3% 4.1% 4.3% 11.4% 25.8% 50.2% ± 12.6% 87.4% 76.0%
17. When we implement my child’s IEP, I am encouraged to be an equal partner with my child's teachers and other service providers.
3,901 3.5% 3.0% 4.6% 10.9% 23.4% 54.6% ± 11.2% 88.8% 77.9%
18. I have received a copy of my child’s IEP within 10 school days after the PPT. 3,897 2.3% 1.5% 1.8% 4.1% 14.0% 76.3% ± 5.6% 94.4% 90.3%
19. If necessary, a translator was provided at the PPT meetings. 2,339 10.2% 0.8% 2.0% 7.8% 12.6% 66.6% ± 13.0% 87.0% 79.2%
20. The translation services provided at the PPT meetings were useful and accurate.
2,192 10.8% 0.8% 2.3% 8.9% 14.6% 62.6% ± 13.8% 86.2% 77.2%
Table is continued on the next page.

~ 53 ~ Appendix E.1
Parent Survey Item n DISAGREE AGREE
Don’t Know
TOTALS High Level Agree
Strongly Moderately Slightly Slightly Moderately Strongly Disagree Agree
21. The school district proposed the regular classroom for my child as the first placement option.
3,830 5.6% 2.0% 2.0% 4.3% 15.0% 63.1 % 8.1% 9.5% 82.3% 78.1%
My Child’s Participation
22. My child has been sent home from school, but not suspended, due to behavioral difficulties.
3,312 75.2% 5.0% 1.8% 3.2% 4.5% 10.3% ± 81.9% 18.1% 14.9%
23. My child has the opportunity to participate in school-sponsored activities such as field trips, assemblies and social events (dances, sports events).
3,882 2.4% 1.1% 1.2% 3.5% 10.3% 81.5% ± 4.7% 95.3% 91.8%
24. My child has the opportunity to participate in extracurricular school activities such as sports or clubs with children without disabilities.
3,780 6.0% 1.7% 2.7% 5.0% 11.0% 73.6% ± 10.4% 89.6% 84.6%
25. My child’s school provides supports, such as extra staff, that are necessary for my child to participate in extracurricular school activities (for example, clubs and sports).
3,609 9.5% 2.5% 3.5% 6.8% 12.6% 40.1% 25.0% 15.5% 59.5% 52.7%
Parent Training and Support
26. In the past year, I have attended parent training or information sessions (provided by my district, other districts, or agencies) that addressed the needs of parents and of children with disabilities.
3,502 46.1% 6.9% 7.3% 9.4% 10.3% 20.1% ± 60.3% 39.7% 30.3%
27. I am involved in a support network for parents of students with disabilities available through my school district or other sources.
3,421 52.6% 7.3% 7.9% 9.2% 8.7% 14.2% ± 67.8% 32.2% 23.0%
28. There are opportunities for parent training or information sessions regarding special education provided by my child’s school district.
3,753 17.6% 4.6% 5.8% 9.5% 11.9% 18.4% 32.2% 28.0% 39.8% 30.3%
29. A support network for parents of students with disabilities is available to me through my school district or other sources.
3,700 14.7% 4.4% 5.2% 8.7% 10.5% 20.2% 36.2% 24.4% 39.4% 30.7%
My Child’s Skills
30. My child is learning skills that will enable him/her to be as independent as possible.
3,834 4.8% 4.2% 4.4% 10.4% 25.2% 51.0% ± 13.4% 86.6% 76.2%
31. My child is learning skills that will lead to a high school diploma, further education, or a job.
3,735 5.7% 3.2% 4.0% 10.7% 22.5% 53.8% ± 12.9% 87.1% 76.4%
Transition Planning (Only complete Q32 if your child has transitioned from the early intervention Birth to Three System to Preschool in the past 3 years. Only complete Q33-Q38 if your child was 15 years of age or older at his/her last PPT meeting.) 32. I am satisfied with the school district's transition activities that took place
when my child left Birth to Three. 543 8.3% 1.8% 2.4% 6.8% 15.3% 65.4% ± 12.5% 87.5% 80.7%
33. I am satisfied with the way secondary transition services were implemented for my child.
917 10.3% 5.3% 6.4% 12.0% 26.8% 39.1% ± 22.0% 78.0% 66.0%
34. When appropriate, outside agencies have been invited to participate in secondary transition planning.
848 13.0% 4.1% 5.5% 9.3% 13.1% 28.1% 26.9% 22.6% 50.5% 41.2%
35. The PPT introduced planning for my child's transition to adulthood. 893 13.5% 6.6% 7.1% 11.8% 25.3% 35.7% ± 27.2% 72.8% 61.0%
36. The school district actively encourages my child to attend and participate in PPT meetings.
911 5.9% 1.4% 2.6% 7.5% 18.4% 64.1% ± 10.0% 90.0% 82.5%
37. The PPT discussed an appropriate course of study at the high school for my child.
907 7.8% 4.3% 4.6% 9.7% 25.0% 48.5% ± 16.8% 83.2% 73.5%
38. The PPT developed individualized goals for my child related to employment/postsecondary education, independent living and community participation, if appropriate.
887 15.2% 5.2% 6.1% 14.1% 23.3% 36.1% ± 26.5% 73.5% 59.4%
Note: High-level agree = “moderately agree” + “strongly agree.” ± Not a response option for this survey item.

~ 54 ~ Appendix E.2
Appendix E.2: Summary of Survey Agreement
The following table includes bar charts that illustrate parents’ “high-level” of agreement (i.e., strongly agree and moderately agree), as well as a column with the percentage to express “total” agreement (i.e., plus slightly agree).29
Table E.2: Summary of Survey Agreement
PARENT SURVEY ITEM HIGH LEVEL OF AGREEMENT TOTAL
AGREEMENT
Satisfaction with My Child’s Program
1. I am satisfied with my child’s overall special education program. [n=3,928]
87.5%
2. I have the opportunity to talk to my child's teachers on a regular basis to discuss my questions and concerns. [n=3,921]
93.3%
3. My child is accepted within the school community. [n=3,908]
91.7%
4. My child’s Individualized Education Program (IEP) is meeting his or her educational needs. [n=3,948]
85.5%
5. All special education services identified in my child’s IEP have been provided. [n=3,904]
87.4%
6. Staff is appropriately trained and able to provide my child’s specific program and services. [n=3,902]
85.8%
7. Special education teachers make accommodations and modifications as indicated on my child's IEP. [n=3,895]
89.9%
8. General education teachers make accommodations and modifications as indicated on my child's IEP. [n=3,865]
83.2%
9. General education and special education teachers work together to assure that my child's IEP is being implemented. [n=3,864]
84.5%
Participation in My Child’s Program 10. In my child's school, administrators and teachers encourage
parent involvement in order to improve services and results for children with disabilities. [n=3,940]
88.1%
11. At meetings to develop my child’s Individualized Education Program (IEP), I feel encouraged to give input and express my concerns. [n=3,920]
91.5%
12. I understand what is discussed at meetings to develop my child’s IEP. [n=3,914]
95.4%
13. My concerns and recommendations are documented in the development of my child's IEP. [n=3,892]
90.0%
14. My child's evaluation report is written in terms I understand. [n=3,892]
92.1%
Table is continued on the next page.
KEY: Strongly Agree Moderately Agree
29 Parents were given the option of selecting “don’t know” on 11 survey items (4-9, 21, 25, 28, 29, and 34). This should be considered when comparing agreement levels across items.
45.6% 78.2%
59.8% 84.4%
60.0% 83.8%
44.8% 75.1%
53.2% 79.4%
52.1% 77.2%
58.5% 81.8%
46.8% 71.4%
50.1% 73.6%
51.3% 74.8%
64.8% 84.1%
66.8% 89.6%
57.5% 81.5%
56.7% 82.5%

~ 55 ~ Appendix E.2
Table E.2: Summary of Survey Agreement (continued)
PARENT SURVEY ITEM HIGH LEVEL OF AGREEMENT TOTAL
AGREEMENT
Participation in My Child’s Program (Continued)
15. Planning and Placement Team (PPT) meetings for my child have been scheduled at times and places that met my needs. [n=3,913]
92.2%
16. At my child’s PPT, the school district proposed programs and services to meet my child’s individual needs. [n=3,935]
87.4%
17. When we implement my child’s IEP, I am encouraged to be an equal partner with my child's teachers and other service providers. [n=3,901]
88.8%
18. I have received a copy of my child’s IEP within 10 school days after the PPT. [n=3,897]
94.4%
19. If necessary, a translator was provided at the PPT meetings. [n=2,339]
87.0%
20. The translation services provided at the PPT meetings were useful and accurate. [n=2,192]
86.2%
21. The school district proposed the regular classroom for my child as the first placement option. [n=3,830]
82.3%
My Child’s Participation
22. My child has been sent home from school, but not suspended, due to behavioral difficulties. [n=3,312]
18.1%
23. My child has the opportunity to participate in school-sponsored activities such as field trips, assemblies and social events (dances, sports events). [n=3,882]
95.3%
24. My child has the opportunity to participate in extracurricular school activities such as sports or clubs with children without disabilities. [n=3,780]
89.6%
25. My child’s school provides supports, such as extra staff, that are necessary for my child to participate in extracurricular school activities (for example, clubs and sports). [n=3,609]
59.5%
Parent Training and Support
26. In the past year, I have attended parent training or information sessions (provided by my district, other districts or agencies) that addressed the needs of parents and of children with disabilities. [n=3,502]
39.7%
27. I am involved in a support network for parents of students with disabilities available through my school district or other sources. [n=3,421]
32.2%
28. There are opportunities for parent training or information sessions regarding special education provided by my child’s school district. [n=3,753]
39.8%
29. A support network for parents of students with disabilities is available to me through my school district or other sources. [n=3,700]
39.4%
Table is continued on the next page.
KEY: Strongly Agree Moderately Agree
64.9% 85.7%
50.2% 76.0%
54.6% 77.9%
76.3% 90.3%
66.6% 79.2%
62.6% 77.2%
63.1% 78.1%
14.9%
81.5% 91.8%
73.6% 84.6%
40.1% 52.7%
20.1% 30.3%
23.0%
18.4% 30.3%
20.2% 30.7%

~ 56 ~ Appendix E.2
Table E.2: Summary of Survey Agreement (continued)
PARENT SURVEY ITEM HIGH LEVEL OF AGREEMENT TOTAL
AGREEMENT
My Child’s Skills
30. My child is learning skills that will enable him/her to be as independent as possible. [n=3,834]
86.6%
31. My child is learning skills that will lead to a high school diploma, further education, or a job. [n=3,735]
87.1%
Transition Planning
32. I am satisfied with the school district's transition activities that took place when my child left Birth to Three. [n=543]
87.5%
33. I am satisfied with the way secondary transition services were implemented for my child. [n=917]
78.0%
34. When appropriate, outside agencies have been invited to participate in secondary transition planning. [n=848]
50.5%
35. The PPT introduced planning for my child's transition to adulthood. [n=893]
72.8%
36. The school district actively encourages my child to attend and participate in PPT meetings. [n=911]
90.0%
37. The PPT discussed an appropriate course of study at the high school for my child. [n=907]
83.2%
38. The PPT developed individualized goals for my child related to employment/postsecondary education, independent living and community participation, if appropriate. [n=887]
73.5%
Note: Respondents were instructed only to answer item 32 if their child had transitioned from the Birth to Three System to Preschool within the past three years, and only to answer items 33-38 if their child was 15 years of age or older at their last PPT meeting. Due to space limitations, the percentage of parents to express a “high-level” of agreement is not included in the bar chart if it is equal to or less than 15%.
KEY: Strongly Agree Moderately Agree
51.0% 76.2%
53.8% 76.4%
65.4% 80.7%
39.1% 66.0%
28.1% 41.2%
35.7% 61.0%
64.1% 82.5%
48.5% 73.5%
36.1% 59.4%

~ 57 ~ Appendix F
APPENDIX F SURVEY RESPONSES BY CHILD DEMOGRAPHICS
F.1 Primary Eligibility for Services F.2 Age F.3 Race/Ethnicity F.4 Eligibility for Free and Reduced Priced Lunch F.5 English Learner Status F.6 Gender

~ 58 ~ Appendix F
Appendix F: Survey Responses by Demographics
The following charts illustrate the response pattern of survey respondents by child’s primary eligibility for services, age, race/ethnicity, free and reduced price lunch status, English Learner status, and gender. The length of the bars in each chart represents the percentage of respondents within a demographic category to agree (slightly, moderately, and strongly) to a survey statement; with the percentage to express a “high-level” of agreement (i.e., moderately and strongly) represented by a diamond on the bar.30 Due to space limitations, the percentage of parents to express a “high-level” of agreement is not included in the bar chart if it is equal to or less than 15.0%. The disability categories of deaf-blindness, traumatic brain injury, and hearing, visual, and orthopedic impairment, as well as the race/ethnicity categories of Asian, Native Hawaiian/Other Pacific Islander, American Indian/Alaskan Native, and Two or More Races are not included in the charts due to the small number of survey respondents in these categories. In addition, any demographic category with five or less responses to an individual survey statement is not included in the bar chart for that particular statement.
30 Parents were given the option of selecting “don’t know” on 11 survey items (4-9, 21, 25, 28, 29 and 34). This should be considered when comparing agreement levels across items.
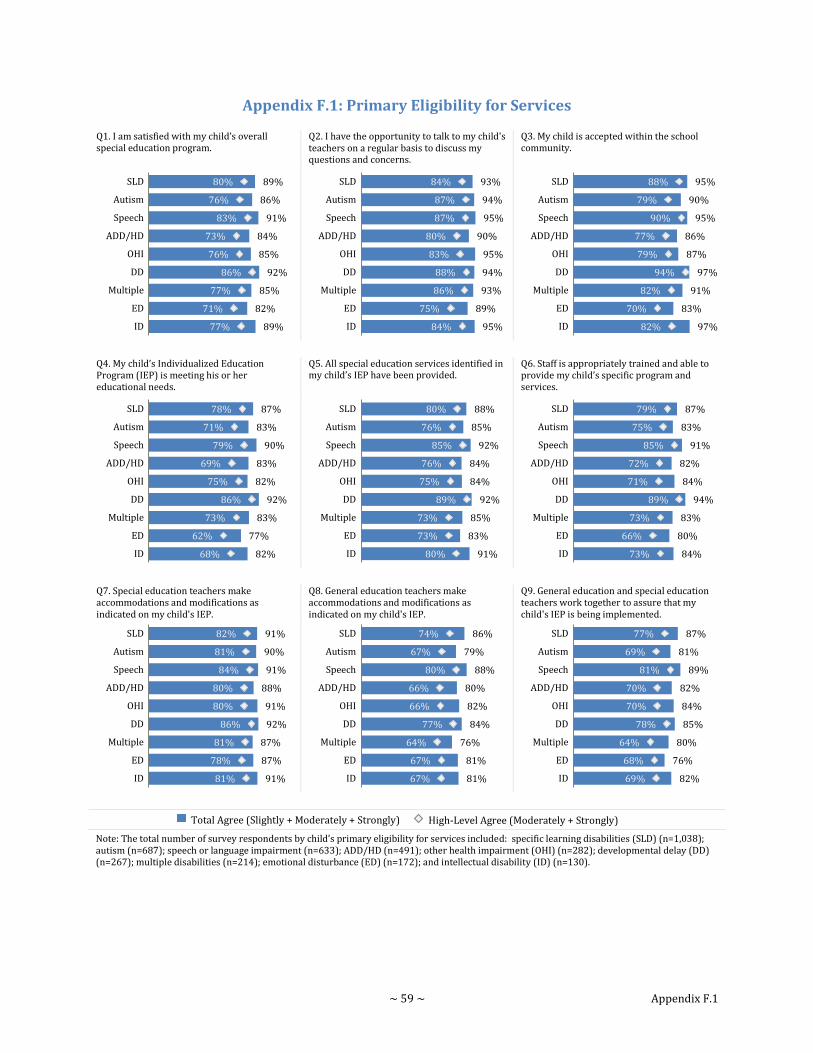
~ 59 ~ Appendix F.1
Appendix F.1: Primary Eligibility for Services
Q1. I am satisfied with my child’s overall special education program.
Q2. I have the opportunity to talk to my child's teachers on a regular basis to discuss my questions and concerns.
Q3. My child is accepted within the school community.
Q4. My child’s Individualized Education Program (IEP) is meeting his or her educational needs.
Q5. All special education services identified in my child’s IEP have been provided.
Q6. Staff is appropriately trained and able to provide my child’s specific program and services.
Q7. Special education teachers make accommodations and modifications as indicated on my child's IEP.
Q8. General education teachers make accommodations and modifications as indicated on my child's IEP.
Q9. General education and special education teachers work together to assure that my child's IEP is being implemented.
Total Agree (Slightly + Moderately + Strongly) High-Level Agree (Moderately + Strongly)
Note: The total number of survey respondents by child’s primary eligibility for services included: specific learning disabilities (SLD) (n=1,038); autism (n=687); speech or language impairment (n=633); ADD/HD (n=491); other health impairment (OHI) (n=282); developmental delay (DD) (n=267); multiple disabilities (n=214); emotional disturbance (ED) (n=172); and intellectual disability (ID) (n=130).
89%
86%
91%
84%
85%
92%
85%
82%
89%
80%
76%
83%
73%
76%
86%
77%
71%
77%
SLD
Autism
Speech
ADD/HD
OHI
DD
Multiple
ED
ID
93%
94%
95%
90%
95%
94%
93%
89%
95%
84%
87%
87%
80%
83%
88%
86%
75%
84%
SLD
Autism
Speech
ADD/HD
OHI
DD
Multiple
ED
ID
95%
90%
95%
86%
87%
97%
91%
83%
97%
88%
79%
90%
77%
79%
94%
82%
70%
82%
SLD
Autism
Speech
ADD/HD
OHI
DD
Multiple
ED
ID
87%
83%
90%
83%
82%
92%
83%
77%
82%
78%
71%
79%
69%
75%
86%
73%
62%
68%
SLD
Autism
Speech
ADD/HD
OHI
DD
Multiple
ED
ID
88%
85%
92%
84%
84%
92%
85%
83%
91%
80%
76%
85%
76%
75%
89%
73%
73%
80%
SLD
Autism
Speech
ADD/HD
OHI
DD
Multiple
ED
ID
87%
83%
91%
82%
84%
94%
83%
80%
84%
79%
75%
85%
72%
71%
89%
73%
66%
73%
SLD
Autism
Speech
ADD/HD
OHI
DD
Multiple
ED
ID
91%
90%
91%
88%
91%
92%
87%
87%
91%
82%
81%
84%
80%
80%
86%
81%
78%
81%
SLD
Autism
Speech
ADD/HD
OHI
DD
Multiple
ED
ID
86%
79%
88%
80%
82%
84%
76%
81%
81%
74%
67%
80%
66%
66%
77%
64%
67%
67%
SLD
Autism
Speech
ADD/HD
OHI
DD
Multiple
ED
ID
87%
81%
89%
82%
84%
85%
80%
76%
82%
77%
69%
81%
70%
70%
78%
64%
68%
69%
SLD
Autism
Speech
ADD/HD
OHI
DD
Multiple
ED
ID

~ 60 ~ Appendix F.1
Q10. In my child's school, administrators and teachers encourage parent involvement in order to improve services and results for children with disabilities.
Q11. At meetings to develop my child’s Individualized Education Program (IEP), I feel encouraged to give input and express my concerns.
Q12. I understand what is discussed at meetings to develop my child’s IEP.
Q13. My concerns and recommendations are documented in the development of my child's IEP.
Q14. My child's evaluation report is written in terms I understand.
Q15. Planning and Placement Team (PPT) meetings for my child have been scheduled at times and places that met my needs.
Q16. At my child’s PPT, the school district proposed programs and services to meet my child’s individual needs.
Q17. When we implement my child’s IEP, I am encouraged to be an equal partner with my child's teachers and other service providers.
Q18. I have received a copy of my child’s IEP within 10 school days after the PPT.
Q19. If necessary, a translator was provided at the PPT meetings.
Q20. The translation services provided at the PPT meetings were useful and accurate.
Q21. The school district proposed the regular classroom for my child as the first placement option.
Total Agree (Slightly + Moderately + Strongly) High-Level Agree (Moderately + Strongly)
90%
86%
90%
85%
88%
91%
85%
83%
90%
78%
71%
79%
72%
72%
81%
69%
72%
69%
SLD
Autism
Speech
ADD/HD
OHI
DD
Multiple
ED
ID
93%
90%
94%
90%
92%
93%
91%
87%
89%
86%
81%
88%
82%
84%
87%
81%
78%
84%
SLD
Autism
Speech
ADD/HD
OHI
DD
Multiple
ED
ID
95%
96%
96%
94%
97%
97%
94%
93%
95%
89%
90%
90%
88%
92%
93%
90%
86%
91%
SLD
Autism
Speech
ADD/HD
OHI
DD
Multiple
ED
ID
91%
88%
93%
88%
91%
92%
89%
84%
88%
83%
79%
86%
78%
81%
84%
80%
78%
81%
SLD
Autism
Speech
ADD/HD
OHI
DD
Multiple
ED
ID
93%
92%
94%
90%
91%
94%
91%
89%
92%
83%
82%
84%
78%
84%
87%
85%
78%
82%
SLD
Autism
Speech
ADD/HD
OHI
DD
Multiple
ED
ID
92%
92%
95%
89%
93%
93%
93%
91%
91%
85%
85%
91%
82%
84%
88%
87%
86%
85%
SLD
Autism
Speech
ADD/HD
OHI
DD
Multiple
ED
ID
89%
84%
92%
87%
82%
92%
83%
84%
87%
78%
71%
81%
73%
72%
85%
73%
69%
74%
SLD
Autism
Speech
ADD/HD
OHI
DD
Multiple
ED
ID
90%
88%
91%
86%
87%
92%
87%
86%
86%
79%
76%
81%
75%
76%
81%
79%
72%
73%
SLD
Autism
Speech
ADD/HD
OHI
DD
Multiple
ED
ID
95%
93%
97%
93%
95%
94%
92%
92%
91%
91%
88%
94%
90%
89%
90%
88%
89%
83%
SLD
Autism
Speech
ADD/HD
OHI
DD
Multiple
ED
ID
87%
87%
89%
85%
89%
92%
80%
83%
88%
78%
78%
83%
77%
78%
87%
75%
77%
81%
SLD
Autism
Speech
ADD/HD
OHI
DD
Multiple
ED
ID
87%
85%
88%
85%
88%
91%
79%
81%
87%
77%
74%
82%
74%
76%
84%
73%
73%
79%
SLD
Autism
Speech
ADD/HD
OHI
DD
Multiple
ED
ID
86%
78%
88%
85%
86%
80%
67%
71%
72%
83%
72%
85%
80%
82%
77%
62%
63%
68%
SLD
Autism
Speech
ADD/HD
OHI
DD
Multiple
ED
ID
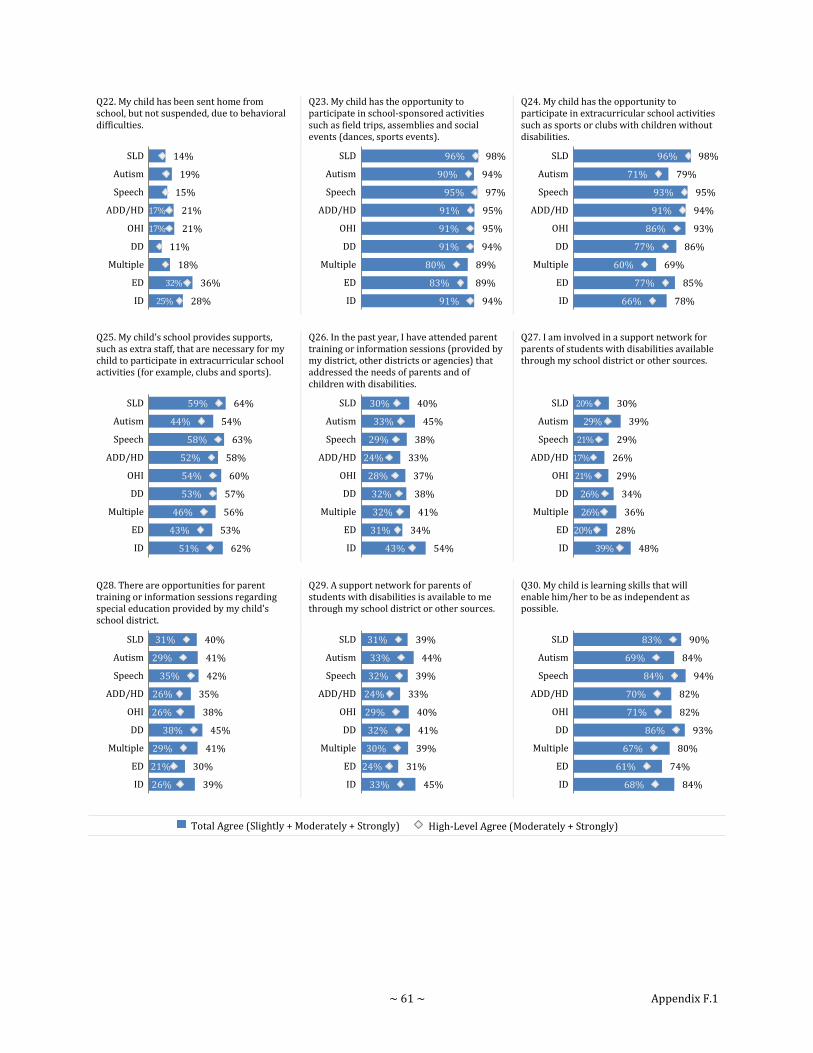
~ 61 ~ Appendix F.1
Q22. My child has been sent home from school, but not suspended, due to behavioral difficulties.
Q23. My child has the opportunity to participate in school-sponsored activities such as field trips, assemblies and social events (dances, sports events).
Q24. My child has the opportunity to participate in extracurricular school activities such as sports or clubs with children without disabilities.
Q25. My child’s school provides supports, such as extra staff, that are necessary for my child to participate in extracurricular school activities (for example, clubs and sports).
Q26. In the past year, I have attended parent training or information sessions (provided by my district, other districts or agencies) that addressed the needs of parents and of children with disabilities.
Q27. I am involved in a support network for parents of students with disabilities available through my school district or other sources.
Q28. There are opportunities for parent training or information sessions regarding special education provided by my child’s school district.
Q29. A support network for parents of students with disabilities is available to me through my school district or other sources.
Q30. My child is learning skills that will enable him/her to be as independent as possible.
Total Agree (Slightly + Moderately + Strongly) High-Level Agree (Moderately + Strongly)
14%
19%
15%
21%
21%
11%
18%
36%
28%
17%
17%
32%
25%
SLD
Autism
Speech
ADD/HD
OHI
DD
Multiple
ED
ID
98%
94%
97%
95%
95%
94%
89%
89%
94%
96%
90%
95%
91%
91%
91%
80%
83%
91%
SLD
Autism
Speech
ADD/HD
OHI
DD
Multiple
ED
ID
98%
79%
95%
94%
93%
86%
69%
85%
78%
96%
71%
93%
91%
86%
77%
60%
77%
66%
SLD
Autism
Speech
ADD/HD
OHI
DD
Multiple
ED
ID
64%
54%
63%
58%
60%
57%
56%
53%
62%
59%
44%
58%
52%
54%
53%
46%
43%
51%
SLD
Autism
Speech
ADD/HD
OHI
DD
Multiple
ED
ID
40%
45%
38%
33%
37%
38%
41%
34%
54%
30%
33%
29%
24%
28%
32%
32%
31%
43%
SLD
Autism
Speech
ADD/HD
OHI
DD
Multiple
ED
ID
30%
39%
29%
26%
29%
34%
36%
28%
48%
20%
29%
21%
17%
21%
26%
26%
20%
39%
SLD
Autism
Speech
ADD/HD
OHI
DD
Multiple
ED
ID
40%
41%
42%
35%
38%
45%
41%
30%
39%
31%
29%
35%
26%
26%
38%
29%
21%
26%
SLD
Autism
Speech
ADD/HD
OHI
DD
Multiple
ED
ID
39%
44%
39%
33%
40%
41%
39%
31%
45%
31%
33%
32%
24%
29%
32%
30%
24%
33%
SLD
Autism
Speech
ADD/HD
OHI
DD
Multiple
ED
ID
90%
84%
94%
82%
82%
93%
80%
74%
84%
83%
69%
84%
70%
71%
86%
67%
61%
68%
SLD
Autism
Speech
ADD/HD
OHI
DD
Multiple
ED
ID

~ 62 ~ Appendix F.1
Q31. My child is learning skills that will lead to a high school diploma, further education, or a job.
Q32. I am satisfied with the school district's transition activities that took place when my child left Birth to Three.
Q33. I am satisfied with the way secondary transition services were implemented for my child.
Q34. When appropriate, outside agencies have been invited to participate in secondary transition planning.
Q35. The PPT introduced planning for my child's transition to adulthood.
Q36. The school district actively encourages my child to attend and participate in PPT meetings.
Q37. The PPT discussed an appropriate course of study at the high school for my child.
Q38. The PPT developed individualized goals for my child related to employment/ postsecondary education, independent living and community participation, if appropriate.
Total Agree (Slightly + Moderately + Strongly) High-Level Agree (Moderately + Strongly)
Note: Respondents were instructed only to answer item 32 if their child had transitioned from the Birth to Three System to Preschool within the past three years, and only to answer items 33-38 if their child was 15 years of age or older at their last PPT meeting.
92%
82%
93%
86%
86%
93%
71%
82%
77%
85%
66%
85%
75%
77%
83%
55%
67%
61%
SLD
Autism
Speech
ADD/HD
OHI
DD
Multiple
ED
ID
89%
83%
89%
65%
94%
90%
93%
90%
83%
78%
83%
61%
67%
84%
79%
80%
SLD
Autism
Speech
ADD/HD
OHI
DD
MD
ID
83%
75%
76%
76%
77%
82%
73%
73%
71%
59%
67%
64%
66%
64%
64%
67%
SLD
Autism
Speech
ADD/HD
OHI
MD
ED
ID
43%
56%
48%
47%
46%
63%
60%
54%
32%
45%
45%
40%
37%
53%
49%
46%
SLD
Autism
Speech
ADD/HD
OHI
Multiple
ED
ID
76%
72%
67%
70%
74%
70%
72%
76%
65%
61%
58%
60%
52%
64%
57%
65%
SLD
Autism
Speech
ADD/HD
OHI
Multiple
ED
ID
93%
86%
92%
95%
90%
75%
94%
87%
87%
76%
79%
92%
80%
63%
86%
84%
SLD
Autism
Speech
ADD/HD
OHI
Multiple
ED
ID
88%
80%
78%
83%
85%
79%
80%
82%
79%
71%
63%
77%
76%
64%
66%
75%
SLD
Autism
Speech
ADD/HD
OHI
Multiple
ED
ID
79%
70%
67%
72%
71%
75%
67%
77%
66%
55%
53%
61%
54%
63%
49%
60%
SLD
Autism
Speech
ADD/HD
OHI
Multiple
ED
ID
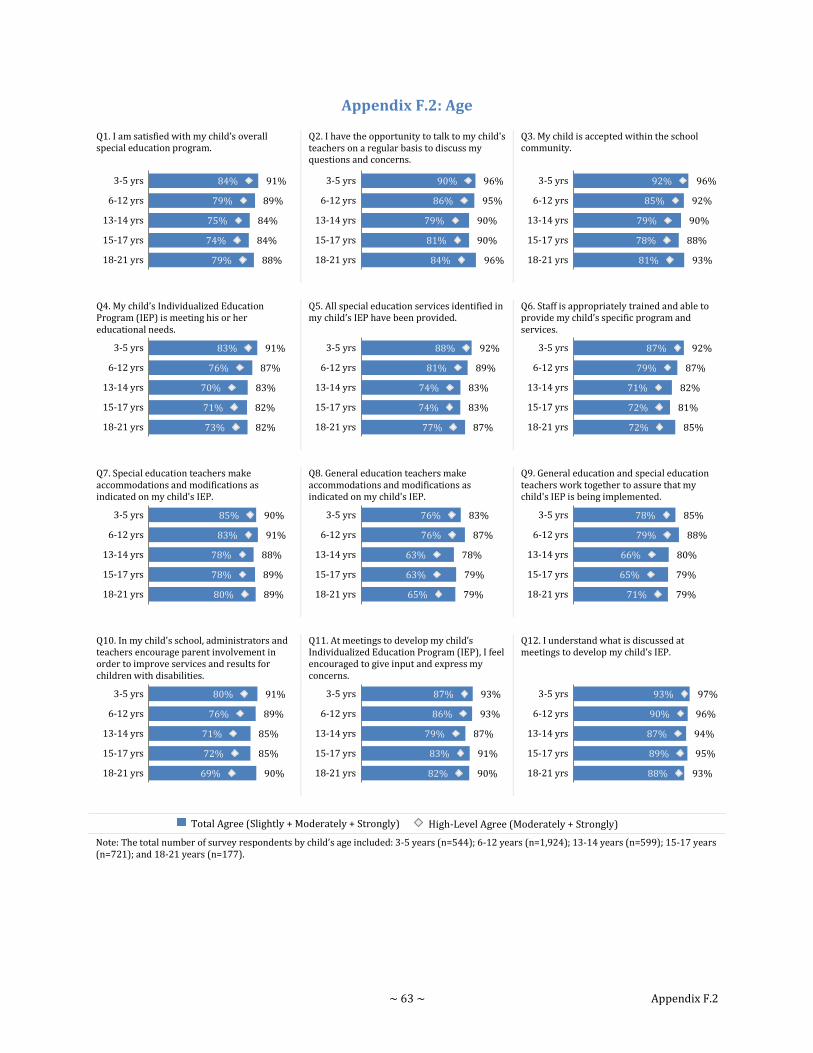
~ 63 ~ Appendix F.2
Appendix F.2: Age
Q1. I am satisfied with my child’s overall special education program.
Q2. I have the opportunity to talk to my child's teachers on a regular basis to discuss my questions and concerns.
Q3. My child is accepted within the school community.
Q4. My child’s Individualized Education Program (IEP) is meeting his or her educational needs.
Q5. All special education services identified in my child’s IEP have been provided.
Q6. Staff is appropriately trained and able to provide my child’s specific program and services.
Q7. Special education teachers make accommodations and modifications as indicated on my child's IEP.
Q8. General education teachers make accommodations and modifications as indicated on my child's IEP.
Q9. General education and special education teachers work together to assure that my child's IEP is being implemented.
Q10. In my child's school, administrators and teachers encourage parent involvement in order to improve services and results for children with disabilities.
Q11. At meetings to develop my child’s Individualized Education Program (IEP), I feel encouraged to give input and express my concerns.
Q12. I understand what is discussed at meetings to develop my child’s IEP.
Total Agree (Slightly + Moderately + Strongly) High-Level Agree (Moderately + Strongly)
Note: The total number of survey respondents by child’s age included: 3-5 years (n=544); 6-12 years (n=1,924); 13-14 years (n=599); 15-17 years (n=721); and 18-21 years (n=177).
91%
89%
84%
84%
88%
84%
79%
75%
74%
79%
3-5 yrs
6-12 yrs
13-14 yrs
15-17 yrs
18-21 yrs
96%
95%
90%
90%
96%
90%
86%
79%
81%
84%
3-5 yrs
6-12 yrs
13-14 yrs
15-17 yrs
18-21 yrs
96%
92%
90%
88%
93%
92%
85%
79%
78%
81%
3-5 yrs
6-12 yrs
13-14 yrs
15-17 yrs
18-21 yrs
91%
87%
83%
82%
82%
83%
76%
70%
71%
73%
3-5 yrs
6-12 yrs
13-14 yrs
15-17 yrs
18-21 yrs
92%
89%
83%
83%
87%
88%
81%
74%
74%
77%
3-5 yrs
6-12 yrs
13-14 yrs
15-17 yrs
18-21 yrs
92%
87%
82%
81%
85%
87%
79%
71%
72%
72%
3-5 yrs
6-12 yrs
13-14 yrs
15-17 yrs
18-21 yrs
90%
91%
88%
89%
89%
85%
83%
78%
78%
80%
3-5 yrs
6-12 yrs
13-14 yrs
15-17 yrs
18-21 yrs
83%
87%
78%
79%
79%
76%
76%
63%
63%
65%
3-5 yrs
6-12 yrs
13-14 yrs
15-17 yrs
18-21 yrs
85%
88%
80%
79%
79%
78%
79%
66%
65%
71%
3-5 yrs
6-12 yrs
13-14 yrs
15-17 yrs
18-21 yrs
91%
89%
85%
85%
90%
80%
76%
71%
72%
69%
3-5 yrs
6-12 yrs
13-14 yrs
15-17 yrs
18-21 yrs
93%
93%
87%
91%
90%
87%
86%
79%
83%
82%
3-5 yrs
6-12 yrs
13-14 yrs
15-17 yrs
18-21 yrs
97%
96%
94%
95%
93%
93%
90%
87%
89%
88%
3-5 yrs
6-12 yrs
13-14 yrs
15-17 yrs
18-21 yrs

~ 64 ~ Appendix F.2
Q13. My concerns and recommendations are documented in the development of my child's IEP.
Q14. My child's evaluation report is written in terms I understand.
Q15. Planning and Placement Team (PPT) meetings for my child have been scheduled at times and places that met my needs.
Q16. At my child’s PPT, the school district proposed programs and services to meet my child’s individual needs.
Q17. When we implement my child’s IEP, I am encouraged to be an equal partner with my child's teachers and other service providers.
Q18. I have received a copy of my child’s IEP within 10 school days after the PPT.
Q19. If necessary, a translator was provided at the PPT meetings.
Q20. The translation services provided at the PPT meetings were useful and accurate.
Q21. The school district proposed the regular classroom for my child as the first placement option.
Q22. My child has been sent home from school, but not suspended, due to behavioral difficulties.
Q23. My child has the opportunity to participate in school-sponsored activities such as field trips, assemblies and social events (dances, sports events).
Q24. My child has the opportunity to participate in extracurricular school activities such as sports or clubs with children without disabilities.
Q25. My child’s school provides supports, such as extra staff, that are necessary for my child to participate in extracurricular school activities (for example, clubs and sports).
Q26. In the past year, I have attended parent training or information sessions (provided by my district, other districts or agencies) that addressed the needs of parents and of children with disabilities.
Q27. I am involved in a support network for parents of students with disabilities available through my school district or other sources.
Total Agree (Slightly + Moderately + Strongly) High-Level Agree (Moderately + Strongly)
91%
91%
88%
89%
89%
85%
82%
78%
80%
82%
3-5 yrs
6-12 yrs
13-14 yrs
15-17 yrs
18-21 yrs
94%
92%
91%
91%
90%
87%
82%
81%
82%
85%
3-5 yrs
6-12 yrs
13-14 yrs
15-17 yrs
18-21 yrs
95%
93%
90%
90%
94%
89%
87%
83%
83%
87%
3-5 yrs
6-12 yrs
13-14 yrs
15-17 yrs
18-21 yrs
90%
88%
85%
84%
87%
81%
77%
72%
72%
74%
3-5 yrs
6-12 yrs
13-14 yrs
15-17 yrs
18-21 yrs
91%
90%
85%
87%
88%
81%
80%
72%
76%
79%
3-5 yrs
6-12 yrs
13-14 yrs
15-17 yrs
18-21 yrs
94%
95%
92%
95%
91%
91%
91%
88%
90%
86%
3-5 yrs
6-12 yrs
13-14 yrs
15-17 yrs
18-21 yrs
93%
89%
83%
80%
86%
86%
81%
71%
72%
82%
3-5 yrs
6-12 yrs
13-14 yrs
15-17 yrs
18-21 yrs
92%
87%
82%
81%
86%
84%
79%
68%
72%
82%
3-5 yrs
6-12 yrs
13-14 yrs
15-17 yrs
18-21 yrs
81%
85%
81%
80%
67%
77%
82%
76%
75%
62%
3-5 yrs
6-12 yrs
13-14 yrs
15-17 yrs
18-21 yrs
13%
18%
17%
21%
28%
16%
24%
3-5 yrs
6-12 yrs
13-14 yrs
15-17 yrs
18-21 yrs
94%
97%
96%
94%
89%
91%
93%
92%
91%
85%
3-5 yrs
6-12 yrs
13-14 yrs
15-17 yrs
18-21 yrs
85%
91%
90%
91%
80%
79%
86%
86%
86%
71%
3-5 yrs
6-12 yrs
13-14 yrs
15-17 yrs
18-21 yrs
56%
60%
57%
60%
67%
53%
54%
50%
51%
56%
3-5 yrs
6-12 yrs
13-14 yrs
15-17 yrs
18-21 yrs
40%
37%
39%
46%
52%
31%
27%
31%
34%
42%
3-5 yrs
6-12 yrs
13-14 yrs
15-17 yrs
18-21 yrs
35%
32%
32%
28%
41%
27%
23%
22%
20%
29%
3-5 yrs
6-12 yrs
13-14 yrs
15-17 yrs
18-21 yrs

~ 65 ~ Appendix F.2
Q28. There are opportunities for parent training or information sessions regarding special education provided by my child’s school district.
Q29. A support network for parents of students with disabilities is available to me through my school district or other sources.
Q30. My child is learning skills that will enable him/her to be as independent as possible.
Q31. My child is learning skills that will lead to a high school diploma, further education, or a job.
Q32. I am satisfied with the school district's transition activities that took place when my child left Birth to Three.
Q33. I am satisfied with the way secondary transition services were implemented for my child.
Q34. When appropriate, outside agencies have been invited to participate in secondary transition planning.
Q35. The PPT introduced planning for my child's transition to adulthood.
Q36. The school district actively encourages my child to attend and participate in PPT meetings.
Q37. The PPT discussed an appropriate course of study at the high school for my child.
Q38. The PPT developed individualized goals for my child related to employment/ postsecondary education, independent living and community participation, if appropriate.
Total Agree (Slightly + Moderately + Strongly) High-Level Agree (Moderately + Strongly)
Note: Respondents were instructed only to answer item 32 if their child had transitioned from the Birth to Three System to Preschool within the past three years, and only to answer items 33-38 if their child was 15 years of age or older at their last PPT meeting.
42%
39%
38%
40%
51%
34%
30%
27%
29%
33%
3-5 yrs
6-12 yrs
13-14 yrs
15-17 yrs
18-21 yrs
40%
39%
39%
38%
52%
32%
30%
30%
29%
39%
3-5 yrs
6-12 yrs
13-14 yrs
15-17 yrs
18-21 yrs
93%
87%
84%
83%
83%
85%
77%
71%
72%
71%
3-5 yrs
6-12 yrs
13-14 yrs
15-17 yrs
18-21 yrs
92%
87%
86%
85%
83%
82%
76%
74%
75%
72%
3-5 yrs
6-12 yrs
13-14 yrs
15-17 yrs
18-21 yrs
88%
86%
82%
78%
3-5 yrs
6-12 yrs
73%
80%
76%
65%
67%
65%
13-14 yrs
15-17 yrs
18-21 yrs
43%
49%
66%
34%
39%
58%
13-14 yrs
15-17 yrs
18-21 yrs
61%
74%
82%
49%
62%
71%
13-14 yrs
15-17 yrs
18-21 yrs
84%
92%
91%
76%
84%
83%
13-14 yrs
15-17 yrs
18-21 yrs
80%
84%
83%
72%
74%
73%
13-14 yrs
15-17 yrs
18-21 yrs
65%
74%
82%
49%
60%
70%
13-14 yrs
15-17 yrs
18-21 yrs
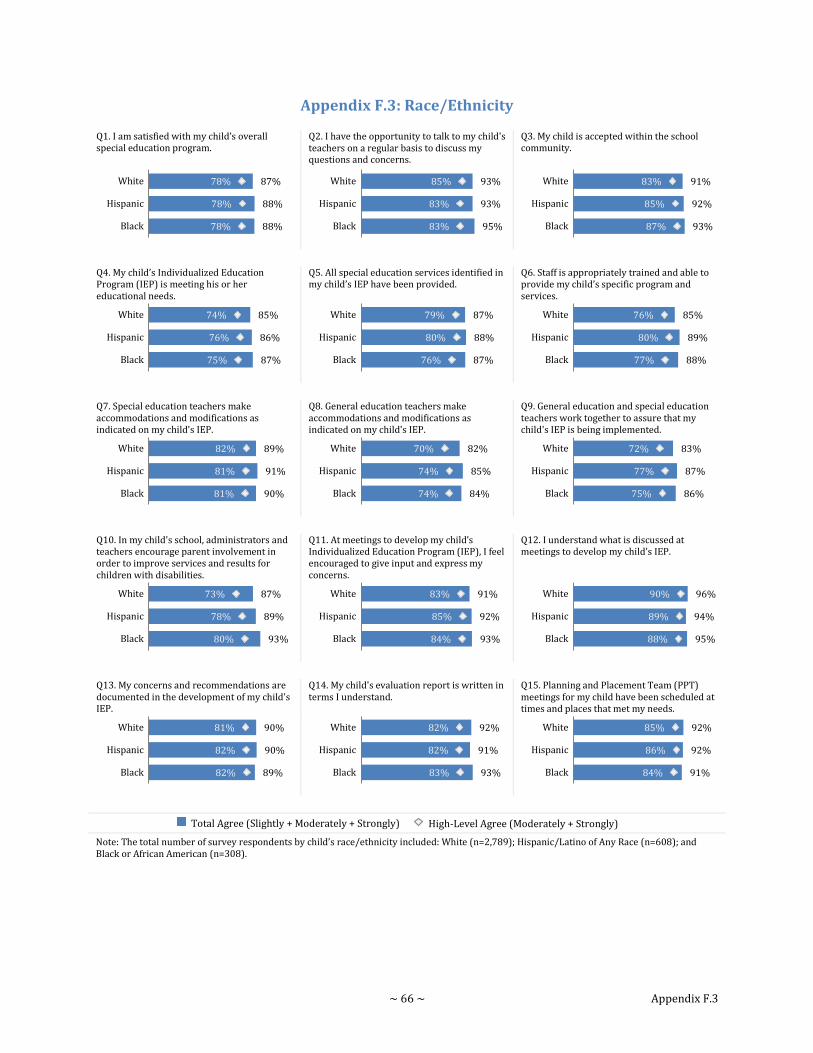
~ 66 ~ Appendix F.3
Appendix F.3: Race/Ethnicity
Q1. I am satisfied with my child’s overall special education program.
Q2. I have the opportunity to talk to my child's teachers on a regular basis to discuss my questions and concerns.
Q3. My child is accepted within the school community.
Q4. My child’s Individualized Education Program (IEP) is meeting his or her educational needs.
Q5. All special education services identified in my child’s IEP have been provided.
Q6. Staff is appropriately trained and able to provide my child’s specific program and services.
Q7. Special education teachers make accommodations and modifications as indicated on my child's IEP.
Q8. General education teachers make accommodations and modifications as indicated on my child's IEP.
Q9. General education and special education teachers work together to assure that my child's IEP is being implemented.
Q10. In my child's school, administrators and teachers encourage parent involvement in order to improve services and results for children with disabilities.
Q11. At meetings to develop my child’s Individualized Education Program (IEP), I feel encouraged to give input and express my concerns.
Q12. I understand what is discussed at meetings to develop my child’s IEP.
Q13. My concerns and recommendations are documented in the development of my child's IEP.
Q14. My child's evaluation report is written in terms I understand.
Q15. Planning and Placement Team (PPT) meetings for my child have been scheduled at times and places that met my needs.
Total Agree (Slightly + Moderately + Strongly) High-Level Agree (Moderately + Strongly)
Note: The total number of survey respondents by child’s race/ethnicity included: White (n=2,789); Hispanic/Latino of Any Race (n=608); and Black or African American (n=308).
87%
88%
88%
78%
78%
78%
White
Hispanic
Black
93%
93%
95%
85%
83%
83%
White
Hispanic
Black
91%
92%
93%
83%
85%
87%
White
Hispanic
Black
85%
86%
87%
74%
76%
75%
White
Hispanic
Black
87%
88%
87%
79%
80%
76%
White
Hispanic
Black
85%
89%
88%
76%
80%
77%
White
Hispanic
Black
89%
91%
90%
82%
81%
81%
White
Hispanic
Black
82%
85%
84%
70%
74%
74%
White
Hispanic
Black
83%
87%
86%
72%
77%
75%
White
Hispanic
Black
87%
89%
93%
73%
78%
80%
White
Hispanic
Black
91%
92%
93%
83%
85%
84%
White
Hispanic
Black
96%
94%
95%
90%
89%
88%
White
Hispanic
Black
90%
90%
89%
81%
82%
82%
White
Hispanic
Black
92%
91%
93%
82%
82%
83%
White
Hispanic
Black
92%
92%
91%
85%
86%
84%
White
Hispanic
Black

~ 67 ~ Appendix F.3
Q16. At my child’s PPT, the school district proposed programs and services to meet my child’s individual needs.
Q17. When we implement my child’s IEP, I am encouraged to be an equal partner with my child's teachers and other service providers.
Q18. I have received a copy of my child’s IEP within 10 school days after the PPT.
Q19. If necessary, a translator was provided at the PPT meetings.
Q20. The translation services provided at the PPT meetings were useful and accurate.
Q21. The school district proposed the regular classroom for my child as the first placement option.
Q22. My child has been sent home from school, but not suspended, due to behavioral difficulties.
Q23. My child has the opportunity to participate in school-sponsored activities such as field trips, assemblies and social events (dances, sports events).
Q24. My child has the opportunity to participate in extracurricular school activities such as sports or clubs with children without disabilities.
Q25. My child’s school provides supports, such as extra staff, that are necessary for my child to participate in extracurricular school activities (for example, clubs and sports).
Q26. In the past year, I have attended parent training or information sessions (provided by my district, other districts or agencies) that addressed the needs of parents and of children with disabilities.
Q27. I am involved in a support network for parents of students with disabilities available through my school district or other sources.
Q28. There are opportunities for parent training or information sessions regarding special education provided by my child’s school district.
Q29. A support network for parents of students with disabilities is available to me through my school district or other sources.
Q30. My child is learning skills that will enable him/her to be as independent as possible.
Q31. My child is learning skills that will lead to a high school diploma, further education, or a job.
Q32. I am satisfied with the school district's transition activities that took place when my child left Birth to Three.
Q33. I am satisfied with the way secondary transition services were implemented for my child.
Total Agree (Slightly + Moderately + Strongly) High-Level Agree (Moderately + Strongly)
87%
88%
89%
76%
76%
76%
White
Hispanic
Black
88%
90%
92%
77%
78%
84%
White
Hispanic
Black
95%
93%
92%
91%
88%
89%
White
Hispanic
Black
87%
90%
77%
79%
84%
69%
White
Hispanic
Black
86%
89%
77%
77%
82%
67%
White
Hispanic
Black
82%
82%
82%
78%
78%
75%
White
Hispanic
Black
14%
32%
22%
28%
17%
White
Hispanic
Black
95%
94%
95%
92%
90%
92%
White
Hispanic
Black
90%
88%
90%
85%
83%
83%
White
Hispanic
Black
57%
65%
68%
50%
58%
60%
White
Hispanic
Black
36%
48%
45%
27%
37%
36%
White
Hispanic
Black
28%
43%
33%
20%
31%
21%
White
Hispanic
Black
37%
45%
45%
27%
38%
37%
White
Hispanic
Black
36%
47%
44%
28%
40%
34%
White
Hispanic
Black
86%
87%
86%
76%
76%
77%
White
Hispanic
Black
87%
86%
89%
77%
73%
76%
White
Hispanic
Black
86%
90%
81%
79%
85%
78%
White
Hispanic
Black
76%
83%
91%
62%
76%
80%
White
Hispanic
Black

~ 68 ~ Appendix F.3
Q34. When appropriate, outside agencies have been invited to participate in secondary transition planning.
Q35. The PPT introduced planning for my child's transition to adulthood.
Q36. The school district actively encourages my child to attend and participate in PPT meetings.
Q37. The PPT discussed an appropriate course of study at the high school for my child.
Q38. The PPT developed individualized goals for my child related to employment/ postsecondary education, independent living and community participation, if appropriate.
Total Agree (Slightly + Moderately + Strongly) High-Level Agree (Moderately + Strongly)
Note: Respondents were instructed only to answer item 32 if their child had transitioned from the Birth to Three System to Preschool within the past three years, and only to answer items 33-38 if their child was 15 years of age or older at their last PPT meeting.
46%
64%
60%
37%
56%
52%
White
Hispanic
Black
70%
79%
81%
58%
70%
70%
White
Hispanic
Black
89%
93%
90%
82%
82%
86%
White
Hispanic
Black
82%
89%
83%
72%
77%
77%
White
Hispanic
Black
72%
77%
81%
57%
65%
70%
White
Hispanic
Black

~ 69 ~ Appendix F.4
Appendix F.4 Eligibility for Free and Reduced Price Lunch (FRPL)
Q1. I am satisfied with my child’s overall special education program.
Q2. I have the opportunity to talk to my child's teachers on a regular basis to discuss my questions and concerns.
Q3. My child is accepted within the school community.
Q4. My child’s Individualized Education Program (IEP) is meeting his or her educational needs.
Q5. All special education services identified in my child’s IEP have been provided.
Q6. Staff is appropriately trained and able to provide my child’s specific program and services.
Q7. Special education teachers make accommodations and modifications as indicated on my child's IEP.
Q8. General education teachers make accommodations and modifications as indicated on my child's IEP.
Q9. General education and special education teachers work together to assure that my child's IEP is being implemented.
Q10. In my child's school, administrators and teachers encourage parent involvement in order to improve services and results for children with disabilities.
Q11. At meetings to develop my child’s Individualized Education Program (IEP), I feel encouraged to give input and express my concerns.
Q12. I understand what is discussed at meetings to develop my child’s IEP.
Q13. My concerns and recommendations are documented in the development of my child's IEP.
Q14. My child's evaluation report is written in terms I understand.
Q15. Planning and Placement Team (PPT) meetings for my child have been scheduled at times and places that met my needs.
Q16. At my child’s PPT, the school district proposed programs and services to meet my child’s individual needs.
Q17. When we implement my child’s IEP, I am encouraged to be an equal partner with my child's teachers and other service providers.
Q18. I have received a copy of my child’s IEP within 10 school days after the PPT.
Total Agree (Slightly + Moderately + Strongly) High-Level Agree (Moderately + Strongly)
Note: The total number of survey respondents by child’s free and reduced price lunch status included: FRPL (n=1,019) and Non-FRPL (n=2,946).
87%
88%
78%
78%
FRPL
Non-FRPL
93%
93%
83%
85%
FRPL
Non-FRPL
92%
92%
85%
83%
FRPL
Non-FRPL
85%
86%
76%
75%
FRPL
Non-FRPL
87%
88%
79%
80%
FRPL
Non-FRPL
86%
86%
78%
77%
FRPL
Non-FRPL
89%
90%
81%
82%
FRPL
Non-FRPL
86%
82%
75%
70%
FRPL
Non-FRPL
86%
84%
77%
72%
FRPL
Non-FRPL
90%
87%
78%
74%
FRPL
Non-FRPL
92%
91%
85%
84%
FRPL
Non-FRPL
93%
96%
87%
91%
FRPL
Non-FRPL
89%
90%
80%
82%
FRPL
Non-FRPL
91%
92%
81%
83%
FRPL
Non-FRPL
92%
92%
85%
86%
FRPL
Non-FRPL
86%
88%
75%
76%
FRPL
Non-FRPL
90%
89%
79%
77%
FRPL
Non-FRPL
93%
95%
89%
91%
FRPL
Non-FRPL

~ 70 ~ Appendix F.4
Q19. If necessary, a translator was provided at the PPT meetings.
Q20. The translation services provided at the PPT meetings were useful and accurate.
Q21. The school district proposed the regular classroom for my child as the first placement option.
Q22. My child has been sent home from school, but not suspended, due to behavioral difficulties.
Q23. My child has the opportunity to participate in school-sponsored activities such as field trips, assemblies and social events (dances, sports events).
Q24. My child has the opportunity to participate in extracurricular school activities such as sports or clubs with children without disabilities.
Q25. My child’s school provides supports, such as extra staff, that are necessary for my child to participate in extracurricular school activities (for example, clubs and sports).
Q26. In the past year, I have attended parent training or information sessions (provided by my district, other districts or agencies) that addressed the needs of parents and of children with disabilities.
Q27. I am involved in a support network for parents of students with disabilities available through my school district or other sources.
Q28. There are opportunities for parent training or information sessions regarding special education provided by my child’s school district.
Q29. A support network for parents of students with disabilities is available to me through my school district or other sources.
Q30. My child is learning skills that will enable him/her to be as independent as possible.
Q31. My child is learning skills that will lead to a high school diploma, further education, or a job.
Q32. I am satisfied with the school district's transition activities that took place when my child left Birth to Three.
Q33. I am satisfied with the way secondary transition services were implemented for my child.
Q34. When appropriate, outside agencies have been invited to participate in secondary transition planning.
Q35. The PPT introduced planning for my child's transition to adulthood.
Q36. The school district actively encourages my child to attend and participate in PPT meetings.
Q37. The PPT discussed an appropriate course of study at the high school for my child.
Q38. The PPT developed individualized goals for my child related to employment/ postsecondary education, independent living and community participation, if appropriate.
Total Agree (Slightly + Moderately + Strongly) High-Level Agree (Moderately + Strongly)
Note: Respondents were instructed only to answer item 32 if their child had transitioned from the Birth to Three System to Preschool within the past three years, and only to answer items 33-38 if their child was 15 years of age or older at their last PPT meeting.
86%
87%
80%
79%
FRPL
Non-FRPL
86%
86%
79%
76%
FRPL
Non-FRPL
79%
83%
74%
79%
FRPL
Non-FRPL
30%
14%
26% FRPL
Non-FRPL
94%
96%
90%
93%
FRPL
Non-FRPL
89%
90%
83%
85%
FRPL
Non-FRPL
66%
57%
60%
50%
FRPL
Non-FRPL
44%
38%
34%
29%
FRPL
Non-FRPL
38%
30%
28%
21%
FRPL
Non-FRPL
45%
38%
37%
28%
FRPL
Non-FRPL
45%
38%
37%
28%
FRPL
Non-FRPL
85%
87%
76%
76%
FRPL
Non-FRPL
85%
88%
74%
77%
FRPL
Non-FRPL
86%
88%
81%
81%
FRPL
Non-FRPL
82%
77%
72%
64%
FRPL
Non-FRPL
58%
48%
49%
39%
FRPL
Non-FRPL
73%
73%
63%
60%
FRPL
Non-FRPL
92%
90%
81%
83%
FRPL
Non-FRPL
86%
82%
73%
74%
FRPL
Non-FRPL
74%
73%
60%
59%
FRPL
Non-FRPL

~ 71 ~ Appendix F.5
Appendix F.5: English Learner (EL) Status
Q1. I am satisfied with my child’s overall special education program.
Q2. I have the opportunity to talk to my child's teachers on a regular basis to discuss my questions and concerns.
Q3. My child is accepted within the school community.
Q4. My child’s Individualized Education Program (IEP) is meeting his or her educational needs.
Q5. All special education services identified in my child’s IEP have been provided.
Q6. Staff is appropriately trained and able to provide my child’s specific program and services.
Q7. Special education teachers make accommodations and modifications as indicated on my child's IEP.
Q8. General education teachers make accommodations and modifications as indicated on my child's IEP.
Q9. General education and special education teachers work together to assure that my child's IEP is being implemented.
Q10. In my child's school, administrators and teachers encourage parent involvement in order to improve services and results for children with disabilities.
Q11. At meetings to develop my child’s Individualized Education Program (IEP), I feel encouraged to give input and express my concerns.
Q12. I understand what is discussed at meetings to develop my child’s IEP.
Q13. My concerns and recommendations are documented in the development of my child's IEP.
Q14. My child's evaluation report is written in terms I understand.
Q15. Planning and Placement Team (PPT) meetings for my child have been scheduled at times and places that met my needs.
Q16. At my child’s PPT, the school district proposed programs and services to meet my child’s individual needs.
Q17. When we implement my child’s IEP, I am encouraged to be an equal partner with my child's teachers and other service providers.
Q18. I have received a copy of my child’s IEP within 10 school days after the PPT.
Total Agree (Slightly + Moderately + Strongly) High-Level Agree (Moderately + Strongly)
Note: The total number of survey respondents by child’s EL status included: EL (n=211) and non-EL (n=3,754).
94%
87%
82%
78%
EL
Non-EL
96%
93%
86%
84%
EL
Non-EL
95%
92%
90%
83%
EL
Non-EL
90%
85%
82%
75%
EL
Non-EL
91%
87%
84%
79%
EL
Non-EL
91%
85%
85%
77%
EL
Non-EL
91%
90%
85%
82%
EL
Non-EL
88%
83%
79%
71%
EL
Non-EL
90%
84%
84%
73%
EL
Non-EL
94%
88%
85%
74%
EL
Non-EL
95%
91%
89%
84%
EL
Non-EL
95%
95%
89%
90%
EL
Non-EL
93%
90%
83%
81%
EL
Non-EL
93%
92%
79%
83%
EL
Non-EL
94%
92%
88%
86%
EL
Non-EL
89%
87%
80%
76%
EL
Non-EL
92%
89%
82%
78%
EL
Non-EL
93%
94%
90%
90%
EL
Non-EL

~ 72 ~ Appendix F.5
Q19. If necessary, a translator was provided at the PPT meetings.
Q20. The translation services provided at the PPT meetings were useful and accurate.
Q21. The school district proposed the regular classroom for my child as the first placement option.
Q22. My child has been sent home from school, but not suspended, due to behavioral difficulties.
Q23. My child has the opportunity to participate in school-sponsored activities such as field trips, assemblies and social events (dances, sports events).
Q24. My child has the opportunity to participate in extracurricular school activities such as sports or clubs with children without disabilities.
Q25. My child’s school provides supports, such as extra staff, that are necessary for my child to participate in extracurricular school activities (for example, clubs and sports).
Q26. In the past year, I have attended parent training or information sessions (provided by my district, other districts or agencies) that addressed the needs of parents and of children with disabilities.
Q27. I am involved in a support network for parents of students with disabilities available through my school district or other sources.
Q28. There are opportunities for parent training or information sessions regarding special education provided by my child’s school district.
Q29. A support network for parents of students with disabilities is available to me through my school district or other sources.
Q30. My child is learning skills that will enable him/her to be as independent as possible.
Q31. My child is learning skills that will lead to a high school diploma, further education, or a job.
Q32. I am satisfied with the school district's transition activities that took place when my child left Birth to Three.
Q33. I am satisfied with the way secondary transition services were implemented for my child.
Q34. When appropriate, outside agencies have been invited to participate in secondary transition planning.
Q35. The PPT introduced planning for my child's transition to adulthood.
Q36. The school district actively encourages my child to attend and participate in PPT meetings.
Q37. The PPT discussed an appropriate course of study at the high school for my child.
Q38. The PPT developed individualized goals for my child related to employment/ postsecondary education, independent living and community participation, if appropriate.
Total Agree (Slightly + Moderately + Strongly) High-Level Agree (Moderately + Strongly)
Note: Respondents were instructed only to answer item 32 if their child had transitioned from the Birth to Three System to Preschool within the past three years, and only to answer items 33-38 if their child was 15 years of age or older at their last PPT meeting.
93%
86%
88%
78%
EL
Non-EL
93%
86%
88%
76%
EL
Non-EL
84%
82%
82%
78%
EL
Non-EL
48%
16%
42% EL
Non-EL
95%
95%
91%
92%
EL
Non-EL
92%
89%
87%
84%
EL
Non-EL
78%
58%
72%
52%
EL
Non-EL
61%
39%
48%
29%
EL
Non-EL
55%
31%
42%
22%
EL
Non-EL
58%
39%
48%
29%
EL
Non-EL
63%
38%
50%
30%
EL
Non-EL
90%
86%
79%
76%
EL
Non-EL
89%
87%
76%
76%
EL
Non-EL
88%
87%
85%
80%
EL
Non-EL
82%
78%
82%
65%
EL
Non-EL
81%
49%
70%
40%
EL
Non-EL
88%
72%
80%
60%
EL
Non-EL
96%
90%
84%
83%
EL
Non-EL
96%
83%
85%
73%
EL
Non-EL
85%
73%
74%
59%
EL
Non-EL

~ 73 ~ Appendix F.6
Appendix F.6: Gender
Q1. I am satisfied with my child’s overall special education program.
Q2. I have the opportunity to talk to my child's teachers on a regular basis to discuss my questions and concerns.
Q3. My child is accepted within the school community.
Q4. My child’s Individualized Education Program (IEP) is meeting his or her educational needs.
Q5. All special education services identified in my child’s IEP have been provided.
Q6. Staff is appropriately trained and able to provide my child’s specific program and services.
Q7. Special education teachers make accommodations and modifications as indicated on my child's IEP.
Q8. General education teachers make accommodations and modifications as indicated on my child's IEP.
Q9. General education and special education teachers work together to assure that my child's IEP is being implemented.
Q10. In my child's school, administrators and teachers encourage parent involvement in order to improve services and results for children with disabilities.
Q11. At meetings to develop my child’s Individualized Education Program (IEP), I feel encouraged to give input and express my concerns.
Q12. I understand what is discussed at meetings to develop my child’s IEP.
Q13. My concerns and recommendations are documented in the development of my child's IEP.
Q14. My child's evaluation report is written in terms I understand.
Q15. Planning and Placement Team (PPT) meetings for my child have been scheduled at times and places that met my needs.
Q16. At my child’s PPT, the school district proposed programs and services to meet my child’s individual needs.
Q17. When we implement my child’s IEP, I am encouraged to be an equal partner with my child's teachers and other service providers.
Q18. I have received a copy of my child’s IEP within 10 school days after the PPT.
Total Agree (Slightly + Moderately + Strongly) High-Level Agree (Moderately + Strongly)
Note: The total number of survey respondents by child’s gender included: male (n=2,744) and female (n=1,221).
87%
89%
77%
81%
Male
Female
93%
94%
84%
85%
Male
Female
91%
93%
83%
86%
Male
Female
85%
87%
74%
78%
Male
Female
87%
89%
79%
81%
Male
Female
85%
87%
76%
79%
Male
Female
90%
91%
81%
84%
Male
Female
82%
86%
70%
76%
Male
Female
84%
86%
73%
75%
Male
Female
88%
89%
75%
75%
Male
Female
91%
92%
83%
86%
Male
Female
95%
96%
89%
91%
Male
Female
89%
92%
80%
84%
Male
Female
92%
93%
82%
85%
Male
Female
92%
93%
85%
86%
Male
Female
87%
88%
75%
79%
Male
Female
89%
90%
77%
79%
Male
Female
94%
95%
90%
91%
Male
Female

~ 74 ~ Appendix F.6
Q19. If necessary, a translator was provided at the PPT meetings.
Q20. The translation services provided at the PPT meetings were useful and accurate.
Q21. The school district proposed the regular classroom for my child as the first placement option.
Q22. My child has been sent home from school, but not suspended, due to behavioral difficulties.
Q23. My child has the opportunity to participate in school-sponsored activities such as field trips, assemblies and social events (dances, sports events).
Q24. My child has the opportunity to participate in extracurricular school activities such as sports or clubs with children without disabilities.
Q25. My child’s school provides supports, such as extra staff, that are necessary for my child to participate in extracurricular school activities (for example, clubs and sports).
Q26. In the past year, I have attended parent training or information sessions (provided by my district, other districts or agencies) that addressed the needs of parents and of children with disabilities.
Q27. I am involved in a support network for parents of students with disabilities available through my school district or other sources.
Q28. There are opportunities for parent training or information sessions regarding special education provided by my child’s school district.
Q29. A support network for parents of students with disabilities is available to me through my school district or other sources.
Q30. My child is learning skills that will enable him/her to be as independent as possible.
Q31. My child is learning skills that will lead to a high school diploma, further education, or a job.
Q32. I am satisfied with the school district's transition activities that took place when my child left Birth to Three.
Q33. I am satisfied with the way secondary transition services were implemented for my child.
Q34. When appropriate, outside agencies have been invited to participate in secondary transition planning.
Q35. The PPT introduced planning for my child's transition to adulthood.
Q36. The school district actively encourages my child to attend and participate in PPT meetings.
Q37. The PPT discussed an appropriate course of study at the high school for my child.
Q38. The PPT developed individualized goals for my child related to employment/ postsecondary education, independent living and community participation, if appropriate.
Total Agree (Slightly + Moderately + Strongly) High-Level Agree (Moderately + Strongly)
Note: Respondents were instructed only to answer item 32 if their child had transitioned from the Birth to Three System to Preschool within the past three years, and only to answer items 33-38 if their child was 15 years of age or older at their last PPT meeting.
86%
89%
78%
81%
Male
Female
85%
88%
76%
79%
Male
Female
82%
83%
77%
80%
Male
Female
19%
15%
Male
Female
95%
96%
91%
94%
Male
Female
89%
91%
83%
87%
Male
Female
59%
60%
52%
54%
Male
Female
38%
43%
29%
32%
Male
Female
31%
35%
22%
25%
Male
Female
39%
42%
29%
33%
Male
Female
38%
42%
30%
32%
Male
Female
86%
88%
75%
78%
Male
Female
86%
89%
75%
80%
Male
Female
85%
92%
78%
87%
Male
Female
77%
80%
66%
67%
Male
Female
50%
51%
40%
43%
Male
Female
74%
70%
63%
58%
Male
Female
89%
91%
82%
83%
Male
Female
83%
85%
74%
74%
Male
Female
74%
72%
60%
59%
Male
Female

~ 75 ~ Appendix G
APPENDIX G SURVEY RESPONSE BY YEAR

~ 76 ~ Appendix G
Appendix G: Survey Response By Year
The following figures illustrate agreement levels over the past three years: 2012-13 (29 school districts, n=2,091); 2013-14 (31 school districts, n=2,761) and 2014-15 (56 districts, n=3,965). The first line graph for each statement illustrates the percentage of parents to express “total” agreement (i.e., slightly + moderately + strongly) in each year, while the second line graph illustrates the percentage of parents to express “high-level” agreement (i.e., moderately + strongly).31
Table G.1: Agreement Levels by Year
Q1. I am satisfied with my child’s overall special education program. Q2. I have the opportunity to talk to my child's teachers on a regular basis to discuss my questions and concerns.
Q3. My child is accepted within the school community. Q4. My child’s Individualized Education Program (IEP) is meeting his or her educational needs.
Q5. All special education services identified in my child’s IEP have been provided.
Q6. Staff is appropriately trained and able to provide my child’s specific program and services.
Q7. Special education teachers make accommodations and modifications as indicated on my child's IEP.
Q8. General education teachers make accommodations and modifications as indicated on my child's IEP.
Q9. General education and special education teachers work together to assure that my child's IEP is being implemented.
Q10. In my child's school, administrators and teachers encourage parent involvement in order to improve services and results for children with disabilities.
2012-13 2013-14 2014-15 2012-13 2013-14 2014-15 (n=2,091) (n=2,761) (n=3,965) (n=2,091) (n=2,761) (n=3,965)
Total Agree (Slightly + Moderately + Strongly) High-Level Agree (Moderately + Strongly)
31 Parents were given the option of selecting “don’t know” on 11 survey items (4-9, 21, 25, 28, 29 and 34). This should be considered when comparing agreement levels across items.
85.5% 87.3% 87.5%
74.9% 77.0% 78.2%
92.6% 93.3% 93.3%
82.9% 84.8% 84.4%
90.8% 91.7% 91.7%
80.7% 83.2% 83.8%
84.7% 85.7% 85.5%
73.2% 75.0% 75.1%
85.7% 87.7% 87.4%
75.5% 78.7% 79.4%
85.0% 86.5% 85.8%
74.7% 76.4% 77.2%
90.2% 91.0% 89.9%
81.8% 83.5% 81.8%
85.0% 85.6% 83.2%
71.6% 73.8% 71.4%
86.0% 87.1% 84.5%
73.3% 76.7% 73.6%
87.5% 88.2% 88.1%
73.9% 77.4% 74.8%

~ 77 ~ Appendix G
Table G.1: Agreement Levels by Year (continued)
Q11. At meetings to develop my child’s Individualized Education Program (IEP), I feel encouraged to give input and express my concerns.
Q12. I understand what is discussed at meetings to develop my child’s IEP.
Q13. My concerns and recommendations are documented in the development of my child's IEP.
Q14. My child's evaluation report is written in terms I understand.
Q15. Planning and Placement Team (PPT) meetings for my child have been scheduled at times and places that met my needs.
Q16. At my child’s PPT, the school district proposed programs and services to meet my child’s individual needs.
Q17. When we implement my child’s IEP, I am encouraged to be an equal partner with my child's teachers and other service providers.
Q18. I have received a copy of my child’s IEP within 10 school days after the PPT.
Q19. If necessary, a translator was provided at the PPT meetings. Q20. The translation services provided at the PPT meetings were useful and accurate.
Q21. The school district proposed the regular classroom for my child as the first placement option.
Q22. My child has been sent home from school, but not suspended, due to behavioral difficulties.
Q23. My child has the opportunity to participate in school-sponsored activities such as field trips, assemblies and social events (dances, sports events).
Q24. My child has the opportunity to participate in extracurricular school activities such as sports or clubs with children without disabilities.
2012-13 2013-14 2014-15 2012-13 2013-14 2014-15 (n=2,091) (n=2,761) (n=3,965) (n=2,091) (n=2,761) (n=3,965)
Total Agree (Slightly + Moderately + Strongly) High-Level Agree (Moderately + Strongly)
91.9% 92.0% 91.5%
83.6% 85.2% 84.1%
95.4% 95.6% 95.4%
88.5% 89.7% 89.6%
89.9% 91.1% 90.0%
78.5% 82.3% 81.5%
91.5% 92.6% 92.1%
81.9% 84.3% 82.5%
91.7% 92.5% 92.2%
85.1% 85.2% 85.7%
86.5% 88.1% 87.4%
74.6% 77.7% 76.0%
88.0% 88.9% 88.8%
76.5% 79.2% 77.9%
92.1% 92.9% 94.4%
86.5% 88.4% 90.3%
85.8% 86.8% 87.0%
79.6% 81.2% 79.2%
87.5% 87.3% 86.2%
81.2% 81.3% 77.2%
84.8% 85.9% 82.3%
78.8% 81.8% 78.1%
23.0% 20.5% 18.1%
17.3% 14.5% 14.9%
96.1% 96.7% 95.3%
92.3% 93.3% 91.8%
89.9% 91.3% 89.6%
85.4% 86.6% 84.6%

~ 78 ~ Appendix G
Table G.1: Agreement Levels by Year (continued)
Q25. My child’s school provides supports, such as extra staff, that are necessary for my child to participate in extracurricular school activities (for example, clubs and sports).
Q26. In the past year, I have attended parent training or information sessions (provided by my district, other districts or agencies) that addressed the needs of parents and of children with disabilities.
Q27. I am involved in a support network for parents of students with disabilities available through my school district or other sources.
Q28. There are opportunities for parent training or information sessions regarding special education provided by my child’s school district.
Q29. A support network for parents of students with disabilities is available to me through my school district or other sources.
Q30. My child is learning skills that will enable him/her to be as independent as possible.
Q31. My child is learning skills that will lead to a high school diploma, further education, or a job.
Q32. I am satisfied with the school district's transition activities that took place when my child left Birth to Three.
Q33. I am satisfied with the way secondary transition services were implemented for my child.
Q34. When appropriate, outside agencies have been invited to participate in secondary transition planning.
Q35. The PPT introduced planning for my child's transition to adulthood.
Q36. The school district actively encourages my child to attend and participate in PPT meetings.
Q37. The PPT discussed an appropriate course of study at the high school for my child.
Q38. The PPT developed individualized goals for my child related to employment/ postsecondary education, independent living and community participation, if appropriate.
2012-13 2013-14 2014-15 2012-13 2013-14 2014-15 (n=2,091) (n=2,761) (n=3,965) (n=2,091) (n=2,761) (n=3,965)
Total Agree (Slightly + Moderately + Strongly) High-Level Agree (Moderately + Strongly)
60.3% 63.1% 59.5%
52.6% 55.1% 52.7%
34.6% 40.7% 39.7%
27.9% 32.3% 30.3%
30.1% 34.2% 32.2%
22.3% 25.4% 23.0%
34.8% 36.6% 39.8%
25.0% 26.4% 30.3%
34.4% 37.4% 39.4%
26.7% 28.9% 30.7%
86.2% 87.7% 86.6%
72.0% 74.1% 76.2%
86.9% 87.9% 87.1%
74.0% 75.7% 76.4%
88.0% 90.6% 87.5%
79.2% 83.6% 80.7%
78.1% 80.7% 78.0%
64.9% 67.7% 66.0%
56.1% 61.1% 50.5%
46.4% 48.2% 41.2%
75.2% 77.6% 72.8%
58.9% 62.4% 61.0%
92.5% 94.8% 90.0%
85.5% 88.0% 82.5%
86.4% 89.5% 83.2%
76.3% 78.7% 73.5%
75.3% 78.3% 73.5%
60.5% 62.7% 59.4%