summary results for blm field offices in ... - fs.fed.us basin pdf... · usda forest service, by...
TRANSCRIPT

1
SUMMARY RESULTS FOR BLM FIELD OFFICES IN NEVADA FROM A REGIONAL ASSESSMENT OF HABITATS
FOR SPECIES OF CONSERVATION CONCERN
September 2003
Produced by USDA Forest Service, Pacific Northwest Research Station, in collaboration with:
USDI Bureau of Land Management,
USGS Biological Resources Division, and USDA Forest Service National Forest System
in Partial Fulfillment of Interagency Agreement PNW-02-IA-11261967-046/BLM-DAI020006
between the Pacific Northwest Research Station and the Bureau of Land Management
Suggested citation: Rowland, M. M., L. H. Suring, M. J. Wisdom, L. Schueck, R. J. Tausch, R. F. Miller, C.
Wolff Meinke, S. T. Knick, and B. C. Wales. 2003. Summary results for BLM Field Offices in Nevada from a regional assessment of habitats for species of conservation concern. 66 pp. Unpublished report on file at: USDA Forest Service, Pacific Northwest Research Station, 1401 Gekeler Lane, La Grande, OR 97850.
For information about this report, contact Dr. Michael Wisdom, Principal Investigator, at [email protected] or 541-962-6532.

2
AUTHORS Mary M. Rowland, USDA Forest Service, Pacific Northwest Research Station, La Grande, OR Lowell H. Suring, USDA Forest Service, Terrestrial Wildlife Ecology Unit, Boise, ID Michael J. Wisdom, USDA Forest Service, Pacific Northwest Research Station, La Grande, OR Linda Schueck, USGS Biological Resources Division, Boise, ID Robin J. Tausch, USDA Forest Service, Rocky Mountain Research Station, Reno, NV Richard F. Miller, Oregon State University, Squaw Butte Research Station, Burns, OR Cara Wolff Meinke, USGS Biological Resources Division, Boise, ID Steven T. Knick, USGS Biological Resources Division, Boise, ID Barbara C. Wales, USDA Forest Service, Pacific Northwest Research Station, La Grande, OR ACKNOWLEDGMENTS
Karin Preston provided data summaries and graphics used in this report, and Jennifer Boyd prepared tables and assisted with document formatting and editing. Funding and in-kind support were provided by the Washington Offices, USDI Bureau of Land Management and USDA Forest Service, by the USGS Biological Resources Division, Snake River Field Station, and by the USDA Forest Service Pacific Northwest Research Station and Rocky Mountain Research Station. PREFACE
Wisdom et al. (2003) recently completed a prototype assessment of habitats for sagebrush (Artemisia spp.)-associated species of conservation concern in the Great Basin. The assessment was completed at 2 spatial extents – the Great Basin Ecoregion (Great Basin) and the state of Nevada – to address both ecological and administrative needs. Although the report presents data summarized comparably at these 2 extents, land management decisions within the Bureau of Land Management (BLM) are often based on data collected and organized at smaller scales, such as within Field Office boundaries. Thus, we report additional summaries here for Nevada, focusing on the 8 BLM Field Offices in the state. The following report replaces an earlier, draft version of summaries for Field Offices in Nevada (Rowland 2003).

3
CONTENTS INTRODUCTION METHODS Vegetation Vegetation at Risk Area at Risk of Displacement by Pinyon-Juniper Area at Risk of Displacement by Cheatgrass Habitats for Species of Concern RESULTS Vegetation Vegetation at Risk Area at Risk of Displacement by Pinyon-Juniper Area at Risk of Displacement by Cheatgrass Comparison among Landowners of Vegetation at Risk from Cheatgrass Habitats for Species of Concern Amount of Habitat
Habitat at Risk of Displacement by Pinyon-Juniper Habitat at Risk of Displacement by Cheatgrass
MANAGEMENT IMPLICATIONS LITERATURE CITED TABLES Table 1. Forty species of conservation concern identified for regional assessment in the Great Basin and Nevada and their current status under selected conservation criteria. Table 2a. Land cover types within the Carson City, Eagle Lake, Las Vegas, and Surprise Field Offices in Nevada. Table 2b. Land cover types within the Battle Mountain, Elko, Ely, and Winnemucca Field Offices, and statewide, in Nevada. Table 3. Risk of displacement of sagebrush cover types by pinyon-juniper woodlands within Bureau of Land Management Field Offices in Nevada, encompassing the High Calcareous, Central High, and Bonneville Ecological Provinces. Table 4. Risk of displacement of sagebrush and other susceptible native vegetation by cheatgrass within Bureau of Land Management Field Offices in Nevada. Table 5. Vegetation at risk of displacement by cheatgrass in Nevada, summarized by primary landowner. (See text for definitions of risk categories of displacement by cheatgrass.)
4
Table 6. Risk of displacement of sagebrush habitat for greater sage-grouse by pinyon-juniper woodlands in Nevada, encompassing the High Calcareous, Central High, and Bonneville Ecological Provinces. Table 7. Risk of displacement of greater sage-grouse habitat by cheatgrass within Bureau of Land Management Field Offices in Nevada. Table 8. Risk of displacement of habitat for species of conservation concern by cheatgrass within the Battle Mountain Field Office in Nevada. Table 9. Risk of displacement of habitat for species of conservation concern by cheatgrass within the Carson City Field Office in Nevada. Table 10. Risk of displacement of habitat for species of conservation concern by cheatgrass within the Eagle Lake Field Office in Nevada. Table 11. Risk of displacement of habitat for species of conservation concern by cheatgrass within the Elko Field Office in Nevada. Table12. Risk of displacement of habitat for species of conservation concern by cheatgrass within the Ely Field Office in Nevada. Table 13. Risk of displacement of habitat for species of conservation concern by cheatgrass within the Las Vegas Field Office in Nevada. Table 14. Risk of displacement of habitat for species of conservation concern by cheatgrass within the Surprise Field Office in Nevada. Table 15. Risk of displacement of habitat for species of conservation concern by cheatgrass within the Winnemucca Field Office in Nevada. Table 16. Comparison of amount of habitat among Bureau of Land Management Field Offices in Nevada for 40 species of conservation concern. FIGURES Figure 1. Fourteen ecological provinces used in modeling risk of displacement of native vegetation by cheatgrass and pinyon-juniper woodlands. These provinces are a modification of those described in Miller et al. (1999) and West et al. (1998). Figure 2. Risk of displacement of sagebrush cover types by pinyon-juniper woodlands within Bureau of Land Management Field Offices in the state of Nevada, encompassing the High Calcareous, Central High, and Bonneville Ecological Provinces. Note that only a small fraction of the Bonneville Ecological Province lies within Nevada (see Figure 1 for location of the Bonneville Ecological Province in Utah and Nevada).

5
Figure 3. Risk of displacement of sagebrush and other native vegetation by cheatgrass within Bureau of Land Management Field Offices in Nevada. Areas not modeled were land cover types considered not susceptible to displacement by cheatgrass. Figure 4. Percentage of vegetation at risk of displacement by cheatgrass in Nevada, by primary landowner and risk category. Data for state-owned lands and other landowners managing <0.1% of Nevada were not graphed; these data are included in Table 5. Figure 5. Risk of displacement of habitat for greater sage-grouse by cheatgrass within Bureau of Land Management Field Offices in Nevada. (Note that wet meadow habitats, which are at no risk of displacement, composed <1% of sage-grouse habitat in Nevada and are thus not mapped.)

6
INTRODUCTION
Threats to habitats and populations of sagebrush-associated species are widespread and diverse (Knick 1999; USDI BLM 1999, 2002; Miller and Eddleman 2000; Nachlinger et al. 2001; Bunting et al. 2002; Wisdom et al. 2003). Among the threats commonly listed, those of displacement of native habitats by cheatgrass (Bromus tectorum) and other exotic vegetation, such as medusahead (Taeniatherum caput-medusae), are paramount (USDI BLM 2002). In addition, displacement of native sagebrush by the expansion of pinyon (Pinus spp.) and juniper (Juniper spp.) woodlands is accelerating across the Intermountain West, including the Great Basin (Tausch and West 1988, Miller et al. 1999; also see Chapter 4 in Wisdom et al. 2003). (Note that any following references to “chapters” in this report refer to the appropriate chapter in Wisdom et al. 2003.)
Concern about sagebrush-associated species and their habitats led to the completion of a prototype assessment of species of conservation concern for the Great Basin Ecoregion and the state of Nevada (Wisdom et al. 2003). For this assessment, 40 species of concern were identified as being appropriate for broadscale assessment of habitats. Although none of the 40 currently is listed as an endangered, threatened, or candidate species under the Endangered Species Act, several are on other lists of special status species in Nevada (Table 1). For example, 11 of the 40 are included in the recently released list of species considered “sensitive” by the Nevada State Office of the BLM (Table 1). These species “occur on Bureau administered lands for which BLM has the capability to significantly affect the conservation status of the species through management” (Nevada BLM 2003:1). Moreover, 4 of the 17 bird species on our list are also on the national Partners in Flight Watch List: greater sage-grouse (see Table 1 for scientific names of the 40 species of concern), Swainson’s hawk, short-eared owl, and Brewer’s sparrow (Rich et al. 2003). An additional 8 avian species are on the Nevada Partners in Flight Priority Species list (Neel 1999; Table 1). And last, a group of conservation organizations petitioned the U.S. Fish and Wildlife Service (FWS) in 2003 to list pygmy rabbit, which occurs in Nevada, as a threatened or endangered species across its range (http://www.westernwatersheds.org/legal/legal.html). The petition applies to all populations of the species outside the Columbia Basin in Washington; that population was previously designated as endangered by FWS.
Of particular concern in Nevada is what has been referred to as the Mono Basin population of sage-grouse. Results from a recently published genetic analysis of sage-grouse across the range of the species revealed that the population in the “Lyon/Mono” area (Lyon County, NV and Mono County, CA) is genetically distinct – that is, the birds have a “unique allelic composition” - from other populations of sage-grouse (Benedict et al. 2003:309). This population was petitioned for emergency listing as endangered in December 2001 (Webb 2001, Kritz 2003). The FWS determined in December 2002 that evidence was lacking to support emergency listing, or to support the designation of these birds as a distinct population segment (U.S. Government 2002). Publication of the Benedict et al. (2003) paper, however, will provide previously unavailable genetic evidence for future determinations by the FWS. In addition, a petition has been filed to list greater sage-grouse as endangered throughout its range (Kritz 2003). Because of widespread concern about sage-grouse and the importance of public lands, especially those managed by BLM, for this species, the BLM recently issued a draft national conservation strategy for sage-grouse (USDI BLM 2003).

7
Our objective in the following report was to provide more spatially explicit data for each Field Office in Nevada about vegetation at risk and habitats for the 40 species of conservation concern in the Great Basin prototype assessment. These data may be useful in developing and refining resource management plans and providing guidance for other management activities. Given the widespread concern over sagebrush-associated species in Nevada, exemplified by the genesis of the Great Basin Restoration Initiative (USDI BLM 1999), such data may help reveal regional-scale patterns of habitat conditions that also influence more localized habitats. In particular, our analyses provide information about sagebrush and other arid shrubland habitats that have been, or are predicted to be, compromised by widespread threats, such as displacement by cheatgrass.
The following report contains a variety of summaries, including: • Area of cover type (amount and percentage) by Field Office; • Risk of displacement of sagebrush cover types by pinyon-juniper woodlands within Field
Offices; • Risk of displacement of native vegetation by cheatgrass within Field Offices; • Risk of displacement of native vegetation by cheatgrass, categorized by primary
landowner or land manager in Nevada; • Risk of cheatgrass displacement of habitat for greater sage-grouse by Field Office; • Risk of displacement of sagebrush habitats for greater sage-grouse by pinyon-juniper
woodlands in a portion of Nevada; and • Habitat area (amount and percent) at risk of displacement by cheatgrass, summarized for
each of 40 species of conservation concern by Field Office. Other data summarized for the state of Nevada and reported in the complete Great Basin-
Nevada prototype document (Wisdom et al. 2003) include: • Area (amount and percent) of cover types in Nevada (Table 3.3); • Area (amount and percent), by land cover type, burned in Nevada from 1994-2001 (Table
3.4); • Estimated risk of cheatgrass displacement, by land cover type, in Nevada (Table 4.8); • Area (amount and percent) of habitat for 40 species of concern within each species’ range
in Nevada, summarized for sagebrush and non-sagebrush habitats by risk of displacement by cheatgrass (Table 6.4);
• Summaries of watersheds (number and percent) in Nevada according to habitat abundance and habitat at risk of displacement by cheatgrass for each of 5 groups of species of conservation concern (Table 7.3); and
• Amount of habitat for each of 40 species of concern within their respective ranges in Nevada, summarized for sagebrush and non-sagebrush habitats by risk of displacement by cheatgrass (Appendix 4, Tables A4.41-A4.80).
Maps and other figures depicting data compiled specifically for the state of Nevada and presented in Wisdom et al. (2003) include:
• Number of wildland fires and area burned by decade (Fig. 3.1); • Distribution of major land cover types (Fig. 3.2); • Amount of habitat for species of concern (Fig. 6.2); • Percentage of habitat composed of sagebrush for each species of concern (Fig. 6.4); • Percentage of habitat at risk of displacement by cheatgrass for each species (Fig. 6.6);

8
• Watersheds in Nevada, for which habitat proportion and cheatgrass risk were summarized (Fig. 7.4);
• Maps of habitat abundance, habitat risk, and composite conditions for each of 5 groups of species of concern (Figs. 7.6, 7.8, 7.10, 7.12, and 7.14); and
• Maps of habitat for each species within its range in the Great Basin and Nevada, displaying risk of displacement by cheatgrass (Appendix 4, Figs. A4.1-A4.5)
METHODS
Methods used to quantify cover types and habitats at risk for species of concern are described in detail within the appropriate chapters of the Great Basin prototype assessment. A brief description of our methods is included below; the reader is referred to Wisdom et al. (2003) for more detail. Vegetation
For our analyses of the amount of habitat, including sagebrush and other land cover types in the study area, we used the recently completed map referred to as “sagestitch” (Comer et al. 2002; map available at http://sagemap.wr.usgs.gov/). This map was produced with a 90-m grid and was based on existing vegetation, elevation, and soils data available throughout the range of sagebrush (eastern Washington, Oregon, Nevada, and California, eastward through central Colorado and eastern Wyoming and Montana). Sources for the map included the most recent GAP analysis land cover data for several states (e.g., Colorado, California) and regional land cover characterizations developed by the USDA Forest Service (Comer et al. 2002). The sagestitch map was developed explicitly for regional habitat assessment in the sagebrush biome of the Intermountain West. Although sagebrush cover types were the focus of the mapping effort, other cover types, or land cover themes, also were mapped.
Prior to quantifying the amount of habitat by cover type, we reclassified areas in Nevada that have experienced large-scale fires since 1994 as “recently burned” to replace the original cover types present before the fires. This update of recent fires was made with a GIS layer from Region 4 of the U.S. Forest Service, was compiled from several sources (e.g., existing historical data, digitized hard copy maps, and aerial photographs), and includes fires from 1981-2001. For our analyses, however, we used only the fire polygon data from 1994-2001, because the sagestitch map accounted for fires prior to 1994. Moreover, the amount of habitat burned in this region, especially sagebrush, increased dramatically beginning in 1994. Any area in a fire polygon from 1994-2001, regardless of previously existing land cover type, was recoded as “recently burned” and reported as such in our summaries. Vegetation at Risk
Area at Risk of Displacement by Pinyon-Juniper—A model for mapping estimated risk of displacement of sagebrush cover types by pinyon and juniper woodlands was developed for our prototype assessment (Chapter 4). This model applies to any pinyon or juniper land cover type delineated in the sagestitch map, specifically: pinyon-juniper, pinyon pine (primarily single leaf pinyon, Pinus monophylla), Utah juniper (Juniperus osteosperma), and western juniper (J. occidentalis). The model was applied to 3 ecological provinces in the Great Basin: Bonneville,

9
Central High, and High Calcareous; however, only a small portion of the Bonneville Ecological Province lies within Nevada (Figures 1, 2). The decision to apply the model to only 3 of the 14 ecological provinces that occur in Great Basin ecoregion was related to the apparently less accurate classification of pinyon-juniper woodland types in some regions of the Basin, based on the sagestitch map. As more accurate land cover maps become available (e.g., the mid-scale map under development; see Comer et al. 2000), the pinyon-juniper model may be applied to other portions of the Great Basin.
Risk was assigned to 3 categories: low, moderate, or high. All sagebrush cover types were assumed to be at some risk of displacement by pinyon-juniper; thus, the only areas classified as “no risk” were those occupied by other (i.e., non-sagebrush) cover types. Data on habitat at risk of displacement by pinyon-juniper in this report includes only the Nevada portion of the 3 provinces. Results are reported by risk category for individual cover types (e.g., black sagebrush, A. nova), summarized by Field Office. Total risk also is presented for sagebrush on BLM-managed lands versus other lands within Field Offices.
Area at Risk of Displacement by Cheatgrass—A model estimating risk of displacement of sagebrush and other native vegetation cover types by cheatgrass was developed for our prototype assessment (see Chapter 4). This model was applied to the 14 ecological provinces that intersect the Great Basin (Figure 1). In addition to the 8 sagebrush cover types that occur in the Great Basin, other vegetation types also were considered susceptible to invasion by cheatgrass, including bitterbrush (Purshia tridentata), juniper, mixed desert scrub, salt desert scrub, and spiny hopsage (Grayia spinosa).
The rule set developed for the cheatgrass model was topographically driven and based on cover type, ecological province, elevation, aspect, slope, and occurrence of vegetation on valley floors. Risk was assigned to 1 of 3 categories, as in the pinyon-juniper model: low, moderate, or high. All susceptible vegetation types were assumed to be at some risk of displacement by cheatgrass; thus, the only areas with no risk were those occupied by other (i.e., non-susceptible) vegetation cover types. Field sampling to evaluate both the cheatgrass and pinyon-juniper models was initiated in summer 2003, with extensive sampling throughout 3 ecological provinces and more intensive sampling at selected sites.
Results for habitats at risk from cheatgrass are reported by risk category for sagebrush versus other susceptible native vegetation on BLM lands, summarized by Field Office (hereafter, “BLM lands” refers to lands managed by the BLM). Risk also is presented for sagebrush on non-BLM lands, and for all vegetation, within each Field Office. And finally, summaries are presented for all primary landowners in Nevada by risk category (none, low, moderate, or high). Habitats for Species of Concern
For the prototype assessment, data were compiled on habitats for each of the 40 species of concern (Table 1) within each species’ range at both spatial extents (i.e., Great Basin and Nevada; see Chapter 6). For this report, these data also were compiled and presented by Field Office. For greater sage-grouse, further discrimination was made between sagebrush habitats on BLM lands versus other lands, and between sagebrush and all habitats on BLM lands, by Field Office.
In brief, our methods for quantifying habitats for species at any spatial extent were as follows. Species range maps were obtained from a variety of sources (see Chapter 5); the range map for greater sage-grouse used in this report was produced by M. Schroeder (Schroeder 2000).
10
The amount of habitat reported for any species may vary according to the extent of the species’ range in the assessment area, the number of cover types identified as habitat, and the extent of those cover types in the analysis area.
To quantify habitat, we first identified the habitats described in the sagestitch map that were associated with each species, based on literature review and consultation with species experts (see Chapter 6 for details on developing habitat associations). Habitats associated with each species were considered to be “source habitats;” that is, habitats believed to contribute to increasing or stationary population growth rates, and not simply habitats associated with species occurrence (Wisdom et al. 2000). Using these species-source habitat associations, each pixel of habitat within each species’ range at the appropriate spatial extent (e.g., Field Office) was summed to determine total habitat present.
For risk calculations, we used results from the cheatgrass model (Chapter 4) to estimate the amount of habitat at risk from this threat for each species. Using the methods for quantifying total habitat as described above, we calculated the amount of habitat within each of the risk categories (i.e., none, low, moderate, or high) for cheatgrass, summarized by Field Office. For greater sage-grouse, we also report habitat at risk by cheatgrass for sagebrush on BLM-managed versus other lands. For habitats at risk from pinyon-juniper, we did not calculate summaries for Nevada alone, nor by Field Office, with the exception of sage-grouse. Rather, the pinyon-juniper model results were summarized for each of the 40 species across the 3 ecological provinces in eastern Nevada and western Utah in which the model was run (see Table 6.5, Wisdom et al. 2003). RESULTS Vegetation
In Nevada, 8 sagebrush cover types combined extend across 36%, or >10.1 million ha (24.9 million acres), of the state (Table 2b). More than 7.2 million ha (17.8 million acres), or 71%, of sagebrush in the state, occurs on BLM lands. The 2nd most abundant type was salt desert scrub, covering 22%, or 6.2 million ha (15.2 million acres) of Nevada (Table 2b). Pinyon-juniper cover types also were common, totaling 10% of Nevada. More than 4% of Nevada--1.2 million ha (3.1 million acres)--has burned since 1994. Most of the fires have occurred in the Winnemucca and Elko Field Offices, where 476,000 ha (1,176,000 acres) and 413,000 ha (1,020,523 acres) have burned, respectively (Tables 2a, 2b). The recent burns extend over a larger percentage of these Field Offices than the state as a whole: 11% of the Winnemucca Field Office, and 8% of the Elko Field Office, was coded as “recently burned” in our analyses.
The 3 largest Field Offices in Nevada—Battle Mountain, Ely, and Elko—also contained the most sagebrush. The Elko Field Office, though the smallest of the 3, had the most sagebrush (3.0 million ha [7.5 million acres]), followed by Ely and Battle Mountain (Table 2b). This pattern was reflected in the percentage of the Field Office occupied by sagebrush, which was 61% for Elko, followed by 40% for Ely and 35% for Battle Mountain. The 2 smallest Field Offices, Surprise and Eagle Lake, had the largest percentage of total area in sagebrush, 88% and 63%, respectively (Table 2a).
Statewide, Wyoming-basin big sagebrush (A. tridentata wyomingensis-A. t. tridentata) was the most abundant sagebrush type (nearly 60% of all sagebrush in the state), followed by black sagebrush and mountain big sagebrush (A. t. vaseyana; Table 2b). This pattern was

11
repeated in most BLM Field Offices, with Wyoming-basin big sagebrush the dominant sagebrush type in every Field Office, and mountain big sagebrush or black sagebrush the 2nd or 3rd most abundant types in 4 Field Offices: Battle Mountain, Elko, Ely, and Las Vegas (Tables 2a, 2b). In the 4 remaining Field Offices, low sagebrush replaced black sagebrush as the 2nd (Carson City, Eagle Lake, and Surprise) or 3rd (Winnemucca) most abundant type. Vegetation at Risk
Area at Risk of Displacement by Pinyon-Juniper—Portions of 4 of the 8 BLM Field Offices in Nevada occur within the 3 ecological provinces for which the pinyon-juniper model was run. Varying percentages of the sagebrush in these Field Offices fell within the boundaries of the 3 provinces: Ely (85%), Battle Mountain (67%), Elko (15%), and Carson City (2%) (Figure 2). Because of the very small percentage of the Carson City Field Office for which we have results from the pinyon-juniper model, we excluded this Field Office from the following analyses and discussion.
Percentages of sagebrush in each of the categories of risk were similar among the 3 Field Offices, and ranged as follows: low risk, 58.1-63.6%; moderate risk, 3.6-5.5%; and high risk, 32.3-36.4% (Table 3, Figure 2). The relatively small percentage at moderate risk of displacement was a reflection of the threshold effect incorporated in the pinyon-juniper model, by which transitioning from moderate to high risk was very likely for sagebrush in locations with suitable conditions (e.g., proximity to existing pinyon-juniper, precipitation from 25 to 40 cm; Chapter 4).
The degree of risk across sagebrush cover types varied, a reflection of the rule sets as they applied to different cover types and locations. In general, low sagebrush, whether alone or in combination with mountain big sagebrush, was at highest risk among the sagebrush types (Table 3). More than 80% of the low sagebrush was at moderate or high risk of displacement by pinyon-juniper, and 65% of the low sagebrush-mountain big sagebrush was at moderate or greater risk (Table 3). This pattern, however, was not universal across Field Offices. For example, only 58% of the low sagebrush in the Elko Field Office was at moderate or high risk. Note that these types (low sagebrush and low sagebrush-mountain big sagebrush) composed only a small fraction (<2%) of the total sagebrush modeled. Thus, despite having a relatively large proportion of their total extent in moderate or high risk, the absolute amount of sagebrush at moderate or high risk for these types was low (34,700 ha, or 85,700 acres). This combination of high risk and relatively small area may jeopardize the continued existence of these types in certain locales. Taking into account the total area at moderate or high risk, the Wyoming-basin big sagebrush type was most at risk, with nearly 600,000 ha (1.48 million acres) at moderate or greater risk (Table 3).
Overall, black sagebrush and Wyoming-basin big sagebrush were the types with the least risk, based on proportion of the type at risk, with 64 and 68%, respectively, in the low risk category (Table 3). Again, this pattern varied across Field Offices. In Elko Field Office, for example, low sagebrush-Wyoming big sagebrush and mountain big sagebrush had the least risk (79 and 75% in low risk, respectively). Patterns of risk in the Ely Field Office resembled those in Battle Mountain, with black and Wyoming-basin big sagebrush at least risk (Table 3).
Across the 3 Field Offices analyzed for pinyon-juniper risk, Ely had the largest amount of sagebrush at high risk of displacement from pinyon-juniper, with >570,000 ha (>1.41 million acres; Table 3, Figure 2). Although the majority (57%) of sagebrush at high risk in this Field

12
Office was Wyoming-basin big sagebrush, nearly 26% was black sagebrush. Assuming that the 15% of the Field Office upon which the model was not run had the same patterns of risk, the total amount of sagebrush at high risk of displacement from pinyon-juniper woodlands in the Ely Field Office was approximately 670,000 ha (1.66 million acres). Battle Mountain Field Office also had a large absolute amount of sagebrush at high risk, with nearly 470,000 ha (1.16 million acres) in this category. Again, Wyoming-basin big sagebrush composed most (41%) of the sagebrush at high risk; however, mountain big sagebrush contributed nearly as much, with 39% of the high-risk sagebrush in this Field Office (Table 3). Once again assuming that the sagebrush in this Field Office that was not modeled had risk patterns similar to that in the remainder of the Field Office, altogether about 697,000 ha (1.72 million acres) of sagebrush was potentially at high risk, slightly exceeding the amount in the Ely Field Office.
The Elko Field Office had comparatively less sagebrush at high risk, with 163,000 ha (402,000 acres). However, only 15% of the sagebrush in this Field Office fell within the area in which the pinyon-juniper model was run. The percentage of sagebrush at high risk, 36.3%, was comparable to that for the other 2 Field Offices. Unlike those Field Offices, black sagebrush composed most (56%) of the sagebrush at high risk (Table 3).
Of the sagebrush in the 4 Field Offices in Nevada for which we have results from the pinyon-juniper model, 2.8 million ha (6.9 million acres), or 80%, were on public lands managed by the BLM (Table 3). Because sagebrush occurs primarily on public lands, patterns of risk of displacement by pinyon-juniper on BLM lands resembled those for all lands, with about 32% in the high risk category, 3% in moderate risk, and 65% in low risk (Table 3). By contrast, sagebrush on non-BLM lands had relatively higher risk of displacement, with 45% at high risk and only 44% at low risk. One exception to this pattern was seen in the Elko Field Office, where sagebrush on BLM lands was at higher risk than that on other lands (Table 3). Only a small proportion (15%) of the sagebrush in this Field Office, however, was within the boundaries of the ecological provinces on which the model was run.
Area at Risk of Displacement by Cheatgrass—The cheatgrass model (estimating risk of displacement of sagebrush and other susceptible native vegetation types by cheatgrass) developed for our prototype was applied in 14 ecological provinces that encompass the entire state of Nevada (Figure 1). Statewide, risk of displacement of all native vegetation from cheatgrass was as follows: no risk (i.e., land cover type not susceptible to cheatgrass) – 21%; low risk – 34%; moderate risk – 19%; and high risk – 27% (Table 4.8 in Wisdom et al. 2003; Figure 3). Risk for the 8 sagebrush cover types alone (i.e., excluding other native, susceptible types) was somewhat less, although no sagebrush was considered to be at no risk (i.e., all sagebrush was modeled as low, moderate, or high risk): low – 57%; moderate – 29%; and high – 14%. For the non-sagebrush susceptible vegetation, risk was considerably higher: low - 31%; moderate – 19%; and high – 50% (Table 4.8). This disparity was related primarily to the cheatgrass rule set, in which vegetation at lower elevations was at higher risk (see Chapter 4); much of the expansive salt desert scrub and shadscale in Nevada occurs at these lower elevations.
Risk varied among vegetation cover types, both within the sagebrush types and the other native, susceptible types (Table 4.8). Among the 8 sagebrush types, Wyoming-basin big sagebrush was most at risk, with 22% at high risk. This cover type was also at highest risk in terms of absolute area, with >1.26 million ha (3.11 million acres) in Nevada in this category. The second largest amount of sagebrush at high risk was in black sagebrush, but with considerably less area (104,000 ha [257,000 acres]) compared to Wyoming-basin big sagebrush.

13
Mountain big sagebrush had the lowest percentage area in high risk (1%) among the sagebrush types in Nevada, with the exception of threetip sagebrush (A. tripartita), which occurs in only trace amounts in the state.
As mentioned previously, a larger percentage of susceptible, non-sagebrush vegetation was found to be at high risk compared to sagebrush. Salt desert scrub was most at risk in Nevada (79% at high risk); this type also composed the largest absolute amount of vegetation at high risk of displacement from cheatgrass, with >4.8 million ha (12.02 million acres; Table 4.8). Spiny hopsage had the second highest degree of risk (68% at high risk), but composed only 7% of the non-sagebrush at high risk (94,000 ha [232,000 acres]; Table 4.8). Shadscale was also at high risk of displacement, with 48% of this type at high risk, covering >420,000 ha (1.05 million acres).
Among the 8 Field Offices in Nevada, Winnemucca had the highest degree of risk of displacement of native vegetation from cheatgrass, with 41% at high risk, followed by Carson City (31%) and Las Vegas (29%; Table 4). In terms of absolute amount of vegetation at high risk, Winnemucca also had the greatest amount, with 1.83 million ha (4.52 million acres), followed by Battle Mountain (1.46 million ha [3.61 million acres]) and Ely (1.24 million ha [3.06 million acres]).
Considering only sagebrush at risk from cheatgrass on BLM lands, Ely had the greatest degree of risk (24% at high risk), followed by Winnemucca (19%) and Elko (14%). In terms of amount of sagebrush, Ely also had the greatest area in the high-risk category (450,000 ha [1.11 million acres]), followed by Elko and Winnemucca (Table 4).
For all sagebrush on BLM lands in Nevada (7.2 million ha [17.8 million acres]), the majority (53%) was at low risk, 15% at high risk, and 32% at moderate risk (Table 4). By contrast, for the non-sagebrush cover types considered susceptible to risk of displacement, the majority (51%) was at high risk, and only 27% was at low risk (Table 4). This contrasting pattern of risk (i.e., sagebrush versus other susceptible vegetation) on BLM lands resembled that for vegetation on all lands, as discussed previously (also see Chapter 4). Compared to other land ownerships, sagebrush on BLM lands was at slightly higher risk of displacement by cheatgrass, with 47% at moderate or greater risk, versus 34% on non-BLM lands (Table 4). This trend was also seen for other susceptible, non-sagebrush vegetation: 73% was at moderate or greater risk on BLM lands, versus 61% on non-BLM lands.
Comparison Among Landowners and Land Managers of Vegetation at Risk from Cheatgrass—Among the primary landowners in Nevada, vegetation on lands managed by the Departments of Energy and Defense were most at risk of displacement by cheatgrass (42 and 41% at high risk, respectively; Table 5, Figure 4). Other lands at comparatively high risk were those managed by the USDI Fish and Wildlife Service (34%), BLM (29%), private landowners (29%), and USDA Forest Service (28%). Although 29% of state lands were at high risk from cheatgrass, state lands compose <1% of Nevada, and are thus a minor component of habitat at risk from cheatgrass within the state.
Considering both the percentage and absolute amount of land at high risk, the BLM clearly manages the majority of high-risk habitat in Nevada; >70%, or 5.6 million ha (13.8 million acres), of the vegetation at high risk of cheatgrass displacement in Nevada is on BLM lands (Table 5). Private lands compose the second largest amount of high-risk habitat, with >1 million ha (2.5 million acres). The Department of Defense also manages a substantial amount of habitat at high risk from cheatgrass, with >500,000 ha (1.2 million acres; Table 5).

14
Vegetation with least risk from cheatgrass was on lands managed by the Fish and Wildlife Service (54% at no risk), Forest Service (40%), and private landowners (31%; Table 5, Figure 4). In terms of absolute amount, BLM manages the majority of no-risk habitat (>3.3 million ha [8.1 million acres]); private lands were also important, with >1.1 million ha (2.7 million acres) in Nevada at no risk from cheatgrass. Habitats for Species of Concern Amount of Habitat—Habitat summaries for each of the 40 species of concern (e.g., total habitat, and amount and percentage of habitat by risk category) were reported for the entire state of Nevada in Chapter 6 and in Tables A4.41-A4.80 of Wisdom et al. (2003). Species with the most abundant habitat included those with large geographic ranges, such as striped whipsnake, Swainson’s hawk, and western burrowing owl (Fig. 6.2). Mean amount of habitat for species (n = 40) in Nevada was 15.1 million ha (37.3 million acres). Statewide, the dominant category for risk of habitat displacement by cheatgrass was low risk ( = 35%), followed by high risk ( = 28%). However, more than half (n = 21) of the species of concern in Nevada had >50% of their habitat at moderate or greater risk (Fig. 6.6; Table 6.4). As expected, larger Field Offices (e.g., Battle Mountain) contained more habitat for species of concern than smaller ones (e.g., Eagle Lake; Tables 8-16). Exceptions occurred, however, depending on the habitats associated with each species (e.g., salt desert scrub versus sagebrush cover types), the relative abundance of those cover types among Field Offices, and the overlap of species’ ranges with Field Office boundaries. For example, 16 species (40%) had more habitat in Battle Mountain, the largest Field Office, than in any other (Table 16). Elko, although the 3rd largest Field Office, had the most habitat for 11 species, whereas Ely, ranked 2nd in area, had the most habitat for only 5 species (Table 16).
Field Offices with both large areas and high percentages of sagebrush habitats, such as Battle Mountain, Elko, and Ely, tended to provide the greatest amount of habitat for species in the sagebrush group (see Chapter 7 for descriptions of groups of species used in our assessment), such as Brewer’s sparrow, sage thrasher, greater sage-grouse, and vesper sparrow (Tables 8, 11, 12, 16). Habitat for 7 of the 8 species in the salt desert scrub group was most abundant in the Las Vegas Field Office, where not only salt desert scrub was relatively abundant, but also creosote-bursage (Tables 2a, 16). This latter cover type was identified as source habitat for many species in the salt desert scrub group (Table 6.1).
Species in the sagebrush-woodland group were associated with a variety of shrublands in addition to pinyon and juniper cover types. Pinyon-juniper woodlands are most abundant in Nevada in the Battle Mountain and Ely Field Offices (Tables 2a, b). Consequently, habitat for species in the sagebrush-woodland group (e.g., gray flycatcher, Merriam’s shrew, and sagebrush vole) also tended to be most abundant in these Field Offices (Table 16).
Among species of conservation concern in Nevada, habitat for greater sage-grouse encompassed about 8.7 million ha (21.5 million acres) within the species’ current range in Nevada (Table A4.41; Figure 5). More than 95% of this habitat was sagebrush, primarily Wyoming-basin big sagebrush; however, substantial habitat occurred in mountain big sagebrush and black sagebrush communities (Table A4.41). Only a small percentage of sage-grouse habitat was composed of vegetation other than sagebrush (bunchgrass and wet meadows; Table A4.41, Figure 5). Most (71%) habitat for sage-grouse in Nevada was on public lands managed by the BLM (Table 7).

15
For the 7 Field Offices within the current range of sage-grouse in Nevada (all but Las Vegas), Elko had by far the most habitat for the species, with >3.1 million ha (7.7 million acres; Table 7). Battle Mountain, Ely, and Winnemucca also had substantial amounts of sage-grouse habitat, with each Field Office supporting >1.3 million ha (3.2 million acres). The percentage of sage-grouse habitat on BLM lands in each Field Office mirrored that state-wide, and ranged from 59% in Carson City to 96% in Eagle Lake (Table 7). The Carson City Field Office contains >290,000 ha (716,000 acres) of habitat for sage-grouse; this Field Office includes birds in the Mono Basin population (Table 7).
As for sage-grouse, habitat for pygmy rabbit was most abundant in the Elko Field Office (3.4 million ha [8.4 million acres]); however, Winnemucca also contained large amounts of habitat for this species (2.0 million ha [4.9 million acres]; Tables 11, 15, 16). The pygmy rabbit, like sage-grouse, is highly dependent on sagebrush habitats; >80% of its habitat in Nevada was composed of sagebrush, primarily Wyoming-basin big sagebrush and mountain big sagebrush (Table A4.47). Habitat for western burrowing owl, which is considered a “sensitive species” by several agencies and organizations (Table 1), was most abundant in the Battle Mountain Field Office, closely followed by Elko (Table 16).
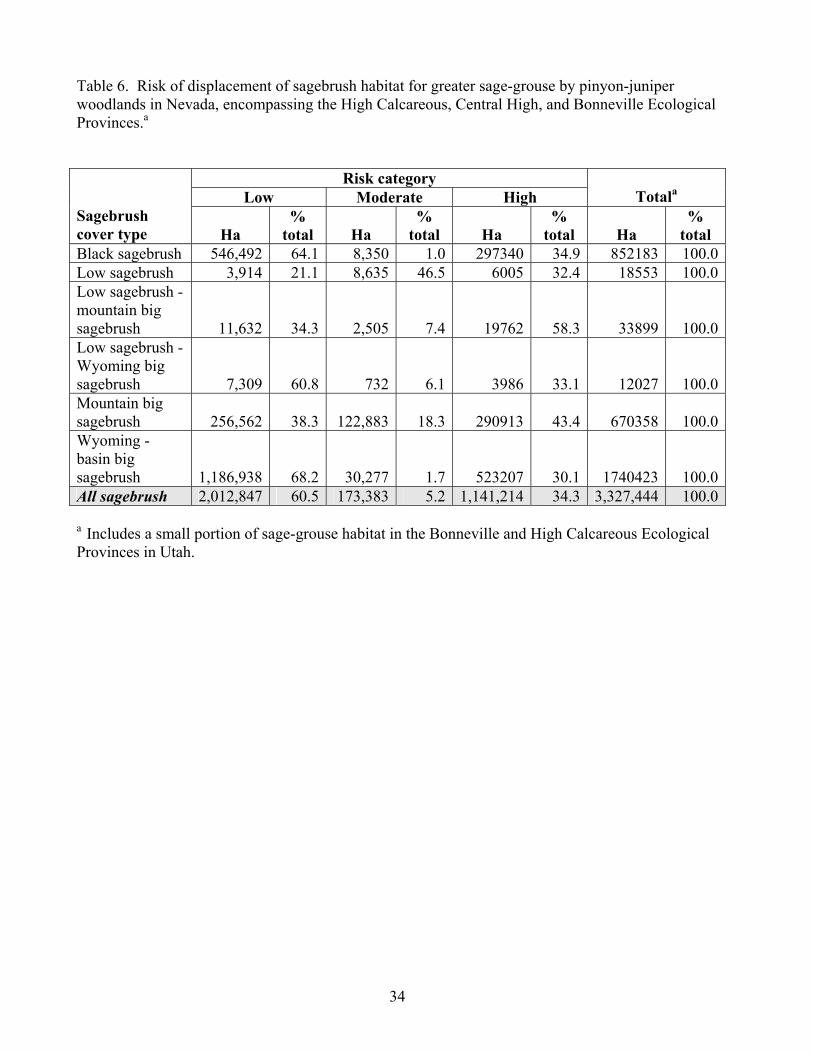
Habitat at Risk of Displacement by Pinyon-Juniper—Greater sage-grouse habitat at risk of displacement by pinyon-juniper woodlands was evaluated within the current range of sage-grouse in the 3 ecological provinces on which the model was run: Bonneville, Central High, and High Calcareous (Figure 2). Of the 3.3 million ha (8.1 million acres) of sagebrush habitat for sage-grouse in this area, 34% was at high risk, 5 % at moderate risk, and 61% at low risk (Table 6). Among the various sagebrush land cover types used as habitat, Wyoming-basin big sagebrush encompassed the largest amount of habitat at high risk (523,000 ha [1,292,000 acres]; Table 6). Although separate summaries for sage-grouse habitat at risk of displacement by pinyon-juniper for each Field Office were not completed, these patterns should resemble those seen in the Field Office results for all sagebrush at risk (Table 3), owing to the nearly complete reliance of sage-grouse on sagebrush for habitat. Habitat at Risk of Displacement by Cheatgrass—Among Field Offices, patterns of habitat at risk of displacement by cheatgrass for the 40 species in our assessment followed those for vegetation at risk described above. For example, the Winnemucca Field Office had the greatest amount of habitat at high risk from cheatgrass displacement for 18 species (45%), the most of any Field Office, including western burrowing owl, black-throated sparrow, pronghorn, and sagebrush lizard (Tables 8-15). These species tended to be those in the shrubland or generalist group of species (Chapter 7). Ely and Battle Mountain also had substantial amounts of high-risk habitat, ranking 1st for 8 and 7 species, respectively. These species tended to be in the sagebrush (Ely) and salt desert scrub (Battle Mountain) species groups (Tables 8-15).
Across the range of greater sage-grouse in Nevada, the majority of habitat (60%) was at low risk of displacement by cheatgrass, 25% was at moderate risk, 14% was at high risk, and only a trace (in wet meadow) was at no risk (Table 7). Because most habitat for sage-grouse is sagebrush, these percentages resembled those for sagebrush vegetation at risk of displacement by cheatgrass across Nevada (Table 4.8). Field offices with the greatest amounts of sage-grouse habitat at high risk were Elko (514,000 ha [1,270,000 acres]), Winnemucca (334,000 ha [825,000 acres]), and Ely (212,000 ha [24,000 acres]); this pattern was not surprising, given the relative abundance of sage-grouse habitat in these areas (Table 7). In terms of degree of risk, Winnemucca had the highest percentage of sage-grouse habitat at high risk (24%), followed by Elko (16%) and Ely (14%). Carson City, where birds of the Mono Basin population occur, had a

16
moderate degree of risk, with nearly half (48%) of habitat for sage-grouse in this Field Office at low risk and 13% at high risk (Table 9).
The risk of displacement of sage-grouse habitat by cheatgrass on BLM lands versus other lands varied across Field Offices (Table 7). In Battle Mountain and Ely, risk was substantially lower on other lands versus BLM lands, with about half the percentage of habitat at low risk on BLM lands. In the Carson City Field Office, risk was somewhat lower on other lands, and in the remaining Field Offices, percentage of sage-grouse habitat at low risk was similar between BLM lands and other lands (Table 7).
About 35% (519,000 ha [1,282 acres]) of the high-risk habitat for pygmy rabbit was in the Elko Field Office; substantial amounts also occurred in Winnemucca and Ely (Tables 11, 12, 15). Habitat for pygmy rabbit at moderate risk was most abundant in the Ely Field Office (Table 12). Western burrowing owl had the largest amount of its high-risk habitat in Winnemucca, followed closely by Battle Mountain (Tables 8, 15). MANAGEMENT IMPLICATIONS
Sagebrush habitats are of special concern in current land management in Nevada, due to their high vulnerability to displacement by cheatgrass and pinyon-juniper woodlands. Nevada supports >10.1 million ha (24.9 million acres) of sagebrush, more than any other state. Of this vast amount, 72% is on lands managed by the BLM. Thus, effective and prudent management of sagebrush on BLM lands in Nevada is critical to maintenance of the sagebrush ecosystem as a whole in the Intermountain West. Very little sagebrush in Nevada occurs on lands protected outright from degradation by disturbances such as energy development or inappropriate livestock grazing (Table 5).
Mapping of threats in the sagebrush ecosystem, as accomplished for our prototype assessment, allows managers to identify areas of sagebrush at high risk of displacement, where active restoration may be required, versus areas at low risk, where conservation of existing habitats may be preferable. Although a clear majority of the native vegetation at high risk to displacement by cheatgrass occurs on lands managed by BLM, a substantial amount of high-risk habitat also occurs on private lands. Private lands in Nevada often adjoin lands managed by federal agencies, including the U.S. Forest Service, BLM, and Department of Defense. Effective management of habitats at high risk to cheatgrass will require extensive cooperation and collaboration between federal agencies and private landowners. Such collaboration is already underway, under the auspices of GBRI (USDI BLM 1999) and working groups such as the Eastern Nevada Landscape Coalition (http://www.envlc.org/home.htm).
Perhaps more important than managing high-risk habitats, which may already have transitioned to cheatgrass-dominated understories, is managing moderate-risk habitats. These habitats have likely not yet passed the threshold beyond which restoration to native conditions is very costly and difficult to achieve (Chapter 4). In Nevada, >4 million ha (9.9 million acres) of vegetation at moderate risk is on BLM-managed lands, and >500,000 ha (>1.2 million acres) is on private lands. Again, intensive collaboration between federal land management agencies and private landowners will improve efficiency in restoration of degraded native shrublands and may increase the probability of success in preventing native habitats from transitioning into the cheatgrass-wildfire cycle.

17
LITERATURE CITED Benedict, N. G., S. J. Oyler-McCance, S. E. Taylor, C. E. Braun, and T. W. Quinn. 2003.
Evaluation of the eastern (Centrocercus urophasianus urophasianus) and western (Centrocercus urophasianus phaios) subspecies of sage-grouse using mitochondrial control-region sequence data. Conservation Genetics 4:301-310.
Bunting, S. C., J. L. Kingery, M. A. Hemstrom, M. A. Schroeder, R. A. Gravenmier, and W. J.
Hann. 2002. Altered rangeland ecosystems in the interior Columbia Basin. USDA Forest Service General Technical Report PNW-GTR-553.
Comer, P., P. Crist, D. Dippon, S. Knick, M. Hilliard, P. Maus, and C. McCarthy. 2000.
Proposal for broad and mid-scale mapping of sagebrush ecosystem in the Intermountain West. NatureServe, Boulder, Colorado, USA.
Comer, P., J. Kagan, M. Heiner, and C. Tobalske. 2002. Current distribution of sagebrush and
associated vegetation in the Western United States (excluding NM and AZ). Digital map. NatureServe, Boulder, Colorado, USA. Available online at: http://SAGEMAP.wr.usgs.gov).
Knick, S. T. 1999. Requiem for a sagebrush ecosystem? Northwest Science 73:53-57.
Kritz, K. 2003. Summary of sage grouse petitions submitted to the U. S. Fish and Wildlife Service. USDI Fish and Wildlife Service, Reno, Nevada, USA. Available online at: http://sagemap.wr.usgs.gov/documents.asp.
Miller, R. F., and L. L. Eddleman. 2000. Spatial and temporal changes of sage-grouse habitat in
the sagebrush biome. Oregon State University Agricultural Experiment Station Technical Bulletin 151.
Miller, R., R. Tausch, and W. Waichler. 1999. Old-growth juniper and pinyon woodlands. Pages 375-384 in S. B. Monsen, and R. Stevens, compilers. Proceedings: ecology and management of pinyon-juniper communities within the Interior West. USDA Forest Service Proceedings RMRS-P-9.
Nachlinger, J., K. Sochi, P. Comer, G. Kittel, and D. Dorfman. 2001. Great Basin: an
ecoregion-based conservation blueprint. The Nature Conservancy, Reno, Nevada, USA. Neel, L., editor. 1999. Nevada Partners in Flight Bird Conservation Plan. Nevada Partners in
Flight, Reno, Nevada, USA. Nevada Bureau of Land Management. 2003. Nevada BLM sensitive species. USDI Department
of the Interior, Bureau of Land Management, Nevada State Office; Nevada Department of Conservation and Natural Resources; and Nevada Department of Wildlife, Reno, Nevada, USA.

18
Rich, T. D., C. J. Beardmore, H. Berlanga, P. B. Blancher, M. S. W. Bradstreet, G. S. Butcher, D. Demarest, E. H. Dunn, W. C. Hunter, E. Iigo-Elias, J. A. Kennedy, A. Martell, A. Panjabi, D. N. Pashley, K. V. Rosenberg, C. Rustay, S. Wendt, and T. Will. 2003. Partners in Flight North American Landbird Conservation Plan. Cornell University, Ithaca, New York, USA.
Rowland, M. M., compiler. 2003. Summary results for BLM Field Offices in Nevada from a
regional assessment of sagebrush habitats. USDA Forest Service, La Grande, Oregon, USA.
Schroeder, M. 2000. Current and historic distribution of Greater and Gunnison Sage-grouse in
North America. Edition: 1.1. Washington Department of Fish and Wildlife. Olympia, Washington, USA.
Tausch, R. J., and N. E. West. 1988. Differential establishment of pinyon and juniper following
fire. American Midland Naturalist 119:174-184. USDI Bureau of Land Management. 1999. The Great Basin Restoration Initiative: out of ashes,
an opportunity. Bureau of Land Management, National Office of Fire and Aviation, Boise, Idaho, USA.
USDI Bureau of Land Management. 2002. Management considerations for sagebrush
(Artemisia) in the western United States: a selective summary of current information about the ecology and biology of woody North American sagebrush taxa. U.S. Department of the Interior, Bureau of Land Management, Washington, DC, USA.
USDI Bureau of Land Management. 2003. Draft BLM Sage-grouse Habitat Conservation
Strategy. Available online: http://www.blm.gov/nhp/spotlight/sage_grouse/. U.S. Government. 2002. Rules and regulations. Federal Register 67:248 (December 26, 2002):
78811-78815. Webb, R. 2001. Status review of the Mono Basin distinct population segment of the Greater
sage-grouse (Centrocercus urophasianus phaios). Publication Number 361-01. Institute for Wildlife Protection, Eugene, Oregon, USA.
West, N. E., R. J. Tausch, and P. T. Tueller. 1998. A management-oriented classification of
pinyon-juniper woodlands of the Great Basin. USDA Forest Service General Technical Report RMRS-GTR-12.
Wisdom, M. J., R. S. Holthausen, B. C. Wales, C. D. Hargis, V. A. Saab, D. C. Lee, W. J. Hann,
T. D. Rich, M. M. Rowland, W. J. Murphy, and M. R. Eames. 2000. Source habitats for terrestrial vertebrates of focus in the interior Columbia basin: broad-scale trends and management implications. USDA Forest Service General Technical Report PNW-GTR-485.

19
Wisdom, M. J., L. H. Suring, M. M. Rowland, R. J. Tausch, R. F. Miller, L. Schueck, C. Wolff Meinke, S. T. Knick, B. C. Wales, and M. Leu. 2003. A prototype regional assessment of habitats for species of conservation concern in the Great Basin Ecoregion and Nevada. Version 1, July 2003, unpublished report on file at USDA Forest Service, Pacific Northwest Research Station, 1401 Gekeler Lane, La Grande, OR 97850, USA.

20
Table 1. Forty species of conservation concern identified for regional assessment in the Great Basin and Nevada and their current status under selected conservation criteria.a
Common name Scientific name
NV sensitive
animal listb USFWSc
NV BLM sensitive speciesd
NV PIF priority speciese
Amphibians:
Great Basin spadefoot Scaphiopus intermontanus
Reptiles: Great Basin collared lizard
Crotaphytus insularis
Long-nosed leopard lizard
Gambelia wislizenii
Desert horned lizard Phrynosoma platyrhinos
Common sagebrush lizard
Sceloporus graciosus
Desert spiny lizard Sceloporus magister
Nightsnake Hypsiglena torquata
Striped whipsnake Masticophis taeniatus
Long-nosed snake Rhinocheilus lecontei
Groundsnake Sonora semiannulata
Birds: Ferruginous hawk Buteo regalis X xC2 X X Swainson's hawk Buteo swainsoni X X X Northern harrier Circus cyaneus Prairie falcon Falco mexicanus X X
Greater sage-grouse Centrocercus urophasianus X X X
Short-eared owl Asio flammeus X X
Western burrowing owl
Speotyto cunicularia hypugaea X xC2 X X
Gray flycatcher Empidonax wrightii X
Sage thrasher Oreoscoptes montanus X
Loggerhead shrike Lanius ludovicianus X X Sage sparrow Amphispiza belli X
Black-throated sparrow Amphispiza bilineata
Lark sparrow Chondestes grammacus
Green-tailed towhee Pipilo chlorurus

21
Table 1. Forty species of conservation concern identified for regional assessment in the Great Basin and Nevada and their current status under selected conservation criteria.a
Common name Scientific name
NV sensitive
animal listb USFWSc
NV BLM sensitive speciesd
NV PIF priority speciese
Vesper sparrow Pooecetes gramineus X X
Brewer's sparrow Spizella breweri X
Brewer's blackbird Euphagus cyanocephalus
Mammals: Merriam's shrew Sorex merriami X f Kit fox Vulpes macrotis
Pronghorn Antilocapra americana
Wyoming ground squirrel
Spermophilus elegans nevadensis
Merriam's kangaroo rat Dipodomys merriami
Chisel-toothed kangaroo rat
Dipodomys microps
Ord's kangaroo rat Dipodomys ordii
Dark kangaroo mouse Microdipodops megacephalus Xg xC2 Xg
Little pocket mouse Perognathus longimembris
Northern grasshopper mouse
Onychomys leucogaster
Sagebrush vole Lemmiscus curtatus White-tailed jackrabbit Lepus townsendii
Pygmy rabbit Brachylagus idahoensis Xf xC2 X
a See Table 5.1 in Wisdom et al. (2003) for Nevada state rankings assigned by NatureServe Explorer to each species. b List produced by the Nevada Natural Heritage Program (NVNHP) (available online at http://heritage.nv.gov/sensanim.htm). Species on this list are those “whose long-term viability has been identified as a concern.” c xC2 = former Category-2 candidate, now "species of concern." d Species in this list are those not already included as BLM Special Status Species (federally listed, proposed, or candidate species under the Endangered Species Act) or listed by the state of Nevada (Nevada BLM 2003). List also available online at http://www.nv.blm.gov/wildlife/wildlife.htm. e Species found on the Nevada Partners in Flight Priority Species list ; note that only birds are included in this list. See Neel (1999) for specific habitats associated with each species. f Species is on the NVNHP “watch list,” which includes taxa that may qualify as sensitive animals in the future (list available online at http://heritage.nv.gov/watch.htm) gTwo subspecies of the dark kangaroo mouse, Desert valley (M. m. albiventer) and Fletcher (M. m. nasutus), are considered “sensitive species.” These taxa are endemic to Nevada.

22
Table 2a. Cover types within the Carson City, Eagle Lake, Las Vegas, and Surprise Field Offices in Nevada.
Field Office Carson City Eagle Lake Las Vegas Surprise
Cover type Ha % total Ha % total Ha % total Ha % total Sagebrush: Black sagebrush 96,496 3 0 0 708 0 0 0Low sagebrush 160,310 5 16,475 13 0 0 89,004 12Low sagebrush - mountain big sagebrush 27,427 1 2,907 2 0 0 5,512 1Low sagebrush - Wyoming big sagebrush 12,118 0 1,329 1 0 0 2,241 0Mountain big sagebrush 98,820 3 8,405 7 1,819 0 38,542 5Silver sagebrush 180 0 448 0 0 0 0 0Threetip sagebrush 0 0 0 0 0 0 0 0Wyoming – basin big sagebrush 228,692 6 51,477 40 409,533 10 521,490 70Total sagebrush 624,043 18 81,041 63 412,060 10 656,790 88Other vegetation: Agriculture 112,205 3 992 1 13,584 0 3,020 0Ash 0 0 0 0 4,319 0 0 0Aspen 816 0 0 0 36 0 0 0Barren/Rock/Lava 220,569 6 919 1 26,657 1 6,476 1Bitterbrush 125,709 4 5,361 4 0 9,125 1Black greasewood 242,704 7 9,577 7 14,487 0 13,906 2Blackbrush 0 0 0 0 649,506 16 0 0Bunchgrass 41,473 1 943 1 37,155 1 13,375 2Chaparral 2,438 0 0 0 0 0 0 0Creosote-Bursage 0 0 0 0 1,241,191 31 0 0Desert grassland 3,275 0 0 0 0 0 866 0Dunes 8,573 0 0 0 411 0 0 0Exotic 484 0 0 0 0 0 0 0Forbland 467 0 0 0 338 0 0 0Forest 57,162 2 0 0 27,773 1 0 0

23
Table 2a. Cover types within the Carson City, Eagle Lake, Las Vegas, and Surprise Field Offices in Nevada.
Field Office Carson City Eagle Lake Las Vegas Surprise
Cover type Ha % total Ha % total Ha % total Ha % total Marsh/Wetland 56,487 2 0 0 0 0 279 0Mesic shrubs 0 0 0 0 0 0 0 0Mesquite 0 0 0 0 7,313 0 0 0Mountain mahogany 659 0 0 0 0 0 0 0Mountain shrub 15,087 0 0 0 61,014 2 9,731 1Pinyon juniper 58,373 2 0 0 89,461 2 0 0Pinyon pine 243,335 7 0 0 41,811 1 0 0Rabbitbrush 18,701 1 0 0 0 0 0Recently burned 137,671 4 0 0 6,334 0 14,932 2Riparian 14,894 0 21 0 6,208 0 240 0Salt desert scrub 1,168,402 33 30,388 24 1,141,002 29 11,680 2Saltbush 4,167 0 0 0 0 0 0 0Shadscale 169,123 5 1 0 1,854 0 717 0Snow/Ice 0 0 0 0 0 0 0 0Spiny hopsage 39,403 1 0 0 16,952 0 0 0Urban 75,242 2 0 0 94,869 2 0 0Utah juniper 11,485 0 0 0 19,920 1 11 0Water 80,487 2 2 0 32,461 1 1,972 0Western juniper 0 0 0 0 0 0 0 0Wet meadow 1,365 0 15 0 0 0 132 0Winterfat 12,293 0 28 0 0 0 0 0Total other vegetation 2,927,740 82 48,247 37 3,534,656 89 86,461 12TOTAL AREA 3,551,783 100 129,288 100 3,946,716 100 743,252 100

24
Table 2b. Cover types within the Battle Mountain, Elko, Ely, and Winnemucca Field Offices, and statewide, in Nevada.
Field Office Battle Mountain Elko Ely Winnemucca Nevada
Cover type Ha % total Ha % total Ha % total Ha % total Ha % totalSagebrush: Black sagebrush 545,162 10 488,183 10 449,806 9 43,601 1 1,623,957 6Low sagebrush 18,649 0 382,372 8 1,924 0 149,959 3 818,693 3Low sagebrush - mountain big sagebrush 34,010 1 87,069 2 9,556 0 37,343 1 203,824 1Low sagebrush - Wyoming big sagebrush 10,965 0 62,328 1 360 0 44,160 1 133,503 0Mountain big sagebrush 384,502 7 518,669 10 264,523 5 256,746 6 1,572,027 6Silver sagebrush 0 0 1,288 0 0 0 236 0 2,151 0Threetip sagebrush 0 0 0 0 0 0 467 0 467 0Wyoming - basin big sagebrush 918,616 17 1,481,876 30 1,360,397 26 830,837 19 5,802,919 20Total sagebrush 1,911,905 35 3,021,784 61 2,086,566 40 1,363,349 30 10,157,539 36Other vegetation: Agriculture 63,530 1 147,017 3 57,559 1 120,095 3 518,003 2Ash 0 0 0 0 0 0 0 0 4,319 0Aspen 10,879 0 74,030 1 7,133 0 9,999 0 102,893 0Barren/Rock/Lava 92,300 2 27,916 1 31,242 1 346,614 8 752,693 3Bitterbrush 1,882 0 40,711 1 761 0 10,637 0 194,185 1Black greasewood 235,476 4 159,034 3 125,578 2 427,264 10 1,228,026 4Blackbrush 26,371 0 0 0 271,572 5 0 0 947,449 3Bunchgrass 56,532 1 133,586 3 78,159 1 167,766 4 528,987 2Chaparral 0 0 0 0 0 0 0 0 2,438 0Creosote-Bursage 11,321 0 0 0 193,577 4 0 0 1,446,090 5Desert grassland 228 0 7,595 0 0 0 696 0 12,660 0Dunes 754 0 0 0 0 0 9,427 0 19,165 0Exotic 134 0 43 0 0 0 0 0 661 0Forbland 2,000 0 1,800 0 3,221 0 0 0 7,826 0

25
Table 2b. Cover types within the Battle Mountain, Elko, Ely, and Winnemucca Field Offices, and statewide, in Nevada.
Field Office Battle Mountain Elko Ely Winnemucca Nevada
Cover type Ha % total Ha % total Ha % total Ha % total Ha % totalForest 24,465 0 29,292 1 102,719 2 62 0 241,472 1Marsh/Wetland 1,408 0 22,736 0 17,221 0 16,455 0 114,586 0Mesic shrubs 2,142 0 58 0 0 0 10 0 2,210 0Mesquite 0 0 0 0 0 0 0 0 7,313 0Mountain mahogany 1,831 0 0 0 0 0 0 0 2,490 0Mountain shrub 38,347 1 126,888 3 121,892 2 29,656 1 402,615 1Pinyon juniper 355,372 7 158,590 3 721,415 14 329 0 1,383,540 5Pinyon pine 456,781 8 58,619 1 361,202 7 46 0 1,161,795 4Rabbitbrush 5,510 0 7,683 0 5,305 0 1,209 0 38,408 0Recently burned 146,773 3 412,891 8 53,981 1 476,190 11 1,248,772 4Riparian 7,348 0 27,962 1 7,265 0 14,253 0 78,190 0Salt desert scrub 1,543,073 28 321,579 6 708,047 13 1,236,147 28 6,160,318 22Saltbush 18,611 0 7,593 0 11,058 0 833 0 42,262 0Shadscale 360,589 7 92,596 2 60,286 1 194,006 4 879,172 3Snow/Ice 0 2,304 0 565 0 7 0 2,877 0Spiny hopsage 21,919 0 636 0 55,537 1 3,258 0 137,705 0Urban 14,635 0 23,701 0 8,719 0 15,908 0 233,074 1Utah juniper 16,006 0 29,350 1 128,657 2 31,631 1 237,060 1Water 825 0 2,219 0 85 0 3,889 0 121,941 0Western juniper 0 0 608 0 0 0 0 0 608 0Wet meadow 523 0 8,925 0 786 0 1,548 0 13,294 0Winterfat 20,092 0 17,415 0 33,323 1 2,790 0 85,941 0Total other vegetation 3,537,661 65 1,943,376 39 3,166,864 60 3,120,724 70 18,361,037 64TOTAL AREA 5,449,565 100 4,965,161 100 5,253,430 100 4,484,073 100 28,523,268 100

26
Table 3. Risk of displacement of sagebrush cover types by pinyon-juniper woodlands within Bureau of Land Management Field Offices in the state of Nevada, encompassing the High Calcareous, Central High, and Bonneville Ecological Provinces.
Risk category Low Moderate High Totala
Sagebrush cover type Ha % total Ha % total Ha % total Ha % totalBattle Mountain
Black sagebrush 205,761.9 71.7 3,466.0 1.2 77,755.1 27.1 286,983.0 100.0Low sagebrush 902.3 10.3 3,485.4 39.9 4,357.8 49.8 8,745.6 100.0Low sagebrush - mountain big sagebrush 4,091.3 27.1 2,339.3 15.5 8,679.2 57.4 15,109.7 100.0Low sagebrush - Wyoming big sagebrush 1,686.4 36.1 575.9 12.3 2,415.4 51.6 4,677.8 100.0Mountain big sagebrush 103,919.0 30.6 51,756.6 15.3 183,701.5 54.1 339,377.0 100.0Wyoming - basin big sagebrush 430,197.5 68.3 8,994.2 1.4 190,469.1 30.2 629,660.8 100.0Total sagebrush – BLM lands 574,251.1 68.2 32,659.2 3.9 235,397.3 27.9 842,307.7 100.0Total sagebrush – other lands 172,307.3 39.0 37,958.2 8.6 231,908.8 52.5 442,246.2 100.0Total sagebrush – entire Field Office area 746,558.4 58.1 70,617.4 5.5 467,378.1 36.4 1,284,553.9 100.0
Elko Black sagebrush 91,586.7 49.0 2,937.1 1.6 92,423.4 49.4 186,947.2 100.0Low sagebrush 1,871.9 42.6 1,749.6 39.8 776.8 17.7 4,398.3 100.0Low sagebrush - mountain big sagebrush 3,389.0 37.1 89.1 1.0 5,658.7 61.9 9,136.8 100.0Low sagebrush - Wyoming big sagebrush 5,536.4 79.2 156.3 2.2 1,301.7 18.6 6,994.4 100.0Mountain big sagebrush 35,422.9 75.3 6,225.7 13.2 5,416.5 11.5 47,065.1 100.0Wyoming - basin big sagebrush 132,700.7 67.7 5,150.0 2.6 58,171.0 29.7 196,021.6 100.0

27
Table 3. Risk of displacement of sagebrush cover types by pinyon-juniper woodlands within Bureau of Land Management Field Offices in the state of Nevada, encompassing the High Calcareous, Central High, and Bonneville Ecological Provinces.
Risk category Low Moderate High Totala
Sagebrush cover type Ha % total Ha % total Ha % total Ha % totalTotal sagebrush – BLM lands 209,103.9 57.6 9,468.1 2.6 144,438.4 39.8 363,010.4 100.0Total sagebrush – other lands 61,403.7 70.1 6,839.6 7.8 19,309.6 22.1 87,552.9 100.0Total sagebrush – entire Field Office area 270,507.6 60.0 16,307.7 3.6 163,748.0 36.3 450,563.3 100.0
Ely Black sagebrush 289,377.4 66.2 1,935.9 0.4 145,520.6 33.3 436,833.8 100.0Low sagebrush 219.5 11.4 1,068.4 55.5 635.9 33.1 1,923.8 100.0Low sagebrush - mountain big sagebrush 4,522.2 47.4 77.0 0.8 4,934.5 51.8 9,533.7 100.0Low sagebrush - Wyoming big sagebrush 92.3 25.6 0.0 268.1 74.4 360.5 100.0Mountain big sagebrush 106,668.9 40.9 61,792.5 23.7 92,034.6 35.3 260,496.0 100.0Wyoming - basin big sagebrush 721,989.5 68.4 5,963.2 0.6 327,256.2 31.0 1,055,208.9 100.0Total sagebrush – BLM lands 1,045,589.3 65.7 41,766.8 2.6 503,240.0 31.6 1,590,596.2 100.0Total sagebrush – other lands 77,280.5 44.5 29,070.1 16.7 67,409.8 38.8 173,760.4 100.0Total sagebrush – entire Field Office area 1,122,869.8 63.6 70,836.9 4.0 570,649.9 32.3 1,764,356.6 100.0
All Field Officesb Black sagebrush 587,556.2 64.4 8,350.3 0.9 316,978.9 34.7 912,885.4 100.0Low sagebrush 2,993.8 19.9 6,303.4 41.8 5,770.4 38.3 15,067.6 100.0Low sagebrush - mountain big sagebrush 12,172.7 34.9 2,505.3 7.2 20,160.9 57.9 34,838.9 100.0Low sagebrush - Wyoming big sagebrush 7,315.1 60.7 732.2 6.1 3,996.5 33.2 12,043.9 100.0

28
Table 3. Risk of displacement of sagebrush cover types by pinyon-juniper woodlands within Bureau of Land Management Field Offices in the state of Nevada, encompassing the High Calcareous, Central High, and Bonneville Ecological Provinces.
Risk category Low Moderate High Totala
Sagebrush cover type Ha % total Ha % total Ha % total Ha % totalMountain big sagebrush 246,318.6 37.8 120,724.8 18.5 284,316.5 43.6 651,359.9 100.0Wyoming - basin big sagebrush 1,291,159.4 68.4 20,107.4 1.1 576,869.9 30.6 1,888,136.7 100.0Total sagebrush – BLM lands 1,836,508.1 65.3 84,855.6 3.0 889,278.8 31.6 2,810,642.5 100.0Total sagebrush – other lands 311,007.6 44.2 73,868.0 10.5 318,814.4 45.3 703,689.9 100.0Total sagebrush – all Field Offices 2,147,515.7 61.1 158,723.6 4.5 1,208,093.1 34.4 3,514,332.4 100.0
a Totals in this column are reported only for the portion of each Field Office that lies within one or more of the 3 ecological provinces for which the pinyon-juniper model was applied, and not for the entire Field Office. b Includes sagebrush in the Carson City Field Office which fell within the boundaries of the pinyon-juniper model, but was only 2% of the sagebrush in this Field Office overall.

29
Table 4. Risk of displacement of sagebrush and other susceptible native vegetation by cheatgrass within Bureau of Land Management Field Offices in Nevada.
Risk category None Low Moderate High Total
Field Office Ha % total Ha % total Ha % total Ha % total Ha % totalBattle Mountain Sagebrush - BLM lands 0 0.0 644,492.7 47.1 596,939.2 43.6 127,655.2 9.3 1,369,087.1 100.0Other susceptible vegetation - BLM lands 0 0.0 602,141.0 24.3 619,402.1 25.0 1,255,752.7 50.7 2,477,295.9 100.0Total vegetation - BLM lands 383,409.5 9.1 1,246,633.7 29.5 1,216,341.4 28.8 1,383,407.9 32.7 4,229,792.5 100.0Sagebrush - other lands 0 0.0 453,832.5 83.6 76,571.7 14.1 12,413.3 2.3 542,817.5 100.0Total vegetation in Field Office 517,927.8 9.5 2,136,886.9 39.2 1,330,429.9 24.4 1,464,320.4 26.9 5,449,565.0 100.0Carson City Sagebrush - BLM lands 0 0.0 205,484.0 54.9 129,287.3 34.5 39,660.0 10.6 374,431.4 100.0Other susceptible vegetation - BLM lands 0 0.0 274,194.7 20.1 417,117.6 30.5 674,050.4 49.4 1,365,362.7 100.0Total vegetation - BLM lands 312,021.7 15.2 479,678.8 23.4 546,404.9 26.6 713,710.4 34.8 2,051,815.9 100.0Sagebrush - other lands 0 0.0 108,418.5 43.8 92,896.5 37.6 45,982.1 18.6 247,297.1 100.0Total vegetation in Field Office 840,209.8 24.2 783,686.3 22.6 765,804.8 22.1 1,076,836.7 31.1 3,466,537.6 100.0Eagle Lake Sagebrush - BLM lands 0 0.0 54,419 69.0 19,710 25.0 4,702 6.0 78,831 100.0

30
Table 4. Risk of displacement of sagebrush and other susceptible native vegetation by cheatgrass within Bureau of Land Management Field Offices in Nevada.
Risk category None Low Moderate High Total
Field Office Ha % total Ha % total Ha % total Ha % total Ha % totalOther susceptible vegetation - BLM lands 0 0.0 54,419 69.0 19,710 25.0 4,702 6.0 78,831 100.0Total vegetation - BLM lands 9,028 4.5 112,273 56.0 51,058 25.5 28,052 14.0 200,412 100.0Sagebrush - other lands 0 0.0 1,529 69.2 668 30.2 12 0.5 2,210 100.0Total vegetation in Field Office 11,555 5.6 113,994 54.8 53,155 25.5 29,415 14.1 208,118 100.0Elko Sagebrush - BLM lands 0 0.0 1358378 69.6 323,213 16.6 271,258 13.9 1,952,849 100.0Other susceptible vegetation - BLM lands 0 0.0 427761 48.4 160,722 18.2 295,929 33.5 884,412 100.0Total vegetation - BLM lands 160,847 5.4 1786139 59.6 483,935 16.1 567,187 18.9 2,998,109 100.0Sagebrush - other lands 0 0.0 740341 69.3 152,237 14.2 176,357 16.5 1,068,935 100.0Total vegetation in Field Office 555,764 11.2 2820853 56.8 697,259 14.0 891,285 18.0 4,965,161 100.0Ely Sagebrush - BLM lands 0 0.0 638,487 33.5 818,144 42.9 450,352 23.6 1,906,983 100.0Other susceptible vegetation - BLM lands 0 0.0 885,486 43.2 422,409 20.6 740,091 36.1 2,047,987 100.0Total vegetation - BLM lands 685,473 14.8 1,523,974 32.8 1,240,553 26.7 1,190,443 25.7 4,640,443 100.0

31
Table 4. Risk of displacement of sagebrush and other susceptible native vegetation by cheatgrass within Bureau of Land Management Field Offices in Nevada.
Risk category None Low Moderate High Total
Field Office Ha % total Ha % total Ha % total Ha % total Ha % totalSagebrush - other lands 0 0.0 138,508 77.1 22,217 12.4 18,858 10.5 179,583 100.0Total vegetation in Field Office 868,934 16.5 1,871,605 35.6 1,277,197 24.3 1,235,693 23.5 5,253,430 100.0Las Vegas Sagebrush - BLM lands 0 0.0 3,263 18.6 12,318 70.2 1,964 11.2 17,545 100.0Other susceptible vegetation - BLM lands 0 0.0 16,252 4.5 16,174 4.5 329,221 91.0 361,647 100.0Total vegetation - BLM lands 1,087,679 74.1 19,515 1.3 28,492 1.9 331,186 22.6 1,466,872 100.0Sagebrush - other lands 0 0.0 129,977 32.9 196,682 49.9 67,855 17.2 394,515 100.0Total vegetation in Field Office 2,117,295 53.7 337,451 8.6 364,319 9.2 1,121,190 28.5 3,940,256 100.0Surprise Sagebrush - BLM lands 0 0.0 421,922 97.0 13,267 3.0 0 0.0 435,189 100.0Other susceptible vegetation - BLM lands 0 0.0 25,445 75.1 8,457 24.9 0 0.0 33,903 100.0Total vegetation - BLM lands 11,015 2.3 447,367 93.2 21,724 4.5 0 0.0 480,106 100.0Sagebrush - other lands 0 0.0 214,581 96.8 5,188 2.3 1,832 0.8 221,601 100.0

32
Table 4. Risk of displacement of sagebrush and other susceptible native vegetation by cheatgrass within Bureau of Land Management Field Offices in Nevada.
Risk category None Low Moderate High Total
Field Office Ha % total Ha % total Ha % total Ha % total Ha % totalTotal vegetation in Field Office 26,146 3.5 683,156 91.9 32,117 4.3 1,832 0.2 743,252 100.0Winnemucca Sagebrush - BLM lands 0 0.0 524,160 48.1 361,028 33.1 204,058 18.7 1,089,246 100.0Other susceptible vegetation - BLM lands 0 0.0 137,662 8.8 277,030 17.8 1,143,354 73.4 1,558,046 100.0Total vegetation - BLM lands 660,668 20.0 661,822 20.0 638,058 19.3 1,347,412 40.7 3,307,959 100.0Sagebrush - other lands 0 0.0 148,923 54.3 70,559 25.7 54,622 19.9 274,103 100.0Total vegetation in Field Office 988,979 22.1 867,389 19.3 792,922 17.7 1,834,783 40.9 4,484,073 100.0All Field Offices Sagebrush - BLM lands 0 0.0 3,850,606 53.3 2,273,907 31.5 1,099,649 15.2 7,224,162 100.0Other susceptible vegetation - BLM lands 0 0.0 2,372,377 27.1 1,932,951 22.1 4,457,047 50.9 8,762,375 100.0Total vegetation - BLM lands 3,310,142 17.2 6,222,984 32.2 4,206,857 21.8 5,556,696 28.8 19,296,679 100.0Sagebrush - other lands 0 0.0 1,936,110 66.1 617,020 21.1 377,932 12.9 2,931,062 100.0All vegetation in Nevada 5,926,811 20.8 9,560,603 33.6 5,293,495 18.6 7,650,653 26.9 28,431,561 100.0

33
Table 5. Vegetation at risk of displacement by cheatgrass in Nevada, summarized by primary landowner or land manager. (See text for definitions of risk categories of displacement by cheatgrass.)
Risk category
None Low Moderate High Total habitat Landowner/ Land manager Ha
% totala Ha % total Ha % total Ha % total Ha
% totalb
Native American lands 284,181 12.3
1,819,435 78.9
172,589 7.5
31,034 1.3
2,307,239 8.1
BLM 3,325,975 17.2 6,240,581 32.2 4,224,020 21.8 5,580,085 28.8 19,370,661 68.3 Department of Defense 365,118 29.4 138,452 11.1 230,862 18.6 509,130 40.9 1,243,562 4.4 Department of Energy 118,261 28.1 78,579 18.7 47,735 11.4 175,544 41.8 420,119 1.5 USDI Fish and Wildlife Service 147,191 54.3 22,824 8.4 10,372 3.8 90,898 33.5 271,285 <1.0 USDA Forest Service 147,249 40.2 59,974 16.4 56,692 15.5 101,971 27.9 365,886 1.3 National Park Service 174,864 30.6 250,104 43.8 39,167 6.9 106,785 18.7 570,919 2.0 Other federal 71,384 75.8 9,838 10.4 3,261 3.5 9,751 10.3 94,234 <1.0 Private 1,167,874 31.3 965,553 25.9 531,028 14.2 1,064,621 28.5 3,729,076 13.1 State 334 65.2 4 1.0 28 5.4 147 28.6 512 <1.0
Total 5,808,148 20.5 9,585,345 33.8 5,315,758 18.7 7,676,356 27.0 28,373,493 100.0 a Percentages for risk category totals are based on the amount of vegetation in each risk category relative to the total amount of vegetation for each landowner (i.e., within each row of the table). b Percentages are based on the total amount of vegetation for the landowner in relation to the sum of all vegetation in the state.
34
Table 6. Risk of displacement of sagebrush habitat for greater sage-grouse by pinyon-juniper woodlands in Nevada, encompassing the High Calcareous, Central High, and Bonneville Ecological Provinces.a
Risk category Low Moderate High Totala
Sagebrush cover type Ha
% total Ha
% total Ha
% total Ha
% total
Black sagebrush 546,492 64.1 8,350 1.0 297340 34.9 852183 100.0Low sagebrush 3,914 21.1 8,635 46.5 6005 32.4 18553 100.0Low sagebrush - mountain big sagebrush 11,632 34.3 2,505 7.4 19762 58.3 33899 100.0Low sagebrush - Wyoming big sagebrush 7,309 60.8 732 6.1 3986 33.1 12027 100.0Mountain big sagebrush 256,562 38.3 122,883 18.3 290913 43.4 670358 100.0Wyoming - basin big sagebrush 1,186,938 68.2 30,277 1.7 523207 30.1 1740423 100.0All sagebrush 2,012,847 60.5 173,383 5.2 1,141,214 34.3 3,327,444 100.0 a Includes a small portion of sage-grouse habitat in the Bonneville and High Calcareous Ecological Provinces in Utah.

35
Table 7. Risk of displacement of greater sage-grouse habitat by cheatgrass within Bureau of Land Management Field Offices in Nevada.a
Risk category
None Low Moderate High Total Field Office/habitat Ha
% total Ha
% total Ha
% total Ha
% total Ha
% total
Battle Mountain Sagebrush – BLM lands 0 0 443,550 41.7 501,098 47.1 120,223 11.3 1,064,870 100.0 Total habitat – BLM lands 96 0 4554,718 41.4 512,983 46.7 130,494 11.9 1,098,291 100.0 Sagebrush – other lands 0 0 445,514 83.7 74,603 14.0 12,118 2.3 532,235 100.0
Total habitat 518 0 905,154 55.1 589,257 35.9 146,645 8.9 1,641,563 100.0 Carson City Sagebrush – BLM lands 0 0.0 71,221 43.4 71,078 43.4 21,622 13.2 163,921 100.0 Total habitat – BLM lands 30 0.0 74,372 42.8 75,427 43.4 23,916 13.8 173,745 100.0 Sagebrush – other lands 0.0 0.0 65,270 56.2 35,643 30.7 15,166 13.1 116,080 100.0 Total habitat 193 0.1 140,893 48.0 112,251 38.3 39,921 13.6 293,258 100.0 Eagle Lake Sagebrush – BLM lands 0 0.0 54,184 70.4 18,999 24.7 3,755 4.9 76,939 100.0 Total habitat – BLM lands 3 0.0 54,472 70.0 19,385 24.9 3,914 5.0 77,774 100.0 Sagebrush – other lands 0 0.0 1,529 69.3 666 30.2 12 0.6 2,207 100.0 Total habitat 15 0.0 56,019 70.0 20,076 25.1 3,932 4.9 80,041 100.0 Elko Sagebrush – BLM lands 0 0.0 1,356,039 69.7 318,843 16.4 269,971 13.9 1,944,852 100.0 Total habitat – BLM lands 1,639 0.1 1,379,832 68.6 332,827 16.5 297,002 14.8 2,011,301 100.0 Sagebrush – other lands 0 0.0 739,263 69.2 152,062 14.2 176,237 16.5 1,067,562 100.0 Total habitat 8,925 0.3 2,137,314 67.7 495,828 15.7 512,838 16.3 3,154,905 100.0 Ely Sagebrush – BLM lands 0 0.0 527,521 42.3 530,822 42.6 188,365 15.1 1,246,708 100.0 Total habitat – BLM lands 330 0.0 541,053 41.7 559,588 43.1 197,960 15.2 1,298,930 100.0 Sagebrush – other lands 0 0.0 137,055 81.2 19,659 11.6 12,106 7.2 168,820 100.0 Total habitat 786 0.1 680,202 46.2 580,106 39.4 212,030 14.4 1,473,124 100.0 Surprise Sagebrush – BLM lands 0 0.0 421,922 97.0 12,938 3.0 0 0.0 434,860 100.0

36
Table 7. Risk of displacement of greater sage-grouse habitat by cheatgrass within Bureau of Land Management Field Offices in Nevada.a
Risk category
None Low Moderate High Total Field Office/habitat Ha
% total Ha
% total Ha
% total Ha
% total Ha
% total
Total habitat – BLM lands 41 0.0 428,159 97.0 13,237 3.0 0 0.0 441,437 100.0 Sagebrush – other lands 0 0.0 214,581 96.8 5,161 2.3 1,832 0.8 221,575 100.0 Total habitat 132 0.0 648,068 96.7 19,900 3.0 1,832 0.3 669,932 100.0 Winnemucca Sagebrush – BLM lands 0 0.0 496,359 51.4 286,470 29.7 183,003 18.9 965,832 100.0 Total habitat – BLM lands 309 0.0 518,520 48.0 310,972 28.8 250,766 23.2 1,080,567 100.0 Sagebrush – other lands 0.0 0.0 145,688 57.1 57,683 22.6 51,552 20.2 254,924 100.0 Total habitat 1,548 0.1 668,315 48.5 374,739 27.2 332,227 24.1 1,376,829 100.0 All Field Offices
Sagebrush – BLM lands 0 0.0 3,370,796 57.2 1,740,247 29.5 786,939 13.3 5,897,981 100.0 Total habitat – BLM lands 2,449 0.0 3,451,124 55.8 1,824,419 29.5 904,052 14.6 6,182,044 100.0 Sagebrush – other lands 0 0.0 1,748,900 74.0 345,477 14.6 269,025 11.4 2,363,403 100.0 Total habitat – all Field Offices 12,116 0.1 5,235,966 60.3 2,192,146 25.2 1,249,424 14.4 8,689,652 100.0 a Habitat includes only those cover types designated as source habitat for greater sage-grouse within the current range of the species in Nevada. See text for further explanation.

37
Table 8. Risk of displacement of habitat for species of conservation concern by cheatgrass within the Battle Mountain Field Office in Nevada.
Risk category None Low Moderate High Total habitat
Species Ha % total Ha % total Ha % total Ha % total Ha % total Amphibians Great Basin spadefoot 366,344 7.1 2,087,296 40.1 1,306,693 25.1 1,443,160 27.7 5,203,493 100.0 Reptiles Great Basin collared lizard 185,232 9.0 328,289 16.0 536,632 26.2 1,000,949 48.8 2,051,102 100.0 Long-nosed leopard lizard 304,368 10.7 482,768 16.9 769,605 27.0 1,295,404 45.4 2,852,145 100.0 Desert horned lizard 304,368 10.7 482,768 16.9 769,605 27.0 1,295,404 45.4 2,852,145 100.0 Common sagebrush lizard 290,543 5.7 2,069,807 40.8 1,287,631 25.4 1,424,956 28.1 5,072,937 100.0 Desert spiny lizard 231,850 10.8 343,761 16.0 536,401 25.0 1,033,855 48.2 2,145,867 100.0 Nightsnake 396,516 7.6 2,088,895 39.9 1,306,693 24.9 1,443,160 27.6 5,235,264 100.0 Striped whipsnake 404,290 7.7 2,088,895 39.9 1,306,693 24.9 1,443,160 27.5 5,243,038 100.0 Long-nosed snake 311,387 10.7 501,857 17.2 788,667 27.0 1,313,608 45.1 2,915,519 100.0 Groundsnake 79,730 7.5 140,253 13.2 281,741 26.6 559,541 52.7 1,061,265 100.0 Birds Ferruginous hawk 327,536 8.1 1,412,774 35.1 1,030,763 25.6 1,259,175 31.2 4,030,248 100.0 Swainson's hawk 400,741 7.7 2,078,113 39.8 1,301,590 25.0 1,436,556 27.5 5,217,000 100.0 Northern harrier 380,590 8.6 1,300,751 29.7 1,262,194 28.8 1,441,323 32.9 4,384,857 100.0 Prairie falcon 376,521 8.6 1,300,751 29.7 1,262,194 28.8 1,441,323 32.9 4,380,789 100.0 Greater sage-grouse 518 0.0 906,108 55.2 590,837 36.0 145,166 8.8 1,642,628 100.0

38
Table 8. Risk of displacement of habitat for species of conservation concern by cheatgrass within the Battle Mountain Field Office in Nevada.
Risk category None Low Moderate High Total habitat
Species Ha % total Ha % total Ha % total Ha % total Ha % total Short-eared owl 380,590 8.6 1,300,751 29.7 1,262,194 28.8 1,441,323 32.9 4,384,857 100.0 Western burrowing owl 377,044 8.6 1,300,751 29.7 1,262,194 28.8 1,441,323 32.9 4,381,312 100.0 Gray flycatcher 32,958 1.5 1,591,401 69.3 525,769 22.9 145,407 6.3 2,295,535 100.0 Sage thrasher 254,487 15.5 763,496 46.5 480,771 29.3 143,529 8.7 1,642,284 100.0 Loggerhead shrike 368,025 8.2 1,671,466 36.9 1,073,021 23.7 1,412,604 31.2 4,525,116 100.0 Sage sparrow 290,543 17.3 763,496 45.5 480,771 28.6 143,529 8.6 1,678,339 100.0 Black-throated sparrow 303,614 8.0 858,551 22.6 1,224,137 32.1 1,422,158 37.3 3,808,460 100.0 Lark sparrow 312,453 8.2 1,572,687 41.4 894,817 23.5 1,023,804 26.9 3,803,761 100.0 Green-tailed towhee 47,963 1.9 1,650,613 67.5 557,960 22.8 190,014 7.8 2,446,549 100.0 Vesper sparrow 83,414 4.7 915,226 51.4 632,425 35.5 150,323 8.4 1,781,388 100.0 Brewer's sparrow 292,678 8.4 1,987,441 57.3 876,934 25.3 310,789 9.0 3,467,842 100.0 Brewer's blackbird 110,494 6.8 1,424,543 88.3 74,598 4.6 3,361 0.002 1,612,996 100.0 Mammals Merriam's shrew 20,907 0.7 1,916,829 67.4 744,504 26.2 160,263 5.7 2,842,504 100.0 Kit fox 236,427 6.7 824,155 23.3 1,185,230 33.4 1,296,852 36.6 3,542,664 100.0 Pronghorn 8,729 1.4 299,591 47.0 239,583 37.6 89,264 14.0 637,167 100.0 Wyoming ground squirrel 7,040 4.3 58,993 36.0 47,910 29.3 49,821 30.4 163,763 100.0 Merriam's kangaroo rat 88,291 7.7 78,637 6.8 291,167 25.3 692,650 60.2 1,150,746 100.0 Chisel-toothed kangaroo rat 303,614 10.7 463,626 16.4 765,338 27.1 1,294,671 45.8 2,827,249 100.0 Ord's kangaroo rat 280,641 6.1 1,601,736 35.1 1,286,937 28.2 1,396,224 30.6 4,565,537 100.0

39
Table 8. Risk of displacement of habitat for species of conservation concern by cheatgrass within the Battle Mountain Field Office in Nevada.
Risk category None Low Moderate High Total habitat
Species Ha % total Ha % total Ha % total Ha % total Ha % total Dark kangaroo mouse 221,865 7.6 673,950 23.0 952,455 32.5 1,080,629 36.9 2,928,899 100.0 Little pocket mouse 293,499 8.1 788,175 21.8 1,146,621 31.8 1,383,580 38.3 3,611,874 100.0 Northern grasshopper mouse 242,010 7.2 1,111,239 33.3 1,042,987 31.2 944,881 28.3 3,341,117 100.0 Sagebrush vole 290,543 9.3 1,918,217 61.6 744,745 23.9 160,264 5.2 3,113,769 100.0 White-tailed jackrabbit 158,214 11.4 731,321 52.5 372,225 26.7 130,041 9.4 1,391,800 100.0 Pygmy rabbit 169,377 11.3 669,017 44.7 514,142 34.3 144,323 9.7 1,496,859 100.0

40
Table 9. Risk of displacement of habitat for species of conservation concern by cheatgrass within the Carson City Field Office in Nevada.
Risk category None Low Moderate High Total habitat
Species Ha % total Ha % total Ha % total Ha % total Ha % total Amphibians Great Basin spadefoot 502,902 16.5 754,553 24.8 729,062 23.9 1,057,824 34.8 3,044,342 100.0 Reptiles Great Basin collared lizard 470,814 21.9 216,532 10.1 495,203 23.1 962,953 44.9 2,145,502 100.0 Long-nosed leopard lizard 261,295 13.8 213,522 11.2 479,260 25.3 943,379 49.7 1,897,457 100.0 Desert horned lizard 261,611 13.6 216,090 11.3 487,917 25.5 951,749 49.6 1,917,368 100.0 Common sagebrush lizard 254,597 9.2 746,015 27.1 718,008 26.1 1,037,073 37.6 2,755,693 100.0 Desert spiny lizard 401,039 20.9 210,645 11.0 459,217 23.9 847,044 44.2 1,917,946 100.0 Nightsnake 469,993 15.9 744,642 25.1 710,782 24.0 1,038,985 35.0 2,964,402 100.0 Striped whipsnake 494,083 16.3 755,518 24.9 729,109 24.0 1,057,824 34.8 3,036,534 100.0 Long-nosed snake 270,898 14.2 217,218 11.4 471,534 24.7 947,434 49.7 1,907,083 100.0 Groundsnake 234,920 13.1 209,694 11.7 455,735 25.5 887,506 49.7 1,787,856 100.0 Birds Ferruginous hawk 82,827 6.5 531,155 41.8 345,872 27.2 310,523 24.5 1,270,378 100.0 Swainson's hawk 330,105 14.2 471,338 20.3 561,707 24.2 960,845 41.3 2,323,995 100.0 Northern harrier 436,013 16.4 473,050 17.8 694,509 26.1 1,056,255 39.7 2,659,827 100.0 Prairie falcon 379,449 14.6 473,050 18.2 694,509 26.7 1,056,255 40.5 2,603,263 100.0 Greater sage-grouse 193 0.1 144,829 48.1 116,014 38.5 40,075 13.3 301,110 100.0 Short-eared owl 436,013 16.4 473,050 17.8 694,509 26.1 1,056,255 39.7 2,659,827 100.0

41
Table 9. Risk of displacement of habitat for species of conservation concern by cheatgrass within the Carson City Field Office in Nevada.
Risk category None Low Moderate High Total habitat
Species Ha % total Ha % total Ha % total Ha % total Ha % total Western burrowing owl 380,608 14.6 473,050 18.2 694,509 26.7 1,056,255 40.5 2,604,422 100.0 Gray flycatcher 34,448 3.8 542,020 59.0 249,249 27.1 93,042 10.1 918,760 100.0 Sage thrasher 254,597 31.3 254,104 31.3 213,398 26.2 91,349 11.2 813,447 100.0 Loggerhead shrike 365,860 14.1 607,570 23.5 617,517 23.9 995,940 38.5 2,586,888 100.0 Sage sparrow 254,597 31.3 254,114 31.3 213,401 26.2 91,515 11.2 813,627 100.0 Black-throated sparrow 243,573 12.3 300,882 15.2 519,081 26.2 916,429 46.3 1,979,965 100.0 Lark sparrow 310,283 16.2 279,995 14.6 447,919 23.4 876,838 45.8 1,915,035 100.0 Green-tailed towhee 49,543 4.8 583,172 56.5 288,041 27.9 111,168 10.8 1,031,924 100.0 Vesper sparrow 81,880 16.7 203,269 41.5 150,791 30.8 53,978 11.0 489,919 100.0 Brewer's sparrow 254,597 16.4 670,047 43.0 434,376 27.9 197,043 12.7 1,556,063 100.0 Brewer's blackbird 316,102 37.9 459,906 55.1 54,438 6.5 4,518 0.005 834,964 100.0 Mammals Merriam's shrew 12,026 3.4 238,838 66.3 84,725 23.5 24,542 6.8 360,132 100.0 Kit fox 221,575 14.0 182,261 11.5 386,015 24.3 797,143 50.2 1,586,993 100.0 Pronghorn 6,810 1.6 111,394 26.0 115,354 26.9 194,855 45.5 428,413 100.0 Merriam's kangaroo rat 204,570 14.0 110,499 7.6 378,452 25.9 764,923 52.5 1,458,444 100.0 Chisel-toothed kangaroo rat 249,493 14.7 167,399 9.9 398,744 23.5 880,562 51.9 1,696,198 100.0 Ord's kangaroo rat 254,597 10.0 530,051 20.8 701,584 27.6 1,056,550 41.6 2,542,782 100.0 Dark kangaroo mouse 41,945 8.6 54,790 11.2 150,125 30.8 240,398 49.4 487,258 100.0 Little pocket mouse 260,843 11.7 351,672 15.7 627,630 28.1 995,164 44.5 2,235,309 100.0
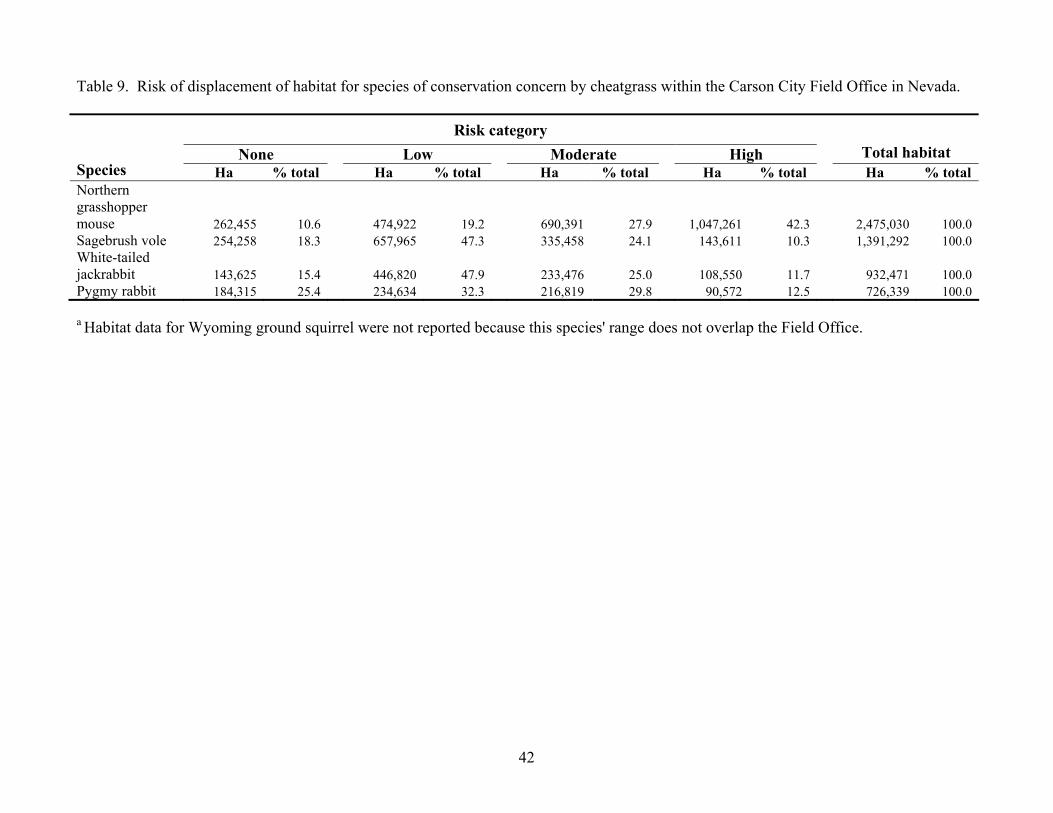
42
Table 9. Risk of displacement of habitat for species of conservation concern by cheatgrass within the Carson City Field Office in Nevada.
Risk category None Low Moderate High Total habitat
Species Ha % total Ha % total Ha % total Ha % total Ha % total Northern grasshopper mouse 262,455 10.6 474,922 19.2 690,391 27.9 1,047,261 42.3 2,475,030 100.0 Sagebrush vole 254,258 18.3 657,965 47.3 335,458 24.1 143,611 10.3 1,391,292 100.0 White-tailed jackrabbit 143,625 15.4 446,820 47.9 233,476 25.0 108,550 11.7 932,471 100.0 Pygmy rabbit 184,315 25.4 234,634 32.3 216,819 29.8 90,572 12.5 726,339 100.0
a Habitat data for Wyoming ground squirrel were not reported because this species' range does not overlap the Field Office.

43
Table 10. Risk of displacement of habitat for species of conservation concern by cheatgrass within the Eagle Lake Field Office in Nevada.
Risk category None Low Moderate High Total habitat
Species Ha % total Ha % total Ha % total Ha % total Ha % total Amphibians Great Basin spadefoot 15,194 11.0 59,684 43.2 34,717 25.2 28,400 20.6 137,995 100.0 Reptiles Great Basin collared lizard 16,394 23.8 16,473 23.9 13,748 20.0 22,253 32.3 68,868 100.0 Long-nosed leopard lizard 13,829 20.7 16,921 25.4 13,748 20.6 22,253 33.3 66,751 100.0 Desert horned lizard 13,829 20.7 16,921 25.4 13,748 20.6 22,253 33.3 66,751 100.0 Common sagebrush lizard 13,829 10.2 59,379 43.8 34,301 25.3 28,085 20.7 135,594 100.0 Desert spiny lizard 0 0.0 0 0.0 0 0.0 28 100.0 28 100.0 Nightsnake 16,394 11.8 59,684 42.9 34,717 24.9 28,400 20.4 139,194 100.0 Striped whipsnake 16,468 11.8 59,684 42.9 34,717 24.9 28,400 20.4 139,269 100.0 Long-nosed snake 13,904 20.5 17,226 25.4 14,164 20.9 22,568 33.2 67,862 100.0 Groundsnake 2,079 30.2 3 0.0 347 5.1 4,457 64.7 6,887 100.0 Birds Swainson's hawk 15,192 11.0 59,684 43.2 34,717 25.2 28,400 20.6 137,992 100.0 Northern harrier 15,192 11.0 59,684 43.2 34,717 25.2 28,400 20.6 137,992 100.0 Prairie falcon 15,177 11.0 59,684 43.2 34,717 25.2 28,400 20.6 137,978 100.0 Greater sage-grouse 15 0.0 56,128 69.4 20,738 25.7 3,980 4.9 80,860 100.0 Short-eared owl 15,192 11.0 59,684 43.2 34,717 25.2 28,400 20.6 137,992 100.0 Western burrowing owl 15,192 11.0 59,684 43.2 34,717 25.2 28,400 20.6 137,992 100.0

44
Table 10. Risk of displacement of habitat for species of conservation concern by cheatgrass within the Eagle Lake Field Office in Nevada.
Risk category None Low Moderate High Total habitat
Species Ha % total Ha % total Ha % total Ha % total Ha % total Gray flycatcher 75 0.1 42,458 61.6 20,553 29.8 5,832 8.5 68,917 100.0 Sage thrasher 13,829 16.7 42,458 51.3 20,553 24.9 5,832 7.1 82,672 100.0 Loggerhead shrike 15,117 12.7 43,179 36.3 32,620 27.4 28,085 23.6 119,000 100.0 Sage sparrow 13,829 16.7 42,906 51.6 20,553 24.7 5,832 7.0 83,120 100.0 Black-throated sparrow 12,830 13.0 34,410 34.9 25,504 25.8 26,000 26.3 98,743 100.0 Lark sparrow 15,177 12.7 43,036 36.0 33,035 27.6 28,400 23.7 119,648 100.0 Green-tailed towhee 75 0.1 42,458 61.6 20,553 29.8 5,832 8.5 68,917 100.0 Vesper sparrow 1,302 1.6 57,031 68.5 19,103 22.9 5,860 7.0 83,296 100.0 Brewer's sparrow 13,829 13.7 59,106 58.5 22,235 22.0 5,855 5.8 101,025 100.0 Brewer's blackbird 1,682 12.0 9,713 69.6 2,537 18.2 28 0.0 13,960 100.0 Mammals Kit fox 13,801 11.8 45,893 39.1 30,762 26.2 26,949 22.9 117,405 100.0 Pronghorn 28 0.0 59,684 48.6 34,716 28.3 28,378 23.1 122,806 100.0 Merriam's kangaroo rat 13,829 20.3 17,842 26.3 13,986 20.6 22,253 32.8 67,910 100.0 Chisel-toothed kangaroo rat 13,829 28.5 273 0.6 12,067 24.9 22,253 46.0 48,422 100.0 Ord's kangaroo rat 13,829 10.1 59,684 43.7 34,717 25.4 28,400 20.8 136,630 100.0 Dark kangaroo mouse 13,829 11.8 45,893 39.1 30,762 26.2 26,949 22.9 117,433 100.0 Little pocket mouse 13,829 11.5 46,455 38.6 31,961 26.6 28,062 23.3 120,308 100.0 Northern grasshopper mouse 13,829 10.1 59,684 43.7 34,717 25.4 28,400 20.8 136,630 100.0

45
Table 10. Risk of displacement of habitat for species of conservation concern by cheatgrass within the Eagle Lake Field Office in Nevada.
Risk category None Low Moderate High Total habitat
Species Ha % total Ha % total Ha % total Ha % total Ha % total Sagebrush vole 13,829 13.6 59,411 58.2 22,650 22.2 6,147 6.0 102,037 100.0 White-tailed jackrabbit 14,408 14.6 56,183 56.8 22,188 22.4 6,147 6.2 98,927 100.0 Pygmy rabbit 13,829 13.6 59,411 58.2 22,650 22.2 6,147 6.0 102,037 100.0
a Habitat data for ferruginous hawk, Merriam’s shrew, and Wyoming ground squirrel were not reported because these species' ranges do not overlap the Field Office.

46
Table 11. Risk of displacement of habitat for species of conservation concern by cheatgrass within the Elko Field Office in Nevada.
Risk category None Low Moderate High Total habitat
Species Ha % total Ha % total Ha % total Ha % total Ha % total Amphibians Great Basin spadefoot 387,232 8.7 2,584,354 58.5 626,817 14.2 822,351 18.6 4,420,754 100.0 Reptiles Great Basin collared lizard 44,669 15.9 49,539 17.7 76,086 27.2 109,880 39.2 280,173 100.0 Long-nosed leopard lizard 177,928 11.9 719,436 47.9 248,618 16.6 354,777 23.6 1,500,759 100.0 Desert horned lizard 177,928 11.9 719,436 47.9 248,618 16.6 354,777 23.6 1,500,759 100.0 Common sagebrush lizard 177,928 4.4 2,542,115 62.3 601,841 14.8 755,724 18.5 4,077,606 100.0 Nightsnake 208,462 4.9 2,584,354 60.9 626,817 14.8 822,351 19.4 4,241,984 100.0 Striped whipsnake 236,552 5.5 2,584,354 60.5 626,817 14.7 822,351 19.3 4,270,074 100.0 Long-nosed snake 199,680 15.4 451,526 35.0 242,633 18.8 397,689 30.8 1,291,528 100.0 Birds Ferruginous hawk 312,448 7.2 2,584,354 59.5 626,817 14.4 822,351 18.9 4,345,970 100.0 Swainson's hawk 467,068 10.4 2,584,354 57.4 626,817 13.9 822,351 18.3 4,500,590 100.0 Northern harrier 386,813 9.3 2,357,256 56.5 608,180 14.6 817,024 19.6 4,169,272 100.0 Prairie falcon 354,501 8.6 2,357,256 57.0 608,180 14.7 817,024 19.7 4,136,959 100.0 Greater sage-grouse 8,934 0.3 2,145,756 67.8 497,122 15.7 513,954 16.2 3,165,766 100.0 Short-eared owl 386,813 9.3 2,357,256 56.5 608,180 14.6 817,024 19.6 4,169,272 100.0 Western burrowing owl 363,435 8.8 2,357,256 56.8 608,180 14.7 817,024 19.7 4,145,893 100.0 Gray flycatcher 57,691 2.2 1,826,455 69.1 355,118 13.4 403,600 15.3 2,642,864 100.0

47
Table 11. Risk of displacement of habitat for species of conservation concern by cheatgrass within the Elko Field Office in Nevada.
Risk category None Low Moderate High Total habitat
Species Ha % total Ha % total Ha % total Ha % total Ha % total Sage thrasher 177,928 7.5 1,474,477 61.8 334,353 14.0 398,019 16.7 2,384,776 100.0 Loggerhead shrike 333,545 10.5 1,723,917 54.0 441,251 13.8 691,840 21.7 3,190,553 100.0 Sage sparrow 177,928 7.5 1,475,762 61.8 334,353 14.0 398,019 16.7 2,386,061 100.0 Black-throated sparrow 177,928 6.4 1,372,877 49.1 515,625 18.5 727,632 26.0 2,794,062 100.0 Lark sparrow 352,808 10.0 1,908,130 54.4 479,071 13.7 768,300 21.9 3,508,309 100.0 Green-tailed towhee 142,974 4.6 2,075,049 66.4 429,665 13.8 475,108 15.2 3,122,795 100.0 Vesper sparrow 164,199 4.6 2,333,724 65.8 519,864 14.7 528,530 14.9 3,546,318 100.0 Brewer's sparrow 177,993 4.8 2,496,920 67.4 523,902 14.2 503,526 13.6 3,702,340 100.0 Brewer's blackbird 285,405 23.0 901,498 72.7 42,246 3.4 10,052 0.8 1,239,202 100.0 Mammals Merriam's shrew 17,451 0.5 2,380,460 69.1 524,209 15.2 523,759 15.2 3,445,879 100.0 Kit fox 160,476 5.3 1,590,665 52.6 541,950 17.9 732,401 24.2 3,025,493 100.0 Pronghorn 7,963 0.6 1,074,835 76.5 139,439 9.9 182,889 13.0 1,405,126 100.0 Wyoming ground squirrel 158,648 8.1 1,113,607 56.5 282,978 14.3 416,926 21.1 1,972,159 100.0 Chisel-toothed kangaroo rat 66,588 12.3 233,612 43.1 95,507 17.6 145,960 27.0 541,667 100.0 Ord's kangaroo rat 177,928 4.4 2,401,168 59.7 623,736 15.5 822,097 20.4 4,024,929 100.0 Dark kangaroo mouse 148,146 7.7 805,448 41.6 389,558 20.1 592,281 30.6 1,935,433 100.0 Little pocket mouse 88,319 6.4 486,910 35.0 341,403 24.6 472,919 34.0 1,389,550 100.0 Northern grasshopper mouse 177,928 4.6 2,248,345 58.2 616,266 15.9 821,587 21.3 3,864,126 100.0

48
Table 11. Risk of displacement of habitat for species of conservation concern by cheatgrass within the Elko Field Office in Nevada.
Risk category None Low Moderate High Total habitat
Species Ha % total Ha % total Ha % total Ha % total Ha % total Sagebrush vole 177,928 4.9 2,419,456 66.3 525,659 14.4 524,025 14.4 3,647,068 100.0 White-tailed jackrabbit 437,243 10.8 2,546,744 63.0 528,289 13.1 529,040 13.1 4,041,317 100.0 Pygmy rabbit 177,928 5.2 2,192,941 64.6 507,075 14.9 518,697 15.3 3,396,641 100.0
a Habitat data for desert spiny lizard, groundsnake, and Merriam’s kangaroo rat were not reported because these species' ranges do not overlap the Field Office.
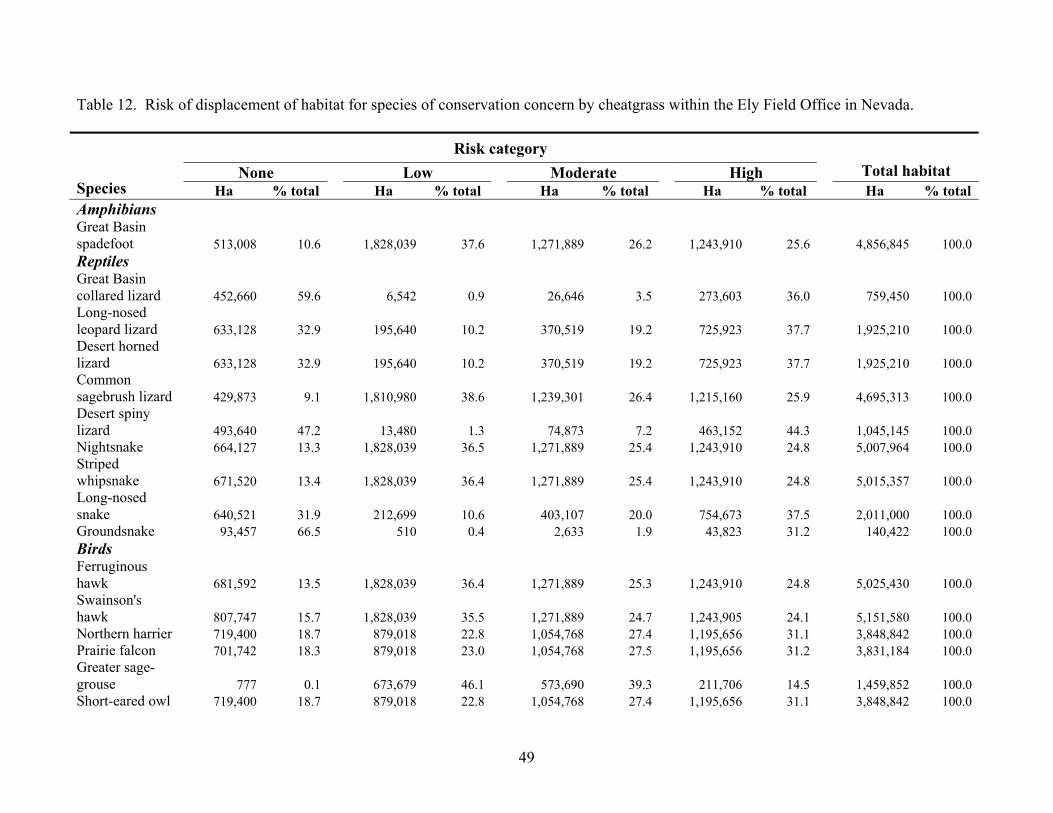
49
Table 12. Risk of displacement of habitat for species of conservation concern by cheatgrass within the Ely Field Office in Nevada.
Risk category None Low Moderate High Total habitat
Species Ha % total Ha % total Ha % total Ha % total Ha % total Amphibians Great Basin spadefoot 513,008 10.6 1,828,039 37.6 1,271,889 26.2 1,243,910 25.6 4,856,845 100.0 Reptiles Great Basin collared lizard 452,660 59.6 6,542 0.9 26,646 3.5 273,603 36.0 759,450 100.0 Long-nosed leopard lizard 633,128 32.9 195,640 10.2 370,519 19.2 725,923 37.7 1,925,210 100.0 Desert horned lizard 633,128 32.9 195,640 10.2 370,519 19.2 725,923 37.7 1,925,210 100.0 Common sagebrush lizard 429,873 9.1 1,810,980 38.6 1,239,301 26.4 1,215,160 25.9 4,695,313 100.0 Desert spiny lizard 493,640 47.2 13,480 1.3 74,873 7.2 463,152 44.3 1,045,145 100.0 Nightsnake 664,127 13.3 1,828,039 36.5 1,271,889 25.4 1,243,910 24.8 5,007,964 100.0 Striped whipsnake 671,520 13.4 1,828,039 36.4 1,271,889 25.4 1,243,910 24.8 5,015,357 100.0 Long-nosed snake 640,521 31.9 212,699 10.6 403,107 20.0 754,673 37.5 2,011,000 100.0 Groundsnake 93,457 66.5 510 0.4 2,633 1.9 43,823 31.2 140,422 100.0 Birds Ferruginous hawk 681,592 13.5 1,828,039 36.4 1,271,889 25.3 1,243,910 24.8 5,025,430 100.0 Swainson's hawk 807,747 15.7 1,828,039 35.5 1,271,889 24.7 1,243,905 24.1 5,151,580 100.0 Northern harrier 719,400 18.7 879,018 22.8 1,054,768 27.4 1,195,656 31.1 3,848,842 100.0 Prairie falcon 701,742 18.3 879,018 23.0 1,054,768 27.5 1,195,656 31.2 3,831,184 100.0 Greater sage-grouse 777 0.1 673,679 46.1 573,690 39.3 211,706 14.5 1,459,852 100.0 Short-eared owl 719,400 18.7 879,018 22.8 1,054,768 27.4 1,195,656 31.1 3,848,842 100.0

50
Table 12. Risk of displacement of habitat for species of conservation concern by cheatgrass within the Ely Field Office in Nevada.
Risk category None Low Moderate High Total habitat
Species Ha % total Ha % total Ha % total Ha % total Ha % total Western burrowing owl 702,519 18.3 879,018 22.9 1,054,768 27.5 1,195,660 31.2 3,831,966 100.0 Gray flycatcher 110,421 3.5 1,617,394 51.4 874,363 27.8 542,426 17.2 3,144,605 100.0 Sage thrasher 156,942 8.6 585,535 32.1 612,273 33.6 468,005 25.7 1,822,755 100.0 Loggerhead shrike 691,904 16.2 1,518,935 35.7 937,914 22.0 1,110,414 26.1 4,259,168 100.0 Sage sparrow 429,873 20.2 590,124 27.8 631,034 29.7 475,180 22.3 2,126,210 100.0 Black-throated sparrow 633,128 19.2 541,942 16.5 976,305 29.6 1,145,172 34.7 3,296,548 100.0 Lark sparrow 413,054 9.7 1,641,178 38.6 1,053,666 24.8 1,143,751 26.9 4,251,649 100.0 Green-tailed towhee 125,642 3.9 1,651,019 51.6 878,235 27.5 545,149 17.0 3,200,045 100.0 Vesper sparrow 84,447 4.2 810,505 40.1 731,694 36.2 395,800 19.5 2,022,446 100.0 Brewer's sparrow 429,873 11.2 1,774,882 46.3 1,052,989 27.4 578,842 15.1 3,836,585 100.0 Brewer's blackbird 113,295 5.9 1,468,000 75.8 292,131 15.1 62,898 3.2 1,936,324 100.0 Mammals Merriam's shrew 32,497 1.0 1,738,642 51.0 1,087,760 31.9 550,483 16.1 3,409,383 100.0 Kit fox 327,701 11.2 534,722 18.3 967,835 33.1 1,091,647 37.4 2,921,905 100.0 Pronghorn 9,398 1.0 326,355 34.1 329,566 34.4 292,044 30.5 957,362 100.0 Wyoming ground squirrel 34 0.3 4,185 31.7 2,190 16.6 6,777 51.4 13,187 100.0 Merriam's kangaroo rat 476,222 70.1 1,410 0.2 10,843 1.6 191,097 28.1 679,572 100.0 Chisel-toothed kangaroo rat 616,931 32.9 192,056 10.2 363,334 19.4 702,042 37.5 1,874,363 100.0 Ord's kangaroo rat 288,111 7.2 1,375,334 34.2 1,204,534 29.9 1,156,324 28.7 4,024,303 100.0 Dark kangaroo mouse 130,391 6.8 370,444 19.2 722,209 37.5 703,887 36.5 1,926,931 100.0

51
Table 12. Risk of displacement of habitat for species of conservation concern by cheatgrass within the Ely Field Office in Nevada.
Risk category None Low Moderate High Total habitat
Species Ha % total Ha % total Ha % total Ha % total Ha % total Little pocket mouse 545,858 27.8 268,649 13.7 420,586 21.4 729,748 37.1 1,964,841 100.0 Northern grasshopper mouse 164,660 6.0 801,638 29.3 918,018 33.5 855,986 31.2 2,740,301 100.0 Sagebrush vole 276,137 7.7 1,729,217 48.1 1,062,642 29.5 528,636 14.7 3,596,632 100.0 White-tailed jackrabbit 267,311 9.7 1,451,045 52.7 738,490 26.9 294,667 10.7 2,751,513 100.0 Pygmy rabbit 153,341 7.9 737,084 38.1 692,223 35.8 351,795 18.2 1,934,443 100.0

52
Table 13. Risk of displacement of habitat for species of conservation concern by cheatgrass within the Las Vegas Field Office in Nevada.
Risk category None Low Moderate High Total habitat
Species Ha % total Ha % total Ha % total Ha % total Ha % total Amphibians Great Basin spadefoot 551,402 26.8 301,712 14.6 331,151 16.1 876,584 42.5 2,060,850 100.0 Reptiles Great Basin collared lizard 1,931,868 63.0 9,698 0.3 106,293 3.5 1,016,111 33.2 3,063,970 100.0 Long-nosed leopard lizard 1,906,444 62.7 9,698 0.3 106,293 3.5 1,016,111 33.5 3,038,547 100.0 Desert horned lizard 1,906,444 62.7 9,698 0.3 106,293 3.5 1,016,111 33.5 3,038,547 100.0 Common sagebrush lizard 502,906 25.7 300,704 15.4 329,318 16.8 823,049 42.1 1,955,977 100.0 Desert spiny lizard 1,931,868 63.0 9,698 0.3 106,293 3.5 1,016,111 33.2 3,063,970 100.0 Nightsnake 1,931,868 52.0 325,513 8.7 354,920 9.6 1,104,085 29.7 3,716,386 100.0 Striped whipsnake 1,938,351 52.1 325,513 8.7 354,920 9.5 1,104,085 29.7 3,722,869 100.0 Long-nosed snake 1,912,516 62.0 23,980 0.8 117,005 3.8 1,028,475 33.4 3,081,975 100.0 Groundsnake 1,879,996 64.8 6,575 0.2 90,239 3.1 926,297 31.9 2,903,106 100.0 Birds Ferruginous hawk 1,938,314 52.1 325,513 8.7 354,920 9.5 1,104,085 29.7 3,722,832 100.0 Swainson's hawk 1,045,840 42.8 289,942 11.9 323,725 13.3 781,896 32.0 2,441,404 100.0 Northern harrier 1,926,074 54.1 203,116 5.7 333,405 9.3 1,100,110 30.9 3,562,704 100.0 Prairie falcon 1,926,074 54.1 203,116 5.7 333,405 9.3 1,100,110 30.9 3,562,704 100.0 Short-eared owl 1,926,074 54.1 203,116 5.7 333,405 9.3 1,100,110 30.9 3,562,704 100.0 Western burrowing owl 1,926,558 54.1 203,125 5.7 333,421 9.3 1,100,387 30.9 3,563,491 100.0

53
Table 13. Risk of displacement of habitat for species of conservation concern by cheatgrass within the Las Vegas Field Office in Nevada.
Risk category None Low Moderate High Total habitat
Species Ha % total Ha % total Ha % total Ha % total Ha % total Gray flycatcher 41,133 6.1 301,536 44.8 238,705 35.5 91,424 13.6 672,797 100.0 Sage thrasher 21,270 4.9 128,771 29.4 204,259 46.6 83,769 19.1 438,069 100.0 Loggerhead shrike 1,919,664 53.6 255,638 7.1 323,768 9.0 1,085,530 30.3 3,584,601 100.0 Sage sparrow 663,725 61.1 129,129 11.9 207,625 19.1 85,095 7.9 1,085,573 100.0 Black-throated sparrow 1,906,033 55.4 137,134 4.0 313,113 9.1 1,085,392 31.5 3,441,671 100.0 Lark sparrow 38,137 8.1 102,966 21.9 105,500 22.4 224,062 47.6 470,666 100.0 Green-tailed towhee 42,795 6.3 304,425 44.8 240,301 35.4 91,647 13.5 679,168 100.0 Vesper sparrow 299 1.3 4,504 18.9 8,217 34.5 10,787 45.3 23,808 100.0 Brewer's sparrow 656,412 51.7 296,289 23.4 228,615 18.0 87,717 6.9 1,269,033 100.0 Brewer's blackbird 141,741 43.4 153,194 46.9 26,582 8.1 4,908 1.5 326,425 100.0 Mammals Merriam's shrew 0 0.0 242,696 45.8 215,164 40.6 72,419 13.6 530,279 100.0 Kit fox 1,210,368 45.1 135,950 5.0 302,482 11.3 1,035,961 38.6 2,684,761 100.0 Pronghorn 0 0.0 61,923 22.6 94,318 34.4 117,899 43.0 274,140 100.0 Merriam's kangaroo rat 1,883,834 66.1 5,081 0.2 63,749 2.2 896,489 31.5 2,849,154 100.0 Chisel-toothed kangaroo rat 1,434,482 60.5 9,693 0.4 105,822 4.4 822,263 34.7 2,372,260 100.0 Ord's kangaroo rat 284,661 25.1 159,994 14.1 245,240 21.6 445,566 39.2 1,135,460 100.0 Dark kangaroo mouse 14,331 3.1 64,836 13.8 127,556 27.2 262,293 55.9 469,014 100.0 Little pocket mouse 1,890,068 55.4 137,134 4.0 313,110 9.2 1,073,139 31.4 3,413,451 100.0 Northern grasshopper 22,034 5.7 76,176 19.7 95,166 24.7 192,657 49.9 386,034 100.0

54
Table 13. Risk of displacement of habitat for species of conservation concern by cheatgrass within the Las Vegas Field Office in Nevada.
Risk category None Low Moderate High Total habitat
Species Ha % total Ha % total Ha % total Ha % total Ha % total mouse Sagebrush vole 445,927 45.8 241,380 24.8 214,094 22.0 71,965 7.4 973,366 100.0
a Habitat data for greater sage-grouse, Wyoming ground squirrel, white-tailed jackrabbit, and pygmy rabbit were not reported because these species' ranges do not overlap the Field Office.

55
Table 14. Risk of displacement of habitat for species of conservation concern by cheatgrass within the Surprise Field Office in Nevada.
Risk category None Low Moderate High Total habitat
Species Ha % total Ha % total Ha % total Ha % total Ha % total Amphibians Great Basin spadefoot 19,975 2.7 678,083 92.3 34,136 4.7 2,259 0.3 734,452 100.0 Reptiles Great Basin collared lizard 10,242 43.5 3,778 16.0 9,466 40.2 59 0.3 23,546 100.0 Long-nosed leopard lizard 14,297 12.1 90,180 76.6 13,128 11.2 59 0.1 117,664 100.0 Desert horned lizard 11,226 30.1 16,211 43.4 9,811 26.3 59 0.2 37,306 100.0 Common sagebrush lizard 14,297 2.0 666,353 93.2 32,267 4.5 2,255 0.3 715,172 100.0 Nightsnake 20,784 2.8 678,083 92.2 34,136 4.7 2,259 0.3 735,261 100.0 Striped whipsnake 21,024 2.9 678,083 92.2 34,136 4.6 2,259 0.3 735,501 100.0 Long-nosed snake 11,211 34.1 9,228 28.0 12,451 37.9 0 0.0 32,890 100.0 Birds Ferruginous hawk 9,433 2.3 389,860 95.7 6,030 1.5 2,259 0.5 407,583 100.0 Swainson's hawk 17,701 2.4 678,083 92.6 34,136 4.7 2,259 0.3 732,178 100.0 Northern harrier 18,002 2.4 678,071 92.6 34,136 4.7 2,259 0.3 732,468 100.0 Prairie falcon 17,569 2.4 678,071 92.6 34,136 4.7 2,259 0.3 732,035 100.0 Greater sage-grouse 132 0.0 657,273 96.6 21,354 3.1 2,200 0.3 680,959 100.0 Short-eared owl 18,002 2.5 678,071 92.5 34,136 4.7 2,259 0.3 732,468 100.0 Western burrowing owl 17,701 2.4 678,071 92.6 34,136 4.7 2,259 0.3 732,167 100.0 Gray flycatcher 240 0.0 576,173 96.4 19,139 3.2 2,196 0.4 597,748 100.0

56
Table 14. Risk of displacement of habitat for species of conservation concern by cheatgrass within the Surprise Field Office in Nevada.
Risk category None Low Moderate High Total habitat
Species Ha % total Ha % total Ha % total Ha % total Ha % total Sage thrasher 14,297 2.3 566,312 94.1 19,139 3.2 2,196 0.4 601,943 100.0 Loggerhead shrike 17,461 2.8 566,855 91.7 31,556 5.1 2,255 0.4 618,127 100.0 Sage sparrow 14,297 2.3 566,312 94.1 19,139 3.2 2,196 0.4 601,943 100.0 Black-throated sparrow 14,297 2.5 528,375 91.7 31,379 5.4 2,255 0.4 576,305 100.0 Lark sparrow 17,569 2.7 589,312 91.7 33,425 5.2 2,259 0.4 642,565 100.0 Green-tailed towhee 360 0.0 590,985 96.5 19,139 3.1 2,196 0.4 612,680 100.0 Vesper sparrow 3,033 0.4 677,539 96.2 21,719 3.1 2,200 0.3 704,490 100.0 Brewer's sparrow 14,297 2.1 665,003 94.7 20,496 2.9 2,196 0.3 701,991 100.0 Brewer's blackbird 4,575 8.6 48,589 91.0 219 0.4 0 0.0 53,383 100.0 Mammals Merriam's shrew 0 0.0 636,288 96.5 21,272 3.2 2,200 0.3 659,760 100.0 Kit fox 14,297 2.2 602,045 92.5 32,077 4.9 2,255 0.4 650,673 100.0 Pronghorn 0 0.0 297,200 96.2 9,635 3.1 2,259 0.7 309,094 100.0 Merriam's kangaroo rat 411 6.8 5,318 87.5 346 5.7 0 0.0 6,074 100.0 Chisel-toothed kangaroo rat 14,297 50.7 1,409 5.0 12,417 44.1 59 0.2 28,182 100.0 Ord's kangaroo rat 14,297 2.0 668,232 92.9 34,136 4.8 2,259 0.3 718,924 100.0 Dark kangaroo mouse 13,875 2.4 537,329 92.0 30,513 5.2 2,255 0.4 583,972 100.0 Little pocket mouse 14,297 2.2 611,582 92.6 32,077 4.9 2,255 0.3 660,211 100.0 Northern grasshopper mouse 14,297 2.0 668,232 92.9 34,136 4.8 2,259 0.3 718,924 100.0

57
Table 14. Risk of displacement of habitat for species of conservation concern by cheatgrass within the Surprise Field Office in Nevada.
Risk category None Low Moderate High Total habitat
Species Ha % total Ha % total Ha % total Ha % total Ha % total Sagebrush vole 14,297 2.0 666,823 94.6 21,719 3.1 2,200 0.3 705,038 100.0 White-tailed jackrabbit 15,938 3.5 415,873 91.9 18,627 4.1 2,200 0.5 452,638 100.0 Pygmy rabbit 14,297 2.0 666,811 94.6 21,719 3.1 2,200 0.3 705,026 100.0
a Habitat data for desert spiny lizard, groundsnake, and Wyoming ground squirrel were not reported because these species' ranges do not overlap the Field Office.

58
Table 15. Risk of displacement of habitat for species of conservation concern by cheatgrass within the Winnemucca Field Office in Nevada.
Risk category None Low Moderate High Total habitat
Species Ha % total Ha % total Ha % total Ha % total Ha % total Amphibians Great Basin spadefoot 586,344 16.2 772,442 21.4 665,230 18.4 1,590,878 44.0 3,614,895 100.0 Reptiles Great Basin collared lizard 777,633 33.2 91,343 3.9 240,615 10.3 1,233,974 52.6 2,343,566 100.0 Long-nosed leopard lizard 438,544 21.2 143,743 7.0 244,349 11.8 1,237,379 60.0 2,064,015 100.0 Desert horned lizard 438,544 21.2 143,743 7.0 244,349 11.8 1,237,379 60.0 2,064,015 100.0 Common sagebrush lizard 429,117 13.0 744,520 22.6 630,606 19.2 1,485,621 45.2 3,289,864 100.0 Desert spiny lizard 131,633 20.7 6,174 1.0 80,528 12.6 418,506 65.7 636,841 100.0 Nightsnake 778,114 20.4 772,442 20.3 665,230 17.5 1,590,878 41.8 3,806,664 100.0 Striped whipsnake 801,920 20.9 772,442 20.2 665,230 17.4 1,590,878 41.5 3,830,471 100.0 Long-nosed snake 342,055 19.1 74,763 4.2 239,179 13.3 1,134,411 63.4 1,790,409 100.0 Groundsnake 89,941 12.6 8,059 1.1 106,705 14.9 512,020 71.4 716,724 100.0 Birds Ferruginous hawk 502,793 19.0 613,134 23.1 475,681 17.9 1,059,857 40.0 2,651,465 100.0 Swainson's hawk 575,354 16.0 772,442 21.4 665,230 18.5 1,590,878 44.1 3,603,905 100.0 Northern harrier 582,456 16.3 745,323 20.8 659,457 18.4 1,590,877 44.5 3,578,113 100.0 Prairie falcon 563,746 15.8 745,323 21.0 659,457 18.5 1,590,877 44.7 3,559,403 100.0 Greater sage-grouse 1,548 0.1 659,657 48.1 375,484 27.4 333,684 24.4 1,370,373 100.0

59
Table 15. Risk of displacement of habitat for species of conservation concern by cheatgrass within the Winnemucca Field Office in Nevada.
Risk category None Low Moderate High Total habitat
Species Ha % total Ha % total Ha % total Ha % total Ha % total Short-eared owl 582,456 16.3 745,323 20.8 659,457 18.4 1,590,877 44.5 3,578,113 100.0 Western burrowing owl 565,294 15.9 745,323 20.9 659,457 18.5 1,590,877 44.7 3,560,951 100.0 Gray flycatcher 14,451 1.2 601,363 47.9 389,331 31.0 249,050 19.9 1,254,195 100.0 Sage thrasher 429,117 26.7 544,527 33.9 383,223 23.9 249,029 15.5 1,605,895 100.0 Loggerhead shrike 550,914 17.5 558,740 17.7 572,826 18.1 1,474,282 46.7 3,156,761 100.0 Sage sparrow 429,117 26.7 545,113 33.9 383,371 23.9 249,029 15.5 1,606,630 100.0 Black-throated sparrow 429,117 15.2 372,639 13.2 548,196 19.4 1,471,660 52.2 2,821,612 100.0 Lark sparrow 563,756 16.6 642,447 18.9 613,692 18.0 1,579,770 46.5 3,399,666 100.0 Green-tailed towhee 44,667 2.6 686,941 39.5 516,443 29.7 491,487 28.2 1,739,537 100.0 Vesper sparrow 123,052 7.2 757,915 44.1 473,365 27.5 364,942 21.2 1,719,274 100.0 Brewer's sparrow 429,127 21.2 710,699 35.1 491,440 24.2 394,745 19.5 2,026,010 100.0 Brewer's blackbird 208,947 36.9 277,055 48.9 70,730 12.5 10,242 1.8 566,974 100.0 Mammals Merriam's shrew 2,793 0.2 686,795 46.4 438,056 29.6 351,959 23.8 1,479,603 100.0 Kit fox 426,324 14.6 450,761 15.5 562,267 19.3 1,476,288 50.6 2,915,640 100.0 Pronghorn 40 0.0 472,093 37.2 269,623 21.3 526,551 41.5 1,268,307 100.0 Wyoming ground squirrel 72,323 12.3 208,396 35.4 117,423 19.9 190,585 32.4 588,727 100.0 Merriam's kangaroo rat 204,574 19.0 58,014 5.4 131,009 12.2 682,493 63.4 1,076,090 100.0 Chisel-toothed kangaroo rat 429,117 22.5 25,486 1.3 218,753 11.5 1,231,609 64.7 1,904,965 100.0 Ord's kangaroo rat 429,117 12.5 742,739 21.7 665,045 19.4 1,590,858 46.4 3,427,759 100.0

60
Table 15. Risk of displacement of habitat for species of conservation concern by cheatgrass within the Winnemucca Field Office in Nevada.
Risk category None Low Moderate High Total habitat
Species Ha % total Ha % total Ha % total Ha % total Ha % total Dark kangaroo mouse 362,161 17.3 289,507 13.8 388,461 18.5 1,058,399 50.4 2,098,527 100.0 Little pocket mouse 438,544 14.9 461,788 15.7 565,637 19.2 1,477,097 50.2 2,943,066 100.0 Northern grasshopper mouse 438,544 12.8 742,123 21.6 664,876 19.3 1,590,858 46.3 3,436,401 100.0 Sagebrush vole 429,117 21.5 729,599 36.5 473,044 23.7 364,712 18.3 1,996,472 100.0 White-tailed jackrabbit 109,643 13.6 325,564 40.5 181,300 22.6 186,893 23.3 803,400 100.0 Pygmy rabbit 429,117 21.8 702,793 35.7 469,534 23.9 365,394 18.6 1,966,838 100.0

61
Table 16. Comparison of amount of habitat among BLM Field Offices in Nevada for 40 species of conservation concern.
Field Office
Species Battle Mt.
Carson City
Eagle Lake Elko Ely
Las Vegas Surprise
Winne- mucca
Amphibians Great Basin spadefoot 5,203,493 3,044,342 137,995 4,420,754 4,856,845 2,060,850 734,452 3,614,895 Reptiles Great Basin collared lizard 2,051,102 2,145,502 68,868 280,173 759,450 3,063,970 23,546 2,343,566 Long-nosed leopard lizard 2,852,145 1,897,457 66,751 1,500,759 1,925,210 3,038,547 117,664 2,064,015 Desert horned lizard 2,852,145 1,917,368 66,751 1,500,759 1,925,210 3,038,547 37,306 2,064,015 Common sagebrush lizard 5,072,937 2,755,693 135,594 4,077,606 4,695,313 1,955,977 715,172 3,289,864 Desert spiny lizard 2,145,867 1,917,946 28 0 1,045,145 3,063,970 0 636,841 Nightsnake 5,235,264 2,964,402 139,194 4,241,984 5,007,964 3,716,386 735,261 3,806,664 Striped whipsnake 5,243,038 3,036,534 139,269 4,270,074 5,015,357 3,722,869 735,501 3,830,471 Long-nosed snake 2,915,519 1,907,083 67,862 1,291,528 2,011,000 3,081,975 32,890 1,790,409 Groundsnake 1,061,265 1,787,856 6,887 0 140,422 2,903,106 0 716,724 Birds Ferruginous hawk 4,030,248 1,270,378 0 4,345,970 5,025,430 3,722,832 407,583 2,651,465 Swainson's hawk 5,217,000 2,323,995 137,992 4,500,590 5,151,580 2,441,404 732,178 3,603,905 Northern harrier 4,384,857 2,659,827 137,992 4,169,272 3,848,842 3,562,704 732,468 3,578,113 Prairie falcon 4,380,789 2,603,263 137,978 4,136,959 3,831,184 3,562,704 732,035 3,559,403 Greater sage-grouse 1,642,628 301,110 80,860 3,165,766 1,459,852 0 680,959 1,370,373 Short-eared owl 4,384,857 2,659,827 137,992 4,169,272 3,848,842 3,562,704 732,468 3,578,113 Western burrowing owl 4,381,312 2,604,422 137,992 4,145,893 3,831,966 3,563,491 732,167 3,560,951 Gray flycatcher 2,295,535 918,760 68,917 2,642,864 3,144,605 672,797 597,748 1,254,195 Sage thrasher 1,642,284 813,447 82,672 2,384,776 1,822,755 438,069 601,943 1,605,895 Loggerhead shrike 4,525,116 2,586,888 119,000 3,190,553 4,259,168 3,584,601 618,127 3,156,761 Sage sparrow 1,678,339 813,627 83,120 2,386,061 2,126,210 1,085,573 601,943 1,606,630 Black-throated sparrow 3,808,460 1,979,965 98,743 2,794,062 3,296,548 3,441,671 576,305 2,821,612

62
Table 16. Comparison of amount of habitat among BLM Field Offices in Nevada for 40 species of conservation concern.
Field Office
Species Battle Mt.
Carson City
Eagle Lake Elko Ely
Las Vegas Surprise
Winne- mucca
Lark sparrow 3,803,761 1,915,035 119,648 3,508,309 4,251,649 470,666 642,565 3,399,666 Green-tailed towhee 2,446,549 1,031,924 68,917 3,122,795 3,200,045 679,168 612,680 1,739,537 Vesper sparrow 1,781,388 489,919 83,296 3,546,318 2,022,446 23,808 704,490 1,719,274 Brewer's sparrow 3,467,842 1,556,063 101,025 3,702,340 3,836,585 1,269,033 701,991 2,026,010 Brewer's blackbird 1,612,996 834,964 13,960 1,239,202 1,936,324 326,425 53,383 566,974 Mammals Merriam's shrew 2,842,504 360,132 0 3,445,879 3,409,383 530,279 659,760 1,479,603 Kit fox 3,542,664 1,586,993 117,405 3,025,493 2,921,905 2,684,761 650,673 2,915,640 Pronghorn 637,167 428,413 122,806 1,405,126 957,362 274,140 309,094 1,268,307 Wyoming ground squirrel 163,763 0 0 1,972,159 13,187 0 0 588,727 Merriam's kangaroo rat 1,150,746 1,458,444 67,910 0 679,572 2,849,154 6,074 1,076,090 Chisel-toothed kangaroo rat 2,827,249 1,696,198 48,422 541,667 1,874,363 2,372,260 28,182 1,904,965 Ord's kangaroo rat 4,565,537 2,542,782 136,630 4,024,929 4,024,303 1,135,460 718,924 3,427,759 Dark kangaroo mouse 2,928,899 487,258 117,433 1,935,433 1,926,931 469,014 583,972 2,098,527 Little pocket mouse 3,611,874 2,235,309 120,308 1,389,550 1,964,841 3,413,451 660,211 2,943,066 Northern grasshopper mouse 3,341,117 2,475,030 136,630 3,864,126 2,740,301 386,034 718,924 3,436,401 Sagebrush vole 3,113,769 1,391,292 102,037 3,647,068 3,596,632 973,366 705,038 1,996,472 White-tailed jackrabbit 1,391,800 932,471 98,927 4,041,317 2,751,513 0 452,638 803,400 Pygmy rabbit 1,496,859 726,339 102,037 3,396,641 1,934,443 0 705,026 1,966,838

63
Figure 1. Fourteen ecological provinces used in modeling risk of displacement of native vegetation by cheatgrass and pinyon-juniper woodlands. These provinces are a modification of those described in Miller et al. (1999) and West et al. (1998).

64
Figure 2. Risk of displacement of sagebrush cover types by pinyon-juniper woodlands within Bureau of Land Management Field Offices in the state of Nevada, encompassing the High Calcareous, Central High, and Bonneville Ecological Provinces. Note that only a small fraction of the Bonneville Ecological Province lies within Nevada (see Figure 1 for location of the Bonneville Ecological Province in Utah and Nevada).

65
Figure 3. Risk of displacement of sagebrush and other native vegetation by cheatgrass within Bureau of Land Management Field Offices in Nevada. Areas not modeled were land cover types considered not susceptible to displacement by cheatgrass.
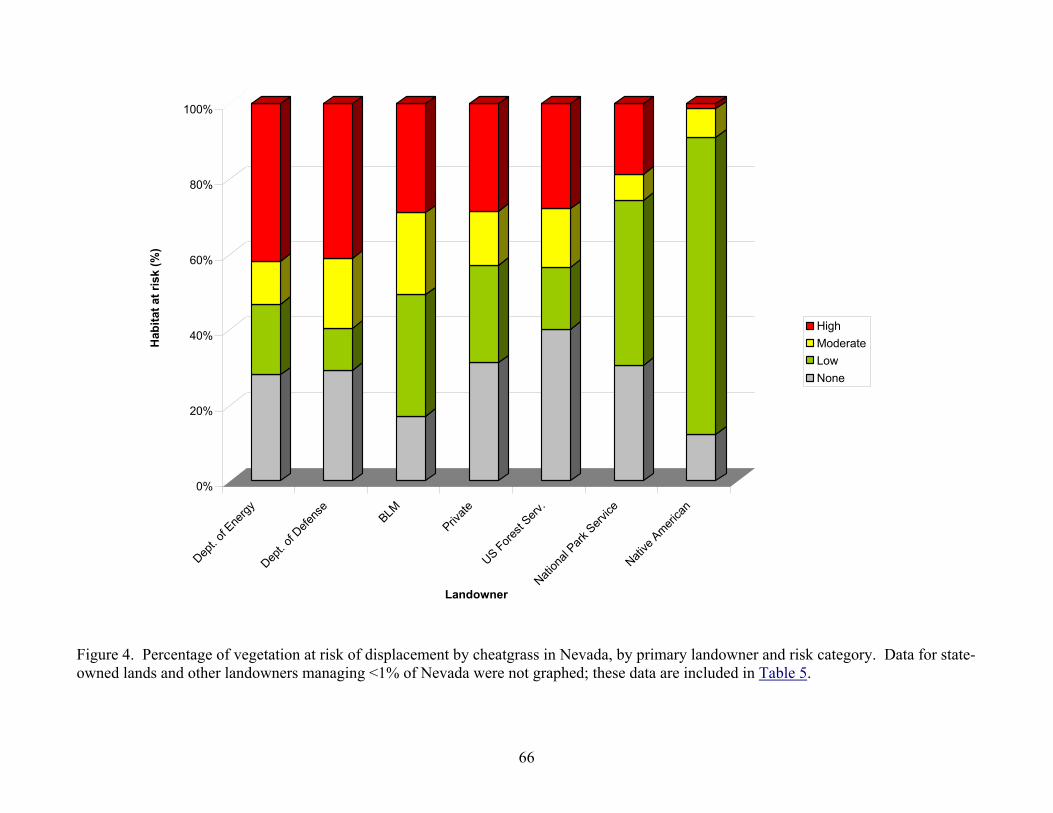
66
0%
20%
40%
60%
80%
100%
Hab
itat a
t ris
k (%
)
Dept. o
f Ene
rgyDep
t. of D
efens
e
BLM
Private
US Forest
Serv.
Nation
al Park
Service
Native
America
n
Landowner
HighModerateLowNone
Figure 4. Percentage of vegetation at risk of displacement by cheatgrass in Nevada, by primary landowner and risk category. Data for state-owned lands and other landowners managing <1% of Nevada were not graphed; these data are included in Table 5.
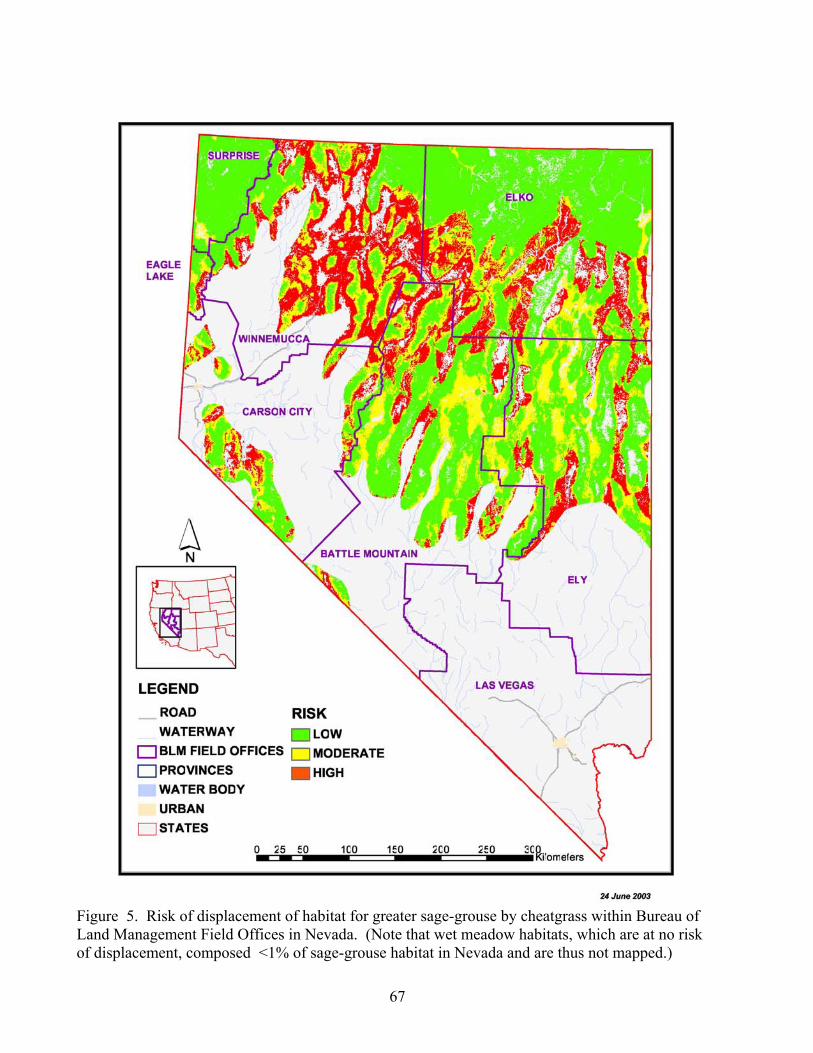
67
Figure 5. Risk of displacement of habitat for greater sage-grouse by cheatgrass within Bureau of Land Management Field Offices in Nevada. (Note that wet meadow habitats, which are at no risk of displacement, composed <1% of sage-grouse habitat in Nevada and are thus not mapped.)