summary statistics and trend analysis of water-quality
TRANSCRIPT

Summary Statistics and Trend Analysis ofWater-Quality Data at Sites in theGila River Basin, New Mexico and ArizonaBy STANLEY BALDYS, III, LISA K. HAM, and KENNETH D. POSSUM
U.S. GEOLOGICAL SURVEYWater-Resources Investigations Report 95 4083
Prepared in cooperation with the ARIZONA DEPARTMENT OF
ENVIRONMENTAL QUALITY
Tucson, Arizona 1995
U.S. DEPARTMENT OF THE INTERIOR BRUCE BABBITT, Secretary
U.S. GEOLOGICAL SURVEY Gordon P. Eaton, Director
Any use of trade, product, or firm names in this publication is for descriptive purposes only and does not constitute endorsement by the U.S. Government.
For additional information Copies of this report can be write to: purchased from:
District Chief U.S. Geological SurveyU.S. Geological Survey Open-File SectionWater Resources Division Box 25286, MS 517375 South Euclid Avenue Denver Federal CenterTucson,AZ 85719-6644 Denver, CO 80225

CONTENTS
Page
Abstract.............................................................................................................................................................. 1mtroduction..........................................» 1
Purpose and scope..................................................................................................................................... 2Previous studies......................................................................................................................................... 2Basin description......................................................................................................................................^ 2Data-collection history.............................................................................................................................. 5
Methods.............................................................................................................................................................. 5Summary statistics..................................................................................................................................... 5Seasonal Kendall tau test on flow-adjusted data....................................................................................... 6
Summary statistics and trend analyses............................................................................................................... 9pH......................................................_ 10Tiirbidity......................................._ 12Hardness.................................................................................................................................................... 12Dissolved solids......................................................................................................................................... 14Dissolved sodium...................................................................................................................................... 17Dissolved sulfate....................................................................................................................................... 17Dissolved chloride..................................................................................................................................... 20Total ammonia plus organic nitrogen........................................................................................................ 20Total phosphorus....................................................................................................................................... 22Dissolved arsenic....................................................................................................................................... 24Dissolved barium....................................................................................................................................... 24Total boron......................................................._ 27Dissolved chromium.................................................................................................................................. 27Suspended and total copper....................................................................................................................... 30Dissolved and total lead............................................................................................................................ 33Total manganese........................................................................................................................................ 36Dissolved zinc........................................................................................................................................... 39Total organic carbon.................................................................................................................................. 39
Summary .........................................................................................................................................................^ 39Selected referenres.........................................^^ 43Summary statistics and results of seasonal Kendall tau test.............................................................................. 45
FIGURES
1. Map showing study area, water provinces, and water-quality stations,Salt and Gila River basins..................................................................................................... 3
2-3. Graphs showing:2. Logarithms of concentrations of dissolved sodium and instantaneous discharges
resulting from regression equation for San Francisco River near Clifton.......................... 73. Sample residuals from the regression of the logarithms of dissolved-sodium
concentrations and instantaneous discharges for samples collected at San Francisco River near Clifton........................................................................................ 8
4-9. Maps and boxplots showing:4. pH and direction of temporal trend....................................................................................... 115. Turbidity and direction of temporal trend............................................................................. 136. Hardness and direction of temporal trend............................................................................. 157. Dissolved solids and direction of temporal trend.................................................................. 168. Dissolved sodium and direction of temporal trend............................................................... 189. Dissolved sulfate and direction of temporal trend................................................................. 19
Contents III

CONTENTS Continued
FIGURES Continued Page 10-23. Maps and boxplots showing:
10. Dissolved chloride and direction of temporal trend.............................................................. 2111. Total ammonia plus organic nitrogen and direction of temporal trend................................. 2312. Total phosphorus and direction of temporal trend................................................................ 2513. Dissolved arsenic and direction of temporal trend................................................................ 2614. Dissolved barium and direction of temporal trend................................................................ 2815. Total boron and direction of temporal trend......................................................................... 2916. Dissolved chromium and direction of temporal trend........................................................... 3117. Suspended copper and direction of temporal trend............................................................... 3218. Total copper and direction of temporal trend........................................................................ 3419. Dissolved lead and direction of temporal trend..................................................................... 3520. Total lead and direction of temporal trend............................................................................ 3721. Total manganese and direction of temporal trend................................................................. 3822. Dissolved zinc and direction of temporal trend..................................................................... 4023. Total organic carbon and direction of temporal trend........................................................... 41
TABLES
1. Study sites for trend analysis, Salt and Gila River basins.................................................................. 62. Summary statistics for pH data used in time-trend analysis............................................................... 473. Results of seasonal Kendall tau test of flow-adjusted pH.................................................................. 484. Summary statistics for turbidity used in time-trend analysis............................................................. 495. Results of seasonal Kendall tau test of flow-adjusted turbidity......................................................... 506. Summary statistics for hardness used in time-trend analysis............................................................. 517. Results of seasonal Kendall tau test of flow-adjusted hardness......................................................... 528. Summary statistics for dissolved solids used in time-trend analysis.................................................. 539. Results of seasonal Kendall tau test of flow-adjusted dissolved solids.............................................. 54
10. Summary statistics for dissolved sodium used in time-trend analysis............................................... 5511. Results of seasonal Kendall tau test of flow-adjusted dissolved sodium........................................... 5612. Summary statistics for dissolved sulfate used in time-trend analysis................................................ 5713. Results of seasonal Kendall tau test of flow-adjusted dissolved sulfate............................................ 5814. Summary statistics for dissolved chloride used in time-trend analysis.............................................. 5915. Results of seasonal Kendall tau test of flow-adjusted dissolved chloride.......................................... 6016. Summary statistics for total ammonia plus organic nitrogen used in time-trend analysis................. 6117. Results of seasonal Kendall tau test of flow-adjusted total ammonia plus organic nitrogen............. 6218. Summary statistics for total phosphorus used in time-trend analysis................................................. 6319. Results of seasonal Kendall tau test of flow-adjusted total phosphorus............................................. 6420. Summary statistics for dissolved arsenic used in time-trend analysis................................................ 6521. Results of seasonal Kendall tau test of flow-adjusted dissolved arsenic............................................ 6622. Summary statistics for dissolved barium used in time-trend analysis................................................ 6723. Results of seasonal Kendall tau test of flow-adjusted dissolved barium............................................ 6824. Summary statistics for total boron used in time-trend analysis.......................................................... 6925. Results of seasonal Kendall tau test of flow-adjusted total boron...................................................... 7026. Summary statistics for dissolved chromium used in time-trend analysis........................................... 7127. Results of seasonal Kendall tau test of flow-adjusted dissolved chromium....................................... 7228. Summary statistics for suspended copper used in time-trend analysis............................................... 7329. Results of seasonal Kendall tau test of flow-adjusted suspended copper........................................... 7430. Summary statistics for total copper used in time-trend analysis........................................................ 7531. Results of seasonal Kendall tau test of flow-adjusted total copper.................................................... 7632. Summary statistics for dissolved lead used in time-trend analysis.................................................... 77
IV Contents

CONTENTS Continued
TABLES Continued Page33. Results of seasonal Kendall tau test of flow-adjusted dissolved lead................................................ 7834. Summary statistics for total lead used in time-trend analysis............................................................ 7935. Results of seasonal Kendall tau test of flow-adjusted total lead........................................................ 8036. Summary statistics for total manganese used in time-trend analysis................................................. 8137. Results of seasonal Kendall tau test of flow-adjusted total manganese............................................. 8238. Summary statistics for dissolved zinc used in time-trend analysis.................................................... 8339. Results of seasonal Kendall tau test of flow-adjusted dissolved zinc................................................ 8440. Summary statistics for total organic carbon used in time-trend analysis........................................... 8541. Results of seasonal Kendall tau test of flow-adjusted total organic carbon....................................... 86
CONVERSION FACTORS
Multiply By To obtain
inch (in.) 25.40 millimeterfoot (ft) 0.305 metersquare mile (mi2) 2.590 square kilometeracre-foot (acre-ft) 0.001233 hectometercubic foot per second (f^/s) 0.0283 cubic meter per secondpound (Ib) 0.907 megagram
In this report, temperature is reported in degrees Fahrenheit (°F), which can be converted to degrees Celsius (°C) by the following equation:
°C = (°F-32)/1.8
ABBREVIATED UNITS FOR WATER CHEMISTRY
Chemical concentration and water temperature are given only in metric units. Chemical concentration in water is given in milligrams per liter (mg/L) or micrograms per liter (ug/L). Milligrams per liter is a unit expressing the solute per unit volume (liter) of water. One thousand micrograms per liter is equivalent to 1 milligram per liter. For concentrations less than 7,000 milligrams per liter, the numerical value is about the same as for concentrations in parts per million. Specific conductance is given in microsiemens per centimeter (uS/cm) at 25 C.
Dissolved In this report, the term "dissolved" refers to constituents in a representative water sample that pass through a 0.45-micrometer membrane filter or a 0.7-micrometer glass fiber filter for organic analysis. Determinations of dissolved constituents are made on subsamples of the filtrate.
Whole water, recoverable The term "total" used in this report means "whole water, recoverable," which refers to constituents in solution after a representative water-suspended-sediment sample is digested (usually using a dilute acid solution). Complete dissolution of paniculate matter often is not achieved by the digestion treatment, and thus the determination represents something less than the "total" amount (that is, less than 95 percent) of the constituent present in the dissolved and suspended phases of the sample. For inorganic determinations, digestions are performed in the original sample container to ensure digestion of material absorbed on the container walls. To achieve comparability of analytical data, equivalent digestion procedures would be required of all laboratories performing such analyses because different digestion procedures are likely to produce different analytical results.
VERTICAL DATUM
Sea level: In this report, "sea level" refers to the National Geodetic Vertical Datum of 1929 A geodetic datum derived from a general adjustment of the first-order level nets of the United States and Canada, formerly called "Sea Level Datum of 1929."
Contents V

Summary Statistics and Trend Analysis of Water-Quality Data at Sites in the Gila River Basin, New Mexico and Arizona
By Stanley Baldys, III, Lisa K. Ham, and Kenneth D. Possum
Abstract
Summary statistics and temporal trends for 19 water-chemistry constituents and for turbidity were computed for 13 study sites in the Gila River basin, Arizona and New Mexico, from data collected beginning as early as October 1972 through September 1987. A nonparametric statistical technique, the seasonal Kendall tau test for flow-adjusted data, was used to analyze temporal changes in water-chemistry data. For the 19 selected constituents and turbidity, decreasing trends outnumbered increasing trends by more than two to one.
Decreasing trends were found for 49 data sets at the 13 study sites. Sites having the largest number of decreasing trends were Gila River at Calva and Gila River above diversions, at Gillespie Dam (eight each). Data for Gila River at Calva indicated decreasing values of hardness, dissolved chloride, dissolved sodium, dissolved sulfate, dissolved solids, total phosphorus, dissolved lead, and total manganese. Data for Gila River above diversions, at Gillespie Dam indicated decreasing concentrations for hardness, dissolved chloride, dissolved sodium, dissolved sulfate, dissolved solids, dissolved barium, dissolved lead, and total manganese. The largest number of decreasing trends measured for a constituent was six for dissolved lead. The next largest number of decreasing trends for a constituent was for total manganese and dissolved solids (five each). Dissolved chloride, dissolved sodium, and hardness had decreasing trends at four of the study sites.
Increasing trends for the 19 water-chemistry constituents and for turbidity were found for 24 data sets at the 13 study sites. Final Creek at Inspiration Dam had the largest number (six) of increasing trends dissolved chloride, dissolved sodium, dissolved sulfate, dissolved solids, total manganese, and dissolved chromium. Gila River near mouth, near Yuma had three increasing trends dissolved sulfate, total lead, and total ammonia plus organic nitrogen. The largest number of increasing trends measured for a single constituent or property was for pH (four), dissolved sulfate (three), dissolved chromium (three), and dissolved manganese (three). Increasing values of constituents or turbidity generally were found in three areas in the basin at Final Creek above Inspiration Dam, at sites above reservoirs, and at sites on the main stem of the Gila River from Gillespie Dam to the mouth.
INTRODUCTION western New Mexico. In Arizona, the increasedpopulation from 499,261 in 1940 to 3,605,700 in
Water-resources managers are interested in 1988 (VaUey National Bank, 1988) has resulted ineffectively evaluating and understanding short-and increased demands on surface-water andlong-term trends of water quality in streams in the ground-water resources.Gila River basin. The Gila River basin is a valuable The U.S. Geological Survey (USGS), insource of water for agricultural, industrial, and cooperation with the Arizona Department ofmunicipal uses throughout central Arizona and Environmental Quality (ADEQ), assessed
Abstract 1

temporal changes in water-chemistry data collected at 13 sites in the Gila River basin. A nonparametric statistical technique, the seasonal Kendall tau test for flow-adjusted data, was selected as the method used for trend analysis. Water-chemistry data collected at several sites in the Gila River basin, mostly by the ADEQ and the USGS, were available for trend analysis.
Purpose and Scope
This report describes temporal and areal variability of 19 water-chemistry constituents and turbidity in samples collected at 13 streamflow- gaging stations in the Gila River basin beginning as early as February 1926 at one station through September 1987. The chemical constituents and turbidity used in computations of summary statistics and analyses of temporal trends were selected by joint agreement of the USGS and the ADEQ on the basis of previous studies in which increases occurred at one or more sites and streamflow data suggested input from point- or nonpoint-pollution sources. An attempt was made to select those for which the State of Arizona had developed or was developing quality standards for surface waters. The 19 constituents selected were pH, hardness, dissolved solids, dissolved sodium, dissolved sulfate, dissolved chloride, total ammonia plus organic nitrogen, total phosphorus, dissolved arsenic, dissolved barium, total boron, dissolved chromium, suspended copper, total copper, dissolved lead, total lead, total manganese, dissolved zinc, and total organic carbon. The study sites were selected on the basis of availability of historical data and the importance of the stream segment to the Gila River basin. Six of the 13 gaging stations are on the main stem of the Gila River. The remaining seven stations are on major tributaries to the Gila River one on the San Francisco River, one on the San Pedro River, two on the Agua Fria River, two on the Salt River, and one on Final Creek, which is tributary to the Salt River.
Previous Studies
Only a few appraisals have been done on the quality of surface water in the Gila River basin. Hem (1950) studied water-chemistry characteristics of the Gila River basin above Coolidge Dam. Feth and Hem (1963) did a reconnaissance study of the water chemistry of headwater springs in the Gila River basin. Robertson (1975) reported on hexavalent-chromium concentrations in the ground water in the northeastern part of the Phoenix area. Kister and Hardt (1966) investigated salinity of ground water in west Pinal County. Baldys (1990) did a trend analysis on the Verde River. Smith and others (1982a) defined water chemistry of surface water in canals carrying water diverted at Granite Reef Dam. Wilson (1988) reported on water chemistry of base flow in the Agua Fria River in the northern part of the Agua Fria River basin. Brown and Pool (1989) studied the ground-water chemistry in the San Carlos Indian Reservation. Arizona Department of Health Services (1976, 1986) and Arizona Department of Environmental Quality (1986, 1988, 1990, and 1992) reported on the water chemistry of surface waters for the entire State.
The seasonal Kendall tau test applied to flow-adjusted data was used as the method of trend analysis in this report. The test was described by Kendall (1975), Hirsch (1981), Smith and others (1982a), and Alley (1988). This method of trend analysis has been used in several hydrologic investigations (Smith and others 1982a; Buell and Grams, 1985; Goetz and others, 1987; Smith and others, 1987).
Basin Description
The Gila River basin lies within the boundaries of three major water provinces of Arizona and New Mexico the Plateau uplands province, Central highlands province, and the Basin and Range lowland province (fig. 1). The drainage area for the basin is about 57,950 mi2 at streamflow-gaging station, Gila River near mouth, near Yuma (09520700). The two largest cities in Arizona Phoenix, with a population of 954,485 and Tucson, with a population of 412,590 are in
2 Summary Statistics and Trend Analysis of Water-Quality Data at Sites in the Gila River Basin

113 110*
PLATEAULr~UPLANDS
PROVINCE
r' ^u;,p Flagstaff
BASINIAND RANGE»
* t rean ^ i .
LJ '"^\ i ^t\ -J^--'
Base from U.S. Geological Survey State base map. 1974. 1:500.000
I 1 0 25 50 KILOMETERS
4700
EXPLANATION
WATER-QUALITY STATION AND ABBREVIATED NUMBER Complete station number is 09470000
BASIN BOUNDARY
Figure 1. Study area, water provinces, and water-quality stations, Salt and Gila River basins.
Introduction 3

the Gila River basin (Valley National Bank, 1988). Land use has changed in these metropolitan areas; land that was formerly used for agriculture has been converted to urban use. The computer industry is predominant in the basin (Valley National Bank, 1988), although some heavy industries such as copper mines and associated smelters are in Clifton-Morenci, Globe-Miami, Hayden-Kearny, and San Manuel. A copper smelter at Douglas discontinued operation in 1986.
The Central highlands water province includes the central part of Arizona and the far western part of New Mexico. The province consists principally of rugged volcanic mountains. Some peaks are at an altitude of about 11,000 ft above sea level and include Mount Baldy near McNary, 11,403ft; Whitewater Baldy, 10,892 ft; and Reeds Peak, 10,001 ft. Whitewater Baldy and Reeds Peak are north of Silver City, New Mexico. The Mogollon Rim is an escarpment that consists mostly of Paleozoic sedimentary rocks such as sandstone, siltstone, claystone, and limestone (Arizona Bureau of Mines, 1969). Along the base of the Mogollon Rim, many springs issue from the Coconino Sandstone and underlying Supai Formation of Pennsylvanian and Permian age and Redwall Limestone of Mississippian age (Arizona Bureau of Mines, 1969).
The Central highlands receives the greatest amount of precipitation in Arizona, partly because of the orographic effect of the Mogollon Rim. The Mogollon Rim forms much of the north boundary of the water province. Average annual precipitation at Hawley Lake in the White Mountains, part of the Mogollon Rim, is 37.4 in. (Sellers and others, 1985). Average annual precipitation at Winkelman near the southwest boundary of the water province is 14.0 in. (Sellers and others, 1985).
The Gila River heads in the eastern part of the Central highlands in western New Mexico where the boundary of the province is the Continental Divide. The Tularosa River in New Mexico and the Blue River in Arizona join to become the San Francisco River, which flows southward to join the main stem of the Gila River near the city of Clifton. Bonita Creek and Eagle Creek major tributaries to the Gila River join the Gila River south of Clifton. The Gila River then flows through Safford Valley to Coolidge Dam where the San Carlos Reservoir is formed. The usable capacity of the reservoir is
935,000 acre-ft. Water is released according to needs of downstream users and seldom reaches the Phoenix metropolitan area. The two largest tributaries to the Gila River west of Clifton are the Salt River and the Verde River. The average flow is 896ft3/s at the Salt River near Roosevelt streamflow-gaging station (09498500), which is upstream from four reservoirs on the Salt River (Garrett and Gellenbeck, 1991). The reservoirs Roosevelt Lake, Apache Lake, Canyon Lake, and Saguaro Lake have a combined usable capacity of 1,710,000 acre-ft. The average flow is 559 ft3/s at Verde River below Tangle Creek, which is upstream from two major reservoirs (Garrett and Gellenbeck, 1991). The reservoirs below Verde River below Tangle Creek Horseshoe Reservoir and Bartlett Reservoir have a combined usable capacity of 309,600 acre-ft.
The Basin and Range lowlands water province is in the southern and southwestern part of Arizona. The province is made up of broad alluvial-floored basins bounded by high mountain ranges and receives little precipitation (Arizona Bureau of Mines, 1969). The highest peak in the Basin and Range province is Mount Graham, 10,720 ft, near Safford. Other peaks in the province include Mount Lemmon near Tucson, 9,157 ft; Chiricahua Peak near Douglas, 9,796 ft; and Baboquivari Peak west of Tucson, 7,734 ft. The altitude of the Gila River ranges from 1,950 ft above sea level at the Central highlands boundary to 120 ft at the streamflow- gaging station, Gila River near mouth, near Yuma. Average annual precipitation is 7.0 in. at the Phoenix airport and 3.4 in. in Yuma (Sellers and others, 1985)
The mountains of the Basin and Range lowlands are composed chiefly of granite, gneiss, schist, and quartzite; some mountains are capped by volcanic rocks that range from Precambrian to Tertiary in age (Arizona Bureau of Mines, 1969). The valleys are filled with unconsolidated deposits that may be as much as 3,000 ft thick (Arizona Bureau of Mines, 1969).
Major tributaries to the Gila River in the Basin and Range lowlands to the east and south of Phoenix include the San Simon, San Pedro, and Santa Cruz Rivers. Mean annual flows in the three tributaries are each less than 40 ft3/s; flows in the San Simon and Santa Cruz Rivers seldom reach the Gila River. The Agua Fria River is a major tributary
4 Summary Statistics and Trend Analysis of Water-Quality Data at Sites in the Gila River Basin

to the Gila River west of Phoenix. Flow in the Agua Fria River is regulated by Waddell Dam, which forms Lake Pleasant. The usable capacity of Lake Pleasant is 157,600 acre-ft. Flow in the Gila River west of Phoenix is regulated by the earthen dam at Painted Rock Reservoir, which has a usable capacity of 2,492,000 acre-ft.
The Gila River basin encompasses a region characterized by diverse temperatures and vegetation. In the lower deserts, temperatures often exceed 115°F during the summer months; in the mountainous areas, subzero temperatures are common during winter months. Vegetation types, in general, follow patterns of rainfall and altitude in the basin. Cactus and other types of desert shrubs are found in the low-altitude and low-rainfall areas of the basin. Chaparral and pinyon pine are found between 3,500 and 7,000ft (McDougall, 1973). Mixed-conifer vegetation is found in areas that receive large amounts of precipitation, generally higher than 7,000 ft (McDougall, 1973).
Data-Collection History
Water^chemistry data were collected in the Gila River basin beginning in February 1926, but sampling for the constituents outlined in this report did not begin at most of the study sites until the mid-1970's or early 1980's(fig. 1, table 1). Much of the early sampling was done only for water- temperature and specific-conductance determina tions and did not include determinations of major ions, nutrients, and metal concentrations. The collection of the water-chemistry data used to compute summary statistics and trends began October 1972 through September 1987. Samples were collected using methods developed by the USGS and summarized by Sylvester and others (M.A. Sylvester, hydrologist, USGS, written commun., 1990). The method of sample collection generally involved depth-integrating samples by withdrawing water at several verticals in the stream; the location of the verticals was determined by dividing the stream into equal-discharge increments or equal-width increments. Samples were processed using standard methods of the USGS and sent to laboratories in Atlanta, Georgia, or Denver, Colorado, for chemical analyses.
Stage and discharge data were collected at all 13 study sites. The period of surface-water data collection at a site generally exceeded the period of water-chemistry data collection because surface- water data collection began as early as 1910. Mean-annual flow computed for each site ranged from 12.3 ft3/s at Pinal Creek at Inspiration Dam, near Globe (09498400) to 979 ft3/s at Salt River below Stewart Mountain Dam (09502000).
METHODS
The methods of data analysis used in this study have been used in previous studies and are well documented. Summary statistics were calculated for the 19 water-chemistry constituents and for turbidity at each site using software programs developed by Helsel and Conn (1988). Data used in this analysis are stored in the USGS National Water Information System. Temporal trends in the water-chemistry data were analyzed using the seasonal Kendall tau test, standard statistical software packages, and a low-adjustment procedure by Smith and others (1982a).
Summary Statistics
Summary statistics calculated for the 19 water-chemistry constituents and for turbidity included values of the mean, median, minimum, maximum, standard deviation, and standard error of the mean. Visual summaries of the distribution of the data are shown in boxplots that are constructed by ranking data from smallest to largest. A box is drawn from the 25th percentile to the 75th percentile; box length equals the interquartile range. A center line between the 25th and 75th percentiles is drawn across the box at the median (50th percentile). "Whiskers" are then drawn from the quartiles to two adjacent values. The upper adjacent value is defined as the largest data point less than or equal to the upper quartile plus 1.5 times the interquartile range. The lower adjacent value is defined similarly. Values more extreme than the adjacent values and within a range of 1.5 to 3.0 times the interquartile range are called outlier values and are plotted with the letter "x." Data values greater than or less than three times the
Methods 5

Table 1. Study sites for trend analysis, Salt and Gila River basins
Station number Station name
Drainagearea,
in squaremiles
Mean annualstreamflow, incubic feet per
second
Date of collection
From To
09431500 Gila River near Redrock, New Mexico ................................ 2,829 209
09444600 San Francisco River near Clifton ......................................... 2,766 213
09466500 Gila River at Calva............................................................... 11,470 328
09470000 Gila River at Winkelman ...................................................... 13,268 1 294
09473100 San Pedro River below Aravaipa Creek, near Mammoth .... 4,360 (2)
09498400 Final Creek at Inspiration Dam, near Globe ........................ 195 12.3
09498500 Salt River near Roosevelt..................................................... 4,306 903
09502000 Salt River below Stewart Mountain Dam ............................ 6,232 979
09512800 Agua Fria River near Rock Springs ..................................... 1,130 88.3
09513600 Agua Fria River below Waddell Dam .................................. 1,433 396.5
09518000 Gila River above diversions, at Gillespie Dam .................... 49,650 404
09520500 Gila River near Dome .......................................................... 57,850 (*)
09520700 Gila River near mouth, near Yuma ...................................... 57,950 C*)
9-73
1-76 10-80 10-86
10-74 1-76
10-80
11-79 1-76
10-72
1-82
3-82 6-74
4-731-79
10-83
10-72
9-87
9-79 3-84 9-87
9-87
9-84
9-86
9-87
9-87
9-87
9-87
9-87 9-87
8-73 1-79 9-87
9-84
1Adjusted for storage in San Carlos Reservoir, Arizona.Surface-water data collection less than 5 years.3Average discharge at station, 09513000, Agua Fria River at Waddell Dam, Arizona.4Not calculated because of many diversions, storage reservoirs, and other uses upstream from station.
interquartile range are called extreme values and are plotted with a circle.
Standard statistical procedures were used to calculate the statistics for data sets that did not contain "less than" values, which are also referred to as censored data. Censored data are values reported from analytical techniques as less than the minimum reporting level (MRL). Some data sets contain multiple MRL's. This study used the logarithmic-probability regression method devel oped by Helsel and Conn (1988) to compute summary statistics for data sets of constituents that contained "less than" values.
Seasonal Kendall Tau Test on Flow-Adjusted Data
The seasonal Kendall tau test is a distribution-free test that is not affected by the problems that affect ordinary least-squares (OLS)
regression analysis (water-chemistry constituent against time), with the exception of serial corre lation. The major advantage of distribution-free tests is that the underlying probability distribution of the random variable is immaterial (Smith and others, 1982a). This test accounts for the effects of discharge on the concentration of a particular water-chemistry constituent. The seasonal Kendall tau test is preferred over other methods of trend analysis, such as regression analysis, because it can be applied to data sets containing outlier values (nonnormal distributed data sets), gaps or missing data, data reported as below reporting limits, and data correlated in time (seasonally). The seasonal Kendall tau test used in this study was derived by Hirsch (1981) from the method presented by Kendall (1975).
The seasonal Kendall tau test on flow-adjusted data is done in two steps. In the first step, water-chemistry data are flow adjusted using OLS
6 Summary Statistics and Trend Analysis of Water-Quality Data at Sites in the Gila River Basin

regression analysis to remove some of the variability of the water-chemistry data. Most water-chemistry data in a mathematically untransformed state when regressed against time do not have residuals from the regression that satisfy the assumptions of normality and homogeneity of variances needed for regression analysis. These assumptions are not met because the seasonal variability of the data is likely to be distributed nonuniformly. A method to remove some of the variability is to use an exogenous variable; in the case of water-chemistry constituent concentrations, the exogenous variable generally is instantaneous discharge. In the OLS regression analysis, the water-chemistry variable in question is regressed against instantaneous discharge. An example of this method is the regressing of concentrations of dissolved sodium against instantaneous discharge for data from the San Francisco River near Clifton
(09444600; data transferred to base-10 logarithmic units; fig. 2). The equation used for the regression is
where
0)
c4- = instantaneous concentration of the water-chemistry constituent,
Qi = instantaneous water discharge,
#o, i = regression parameters, and
e' - sample residual (error) in regression.
The instantaneous-discharge value, Qit can be transformed mathematically by a number of methods in order to produce a better model. This
crHIK
2E-113 tr
«Q<lil cc
03 d 035QzUL ~~
O 03
11
O ui -"O
O O
3.0
2.5
2.0
1.5
1.0 1.25 1.50 1.75 2.0 2.25 2.50 2.75 3.0
LOGARITHM OF INSTANTANEOUS DISCHARGE, IN CUBIC FEET PER SECOND
3.25
Figure 2. Logarithms of concentrations of dissolved sodium and instantaneous discharges resulting from regression equation for San Francisco River near Clifton.
Methods 7

study used the following transformation functions
Transformation Type
Linear (LJN)
Logarithmic (LOG)
Inverse (INV)
Hyperbolic (HYP)
(B of the hyperbolic transformation is equal to 10[(-2.5)(loglO(e,))+X] where X varies from 10°-5 to 103-5 by increments of 100>5.)
The hyperbolic transformation was used by Buell and Grams (1985) in their investigation of temporal trends in selected water-chemistry constituents and turbidity for streams in Georgia. The constituent concentrations (c,) were used in either their raw format^c,) - c,-or as a logarithmic base-10 transformed value ./(c/HoglOCc,-). Using these transformations, several regression equations were computed. The equation with the best residual plot showing a normal distribution and with a coefficient of determination (r>) greater than 0.100
was selected to define the relation between discharge and the concentration of the constituent in question. The r2 value for the regression line in figure 2 is 0.946, which shows high correlation between concentration and discharge; however, the residuals from this equation show little correlation with instantaneous discharge (fig. 3). This relation was used to provide a conditional expected value of concentration for every discharge value.
Equation 1 was checked for normality of residuals. If residuals were normally distributed and the r2 value for equation 1 was greater than 0.100, the residuals were renamed flow-adjusted con centrations and the seasonal Kendall tau test was applied. In cases where the regression relations were poor (rMUOO), the estimated conditional expected concentration was defined as the mean concentration of the data set of the water-chemistry variable. The flow-adjusted concentration for these cases in which the mean concentration was substituted was defined as the actual concentration minus the mean concentration of the data set. Values for r* are reported in percent for the remainder of this report. An r2 value of 0.100 is considered equivalent to 10 percent.
CO COHI cc o111 cc
5.0
2.5
0.0
-2.5
-5.01.25 1.50 1.75 2.0 2.25 2.50 2.75 3.0 3.25
LOGARITHM OF INSTANTANEOUS DISCHARGE, IN CUBIC FEET PER SECOND
Figure 3. Sample residuals from the regression of the logarithms of dissolved-sodium concentrations and instantaneous discharges for samples collected at San Francisco River near Clifton.
8 Summary Statistics and Trend Analysis of Water-Quality Data at Sites In the Glla River Basin

In the second step of the method, which is the application of the seasonal Kendall tau test, all possible pairs of data values within a season are compared. In the seasonal Kendall tau test, the year is divided into 12 segments (monthly). If more than one sample value is collected during the same month of the same year, the first value collected was used in the analysis. Only data pairs that occur during the same month of the year are compared in the analysis, which reduces the problem of seasonality that generally occurs in water- chemistry data. If the later value (in time) is greater, a plus is scored; if the later value is smaller, a minus is scored; and if the values are equal (tied), a zero is scored. The null hypothesis of no significant trend is accepted if the number of pluses is about the same as the number of minuses. Many more pluses than minuses indicate an increasing trend, and conversely, a dominance of minuses indicate a decreasing trend (Smith and others, 1982b).
The seasonal Kendall tau slope estimator, which is an extension of the seasonal Kendall tau test, estimates the magnitude of the trend of the water-chemistry constituent. The estimate is defined by Smith and others (1982b) as the median of the differences (expressed as slopes) of the ordered pairs of data values that are compared in the seasonal Kendall tau test. The difference of each pair of data points is divided by the number of years separating them and recorded in place of a minus or plus. The values of the differences divided by the number of years are ranked, and the median value is accepted as the change per year of the water- chemistry constituent.
The seasonal Kendall tau test was applied to flow-adjusted concentration (FAC) data for the 19 selected constituents and for turbidity at the 13 data-collection sites. The p value was calculated for the seasonal Kendall tau test on the FAC data. The p value is the probability of rejecting the null hypothesis of no trend in the water-chemistry constituent. This report considers a p value of 0.1000 or less to be statistically significant and a rejection of the null hypothesis; hence, a trend in the water-chemistry constituent exists. A p value of greater than 0.1000 would indicate that the null hypothesis was true and that no trend exists in the water-chemistry constituent.
The magnitude of the trend in question is reported as a constant rate of change per year for
computations that did not use a logarithmic transformation of data. When a logarithmic transformation of data is used, the change measured in the raw (retransformed) data is not constant per year but is exponential with time because the change in log units is linear over time (E.J. Gilroy, mathematician, USGS, written commun., 1989). Hence, values for the trend measured by the seasonal Kendall tau test on FAC data where logarithmic transformation of the water-chemistry data were made represent only the amount of change for 1 year. The change is not consistent over the period of data collection of the constituent. The magnitude of the trend of the constituent is not calculated where more than 50 percent "less than" values occur in the data set.
SUMMARY STATISTICS AND TREND ANALYSES
From approximately 110 constituents sampled at each site, 19 constituents and turbidity were selected for trend analysis. The constituents and turbidity were selected by joint agreement of the USGS and ADEQ, and attempts were made to include those for which State of Arizona quality standards existed or were being developed. The constituents included pH, hardness, dissolved solids, dissolved sodium, dissolved sulfate, dissolved chloride, total ammonia plus organic nitrogen, total phosphorus, dissolved arsenic, dissolved barium, total boron, dissolved chromium, suspended copper, total copper, dissolved lead, total lead, total manganese, dissolved zinc, and total organic carbon. The data for these constituents and turbidity were sufficient for statistical and trend analysis.
The chemical constituents and turbidity were compared with Federal quality criteria for water, Federal primary and secondary drinking-water regulations and health advisories, and State of Arizona quality standards for surface water (U.S. Environmental Protection Agency, 1986, 1991, 1993; State of Arizona, 1992). Maximum contaminant levels (MCL's) are the U.S. Environmental Protection Agency (USEPA) maximum permissible levels of contaminants in unfiltered water that is delivered to any user of a
Summary Statistics and Trend Analyses 9
public water system. Secondary maximum contaminant levels (SMCL's) are USEPA nonenforceable guidelines that indicate upper aesthetic limits for certain constituents in unfiltered water. Higher concentrations of the constituents may or may not pose health risks. A drinking-water equivalent level (DWEL) is a lifetime exposure concentration protective of adverse, noncancer health effects, that assumes all of the exposure to a contaminant is from a drinking-water source. The State of Arizona has developed water-quality standards for each stream segment on the basis of the unique use of the water in that segment. Six main uses are identified full body contact, incidental human contact, aquatic and wildlife, agricultural irrigation, agricultural livestock watering, and domestic water sources. The State has identified, on a site-specific basis, waters classified as unique for which standards generally are more stringent and as effluent dominated for which standards are not as stringent.
Summary statistics and trend analysis for each of the water-chemistry constituents and turbidity analyzed are described in this section, and the associated tables are presented at the end of this report. The summary-statistics table for each constituent or property by study site shows the number of samples analyzed; the mean, median, minimum, and maximum values; and the standard deviation and standard error of the mean of each data set. The trend-analysis table shows the type of transformations used in the flow-adjustment procedure, the median value of the data set, the calculated amount of increasing or decreasing concentrations per year, and the statistical significance (p value) of the seasonal Kendall tau test on flow-adjusted data.
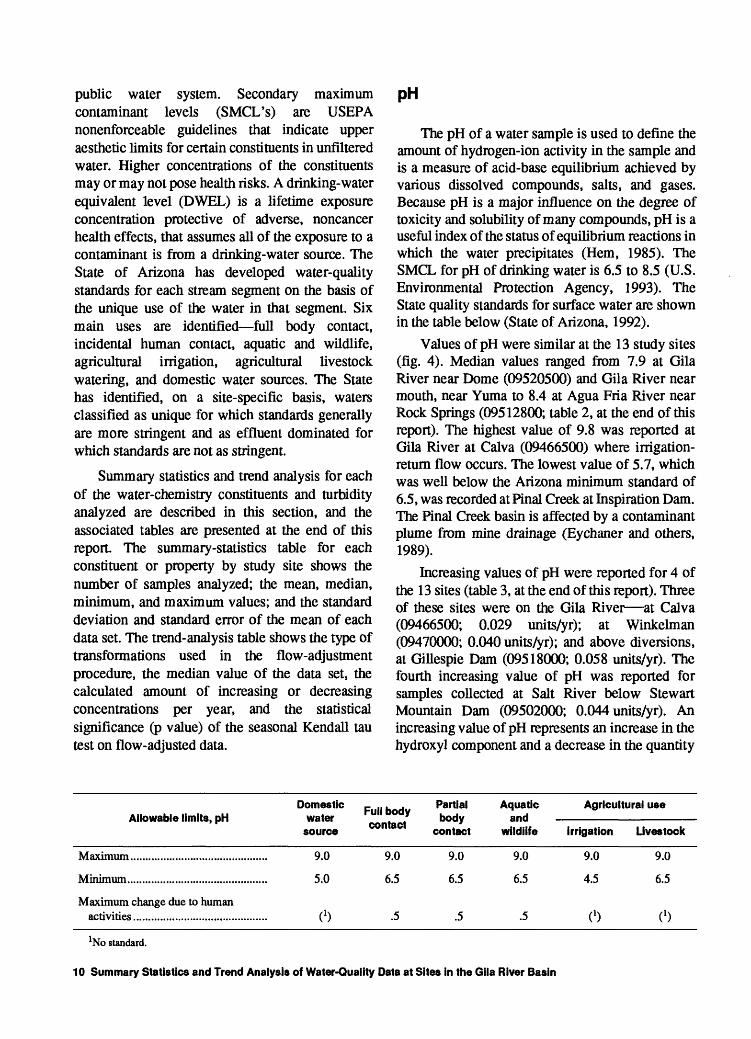
pH
The pH of a water sample is used to define the amount of hydrogen-ion activity in the sample and is a measure of acid-base equilibrium achieved by various dissolved compounds, salts, and gases. Because pH is a major influence on the degree of toxicity and solubility of many compounds, pH is a useful index of the status of equilibrium reactions in which the water precipitates (Hem, 1985). The SMCL for pH of drinking water is 6.5 to 8.5 (U.S. Environmental Protection Agency, 1993). The State quality standards for surface water are shown in the table below (State of Arizona, 1992).
Values of pH were similar at the 13 study sites (fig. 4). Median values ranged from 7.9 at Gila River near Dome (09520500) and Gila River near mouth, near Yuma to 8.4 at Agua Fria River near Rock Springs (09512800; table 2, at the end of this report). The highest value of 9.8 was reported at Gila River at Calva (09466500) where irrigation- return flow occurs. The lowest value of 5.7, which was well below the Arizona minimum standard of 6.5, was recorded at Final Creek at Inspiration Dam. The Final Creek basin is affected by a contaminant plume from mine drainage (Eychaner and others, 1989).
Increasing values of pH were reported for 4 of the 13 sites (table 3, at the end of this report). Three of these sites were on the Gila River at Calva (09466500; 0.029 units/yr); at Winkelman (09470000; 0.040 units/yr); and above diversions, at Gillespie Dam (09518000; 0.058 units/yr). The fourth increasing value of pH was reported for samples collected at Salt River below Stewart Mountain Dam (09502000; 0.044 units/yr). An increasing value of pH represents an increase in the hydroxyl component and a decrease in the quantity
Domestic Allowable limits, pH water
source
Maximum.... .........................
Minimum... ...........................
................. 9.0
................. 5.0
Full body contact
9.0
6.5
Partial body
contact
9.0
6.5
Aquatic and
wildlife
9.0
6.5
Agricultural use
Irrigation
9.0
4.5
Livestock
9.0
6.5
Maximum change due to human activities................................... C 1 ) .5 .5 .5
No standard.
10 Summary Statistics and Trend Analysis of Water-Quality Data at Sites in the Gila River Basin

..113'
EXPLANATION
4700 ABBREVIATED WATER-QUALITY STATION NUMBER Complete number as given in the report is 09470000
TREND IN TOTAL pH
Increasing trend (p is less than 0.1)
No trend (p is greater than 0.1)
Base from U.S. Geological Survey State base map, t974. 1 500,000
25
I I 25 50 KILOMETERS
Nogales
10.5
10.0
XQ.
8.0
7.0
6.0
5.5
.A.
L±
UPPER WHISKER 75 PERCENTILE
MEDIAN
25 PERCENTILE LOWER WHISKER
o EXTREME VALUE
x OUTSIDE VALUE
<¥
Figure 4. pH and direction of temporal trend.
Summary Statistics and Trend Analyses 11

of hydrogen ions; that is, water is becoming more alkaline and less acidic. The increasing values did not exceed the 0.5 pH unit change that is the State standard. Decreasing values of pH were not found. The flow-adjusted procedure was not effective for pH and was used at only 3 of the 13 sites; at these 3 sites, r2 values were less than 13 percent.
Turbidity
Turbidity is suspended matter, which could be natural or human induced. Sources of suspended matter include clay, silt, finely divided organic and inorganic matter, insoluble organic compounds, and microscopic aquatic organisms. All of these contribute to the turbidity of the water, which can be detrimental to aquatic life and interfere with recreational use and aesthetic enjoyment of the water. The Federal criterion for freshwater fish and other aquatic life reads:
"Settleable and suspended solids should not reduce the depth of the compensation point for photosynthetic activity by more than 10 percent from the seasonally established norm for aquatic life"
(U.S. Environmental Protection Agency, 1986). The Federal MCL for safe drinking water is 0.5-1.0 nephelometric turbidity units (NTU; U.S. Environ mental Protection Agency, 1993). The State has a quality standard for turbidity of 50 NTU for rivers, streams, and other flowing waters and 25 NTU for lakes, reservoirs, tanks, and ponds (State of Arizona, 1992).
Turbidity values varied throughout the study area and were affected mostly by reservoirs (table 4, at the end of this report). Median values ranged from 1.0 NTU at Agua Fria River near Rock Springs to 40 NTU at Gila River at Calva. The lowest maximum value of 31 NTU was measured at Agua Fria River below Waddell Dam (09513600), and the highest maximum value of 21,000 NTU was measured at Gila River at Calva. Overall, low turbidity values were found at sites downstream from a dam, indicating that sediments are caught and held upstream from the dam. Four sites Gila River near Redrock, New Mexico (09431500); Gila River at Calva; San Pedro River below Aravaipa Creek, near Mammoth (09473100); and Agua Fria River near Rock Springs had a minimum value of
<0.01 NTU. These sites also had the highest maximum values, which indicate that these streams have a large fluctuation of suspended material, as evident by large interquartile ranges. The State quality standard of 50 NTU was not exceeded by median values at any of the study sites.
An increasing turbidity trend (0.09 NTU/yr) was found in only 1 of the 13 data sets, Agua Fria River near Rock Springs (fig. 5). A decreasing turbidity trend of -0.12 NTU/yr was calculated for Salt River below Stewart Mountain Dam. The flow-adjusted procedure worked well with flow-adjustment equations used at 12 of the 13 sites (table 5, at the end of this report). The r2 values ranged from 14.6 to 70.8. The Salt River near Roosevelt site was the only site where the flow-adjustment procedure was not used (no correlation between discharge and turbidity).
Hardness
Hardness commonly is defined by the presence of calcium and magnesium and is reported as calcium carbonate in this report. Hardness is computed by multiplying the sum of milliequivalents per liter of calcium and magnesium by 50 (Hem, 1985). The degree of hardness has been classified into four categories according to the amount of calcium carbonate (CaCO3) in the water sample (U.S. Environmental Protection Agency, 1986).
Concentration of calciumcarbonate, in milligrams per
literClassification
0-75
75-150
150-300
300 and higher
Soft
Moderately hard
Hard
Very hard
The softer the water is, the less calcium and magnesium present. Limestone is a natural source of hardness. Federal and State drinking-water regulations for hardness have not been established. The State has not established quality standards for hardness in surface waters.
12 Summary Statistics and Trend Analysis of Water-Quality Data at Sites in the Gila River Basin

-.113°
EXPLANATION
4700 ABBREVIATED WATER-QUALITY STATION NUMBER Complete number as given in the report is 09470000
TREND IN TURBIDITY
Increasing trend (p is less tnan 0.1)
Decreasing trend (p is less than 0.1)
No trend (p is greater tnan 0.1)
ARIZONA ^
Base from U.S. Geological Survey State base map, 1974. 1:500,000
I I25 50 KILOMETERS
Negates MEXICO
V)
D CD<r3 i-goch-LU SO_l LU I O. LU Z
D COcr
1,000,000
100,000
10,000
1,000
100
10
0.1
UPPER WHISKER 75 PERCENTILE
MEDIAN
25 PERCENTILE LOWER WHISKER
o EXTREME VALUE
» OUTSIDE VALUE
o
in co co
o o
O
10 co o
cjO10
co c\j
«o m- 10
o co
in oc\l10
t~-o£\l10
Figure 5. Turbidity and direction of temporal trend.
Summary Statistics and Trend Analyses 13

On the basis of median concentrations, water at six sites was very hard, and water at another six sites was hard. Median hardness concentrations ranged from 120 mg/L at Gila River near Redrock to 1,900 mg/L at Final Creek at Inspiration Dam (table 6, at the end of this report). The Final Creek site appears to be influenced by mine drainage; the median value was 60 percent greater than the median value of the other 12 sites. In contrast, the area surrounding the Gila River near Redrock site is relatively undisturbed. Minimum hardness concentrations ranged from 46 mg/L at Gila River near Redrock to 830 mg/L at Final Creek at Inspiration Dam. At Final Creek, a tributary to the Salt River, the minimum value for hardness was 830 mg/L, the median value was 1,900 mg/L, and the maximum value was 2,400 mg/L. The Salt River near Roosevelt site is 0.3 mi downstream from the Final Creek tributary; the minimum value for hardness was 70 mg/L, the median value was 250 mg/L, and the maximum value was 440 mg/L. Boxplots of the data show a significantly different distribution of data for hardness for the Final Creek site than at other sites (fig. 6).
Decreasing trends in hardness concentrations were calculated for 4 of the 13 sites (table 7, at the end of this report). Three of the four sites are on the Gila River at Calva (-0.07 (mg/L)/yr), at Winkel- man (-0.18 (mg/L)/yr), and above diversions, at Gillespie Dam (-0.07 (mg/L)/yr). The fourth site is Agua Fria River near Rock Springs (-0.13(mg/L)/yr). Increasing trends in hardness concentrations were not found for any sites including Final Creek at Inspiration Dam, which had the greatest median concentration (1,900 mg/L). The flow-adjusted equations were used for all sites except the Salt River below Stewart Mountain Dam. Aside from the Agua Fria River below Waddell Dam site (r2 = 21.4), the r2 values ranged from 48.7 to 84.3.
Dissolved Solids
Dissolved solids are inorganic salts and (or) small amounts of organic matter. The most common components of dissolved solids include the inorganic anions carbonates, chlorides, sulfates, and nitrates and the cations sodium, potassium, calcium, and magnesium. Dissolved
solids enter the environment through rock weathering and agricultural and industrial activity. Large concentrations of dissolved solids are undesirable in water because of the possible laxative effect, unpalatable mineral taste, and corrosive effect, hence the necessity for additional treatment for waters used as potable supplies. The SMCL for concentrations of dissolved solids in drinking water is 500 mg/L (U.S. Environmental Protection Agency, 1993). The State of Arizona does not enforce quality standards for dissolved solids in surface water within the study area but requires the monitoring of concentrations of dissolved solids.
Concentrations of dissolved solids varied widely throughout the study area (table 8, at the end of this report). Median concentrations for the main stem of the Gila River ranged from 229 mg/L at the farthest upstream station, Gila River near Redrock, to 2,570 mg/L at Gila River above diversions, at Gillespie Dam. Median concentrations of dissolved solids for tributaries to the Gila River ranged from 298 mg/L at Agua Fria River below Waddell Dam to 3,000 mg/L at Final Creek at Inspiration Dam. Nine of the study sites had median dissolved-solids concentrations greater than 500 mg/L. Dissolved- solids concentrations at sites below reservoirs on the Gila River typically are smaller than those immediately above reservoirs. The minimum dissolved-solids concentration of 68.0 mg/L was recorded at Gila River near Redrock and the maximum value of 5,870 mg/L at Gila River near Dome.
Dissolved-solids concentrations were found to be increasing at one site and decreasing at five sites, and no trend was apparent at the other seven sites (fig. 7). The trend of increasing dissolved-solids concentrations (0.49 (mg/L)/yr) at the Final Creek site had highly significant levels (p<0.0001) and had the largest median concentration (3,000 mg/L; table 9, at the end of this report). The confluence of Final Creek and the Salt River is 0.3 mi upstream from Salt River near Roosevelt; however, dissolved-solids concentrations do not appear to be increasing at Salt River near Roosevelt. Flow in Final Creek accounts for 2 to 3 percent of the flow measured at the Roosevelt site. Two of the five sites where trends of dissolved-solids concentrations were decreasing are upstream from the reservoirs: Gila River at Calva (-0.05 (mg/L)/yr) and Agua Fria
14 Summary Statistics and Trend Anaiysis of Water-Quality Data at Sites in the Gila River Baain

EXPLANATION
4700 ABBREVIATED WATER-QUALITY STATION NUMBER Complete number as given in Ihe report is 09470000
TREND IN HARDNESS
Decreasing Irend (p is less than 0 1)
No trend (p is grealer than O.t)
Base from U.S. Geological Survey State base map, 1974, 1:500,000
25__I
I I 25 50 KILOMETERS
Nogales
ARIZONA j_
MEXICO
100,000
01I- <
Om 10,000rz
V) V,
i -icc ai a
1.000
100
10
^ X
fH
UPPER WHISKER 75 PERCENTILE
MEDIAN
25 PERCENTILE LOWER WHISKER
o EXTREME VALUE
x OUTSIDE VALUE
in toi- -<3-m *
o o co
o>in co o>
o CM0
co co
o inoo oi- CMin in
frua.^-^,.^
oCMin
Figure 6. Hardness and direction of temporal trend.
Summary Statistics and Trend Analyam 15

EXPLANATION
4700 ABBREVIATED WATER-QUALITY STATION NUMBER Complete number as given in Ihe report is 09470000
TREND IN DISSOLVED SOLIDS
Increasing trend (p is less than 0.1)
Decreasing trend (p is less than 0.1)
No trend (p is greater than 0.1)
Base from U.S. Geological Survey State base map, 1974, 1:500,000
25I
}I I
25 50 KILOMETERSNogales
\ ARIZONA I
MEXICO
1 ,(J(J(J
zZ. D.UUU1-
DS CONCENTRA MvIS PER LITER b VI o o8 8
j g 3,000
uj 2 2,000
01 AAA
Q
r>
1 UPPER WHISKER-1- 75 PERCENTILE o EXTREME VALU, MEDIAN
oc pcorFMTil F x OUTSIDE VALUE
LOWER WHISKER
o l~T~1
0 X_ X
x __ x 0
J 8
^ {iiq [dz] ^^=^- i ' "
d=a^ "*" -*- ><
-
X- ipr- *
X
I
Figure 7. Dissolved solids and direction of temporal trend.
16 Summary Statistics snd Trend Analysis of Water-Quality Data at Sites In the Glla River Basin

River near Rock Springs (-0.30 (mg/L)/yr). The other three sites with trends of decreasing dissolved-solids concentrations are at Gila River near Redrock (-0.45 (mg/L)/yr); Gila River at Winkelman (-0.20 (mg/L)/yr); and Gila River above diversions, at Gillespie Dam (-0.08 (mg/L)/yr). Concentrations of dissolved solids correlated with flow-adjusted discharge at 12 of the 13 study sites; Salt River below Stewart Mountain Dam was the only exception. The r2 values ranged from 23.4 to 91.2.
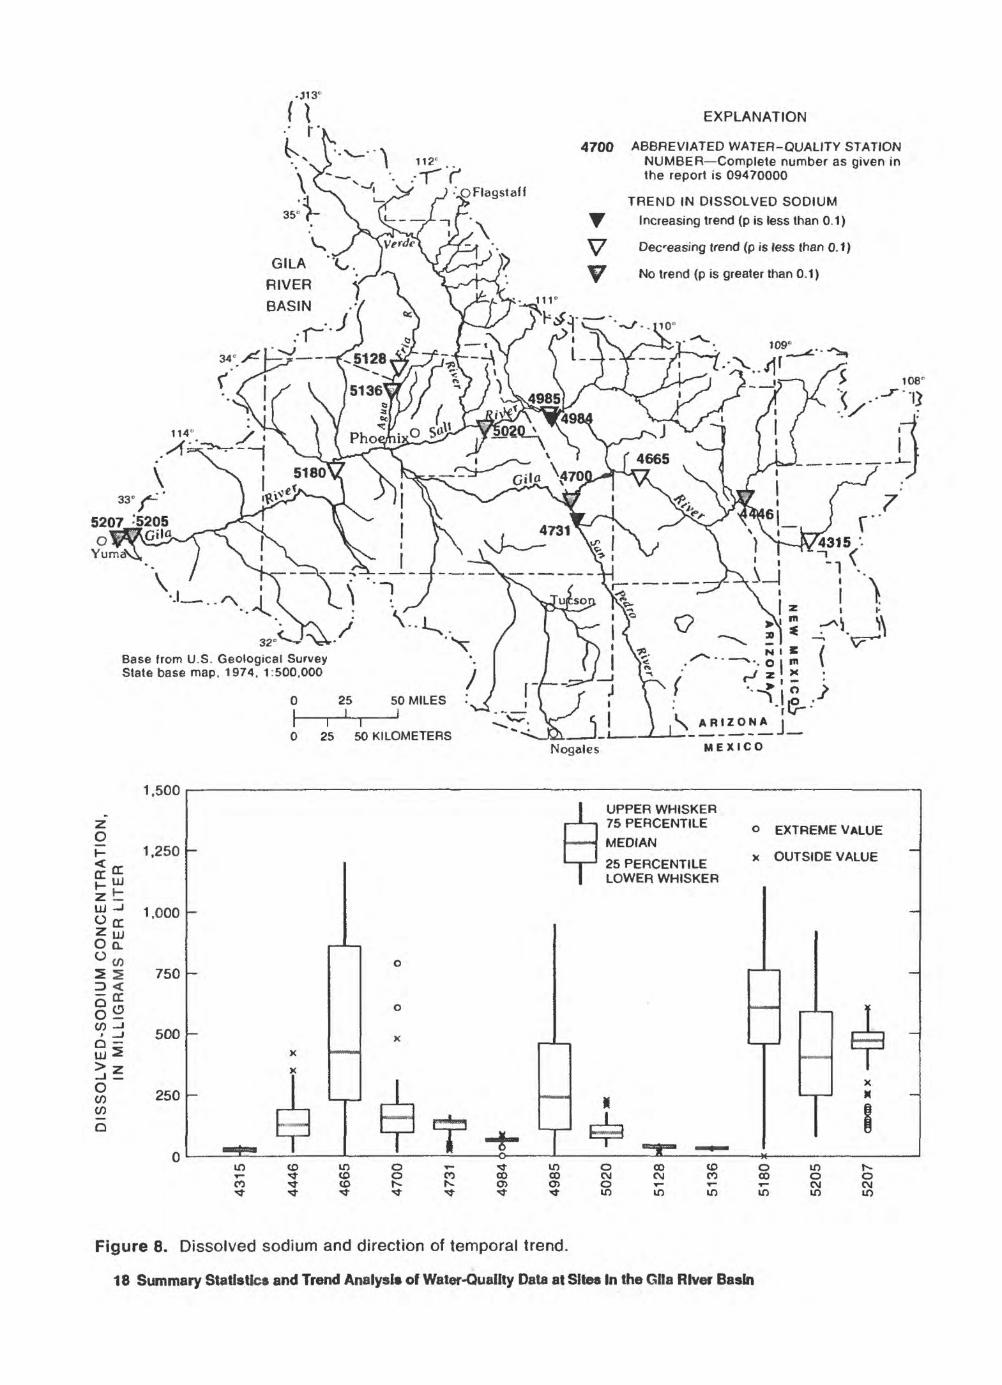
Dissolved Sodium
Dissolved sodium is found in large concentrations throughout the study area. Major sources of dissolved sodium in the Salt River basin are natural springs occurring in the Central highlands (Feth and Hem, 1963). Increased concentrations of dissolved sodium can occur as a result of extensive ground-water pumping (Kister and Hardt, 1966). Irrigation-return flows, which contain large concentrations of dissolved sodium, can contribute significantly to the chemistry of surface waters receiving the return flow. The DWEL for sodium is 20mg/L (unfiltered; U.S. Environmental Protection Agency, 1993). Quality standards have not been established by the State for dissolved sodium in surface waters.
Concentrations of dissolved sodium varied considerably from site to site. The largest interquartile ranges were calculated for Gila River at Calva and the sites downstream from Gillespie Dam and may indicate effects of irrigation-return flow. Minimum concentrations of dissolved sodium ranged from 2.50 mg/L at 4 of the 13 sites to HOmg/L at Gila River near mouth, near Yuma (table 10, at the end of this report). Median concentrations of dissolved sodium ranged from 31.0 mg/L at Gila River near Redrock to 610 mg/L at Gila River above diversions, at Gillespie Dam. The maximum concentration of dissolved sodium, 1,200 mg/L, was recorded at Gila River at Calva.
Increasing trends in concentrations of dissolved sodium were reported for 2 of the 13 study sites, San Pedro River below Aravaipa Creek (0.17(mg/L)/yr) and Final Creek at Inspiration Dam (0.18 (mg/L)/yr, fig. 8). Decreasing trends in concentrations of dissolved sodium were reported
at four sites; three are on the main stem of the Gila River near Redrock (-0.05 (mg/L)/yr), at Calva (-0.04 (mg/L)/yr), and at Gillespie Dam (-0.05 (mg/L)/yr). Decreasing trends in concen trations of dissolved sodium reported at these three main-stem sites could reflect changes in management practices that would reduce the amounts of irrigation-return flows to the Gila River. The fourth site is Agua Fria River near Rock Springs (-0.28 (mg/L)/yr). Streamflow correlated fairly well with concentrations of dissolved sodium. Concentrations of dissolved sodium were flow adjusted at 12 of the 13 sites with r2 values as high as 94.6 at San Francisco River near Clifton (table 11, at the end of this report).
Dissolved Sulfate
Dissolved sulfate is a sulfur compound that enters the environment through atmospheric deposition, mine runoff, industrial waste, and rock weathering. Concentrations exceeding a back ground level could indicate contamination by human activities that could cause water to be unsuitable for public supply. The SMCL for sulfate in drinking water is 250 mg/L (U.S. Environmental Protection Agency, 1993). The State has no quality standard for dissolved sulfate in surface water, however, the State requires agencies to monitor and report sulfate concentrations in drinking-water systems.
Concentrations of dissolved sulfate varied considerably from site to site. A minimum concentration of < 1.0 mg/L was recorded at Gila River near Redrock (table 12, at the end of this report). The largest minimum concentration of dissolved sulfate was 760 mg/L at Final Creek at Inspiration Dam. The median concentration of dissolved sulfate at the Final Creek site (1,800 mg/L) was more than three times larger than the closest median concentration of 555 mg/L at Gila River above diversions, at Gillespie Dam. Boxplots of distributions of concentrations of dissolved sulfate at the study sites show increased levels at the Final Creek site (fig. 9). Additional sites on the main stem of the Gila that had median concentrations of 400 mg/L or more are Gila River above diversions, at Gillespie Dam; Gila River near Dome; and Gila River near mouth, near Yuma. The
Summary Statistics and Trend Analyses 17
EXPLANATION
4700 ABBREVIATED WATER-QUALITY STATION NUMBER Complete number as given in the report is 09470000
TREND IN DISSOLVED SODIUM Increasing trend (p is less than 0.1)
Decreasing trend (p is less than 0.1)
No trend (p is greater than 0.1)
Base from U.S. Geological Survey State base map, 1974. 1:500.000
25I
25 50 KILOMETERSNogales
\ ARIZONA j__
MEXICO
1- <
UJ -J Occ5 uJO Q.
§iop -J
SioCO COd
1,500
1,250
1,000
750
500
250
-
-
_
X
1 1,- to 1
in to * ^"CO f 0- f
u (1(1^
D D Jt
O
O
X
11o o r- f
T -*-T- -a-m oor>- CO * f
u0cT
1 UPPER WHISKER i-* 75 PERCENTILE
MEDIAN
i 25 PERCENTILE| LOWER WHISKER
r 4* i _,_
> o oo to0 CM CM m) O T- *-t in to to
o
X
c0T
u
EXTREME VALUE
OUTSIDE VALUE ~
-
EJ3 -- TX
1 j 1 M -
|
3 to r- 0 O O - CM CM > in in
Figure 8. Dissolved sodium and direction of temporal trend.
18 Summary Statistics and Trend Analysis of Water-Quality Data at Sites In the Glla River Basin

EXPLANATION
4700 ABBREVIATED WATER-QUALITY STATION NUMBER Complete number as given in the report is 09470000
TREND IN DISSOLVED SULFATE
Increasing trend (p is less than 0.1)
Decreasing trend (p is less than 0.1)
No trend (p is greater than 0.1)
108° 8
O Yumrf
Base from U.S. Geological Survey State base map, 1974, 1:500.000
25I
I I 25 50 KILOMETERS
- ..S'r^ I - :^ ll-.-'
k ARIZONA J
MEXICO
z O
rr rri- uiz i-
3,000
2,500
2.000
in w^5 1.500
<? -J 1.000
ui > z
O 500 co o
M
oO
I UPPER WHISKER -1 75PERCENTILE
MEDIAN
25 PERCENTILE LOWER WHISKER
o EXTREME VALUE
x OUTSIDE VALUE
Sin co 01
OCilo in
coC\J
to
in
o co
r iin oCOin
oC\Jin
Figure 9. Dissolved sulfate and direction of temporal trend.
Summary Statistics snd Trend Analyses 19

median concentration of dissolved sulfate at San Pedro River below Aravaipa Creek (350 mg/L) was larger than that at other Gila River tributary sites.
Increasing trends in concentrations of dissolved sulfate were identified at three sites San Pedro River below Aravaipa Creek (1.34 (mg/L)/yr); Final Creek at Inspiration Dam (0.55 (mg/L)/yr); and Gila River near mouth, near Yuma (0.12 (mg/L)/yr; table 13, at the end of this report). Decreasing trends in concentrations of dissolved sulfate were observed at four sites Gila River at Calva (0.05 (mg/L)/yr), Gila River near Redrock (-0.09 (mg/L)/yr), Agua Fria River near Rock Springs (-0.44 (mg/L)/yr), and Gila River above diversions (-0.08 (mg/L)/yr). The median concentration of dissolved sulfate above the SMCL for drinking water was found at 6 of the 13 sites. Concentrations of dissolved sulfate correlate fairly well with streamflow, and flow-adjustment equations were determined for 12 of the 13 study sites. The r2 varied from 10.0 at San Francisco River near Clifton to 80.8 at Gila River near Dome.
Dissolved Chloride
Dissolved chloride is present in all natural waters but generally in small concentrations. The presence of hot springs, however, may add significant quantities of chloride (Feth and Hem, 1963). The Gila River system receives several hundred tons of sodium chloride per day that strongly influences the chemistry of the river water, especially from spring flows into the Salt River. The SMCL for chloride in drinking water is 250 mg/L (U.S. Environmental Protection Agency, 1993). State quality standards for chloride in surface water have not been established.
Considerable variability occurred in distributions of dissolved chloride from site to site (fig. 10). Minimum concentrations of dissolved chloride varied from 2.0 mg/L at Gila River near Redrock to 150 mg/L at Gila River near mouth, near Yuma (table 14, at the end of this report). Median concentrations of dissolved chloride exceeded the Federal standard at 5 of the 13 sites. Two of the five sites, Gila River at Calva (590 mg/L) and Salt River near Roosevelt (390 mg/L), are at the head of reservoirs. The reservoirs act as a buffer by reducing the mean concentration through tributary
inflows; these tributaries have smaller concen trations of dissolved chloride. A 67-percent reduc tion of mean concentrations of dissolved chloride occurred from Gila River at Calva to Gila River at Winkelman. The Gila River at Winkelman site is downstream from San Carlos Dam; the Gila River at Calva site is upstream from the San Carlos Reservoir. The maximum concentration of dis solved chloride (2,200 mg/L) was recorded at Gila River at Calva.
Increasing trends in concentrations of dissolved chloride were calculated at 2 of the 13 sites, Pinal Creek at Inspiration Dam (1.76 (mg/L)/yr) and Salt River near Roosevelt (0.03 (mg/L)/yr, table 15, at the end of this report). The only site where the median concentration was larger than the Federal standard and concentrations were increasing was Salt River near Roosevelt (390 mg/L). The presence of significant increasing concentrations of 1.76 (mg/L)/yr at Pinal Creek at Inspiration Dam, a few miles upstream from Salt River near Roosevelt, indicates that water from Pinal Creek may be a major contributor to the increasing concentrations of dissolved chloride at Salt River near Roosevelt. Decreasing trends were calculated at four sites. Three sites were on the main stem of the Gila River near Redrock (-0.07 (mg/L)/yr); at Calva (-0.07 (mg/L)/yr); and above diversions, at GiUespie Dam (-0.05 (mg/L)/yr). The fourth site was Agua Fria River near Rock Springs (-0.36 (mg/L)/yr). Flow-adjustment procedures were used for 12 of the 13 sites. The r2 values ranged from 14.1 to 88.2.
Total Ammonia plus Organic Nitrogen
Total ammonia plus organic nitrogen (as nitrogen), a vital source of nutrition for plant and animal life, is converted by soil bacteria into nitrite and nitrate. Large concentrations of ammonia plus organic nitrogen cause algal blooms in water bodies, which in turn, cause taste and odor problems in potable water supplies. Large concentrations of ammonia plus organic nitrogen in a stream can indicate the presence of contamination from agricultural and urban runoff. No Federal drinking-water regulations exist for total ammonia plus organic nitrogen. The State has quality standards for total nitrogen in many surface-water
20 Summary Statistics and Trend Analysis of Water-Quality Data at Sites In the Gila River Basin

-.113°
EXPLANATION
4700 ABBREVIATED WATER-QUALITY STATION NUMBER Complete number as given in the report is 09470000
TREND IN DISSOLVED CHLORIDE
Increasing trend (p is less than 0.1)
Decreasing trend (p is less than 0.1)
No trend (p is greater than 0.1)
Base from U.S. Geological Survey State base map, 1974. 1:500.000
I I 25 50 KILOMETERS
Nogales
ARIZONA J
MEXICO
100,000
Oh-
C ,,- 10,000
UJ o -1
|£ LOGO
uj co Q 5
<tr tr
05
OCO CO
0
100
10
i _i
\ x S
o oXftX
in CD in oT- *} ID Oco «* ID r- «« «« *« *«
\ UPPER WHISKERr 1 i 75 PERCENTILE o £x
MEDIAN'-] ' 25 PERCENTILE * OL
| LOWER WHISKER
,| |
JLi ' i i
T l ' ,-j--^ xI L««-. ajj
I '
«- <* in o co to o co co co CM CM m corj- TJ- -<j in in in in
TREME VALUE'
TSIDE VALUE
;
x -fcj=. ;
I
-
-
in t^
in in
Figure 10. Dissolved chloride and direction of temporal trend.
Summary Statistics and Trend Analyses 21
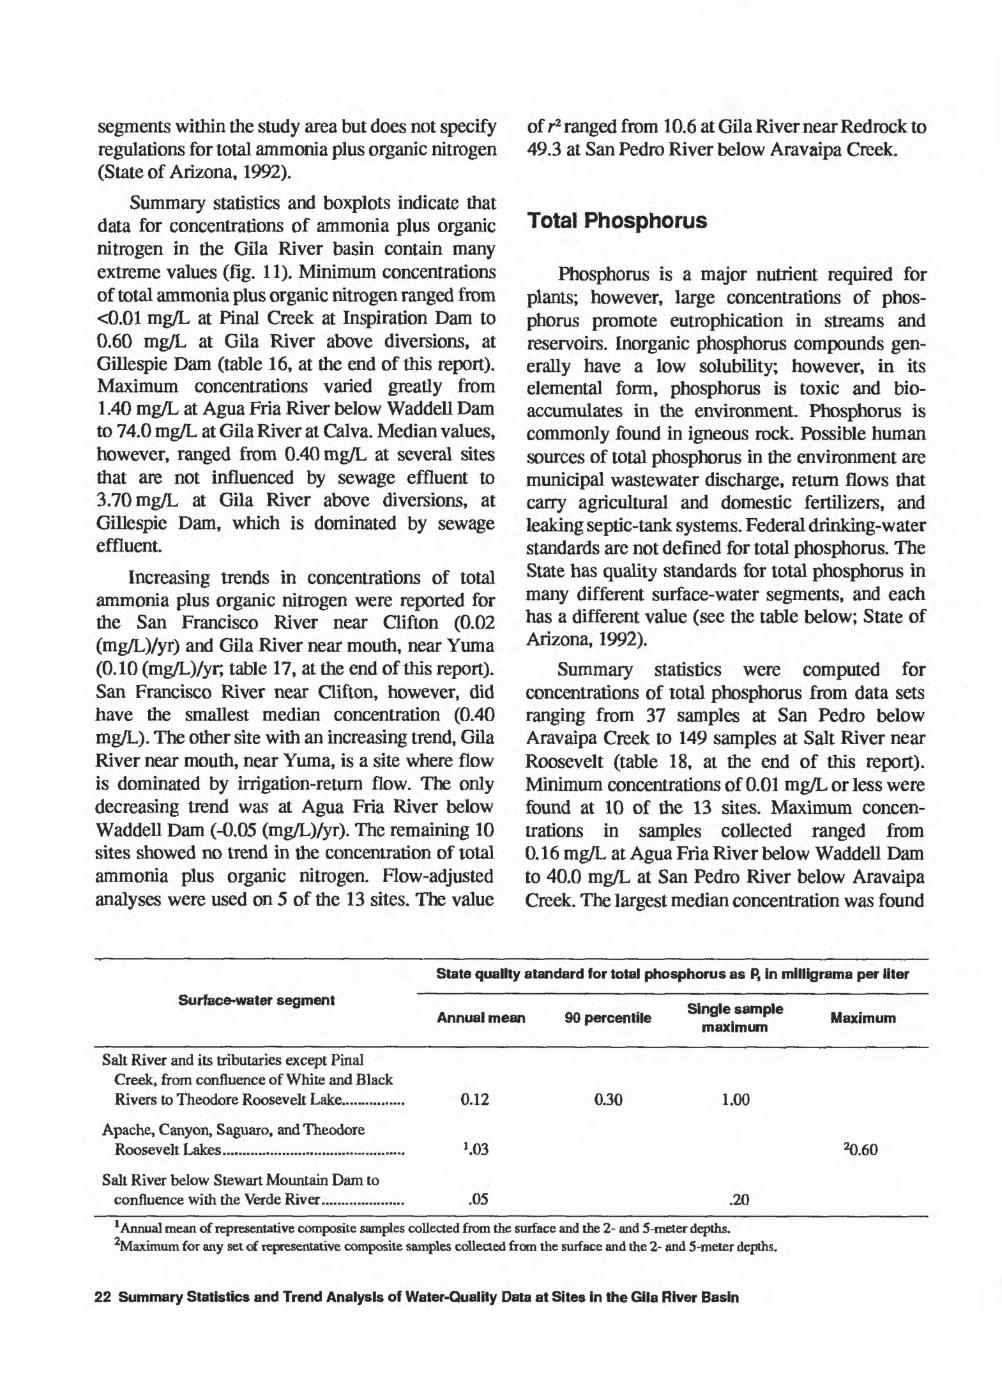
segments within the study area but does not specify regulations for total ammonia plus organic nitrogen (State of Arizona, 1992).
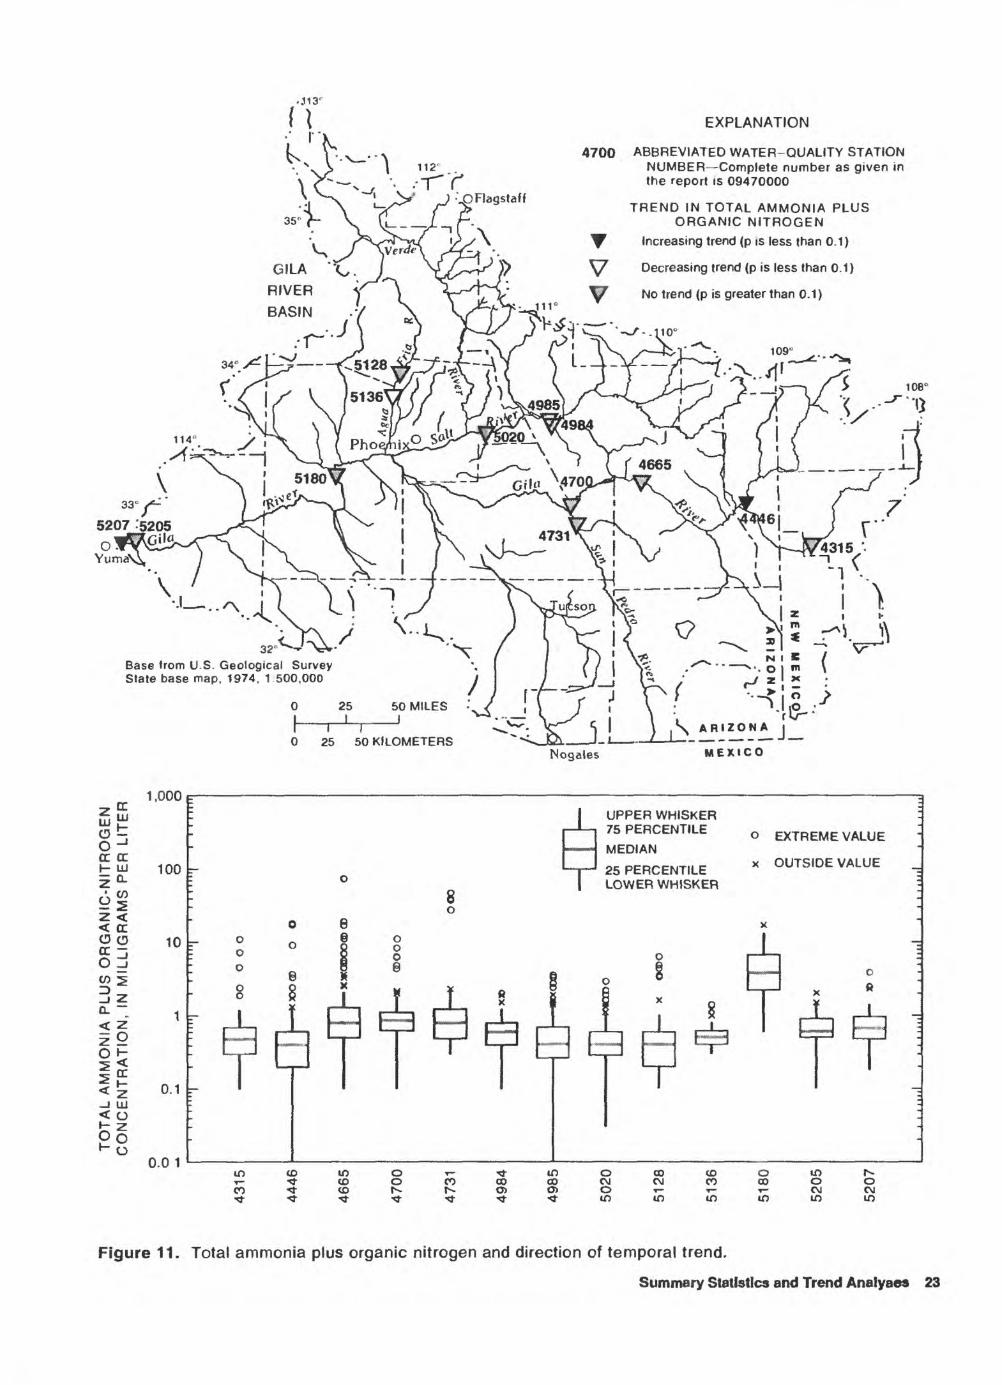
Summary statistics and boxplots indicate that data for concentrations of ammonia plus organic nitrogen in the Gila River basin contain many extreme values (fig. 11). Minimum concentrations of total ammonia plus organic nitrogen ranged from <0.01 mg/L at final Creek at Inspiration Dam to 0.60 mg/L at Gila River above diversions, at Gillespie Dam (table 16, at the end of this report). Maximum concentrations varied greatly from 1.40 mg/L at Agua Fria River below Waddell Dam to 74.0 mg/L at Gila River at Calva. Median values, however, ranged from 0.40 mg/L at several sites that are not influenced by sewage effluent to 3.70 mg/L at Gila River above diversions, at Gillespie Dam, which is dominated by sewage effluent.
Increasing trends in concentrations of total ammonia plus organic nitrogen were reported for the San Francisco River near Clifton (0.02 (mg/L)/yr) and Gila River near mouth, near Yuma (0.10 (mg/L)/yr, table 17, at the end of this report). San Francisco River near Clifton, however, did have the smallest median concentration (0.40 mg/L). The other site with an increasing trend, Gila River near mouth, near Yuma, is a site where flow is dominated by irrigation-return flow. The only decreasing trend was at Agua Fria River below Waddell Dam (-0.05 (mg/L)/yr). The remaining 10 sites showed no trend in the concentration of total ammonia plus organic nitrogen. Flow-adjusted analyses were used on 5 of the 13 sites. The value
of r2 ranged from 10.6 at Gila River near Redrock to 49.3 at San Pedro River below Aravaipa Creek.
Total Phosphorus
Phosphorus is a major nutrient required for plants; however, large concentrations of phos phorus promote eutrophication in streams and reservoirs. Inorganic phosphorus compounds gen erally have a low solubility; however, in its elemental form, phosphorus is toxic and bio- accumulates in the environment. Phosphorus is commonly found in igneous rock. Possible human sources of total phosphorus in the environment are municipal wastewater discharge, return flows that carry agricultural and domestic fertilizers, and leaking septic-tank systems. Federal drinking-water standards are not defined for total phosphorus. The State has quality standards for total phosphorus in many different surface-water segments, and each has a different value (see the table below; State of Arizona, 1992).
Summary statistics were computed for concentrations of total phosphorus from data sets ranging from 37 samples at San Pedro below Aravaipa Creek to 149 samples at Salt River near Roosevelt (table 18, at the end of this report). Minimum concentrations of 0.01 mg/L or less were found at 10 of the 13 sites. Maximum concen trations in samples collected ranged from 0.16 mg/L at Agua Fria River below Waddell Dam to 40.0 mg/L at San Pedro River below Aravaipa Creek. The largest median concentration was found
State quality standard for total phosphorus as P, in milligrams per liter
Surface-water segmentAnnual mean 90 percentile
Single sample maximum Maximum
Salt River and its tributaries except Final Creek, from confluence of White and Black Rivers to Theodore Roosevelt Lake...............
Apache, Canyon, Saguaro, and Theodore Roosevelt Lakes......................................
Salt River below Stewart Mountain Dam to confluence with the Verde River.................
0.12
.05
0.30 1.00
.20
20.60
'Annual mean of representative composite samples collected from the surface and the 2- and 5-meter depths. 2Maximum for any set of representative composite samples collected from the surface and the 2- and 5-meter depths.
22 Summary Statistics and Trend Analysis of Water-Quality Data at Sites in the Gila River Basin
TO
TA
L A
MM
ON
IA P
LUS
OR
GA
NIC
-NIT
RO
GE
N
CO
NC
EN
TR
AT
ION
, IN
MIL
LIG
RA
MS
PE
R L
ITE
R
3 f D
g.
f
Q) 3 3
o S'
c IA O co Q)
3 o'
CO CD D Q)
Q.
Q. CD o 6'
3 CD 3 -a
o CD
Q.
p
bo
o
4315
4446
4665
47
00
4731
4984
4985
5020
5128
5136
5180
5205
5207
oo
o o
o
rno
o
X
KO
BO
OO
D C
D
OD
OO
O
OO
O
OH
:ODD
>
W
K3D
O
-
x tM
DO
I
m
£° f[ (. f-* o
<3 o S 3 a
S' w
1 3 01 m 1
p
< S n easing
trend
^ ^ less
than p ~
+ 5"
o m iasing trend
( o
w less
than p ~~~
H 33 m 2 D
IN
TOTA
ORGANIC z
1" ^ MMON
IA rROG
EN
TJ (
C CO
? (D
.b I >
OJ
2O
J C
-D EVIATE
D W
, MBER
Cor
r repo
rt is
09 ^ ^i
o o
o
o
1?
a>
m R-QUALI
te
numbe -
H
a>
-<
^.55
< >
5 =!
f. 0
3 2
m
x T3 O Z
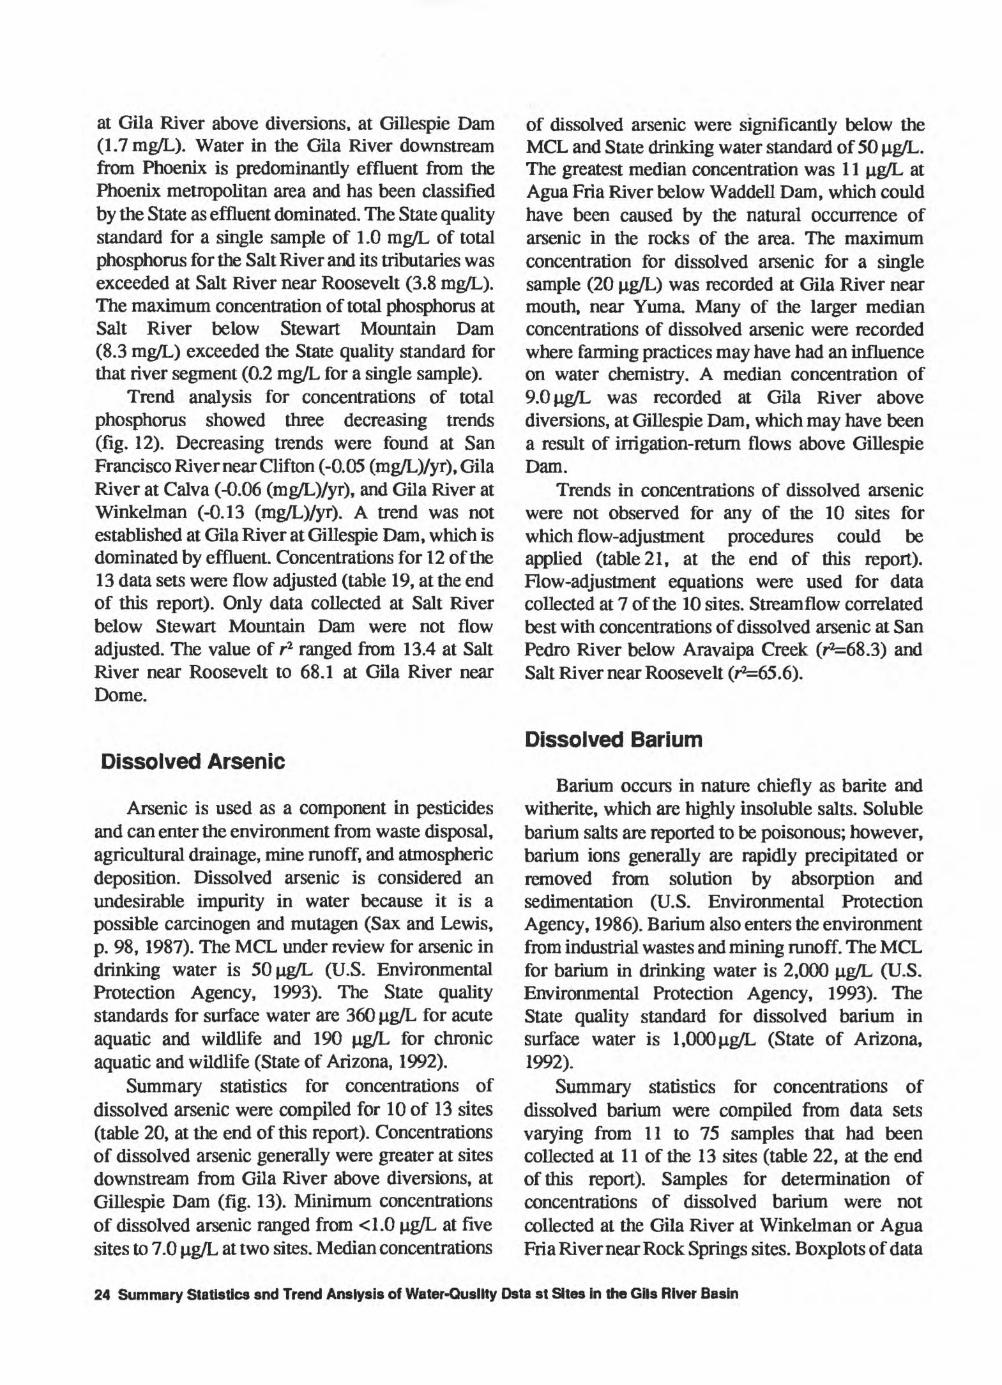
at Gila River above diversions, at Gillespie Dam (1.7 mg/L). Water in the Gila River downstream from Phoenix is predominantly effluent from the Phoenix metropolitan area and has been classified by the State as effluent dominated. The State quality standard for a single sample of 1.0 mg/L of total phosphorus for the Salt River and its tributaries was exceeded at Salt River near Roosevelt (3.8 mg/L). The maximum concentration of total phosphorus at Salt River below Stewart Mountain Dam (8.3 mg/L) exceeded the State quality standard for that river segment (0.2 mg/L for a single sample).
Trend analysis for concentrations of total phosphorus showed three decreasing trends (fig. 12). Decreasing trends were found at San Francisco River near Clifton (-0.05 (mg/L)/yr), Gila River at Calva (-0.06 (mg/L)/yr), and Gila River at Winkelman (-0.13 (mg/L)/yr). A trend was not established at Gila River at Gillespie Dam, which is dominated by effluent. Concentrations for 12 of the 13 data sets were flow adjusted (table 19, at the end of this report). Only data collected at Salt River below Stewart Mountain Dam were not flow adjusted. The value of r2 ranged from 13.4 at Salt River near Roosevelt to 68.1 at Gila River near Dome.
Dissolved Arsenic
Arsenic is used as a component in pesticides and can enter the environment from waste disposal, agricultural drainage, mine runoff, and atmospheric deposition. Dissolved arsenic is considered an undesirable impurity in water because it is a possible carcinogen and mutagen (Sax and Lewis, p. 98, 1987). The MCL under review for arsenic in drinking water is 50ug/L (U.S. Environmental Protection Agency, 1993). The State quality standards for surface water are 360 ug/L for acute aquatic and wildlife and 190 ug/L for chronic aquatic and wildlife (State of Arizona, 1992).
Summary statistics for concentrations of dissolved arsenic were compiled for 10 of 13 sites (table 20, at the end of this report). Concentrations of dissolved arsenic generally were greater at sites downstream from Gila River above diversions, at Gillespie Dam (fig. 13). Minimum concentrations of dissolved arsenic ranged from <1.0 ug/L at five sites to 7.0 ug/L at two sites. Median concentrations
of dissolved arsenic were significantly below the MCL and State drinking water standard of 50 ug/L. The greatest median concentration was 11 ug/L at Agua Fria River below Waddell Dam, which could have been caused by the natural occurrence of arsenic in the rocks of the area. The maximum concentration for dissolved arsenic for a single sample (20 ug/L) was recorded at Gila River near mouth, near Yuma. Many of the larger median concentrations of dissolved arsenic were recorded where farming practices may have had an influence on water chemistry. A median concentration of 9.0 ug/L was recorded at Gila River above diversions, at Gillespie Dam, which may have been a result of irrigation-return flows above Gillespie Dam.
Trends in concentrations of dissolved arsenic were not observed for any of the 10 sites for which flow-adjustment procedures could be applied (table 21, at the end of this report). Flow-adjustment equations were used for data collected at 7 of the 10 sites. Streamflow correlated best with concentrations of dissolved arsenic at San Pedro River below Aravaipa Creek (rMSS.3) and Salt River near Roosevelt (r2=65.6).
Dissolved Barium
Barium occurs in nature chiefly as barite and witherite, which are highly insoluble salts. Soluble barium salts are reported to be poisonous; however, barium ions generally are rapidly precipitated or removed from solution by absorption and sedimentation (U.S. Environmental Protection Agency, 1986). Barium also enters the environment from industrial wastes and mining runoff. The MCL for barium in drinking water is 2,000 ug/L (U.S. Environmental Protection Agency, 1993). The State quality standard for dissolved barium in surface water is 1,000 ug/L (State of Arizona, 1992).
Summary statistics for concentrations of dissolved barium were compiled from data sets varying from 11 to 75 samples that had been collected at 11 of the 13 sites (table 22, at the end of this report). Samples for determination of concentrations of dissolved barium were not collected at the Gila River at Winkelman or Agua Fria River near Rock Springs sites. Boxplots of data
24 Summary Statistics snd Trend Anslysis of Water-Qusllty Osta st Sites in the Gils River Basin

..113"
EXPLANATION
4700 ABBREVIATED WATER-QUALITY STATION NUMBER Complete number as given in Ihe report is 09470000
TREND IN TOTAL PHOSPHORUS
Decreasing trend (p is less than 0.1)
No trend (p is greater than 0.1)
108°
Base from U.S. Geological Survey State base map, 1974, 1:500.000
25_I
0 25 50 KILOMETERSNogales
\ ARIZONA j
MEXICO
z.
tr rrI- UJ z. i-
II
SQ-
1,000
100
10
0.1
0.01
0.001LO i- P3
(O <) JO tO
Oo oo
O)
LOcoO)
OcoO LO
co CM
: 1 UPPER WHISKER : L- 1 75PERCENTILE ^
MEDIAN
f -r- 25PERCENTILE
: 1 LOWER WHISKE
: 8
° ° Ro o
? l
_
T TT
o EXTREME VALUE
x OUTSIDE VALUE
R o o o
00 ° 0
° a ° ° 1
p EQ x 8 ' [-'° 00 0r ' s i
i \ " f D otn Hn H-i J J_ JL
r-L, B B rnr M E T |1 1 1
o
g § :
0 I -
K | _
-
1 1o co o
CO 10
t- oCO 10
Figure 12. Total phosphorus and direction of temporal trend.
Summary Statistics and Trend Analyaes 25

4700
EXPLANATION
ABBREVIATED WATER-QUALITY STATION NUMBER Complete number as given in the report is 09470000
TREND IN DISSOLVED ARSENIC No trend (p is greater than 0.1)
108°
32
Base from U.S. Geological Survey State base map. 1974. V500.000
25
z 01-
J CONCENTR/ IS PER LITER
-» i\:Ul C
Z <
w o 1f1rr o 10< rrisLU 2> _,o- 5cocoQ
0
0 25 50 MILES -'^ 1 / ' \ " '&-
1 H-l ' O~- \C ^ 1 \ l\ ARIZONA 1 0 25 50 KILOMETERS "-<J2i. l-l 1 ' - J
Nogales MEXICO
1 UPPER WHISKER -L 75 PERCENTILE EXTREME VALUE
WXHMWI MEDIANocpFRrFNTIIF x OUTSIDE VALUE
| ^5 rbHL/blM 1 ILb O ~ | LOWER WHISKER
X
X
1 1
1I 0
| ] l """""" x |
1 o x «-<> .
lOCDlO^-Tl-lOOCD OlOh- T-^CDCOCOCOC\JCO COOOco-^cor-oooT- T-CVJCM ^t^^^^ ^iom toioio
Figure 13. Dissolved arsenic and direction of temporal trend.
26 Summary Statistics and Trend Analysis of Water-Quality Data at Sites In the Glla River Basin

for dissolved barium show that the two largest interquartile ranges were for data collected at the Gila River near Dome and at Gila River near mouth, near Yuma (fig. 14). Minimum concentrations of dissolved barium ranged from less than 1.0 ng/L at Gila River above diversions, at Gillespie Dam to 60.0 pg/L at Gila River near mouth, near Yuma. Median concentrations of dissolved barium ranged from 20.0 pg/L at Gila River near Redrock to 100 Hg/L at the three downstream sites on the Gila River above diversions, at Gillespie Dam; near Dome; and near mouth, near Yuma. Maximum concentrations of dissolved barium ranged from 50.0 p.g/L at Gila River near Redrock to 600 pg/L at Gila River at Calva. All these concentrations are well below the State quality standard of 1,000 pg/L (State of Arizona, 1992).
Decreasing trends in concentrations of dissolved barium were found for two sites, Salt River near Roosevelt (-0.20 (ug/L)/yr) and Gila River above diversions, at Gillespie Dam (-3.57 (ug/L)/yr, table 23, at the end of this report). Increasing trends were not found at significant levels forthe rest of the study sites. Of the nine sites where the flow-adjustment procedure was used, the most effective result was for the data set for San Francisco River near Clifton
Total Boron
Boron, when not found in its elemental form in nature, generally occurs as a sodium- or calcium-berate salt from volcanic gases and geothermals (Hem, 1985). Total boron can enter the environment through sewage and industrial wastes. Small amounts of boron are essential to plant growth; however, greater amounts in soil and irrigation water are harmful and are toxic, especially to orange and lemon trees where concentrations of 1 mg/L (1,000 pg/L) can be toxic (Hem, 1985). The Federal criterion for long-term irrigation on sensitive crops is 750 ng/L (U.S. Environmental Protection Agency, 1991). The State quality standard for total boron is 1,000 ng/L for surface water used for irrigation of agricultural lands (State of Arizona, 1992).
Summary statistics for concentrations of total boron were compiled from data collected at 12 of the 13 sites (table 24, at the end of this report).
Boron analyses were not available at Gila River near Dome. Boxplots of the data show that concentrations of total boron were larger at Gila River at Calva; at Gila River above diversions, at Gillespie Dam; and Gila River near mouth, near Yuma than at other study sites (fig. 15). Minimum concentrations of total boron ranged from less than 10.0 pg/L at Agua Fria River near Rock Springs to 270 \ig/L at Gila River near mouth, near Yuma. Median concentrations of total boron ranged from 40 pg/L at Gila River near Redrock to 2,000 ng/L at Gila River above diversions, at Gillespie Dam. The Federal criterion and State standard were exceeded for samples collected at several sites. The median concentration at Gillespie Dam (2,000 M-g/L) is above the Federal criterion (750 pg/L) and State quality standard for surface water (1,000 pg/L). The maximum concentration of total boron was recorded at Gila River above diversions, at Gillespie Dam (22,000 pg/L).
Decreasing trends in concentrations of total boron were determined for Gila River at Winkelman (-0.30 (ug/L)/yr) and Agua Fria River near Rock Springs (-0.29 (ng/L)/yr, table 25, at the end of this report). Median total boron concen trations were within State standards at the two sites where decreasing trends were noted. Trends were not found in total boron concentrations at the remaining 13 study sites including Gila River at Gillespie Dam, which had the largest median concentration (2,000 ng/L). Flow-adjustment pro cedures were not applied to data sets for Gila River near Redrock, San Pedro below Aravaipa Creek, Phial Creek at Inspiration Dam, and Salt River below Stewart Mountain Dam because an insufficient number of samples were collected for trend analysis. Of the eight sites where flow-adjustment procedures were used, the r2 values ranged from 10.5 to 87.6.
Dissolved Chromium
Dissolved chromium species analyzed in this study included a combination of trivalent chromium and hexavalent chromium. Concentrations of trivalent chromium generally are small (less than 1 ng/L). Concentrations of chromium in natural waters that nave not been affected by waste disposal commonly are less than 10 ng/L (Hem, 1985).
Summary Statistics snd Trend Analyses 27

EXPLANATION
5205 ABBREVIATED WATER-QUALITY STATION NUMBER Complete number as given in the report is 09520500
TREND IN DISSOLVED BARIUM
Decreasing trend (p is less than 0.1)
No trend (p is greater than 0.1)
Yum
Base from U.S. Geological Survey State base map, 1974. 1:500.000
I I 25 50 KILOMETERS
Nogales
IUU.UUU
2 O
JM CONCENTRA AMS PER LITER
-» c o "c0 Co c
' LL
<0 10°CD CC
DISSOLVEC IN MIC
* o
= 1 UPPER WHISKER : -L 75PERCENTILE o EXTREME VALUE
MEDIAN
25 PERCENTILE * OUTSIDE VALUE
I I LOWER WHISKER
0 0
K ' S 9
- ill i. J K X 1 1\t I vu"l ^ r1*^ 1 ^ ' i tt"'-"|' "i | J |
r T
mcDiO'- ^t mocoomi ^CDCO OOOOCMCOOOO CO^tCDI^O)O>O'-'-C\J ^" ^" ^ ^" ^" ^" lO lO lO lO
:
-
x :
:-
-
O COm
Figure 14. Dissolved barium and direction of temporal trend.
28 Summary Statistics and Trend Analysis of Water-Ouallty Data at Sites In the Glla River Basin

V) i CO 8 a 3 a i
c 3 ^ cn CT
O 3 3 B)
3
O.
O 3 o
o Q.
TO
TA
L B
OR
ON
C
ON
CE
NT
RA
TIO
N,
IN
MIC
RO
GR
AM
S
PE
R
LIT
ER
o
o
oo
o o
b 8
4446
4665
4700
4731
4984
4985
5128
5136
5180
5207
0
0}

Dissolved chromium, primarily hexavalent chromium, generally enters the environment from industrial and mining activities. Studies by Robertson (1975, 1991), however, show that hexavalent chromium of natural origin is present in ground water in the central and western parts of the study area in concentrations as large as 200 ng/L. Hexavalent chromium can be toxic to aquatic and human life, causing ulcers and dermatitis from prolonged contact (U.S. Environmental Protection Agency, 1986). The drinking-water MCL (100ng/L) is for total chromium, not dissolved chromium. The State quality standard for total chromium in surface water is 100 \ig/L (State of Arizona, 1992).
Summary statistics for concentrations of dissolved chromium were calculated using the logarithmic-probability regression methods at all sites from data sets containing more than 50-percent censored data (table 26, at the end of this report). Boxplots of the data show that the range of concentrations of dissolved chromium at Gila River near mouth, near Yuma was the largest and most widespread of the study sites (fig. 16). Data were not collected at Agua Fria River near Rock Springs. Maximum concentrations for dissolved chromium ranged from 2.0 ng/L at San Francisco River near Clifton to 20.0 ng/L at Gila River above diversions, at Gillespie Dam and Gila River near mouth, near Yuma. Minimum concentrations for all sites where dissolved chromium was collected were less than 1.0 ng/L. The median concentration ranged from 0.02 ng/L at Gila River near Redrock to 3.98 ng/L at Gila River near mouth, near Yuma.
Increasing trends in concentrations of dissolved chromium were reported for 3 of the 10 sites Final Creek at Inspiration Dam; Salt River below Stewart Mountain Dam; and Gila River above diversions, at Gillespie Dam. Trends were not found for dissolved chromium for other sites. Data at three sites Gila River at Winkelman, Agua Fria River near Rock Springs, and Gila River near Dome were insufficient to perform the tests. Flow-adjusted equations were used for Final Creek data (^21.5; table 27, at the end of this report). The data at the remaining nine sites were adjusted using mean concentrations.
Suspended and Total Copper
Copper is essential for plant and animal metabolism; however, in excess amounts, copper can be toxic to fish and harmful to irrigated crops (U.S. Environmental Protection Agency, 1986). Excess amounts of copper can be detected in the taste of water. Copper enters the environment through rock weathering, acid-mine drainage, the dissolution of copper from water pipes and plumbing fixtures, algal control in reservoirs, and pesticide sprays (Hem, 1985). The SMCL for copper in drinking water is 1,000 \ig/L (U.S. Environmental Protection Agency, 1993). The State quality standard for dissolved copper for domestic water sources is 1,000 ng/L (State of Arizona, 1992).
Determinations of summary statistics for suspended copper (table 28, at the end of this report) and total copper (table 30) were done on different size data sets. More data were available for analysis of total copper than for suspended copper. Thirty-one samples the largest number of samples collected at a site were collected at Gila River at Calva for determination of concentrations of suspended copper. Conversely, more than 100 total copper concentrations were available for analysis from each of four study sites.
Data for suspended copper were analyzed for summary statistics at 11 study sites. Data were not collected at Agua Fria River near Rock Springs and Gila River near Dome. Maximum concentrations for suspended copper ranged from 16.0 \ig/L at San Pedro River below Aravaipa Creek to 1,500 ng/L at Gila River at Calva. Minimum concentrations ranged from less than 1 ng/L at six sites to 40.0 ng/L at Final Creek at Inspiration Dam. Median concentrations ranged from 3.0 ug/L at Salt River below Stewart Mountain Dam to 76.0 ng/L at Final Creek at Inspiration Dam. Gila River at Calva had a maximum concentration of 1,500 ng/L but a median value of only 20.0 ng/L, which indicates few instances of extremely large concentrations of suspended copper.
Trend analyses for suspended copper were performed at only six study sites because data for suspended copper were insufficient at the other seven sites (fig. 17). Flow-adjusted equations were used to adjust the data for suspended copper for three sites Red Rock, Calva, and Gillespie Dam
30 Summary Statistics and Trend Analysis of Water-Quality Data at Sites in the Gila River Baain
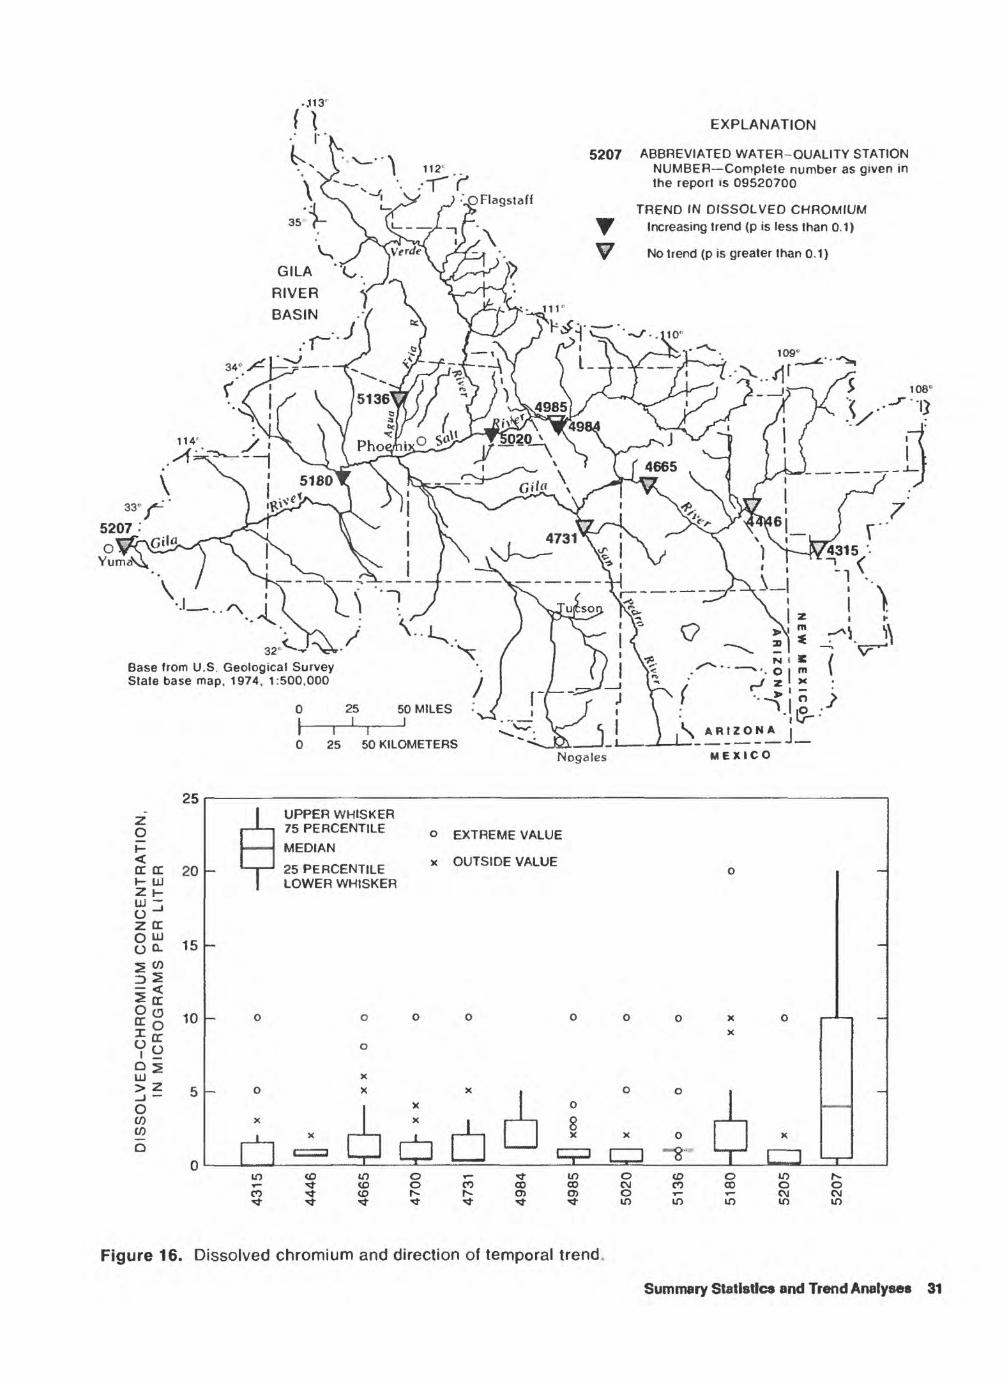
EXPLANATION
5207 ABBREVIATED WATER-DUALITY STATION NUMBER Complete number as given in the report is 09520700
TREND IN DISSOLVED CHROMIUM Increasing trend (p is less than 01)
No trend (p is greater than 0.1)
\' J ..x\ A
Base from U State base rr
to
ZO1-
OMIUM CONCENTF GRAMS PER LITEF
* -* N
3 Ol C
ILVED-CHR IN MICROOl C
LJininO
0
S2x^/ v-x / \\\i * -?i:-rvS. Geological Survey '. I / / I ^& ^--- *. o ! m ( ap, 1974, 1:500,000 I 1 ~-~J J lX / ,_/' z ' x :
0 25 50 MILES '.^ \\ f , \ ^.liO ;
1 1 ' 1 ' -O~- V Si .\ARtZONAi 0 25 50 KILOMETERS ~~<JQy 1-1 ' 1 - - J
Nogales MEXICO
1 UPPER WHISKER-J- 75 PERCENTILE o EXTREME VALUE MEDIAN
p x OUTSIDE VALUE
1 LOWER WHISKER
o
x O X X I Do
1 1 51 x I ' I 1 1 ' I X x o x
| 1 3 LpJ 1 \ 1 Cf_l I I -"8" [ ] -T-
tocDioo^-Ti-mocDoior^ ^-Tj-coococococijcocooo cO'*cDr^r^O)O)O'-^-Cijc\jTJ-^^^^^^LOLOLOmiO
Figure 16. Dissolved chromium and direction of temporal trend
Summary Statistics and Trend Analyses 31

O13 1
EXPLANATION
5207 ABBREVIATED WATER-QUALITY STATION NUMBER Complele number as given in the report is 09520700
TREND IN SUSPENDED COPPER
No trend (p is greater than 0 1)
Base from U.S. Geological Survey State base map, 1974, 1:500,000
25I
I I 25 50 KILOMETERS
100,000
O
< jj. 10,000
s?LU -I
O a 1 -°°0
.UJ<s- ^a
o o
100
10
in co
in CD CD
o oN.
I UPPER WHISKER - 75 PERCENTILE
MEDIAN
25 PERCENTILE LOWER WHISKER
o EXTREME VALUE
x OUTSIDE VALUE
coO)
in coo
oCOo to
CDco
oco
L-T
o04in
Figure 17. Suspended copper and direction of temporal trend.
32 Summary Statistics snd Trend Analysis of Wster-Ouallty Data at Sites In the Glla River Basin

(table 29, at end of this report). The r2 values for these three sites were 10.7, 39.5, and 64.3. Trends were not detected in data for suspended copper collected at any of the six stations.
Summary statistics for total copper were reported for 12 of the 13 study sites (table 30, at the end of this report). Data for total copper were not collected at the Gila River near Dome site. Maximum concentrations for the 12 sites ranged from 22.0 ug/L at Salt River below Stewart Mountain Dam to 10,000 ug/L at San Francisco River near Clifton. Minimum concentrations of total copper ranged from less than 1 ug/L at eight sites to 4.0 ug/L at Agua Fria River below Waddell Dam. Although the highest maximum value for total copper was 10,000 ug/L, the median values ranged from 6.0 ug/L at Salt River below Stewart Mountain Dam to 95.0 ug/L at Final Creek at Inspiration Dam. Boxplots of the data show that there are several outliers for most of the stations (fig. 18). Another indication of the variability in total copper at the study sites is the variation between mean value and median concentrations. Median concentrations ranged from 6.0 to 95.0 ug/L; mean concentrations ranged from 7.86 to 269 ug/L.
Three of the study sites Final Creek at Inspiration Dam (-0.04 (ug/L)/yr), Agua Fria below Waddell Dam (-0.63 (ug/L)/yr), and Gila River near mouth, near Yuma (-1.25 (ug/L)/yr) have trends of decreasing concentrations of total copper (table 31, at the end of this report). Increasing trends of total copper were not found at the remaining study sites. Flow-adjusted equations were used for 7 of 12 sites to calculate temporal trends. The r2 values ranged from 14.6 to 48.5 for these sites.
Dissolved and Total Lead
Concentrations of dissolved and total lead were selected for analysis because of their toxic effect on aquatic and human life. Major sources of lead from metropolitan areas are water pipes, paint, and leaded gasoline. Rural sources included atmospheric depositions from sources that may lie outside the study area as well as industrial sources within the area. The principal dissolved inorganic forms of lead are free ion, hydroxide complexes, and the carbonate-ion and sulfate-ion pairs (Hem,
1985). The Federal maximum contaminant level goal (MCLG) for drinking water, which is nonenforceable, is Omg/L (U.S. Environmental Protection Agency, 1993). The Federal MCLG for dissolved lead (at tap) is Omg/L (U.S. Environmental Protection Agency, 1993). The State quality standard for total lead in surface water is 50 ug/L (State of Arizona, 1992).
Summary statistics for concentrations of dissolved lead were compiled from data sets that ranged in size from 25 to 98 samples and were collected at 11 of the 13 sites (table 32, at the end of this report). Lack of data for dissolved lead from Agua Fria River near Rock Springs and at Gila River near Dome precluded computation of summary statistics. Concentrations of dissolved lead show fairly consistent distributions of data throughout the basin. Minimum concentrations of dissolved lead were at the detection limit of 1.0 ug/L for all stations. Median values ranged from 0.66 ug/L at Gila River above diversions, at Gillespie Dam to 2.0 ug/L at Gila River near mouth, near Yuma. The largest maximum concentration of dissolved lead of 74.0 ug/L was recorded at Gila River near mouth, near Yuma Large concentrations of dissolved lead also were found at Gila River at Calva (70.0 ug/L) and at Salt River below Stewart Mountain Dam (60.0 ug/L).
Decreasing trends in concentrations of dissolved lead were found at 6 of 11 sites; two on the main stem of the Gila River at Calva and above diversions, at Gillespie Dam; and two on the Salt River Roosevelt and Stewart Mountain Dam (fig. 19). The other two decreasing trends were measured at San Francisco River near Clifton and Final Creek at Inspiration Dam. Increasing trends in concentrations of dissolved lead were not found; in five instances, no trends were determined. Slope-estimate values were not reported because of the large amount of censored data except for Gila River at Calva (r^^.O). Flow-adjustment procedures were not used except for Gila River at Calva (table 33, at the end of this report) because of the lack of correlation between discharge and concentrations of dissolved lead at the individual sites.
Summary statistics for concentrations of total lead were compiled from data sets of 14 to 121 samples that had been collected at 12 of the 13 sites
Summary Statistics and Trend Analyses 33

(Q cT
OT
AL C
OP
PE
R C
ON
CE
NT
RA
TIO
N,
IN
MIC
RO
GR
AM
S
PE
R
LIT
ER
e?
"*
3 * T3
T3 01
Q.
(D
O O (D 3 T3
O 3
£
CD
« s.
c
4315
4446
4700
4731
49
84
4985
50
20
51
28
51
36
51
80
52
07
> -A
-I
O
, M
|
|
-J^
' A
____________ I
^
-i
o
"o-
o
o
c-»
b
b
b
§
o
o
o
o
§
o
o
o
o
c1 "'""
' "
"'"1
' '"""
1
' '""
"1
' '"""
o o
"T-a
Kxm
DO
o
o
o
O"1
m
01
-n
§ -
0 D
T3
t)
m r
n ^
mm
3)
3)
5
33 3
)
5m
S
| iz
zl
wi
dw
3^ i-
r- ^
m
m
mm
»
O
O
O
0
3)
3)
X O
00
O
m
c
x i
H i
w
3)
m
? Ii m
c
: «
._.v
i^L
-^?
V*"1
"N o a. is
greater than p ^
^^^ D 0)
0 S DD
(n 5'
to trend
(p
is
less Co p
-I
33 m z D Z 4 OTAL
COPPE
33
to o o is
09470000
-g § ABBRE
NUM CD < 55 ED WATER-OJ
Complete nu !> fl>
C
DJ
-<
m
x T) O 2
_ o

EXPLANATION
4700 ABBREVIATED WATER-QUALITY STATION NUMBER Complete number as given in the report is 09470000
TREND IN DISSOLVED LEAD
Decreasing trend (p is less than 0.1)
No trend (p is greater than 0.1)
Base from U S State base ma|
1,000
z"
O
OLVED-LEAD CONCENTRAT N MICROGRAMS PER LITER
2 8
U) U)
D
0.1
> / I M ' V*>Geological Survey '. Iff \« '^ ' ' ~
J, 1974, 1:500,000 J / / I"
/ rr~~ ~1 V^ T0 25 50 MILES '-^ ' 1 / ' \ ' I L- 1 ' \^7 \~r-^ C 1 \ i. ADIT
' "^- ' ?v 1 VX^ARIZ 0 25 50 KILOMETERS ~^_lgi, I-J L 1 --
-^ ~ * {
^. I .>ONA j
Nogales MEXICO
: 1 UPPER WHISKER ; i J i 75PERCENTILE o
MEDIAN
-I 25PERCENTILE X
1 LOWER WHISKER
i ° o; o
o e o o
0 0 0 0^ oo 8: ox x |
x | x . . 8 ,
: r^r^r^J^ArlnrLirLir
: T"1
EXTREME VALUE :
OUTSIDE VALUE
o :
o o
o
I ° r-L 'L II HMMW
:" "
-
in«3inOT-^mo«3oinh~T-^«3OCOCOCOCVICOCOOOcot<ot--t--a)rooT-T-c\ic\i ^^ ^ ^ ^ ^ ^ ininininin
Figure 19. Dissolved lead and direction of temporal trend.
Summary Statistics and Trend Analyses 35

(table 34, at the end of this report). Summary statistics were not calculated at Gila River near Dome because samples were not collected for the determination of total lead concentrations. Median concentrations of total lead ranged from 2.0 ug/L at Agua Fria River near Rock Springs to 8.0 ug/L at Gila River at Calva and Gila River at Winkelman. The maximum concentrations of total lead ranged from 60.0 ug/L at Final Creek at Inspiration Dam to 930 ug/L at Agua Fria River near Rock Springs. Boxplots of the data show that the concentrations appear to be larger on the eastern part of the Gila River compared with the concentrations on the Salt River, Agua Fria River, and western part of the Gila River excluding Gila River near mouth, near Yuma (fig. 20).
Of the 12 sites where trends were calculated, increasing trends in concentrations of total lead were calculated for 2 sites Gila River near Redrock (0.19 (ug/L)/yr) and Gila River near mouth, near Yuma (0.41 (ug/L)/yr; table 35, at the end of this report). Decreasing trends in concentrations of total lead were reported at Pinal Creek at Inspiration Dam (-0.06 (ug/L)/yr). Flow-adjustment procedures were used for 9 of the 12 sites, and the r2 values ranged from 13.9 to 62.6.
Total Manganese
Manganese, a metallic element, is essential for plants and animals. Manganese is typically associated with iron compounds naturally occurring in the Earth's crust in various salts and minerals and has low solubility in water. Manganese is an undesirable impurity in large concentrations in water because it has a tendency to deposit black oxide stains. In large doses, manganese can cause liver damage (U.S. Environmental Protection Agency, 1986). Total manganese was selected for analysis because of the abnormally large concentrations found in samples collected from Pinal Creek in a separate study (Eychaner and others, 1989). The SMCL for manganese in drinking water is 50 ug/L (U.S. Environmental Protection Agency, 1993). The State quality standard is 10,000 ug/L for total manganese in waters used for agricultural irrigation.
Summary statistics were computed from data sets ranging from 8 samples at San Pedro River
below Aravaipa Creek to 116 samples at Gila River at Calva (table 36, at the end of this report). Data for total manganese were not collected at Gila River near Dome. Maximum concentrations ranged from 170 ug/L at Salt River below Stewart Mountain Dam to 41,000 ug/L at Pinal Creek at Inspiration Dam. The Pinal Creek site, influenced by a mine-drainage contaminant plume (Eychaner and others, 1989), recorded the highest minimum value (680 ug/L). Boxplots of data for total manganese show that concentrations of total manganese at the Pinal Creek site are significantly larger than those at other study sites (fig. 21). Minimum concentrations ranged from 8.0 ug/L at Gila River near Redrock and at Gila River at Calva to 680 ug/L at Pinal Creek at Inspiration Dam. Median concentrations ranged from 30.0 ug/L at Salt River below Stewart Mountain Dam and at Agua Fria River near Rock Springs to 21,500 ug/L at Pinal Creek at Inspiration Dam. The second highest median value is 730 ug/L at Gila River near mouth, near Yuma. The maximum concentrations for Gila River near Redrock (11,000 ng/L), Gila River at Calva (11,000 ug/L), Gila River at Winkelman (11,000 ug/L), San Pedro River below Aravaipa Creek (13,000 ug/L), Pinal Creek at Inspiration Dam (41,000 ug/L), and Agua Fria River near Rock Springs (35,000 ug/L) exceed the State water-quality standards (10,000 ug/L). The only median concentration for total manganese that exceeds the State standard is for Pinal Creek at Inspiration Dam (21,000 ug/L).
Trend analyses indicated that total manganese concentrations are increasing at three sites Pinal Creek at Inspiration Dam, Salt River near Roosevelt, and Agua Fria River near Rock Springs (table 37, at the end of this report). Total manganese concentrations are decreasing at five sites San Francisco River near Clifton; Gila River at Calva; Salt River below Stewart Mountain Dam; Gila River above diversions, at Gillespie Dam; and Gila River near mouth, near Yuma. Trend tests were not done for San Pedro River below Aravaipa Creek because of insufficient data. The slope estimate at Salt River near Roosevelt (35.0 (ug/L)/yr) was much larger than those at Pinal Creek at Inspiration Dam (0.70 (ug/L)/yr) and Agua Fria River near Rock Springs (0.01 (ug/L)/yr). At nine of the 11
36 Summary Statistics and Trend Analysia of Water-Quality Data at Sites in the Gila River Basin

EXPLANATION
4700 ABBREVIATED WATER-QUALITY STATION NUMBER Complete number as given in the report is 09470000
TREND IN TOTAL LEAD
y Increasing trend (p is less than 0.1)
^ Decreasing trend (p is less than 0.1)
^ No trend (pis greater than 0.1)
108".V""»
Base from U.S. Geological Survey State base map. 1974, 1.500.000
25I
I I I0 25 50 KILOMETERS
Nogales
t- crZ LULU Q-
D CD< OLU EC
100,000
10,000
1,000
100
10
0.1
: | UPPER WHISKER :-
~
1 7p- ppn^TMT
MEDIAN
ILEEXTREME VALUE
OUTSIDE VALUE ~
| | LOWER WHISKER '-_
-- o ° o: 00°
x ,, *
: T;
o
Bx |
-- T"fir1]
lOtOlOO^-^-lOO '- ^ IDOCOCOCOCM CO ^" tO r*"^ 1*"* Ol Ol ^3
o
80 o °
! i
1 1
8
' r1!
co to oCO P3 00
in in 10
-:
':,
|=-
:
^
;
0 COin
Figure 20. Total lead and direction of temporal trend.
Summary Statistics and Trend Analyses 37

J13°
4700
EXPLANATION
ABBREVIATED WATER-QUALITY STATION NUMBER Complete number as given in the report is 09470000
TREND IN TOTAL MANGANESE
Increasing trend (p is less than 0.1)
Decreasing trend (p is less than 0.1)
No trend (p is greater than 0.1)
1 De-
Base from U.S. Geological Survey State base map, 1974, 1:500,000
25I I
25 50 KILOMETERSNegates
i.\ ARIZONA j
MEXICO
IU,UUU,UUU
5 1 ,000,000
^JESE CONCENTRA GRAMS PER LITEF P I
<oo ocz o< ^ 100
_, z
H 10oH
1
! I
-
: \r-
_ 0 J 0 0 [5
{ M _. 1e r C rn
1 1 t ^" |-,-.-i-i,---.--,i, , . HI L tp acz T tp^ ^
m co m o « ^~T- T CD O CO CO CO T CD f- Is- O
UPPER WHISKER -- 75PERCENTILE Q EXTREME VALUE I
- MEDIAN 25PERCENTILE X OUTSIDE VALUE ^£-j rt-n^^t-iN i i^t.
LOWER WHISKER I
o I
o _
8 !
f 8 c=i=l ^| i r*rn =§ I 1 1
Q X «*»*«« II.H^.M..^ 1
1 1 1 -;
h~H 1 :
in o co CD o Is-00 CJ (N CO CO OO O -r- -r- -r- (Mf m m m m m
Figure 21. Total manganese and direction of temporal trend.
38 Summary Statistics and Trend Analysla of Water-Quality Data at Sites In the Glla River Basin

sites, flow-adjusted procedures were used that resulted in lvalues ranging from 10.9 to 74.5.
Dissolved Zinc
Dissolved zinc is essential for plant and animal metabolism; however, large concentrations can be toxic to aquatic life. The SMCL for zinc in drinking water is 5,000 ng/L (U.S. Environmental Protection Agency, 1993). The State quality standard for total zinc is 5,000 ng/L in water used as domestic-water sources (State of Arizona, 1992).
Summary statistics were computed for 12 of the 13 study sites (table 38, at the end of this report). Data for dissolved zinc were not collected at AguaFria River near Rock Springs. Maximum concentrations of dissolved zinc ranged from 40.0 ng/L at Agua Fria River below Waddell Dam to 1,280 n.g/L at Gila River near Redrock. Of the 12 sites, 10 had a minimum concentration below the analytical reporting limit. The median concen tration of dissolved zinc ranged from 8.0 ng/L at two sites to 20.0 ng/L at two sites. Boxplots show that the data for Gila River at Calva; Gila River near mouth, near Yuma; and Gila River near Redrock (maximum 1,280 ng/L) contain several extreme values (fig. 22); however, median concentrations were well within the State quality standard for surface water.
Decreasing trends in concentrations of dissolved zinc were found at three sites San Francisco River near Clifton (-0.53 (ug/L)/yr); San Pedro River below Aravaipa Creek (-2.50 (ng/L)/yr); and Salt River near Roosevelt (-1.67 (jig/L)/yr, table 39, at the end of this report). Analyses for trends in concentrations of dissolved zinc at Agua Fria River near Rock Springs were not done because samples for dissolved zinc were not collected. Trends in concentrations of dissolved zinc were not found at the remaining study sites. Flow-adjusted equations were used for 6 of the 12 data sets, and r2 values ranged from 10.3 to 15.3
Total Organic Carbon
The measurement of total organic-carbon concentrations allows an approximate determina
tion of the total concentration of organic material in aqueous systems (Hem, 1985). Organic matter can have significant effects on the chemical properties of aqueous systems. Water containing certain organic solutes can be unsuitable for use by human, aquatic, and other life forms. Federal and State regulations for total organic-carbon concentrations have not been established.
Summary statistics for concentrations of total organic carbon were compiled for 10 of the 13 sites (table 40, at the end of this report). Minimum concentrations of total organic carbon ranged from 0.50 mg/L at San Francisco River near Clifton to 5.40 mg/L at Gila River above diversions, atGillespie Dam (excluding the one sample collected at Gila River near Dome). Median total organic-carbon concentrations ranged from 2.40 mg/L at San Francisco River near Clifton to 11.0 mg/L at Gila River above diversions, at Gillespie Dam. The maximum total organic-carbon concentration (300 mg/L) was recorded at Gila River at Calva. More values above 50 mg/L occurred at sites in the upper half of the basin than in the lower half (fig. 23). Statistics were not compiled at Agua Fria River near Rock Springs and Agua Fria River below Waddell Dam because total organic-carbon data were not collected. Only one sample was collected at Gila River near Dome; therefore, summary statistics were not computed for this site.
Trend analyses were not performed for 5 of the 13 sites because of insufficient data. Total organic- carbon concentrations were found to be increasing at a rate of 0.26 (mg/L)/yr at Salt River below Stewart Mountain Dam. The remaining seven sites showed no trend (table 41, at the end of this report). Streamflow is poorly correlated with total organic- carbon concentrations at all the study sites; the r2 values ranged from 12.5 to 51.1. The flow- adjustment procedure was effective only at Gila River near mouth, near Yuma (r^S 1.1).
SUMMARY
Water-resources managers are concerned with effectively evaluating and understanding short- and long-term trends of water quality in streams in the Gila River basin. The Gila River basin is a valuable source of water for agricultural, industrial, and
Summary 39

CO i CO S 3° a. 8 a a
o. i =* f a I5 6 5
c a S3 a w I a*
30 03 a 3
<Q C 3 ro
ro v>
0_ CD
Q.
SO
0.
tt)
O
DIS
SO
LV
ED
-ZIN
C C
ON
CE
NT
RA
TIO
N,
IN
MIC
RO
GR
AM
S
PE
R L
ITE
R
O
0
o O
0
o
o
o
o
4315
4446
4665
4700
4731
4984
4985
5020
5136
5180
5205
52
07
«
oo
o
o
WK
CO
O
O
-D-- x
ao
o
m
m 5
2 5 ^ !I
!
co
i d
co
7; r
- r"
:*
m m
m
m
O C
H co O
m c
m
m
x 3) m
m
ro
1
^ 2 O M CD Q.
~o vi
10 S"" ?
< o <D O s CU (0 3
Q.
vi
H
33 m 2 O 2 O co
co O m
<D -^ <D
TD
O ^ O
<0
<k
^l o o
2 ^
C ~
nS
mCD
<
m >
jD
-41
niO
d 11o
ST
m
OJ
-<"
co
±0
u
2
m
x -o

(O
IO u o IB (Q IB O 0> n> Q. g. 5
o o" (D 3 o S_ -^ (D
Q.
TO
TA
L O
RG
AN
IC C
AR
BO
N,
IN M
ILLIG
RA
MS
P
ER
L
ITE
R
O §
O
4315
4446
4665
47
00
4731
49
84
49
85
5020
5180
5205
5207
-QFx
o
oo
XX
O
B
O
O
II
0<
" m
<
"TS
T3
O
TO T
Om
E
c 55
1
-Oh
3)2 iz m "
i3D
3) 3
) O
< si mm 33
o
O
m
O 3D
CO
O m < r*
m
3)
m m < m
o OJ to CD Q. 5"
w
w 0) o ^
3) m z H O r~
O 3) O O o 3)
CD
O Z
TO
<5 T3
O W O
1
0 ^ ~sl
o
o
o 0
z
c CD m
3) o o 3 T
J <l> (0 c 3 CJ
(D HI
VI
to O)
J»
CD CD
3D
m -i m 0 | -i m 3
) 1 O C H CO -1 5
m
x TJ 2
H O

municipal uses throughout central Arizona and western New Mexico. In Arizona, the population increase from 499,261 in 1940 to 3,605,700 in 1988 (Valley National Bank, 1988) has resulted in increased demands on surface-water and ground-water resources. Resource managers and planners are concerned that the quality of water is degrading with time as a result of stresses on the hydrologic system.
Nonparametric trend-analysis techniques were used to assess temporal changes in water-chemistry data collected at 13 sites in the Gila River basin. A nonparametric technique, the seasonal Kendall tau test for flow-adjusted data, was selected as the method used for trend analysis. Water-chemistry data collected at several sites in the Gila River basin, mostly by the ADEQ and the USGS, were available for trend analysis. This report describes temporal and areal variability of water-chemistry constituents collected from sampling sites at 13 streamflow-gaging stations in the Gila River basin.
From approximately 110 constituents sampled at each site, 19 constituents and turbidity were selected for trend analysis: pH, hardness, dissolved solids, dissolved sodium, dissolved sulfate, dissolved chloride, total ammonia plus organic nitrogen, total phosphorus, dissolved arsenic, dissolved barium, total boron, dissolved chromium, suspended copper, total copper, dissolved lead, total lead, total manganese, dissolved zinc, and total organic carbon. Six of the 13 gaging stations are on the main stem of the Gila River. The remaining seven stations are on major tributaries to the Gila River one on the San Francisco River, one on the San Pedro River, two on the Agua Fria River, two on the Salt River, and one on Final Creek, which is tributary to the Salt River.
Increasing trends generally were found in three areas in the basin at Final Creek above Inspiration Dam, at sites above reservoirs, and at sites on the main stem of the Gila River from Gillespie Dam to the mouth. Median concentrations of hardness, dissolved solids, dissolved sodium, dissolved sulfate, and dissolved chloride were larger at sites above reservoirs especially at Gila River at Calva and Salt River near Roosevelt than at downstream sites. Median concentrations of hardness, dissolved solids, dissolved sulfate, suspended and total copper, and total manganese were greater at Final Creek than at other sites. The sites at and
downstream from Gillespie Dam seem to be affected by irrigation-return flow. Median concentrations of hardness, dissolved solids, dissolved sodium, dissolved chloride, dissolved arsenic, dissolved barium, and total boron were greatest at these sites. In addition, the Gila River at Gillespie Dam site, which is affected by sewage effluent, had the greatest median concentrations of ammonia plus organic nitrogen and total phosphorus. The median concentration of dissolved chromium was greatest at the Gila River near the mouth, near Yuma.
Increasing trends in concentrations were found for 24 data sets at the 13 study sites. Final Creek at Inspiration Dam had the largest number (six) of increasing trends: dissolved solids, dissolved sodium, dissolved sulfate, dissolved chloride, dissolved chromium, and total manganese. Gila River near mouth, near Yuma had three increasing trends: dissolved sulfate, total ammonia plus organic nitrogen, and total lead. The largest number of increasing trends measured for a constituent was for pH (four), dissolved sulfate (three), dissolved chromium (three), and total manganese (three).
Decreasing trends were found for 49 data sets at the 13 study sites. Gila River at Calva and Gila River above diversions, at Gillespie Dam (eight each) had the most decreasing trends for individual sites. Data for Gila River at Calva indicated decreasing concentrations of hardness, dissolved solids, dissolved sodium, dissolved sulfate, dissolved chloride, total phosphorus, dissolved lead, and total manganese. Data for Gila River above diversions, at Gillespie Dam indicate decreasing concentrations of hardness, dissolved solids, dissolved sodium, dissolved sulfate, dissolved chloride, dissolved barium, dissolved lead, and total manganese. The largest number of decreasing trends measured for a constituent was six for dissolved lead. The next largest number of decreasing trends for a constituent was for dissolved solids and total manganese (five each). Decreasing trends were found in concentrations of hardness, dissolved sodium, and dissolved chloride at four of the study sites.
For the 19 selected constituents and turbidity, decreasing trends outnumbered increasing trends by almost two to one. Possible explanations for the increasing trends are that Final Creek is influenced by mine drainage, Gila River near Calva is
42 Summary Statistics and Trend Analyals of Water-Quality Data at SItea In the Glla River Basin

influenced by irrigation-return flows, and the reach of the Gila River from Gillespie Dam to the mouth, near Yuma is influenced by irrigation-return flows, and effluent from near Gillespie Dam is influenced by municipal wastewater-treatment plants. Increasing trends in concentrations were not found for constituents whose median con centrations were larger than the quality standards for surface waters set by the State of Arizona.
SELECTED REFERENCES
Alley, W.M., 1987, A note on stagewise regression: The American Statistician, May 1987, v. 41, no. 2, p. 132-134.
___1988, Using exogenous variables in testing for nontoxic trends in hydrologic time series: Water Resources Research, v. 24, no. 11, p. 1955-1961.
Arizona Atomic Energy Commission, 1977, Rules and regulations, Title 12: Phoenix, State of Arizona report, Supplement 77-3, p. 1-133.
Arizona Bureau of Mines, 1969, Mineral and water resources of Arizona: Tucson, University of Arizona Bulletin 180,638 p.
Arizona Department of Health Services, 1976, Water quality in Arizona: Phoenix, Arizona Department of Health Services report, 191 p.
___1986, Water quality assessment for water years 1984 and 1985: Phoenix, Arizona Department of Health Services report, 98 p.
Baldys, Stanley, III, 1990, Trend analysis of selected water-quality constituents in the Verde River basin, central Arizona: U.S. Geological Survey Water-Resources Investigations Report 90-4128, 55 p.
Brown, J.G., and Pool, D.R., 1989, Hydrogeology of the western part of the Salt River Valley area, Maricopa County, Arizona: U.S. Geological Survey Water-Resources Investigations Report 88-4202, 5 sheets.
Buell, G.R., and Grams, S.C., 1985, The hydrologic bench-mark program A standard to evaluate time-series trends in selected water-quality constituents for streams in Georgia: U.S. Geological Survey Water-Resources Investigations Report 8^4318,36 p.
Eychaner, J.H., Rehmann, M.R., and Brown, J.G., 1989, Chemical, geologic, and hydrologic data from the study of acidic contamination in the Miami Wash-Pinal Creek area, Arizona, water years 1984-87: U.S. Geological Survey Open-File Report 89-410,105 p.
Feth, J.H., and Hem, J.D., 1963, Reconnaissance of headwater springs in the Gila River drainage basin, Arizona: U.S. Geological Survey Water-Supply Paper 1619-H, 54 p.
Garrett, J.M., and Gellenbeck, D.J., 1991, Basin characteristics and streamflow statistics in Arizona as of 1989: U.S. Geological Survey Water- Resources Investigations Report 91-4041,612 p.
Goetz, CL., Abeyta, C.G., and Thomas, E.V., 1987, Application of techniques to identify coal-mine and power-generation effects on surface-water quality, San Juan River basin, New Mexico and Colorado: U.S. Geological Survey Water-Resources Investigations Report 86-4076,79 p.
Helsel, D.R., and Conn, T.A., 1988, Estimation of descriptive statistics for multiple censored water quality data: Water Resources Research, v. 24, no. 12, p. 1997-2004.
Hem, J.D., 1950, Quality of water of the Gila River basin above Coolidge Dam, Arizona: U.S. Geological Survey Water-Supply Paper 1104,230 p.
___1985, Study and interpretation of the chemical characteristics of natural water U.S. Geological Survey Water-Supply Paper 2254,263 p.
Hirsch, R.M., 1981, Techniques of trend analysis for monthly water-quality data: U.S. Geological Survey Open-File Report 81-488,30 p.
Iman, R.L., and Conover, W.J., 1983, A modern approach to statistics: New York, Wiley and Sons, 497 p.
Kendall, M.G., 1975, Rank correlation methods: London, Charles Griffin and Company, 202 p.
Kister, L.R., and Hardt, W.F., 1966, Salinity of the ground water in western Pinal County, Arizona: U.S. Geological Survey Water-Supply Paper 1819-E, 21 p.
Laney, R.L., 1972, Chemical quality of water in the Tucson basin, Arizona: U.S. Geological Survey Water-Supply Paper 1939-D, 46 p.
McClennan, JJ., 1984, Official compilation of administrative rules and regulations: Phoenix, State of Arizona report, Supplement 84-3, p. 68-84.
___1986, Official compilation of administrative rules and regulations: Phoenix, State of Arizona report, Advance Supplement 86-4, p. 1-49.
McDougall, W.B., 1973, Seed plants of northern Arizona: Flagstaff, Arizona, The museum of northern Arizona, 594 p.
McLeod, A.I., Hipel, K., and Camancho, F., 1984, Trend assessment of water quality time series: Water Resources Bulletin 19, p. 537-547.
Owen-Joyce, S.J., 1984, Hydrology of a stream-aquifer system in the Camp Verde area, Yavapai County,
References Cited 43

Arizona: Phoenix, Arizona Department of Water Resources Bulletin 3,60 p.
Owen-Joyce, S.J., and Bell, C.K., 1983, Appraisal of water resources in the upper Verde River area, Yavapai and Coconino Counties, Arizona: Phoenix, Arizona Department of Water Resources Bulletin 2, 219 p.
Robertson, F.N., 1975, Hexavalent chromium in the ground water in Paradise Valley, Maricopa County, Arizona: Ground Water, v. 13, no. 6, p. 516-527.
___1991, Geochemistry of ground water in alluvial basins of Arizona and adjacent parts of Nevada, New Mexico, and California: U.S. Geological Survey Professional Paper 1406-C, 90 p.
Sax, I.N., and Lewis, RJ., Sr., 1987, Hawleys condensed chemical dictionary: New York, Van Nostrand Reinhold Co., 1,288 p.
Sellers, W.D., Hill, R.H., and Sanderson-Rae, Margaret, eds., 1985, Arizona climate The first hundred years: Tucson, University of Arizona Press, 143 p.
Smith, R.A., Alexander, R.B., and Wolman, M.G., 1987, Analysis and interpretation of water-quality trends in major U.S. rivers, 1974-81: U.S. Geological Survey Water-Supply Paper 2307,25 p.
Smith, R.A., Hirsch, R.M., and Slack, J.R., 1982a, A study of trends in total phosphorus measurements at NASQAN stations: U.S. Geological Survey Water-Supply Paper 2190,34 p.
Smith, S.A, Small, Gary, Phillips, T.S., and Clester, Michael, 1982b, Water quality in the Salt River Project A preliminary report: Phoenix, Salt River Project, Water Resources Operations, Groundwater Planning Division, 360 p.
State of Arizona, 1992, Arizona Administrative Code, 1992: Phoenix, Arizona, Title 18, Chapter 11, Article 1, p. 1-34, Article 4, p. 36-40.
Thomsen, B.W., and Baldys, Stanley, III, 1985, Ground-water conditions in and near the Gila River Indian Reservation, south-central Arizona: U.S. Geological Survey Water-Resources Investigations Report 85-4073,2 sheets.
U.S. Environmental Protection Agency, 1976, Quality criteria for water: U.S. Environmental Protection Agency report, 256 p.
___1986, Quality criteria for water, 1986: U.S. Environmental Protection Agency Report EPA 440/5-86-001, v.p.
___1990, Drinking water regulations and health advisories: U.S. Environmental Protection Agency Office of Drinking Water report, 10 p.
___1991, Drinking water regulations and health advisories: Washington, D.C., U.S. Environmental Protection Agency report, 21 p..1993, Drinking water regulations and health
advisories: Washington, D.C., U.S. Environmental Protection Agency report, lip.
Valley National Bank, 1988, Arizona statistical review: Phoenix, Valley National Bank of Arizona, 44th edition, 89 p.
Wilson, E.D., Moore, R.T., and Cooper, J.R., 1969, Geologic map of Arizona: Tucson, Arizona Bureau of Mines map, scale 1:500,000.
Wilson, R.P., 1988, Water resources of the northern part of the Agua Fria area, Yavapai County, Arizona: Phoenix, Arizona Department of Water Resources Bulletin 5,109 p.
44 Summary Statistics and Trend Analysis of Water-Quality Data at Sites In the Glla River Basin

SUMMARY STATISTICS AND RESULTS OF SEASONAL KENDALL TAU TEST
Summary Statistics and Reauita of Seaaonai Kendaii Tau Teat 45

Table 2. Summary statistics for pH data used in time-trend analysis[Dashes, no value computed]
NumberStation name snd number of
ssmples Mean
Gila River near Redrock, N. Mex. (09431500)......................................... 191
San Francisco River near Clifton (09444600)......................................... 105
Gila River at Calva (09466500) ............ 133
Gila River at Winkelman f09470000') 84
San Pedro River below Aravaipa Creek, near Mammoth /no/iT* i nni ^8
Final Creek at Inspiration Dam, near Globe (09498400) ...................... 98
Salt River near Roosevelt (09498500)......................................... 149
Salt River below Stewart Mountain Dam (09502000) ................................ 130
Agua Fria River near Rock Springs (09512800)......................................... 81
Agua Fria River below Waddell Dam (09513600)......................................... 38
Gila River above diversions, at Gillespie Dam (09518000) ................ 146
Gila River near Dome (09520500)......................................... 69
Gila River near mouth, near Yuma (09520700^ 1 80
pH, in stsndard units
Medisn
8.20
8.20
8.20
8.20
8.30
8.00
8.20
8.00
8.35
8.10
8.10
7.90
7.90
Mini mum
6.90
6.90
6.80
7.30
7.80
5.70
6.90
6.40
6.90
7.10
6.50
7.30
7.40
Standard &*»**'*
Msxi- deviation ^"mean mum
910
9.60
9.80
8.80
8 on
8.40
9 20
8 7O
8.70
8.60
9.20
8.30
8 40
Summary Statistics and Reaults of Sessonai Kendaii Tau Test 47

Table 3. Results of seasonal Kendall tau test on flow-adjusted pH[Results follow the general linear model form ffc^Po+pVKQHE. where f (c)(UN) or f(c) = ln(c) (LOG) and f(Q) is one of the following functions of water discharge: linear (UN), f(Q)=Q; logarithmic (LOG), f(c)=ln(Q); inverse (INV), f(Q)=l/Q; hyperbolic (HYP), f(Q)=l/(l+PQ); NR=No relation between pH and discharge. The p value is the probability of rejecting the null hypothesis of no trend in the water-chemistry constituent; <, less than; dashes, data are not flow adjusted]
Station name and number
Gila River near Redrock, N. Mex. (09431500)......................
San Francisco River near Clifton (09444600) .......................
Gila River at Calva (094665000 ............................................
Gila River at Winkelman (09470000) ....................................
San Pedro River below Aravaipa Creek, near MammothCftO/lT^ MV\\
Final Creek at Inspiration Dam, near Globe (09498400)........
Salt River near Roosevelt (09498500)....................................
Salt River below Stewart Mountain Dam (09502000)............
Agua Fria River near Rock Springs (09512800).....................
Agua Fria River below Waddell Dam (09513600) .................
Gila River above diversions, at Gillespie Dam (09518000) ..........................................................................
Gila River near Dome (09520500)..........................................
Gila River near mouth, near Yuma (09520700) .....................
Ordinary least-squares regression analysis
using pH as s function of dlschsrge
f(c)/f(Q) ' percent
... LOG/HYP 12.8
... LOG/NR
... LOG/NR -
... LOG/NR
LOG/NR
,.. LOG/NR
LOG/NR
... LOG/NR
LOG/NR
,.. LOG/NR - -
,.. LOG/LOG 12.7
... LOG/NR
... LOG/LOG 12.5
Seasonal Kendall tau test on flow-adjusted pH data
Medisn, in stan
dard units
8.20
8.20
8.20
8.20
8.30
7.98
8.21
8.00
8.35
8.10
8.10
7.90
7.90
Stan dard units per year
0.056
<.001
.029
.040
<.001
.013
.013
.044
-.010
<.001
.058
<.001
<.001
p vslue
0.1310
1.000
.0234
.0012
1.000
.3371
.2335
.0017
.4818
.8283
.0940
1.000
1.000
48 Summary Statistics snd Trend Analysis of Wster-Qusllty Data st Sitas in the Gils River Basin

Table 4. Summary statistics for turbidity used in time-trend analysis[<, less than]
Station name and number
Gila River near Redrock, N. Mex. (09431500)..................................
San Francisco River near Clifton (09444600)...................................
Gila River at Calva (09466500) ......
Gila River at Winkelman (09470000) ...................................
San Pedro River below Aravaipa Creek, near Mammoth (09473100)..................................
Final Creek at Inspiration Dam, near Globe (09498400) ................
Salt River near Roosevelt (09498500) ...................................
Salt River below Stewart Mountain Dam (09502000)..........
Agua Fria River near Rock Springs (09512800) .....................
Agua Fria River below Waddell Dam (09513600) ..........................
Gila River above diversions, at Gillespie Dam (09518000)...........
Gila River near Dome (09520500) ..................................
Gila River near mouth, near Yuma (09520700).........................
Num ber of sam ples
64
31
101
29
38
64
69
89
80
38
94
39
42
Turbidity, In nephelometrlc turbidity units
Mean
158
87.7
472
216
631
20.6
86.6
5.45
283
7.61
44.9
13.7
38.5
Median
10
5.5
40
24
10
3.2
9.0
3.0
1.0
5.8
26
3.0
5.0
Mini mum
<0.01
.60
.00
6.00
<.0l
.20
.50
.40
.00
.60
1.60
.50
.10
Maxi mum
6,500
1,500
21,000
4,800
12,000
140
2,400
54.0
17,000
31.0
480
140
720
- Standarddeviation
819
272
2,310
888
2,280
32.9
315
7.55
1,920
6.03
68.8
27.0
112
Standard error of mean
102
48.8
230
165
370
4.12
37.9
.80
215
.98
7.10
4.33
17.3
Summary Statistics and Results of Seaaonal Kendall Tau Test 49

Table 5. Results of seasonal Kendall tau test on flow-adjusted turbidity
[Results follow the general linear model form ffc^o+pV^QJ+E, where f(c)(LJN) or f(c)=ln(c) (LOG) and f(Q) is one of the following functions of water discharge: linear (LJN), f(Q)=Q; logarithmic (LOG), f(c)=ln(Q); inverse (DSTV), f(O>l/Q; hyperbolic (HYP), f(Q>l/(l+PQ); NR=No relation between concentrations and discharge. NTU, nephelometlic turbidity units. The p value is the probability of rejecting the null hypothesis of no trend in the water-chemistry constituent. Dashes, data are not flow adjusted]
Station name and number
Ordinary leaat-squarearegreaalon analysis ualngturbidity aa a function of
discharge
Seasonal Kendall tau test on flow-adjuated turbidity data
f(c)/f(Q) /".In percent
Median, in NTU
Turbidity, In NTU
per yearp value
Gila River near Redrock, N. Mex. (09431500) .............................................
San Francisco River near Clifton(09444600) ...........................................
Gila River at Calva (09466500)................
Gila River at Winkelman (09470000).......
San Pedro River below Aravaipa Creek, near Mammoth (09473100)...................
Final Creek at Inspiration Dam, near Globe (09498400)..................................
Salt River near Roosevelt (09498500) .....
Salt River below Stewart Mountain Dam (09502000) ............................................
Agua Fria River near Rock Springs (09512800)............................................
Agua Fria River below Waddell Dam (09513600)...........................................
Gila River above diversions, at Gillespie Dam (09518000) ...................................
Gila River near Dome (09520500)............
Gila River near mouth, near Yuma (09520700).............................................
LOG/LOG
LOG/UN
LOG/LOG
LOG/UN
LOG/LOG
LIN/HYP
LIN/NR
LEST/UN
LOG/HYP
LJN/UN
LIN/LIN
UN/HYP
LOG/LOG
16.4
70.8
45.0
21.0
63.9
54.9
61.0
23.2
14.6
57.6
69.2
70.8
10
5.5
40
24
10
3.2
9.0
3.0
1.0
5.8
26
3.0
5.0
-0.04
.14
-.02
-.06
.26
-.01
-38
-.12
.09
.06
-.01
.03
.38
0.3418
.2301
.9470
.3502
.5085
.8191
.3177
.0325
.0849
.7527
.5255
.8345
.3567
SO Summary Statiatics and Trend Analysis of Water-Quality Data at Sitea in the Gila River Baain

Table 6. Summary statistics for hardness used in time-trend analysis
Station name and number
Gila River near Redrock, N. Mex. (09431500)...................................................
San Francisco River near Clifton (09444600)...................................................
Gila River at Calva (09466500) ......................
Gila River at Winkelman (09470000) .............
San Pedro River below Aravaipa Creek, near Mammoth (09473100) .........................
Final Creek at Inspiration Dam, near Globe (09498400)...................................................
Salt River near Roosevelt (09498500) ............
Salt River below Stewart Mountain Dam (09502000)...................................................
Agua Fria River near Rock Springs (09512800) ..................................................
Agua Fria River below Waddell Dam (09513600)...................................................
Gila River above diversions, at Gillespie Dam (09518000) .........................................
Gila River near Dome (09520500)..................
Gila River near mouth, near Yuma (09520700)...................................................
Num ber of aam- ples
141
109
142
85
37
96
145
130
80
38
127
44
183
Hardness, In mllllgrama per liter as calcium carbonate
Mean
115
221
521
255
311
1,860
242
165
228
180
745
628
573
Median
120
230
420
220
330
1,900
250
170
230
180
750
540
610
Mini mum
46.0
70.0
63.0
110
160
830
70.0
130
130
130
81.0
190
190
Maxi mum
180
440
1,300
650
390
2,400
440
220
280
230
1,400
2,000
890
Stan dard
devia tion
25.7
68.8
330
93.5
64.8
231
93.8
21.0
30.0
20.5
269
369
153
Stan dard error
of mean
2.16
6.58
27.7
10.1
10.6
23.6
7.79
1.84
3.36
3.32
23.9
55.6
11.3
Summary Statlatlcs and Results of Seaaonai Kendaii Tau Teat 51

Table 7. Results of seasonal Kendalltau test on flow-adjusted hardness[Results follow the general linear model form f(c)=P0+p,«f(Q)+e, where f(c)(LIN) or f(c)=ln(c) (LOG) and f(Q) is one of the following functions of water discharge: linear (UN), f(Q)=Q; logarithmic (LOG), f(c)=ln(Q); inverse (INV), f(Q)=l/Q; hyperbolic (HYP), f(Q)=l/(l+P Q); NR=No relation between concentrations and discharge. The p value is the probability of rejecting the null hypothesis of no trend in the water-chemistry constituent Dashes, data are not flow adjusted]
Ordinary least- squaresregression snalysls usinghsrdness ss s function of
discharge
Seasonal Kendsll tsu test on flow-adjusted hardness data
Station name and number
f(c)/f(Q)
Hardness,Median, In mllll-
i2, In mllll- grams per In percent grsmsper liter per year
liter ss celclum carbonste
p value
Gila River near Redrock, N. Mex. (09431500)................................................... LJN/HYP 73.1 120 -0.03 0.2332
San Francisco River near Clifton (09444600)................................................... LJN/INV 84.3 230 -.04 .3486
Gila River at Calva (09466500) .................... LJN/HYP 69.4 420 -.07 .0088
Gila River at Winkelman (09470000)............ LOG/HYP 48.7 220 -.18 .0041
San Pedro River below Aravaipa Creek, near Mammoth (09473100)......................... LOG/HYP 60.9 330 1.56 .1229
Final Creek at Inspiration Dam, near Globe (09498400)........................................ LOG/HYP 67.7 1,900 .18 .4463
Salt River near Roosevelt (09498500)............ LOG/LOG 80.5 250 .08 .3847
Salt River below Stewart Mountain Dam (09502000) ......................................... LJN/NR - 170 .00 .7990
Agua Fria River near Rock Springs (09512800)................................................... LJN/HYP 53.9 230 -.13 .0199
Agua Fria River below Waddell Dam (09513600)................................................... LIN/LIN 21.4 180 -.05 .5995
Gila River above diversions, at Gillespie Dam (09518000).......................................... UN/LOG 63.4 750 -.07 .0072
Gila River near Dome (09520500)................. UN/LOG 65.7 540 -.10 .7500
Gila River near mouth, near Yuma (09520700) .................................................. LOG/UN 81.4 610 .16 .2064
52 Summsry Statistics and Trend Analysis of Wster-Quallty Data st Sites In the Gils River Basin

Table 8. Summary statistics for dissolved solids used in time-trend analysis
Station name and number
Gila River near Redrock, N. Mex. (09431500) ............................................
San Francisco River near Clifton (09444600)............................................
Gila River at Calva (09466500) ...............
Gila River at Winkelman (09470000) ......
San Pedro River below Aravaipa Creek, near Mammoth (09473100) ..................
Final Creek at Inspiration Dam, near Globe (09498400) .................................
Salt River near Roosevelt (09498500) .....
Salt River below Stewart Mountain Dam (09502000)............................................
Agua Fria River near Rock Springs (09512800) ...........................................
Agua Fria River below Waddell Dam (09513600)............................................
Gila River above diversions, at Gillespie Dam (09518000) ..................................
Gila River near Dome (09520500)...........
Gila River near mouth, near Yuma (09520700)............................................
Num ber of
sam ples
89
109
142
85
37
100
143
130
81
38
127
67
181
Dissolved solids, In milligrams per liter
Mean
221
676
2,060
752
754
2,970
1,070
482
367
296
2,560
2,300
1,870
Median
229
630
1,700
628
838
3,000
984
464
380
298
2,570
2,270
2,000
Mini mum
68.0
178
244
234
322
1,310
146
287
218
217
202
546
528
Maxi mum
349
1,830
4,680
2,890
960
3,600
2,830
855
484
390
4,700
5,870
2,730
Stan dard
devia tion
51.6
324
1,360
390
214
355
624
135
52.0
38.0
974
1,260
521
Stan dard
error of mean
5.47
31.0
114
42.3
35.2
35.5
52.2
11.8
5.78
6.17
86.4
154
38.7
Summary Statistics and Results of Seasonal Kendall Tau Test 53

Table 9. Results of seasonal Kendall tau test on flow-adjusted dissolved solids
[Results follow the general linear model form f(c)=p0+p,'f(Q)+e, where f (c)(LJN) or f(c)=ln(c)(LOG) and f(Q) is one of the following functions of water discharge: linear (UN), f(Q)=Q; logarithmic (LOG), f(c>dn(Q); inverse (INV), f(Q>l/Q; hyperbolic (HYP), f(Q)=l/(l+PQ); NR=No relation between concentrauons and discharge. <, less than. The p value is the probability of rejecting the null hypothesis of no trend in the water-chemistry constituent Dashes, data are not flow adjusted]
Ordinary leaat-squares regression analysis uaing concentration of dissolved
solids as a function of discharge
Seasonal Kendall tau test on flow-adjuated concentration data
Station name and number
f(c)/f(Q) percent
Median, in milli grams
per liter
Concen tration a, in milligram p valueper literper yesr
Gila River near Redrock, N. Mex. (09431500).... LIN/LOG 59.4 229
San Francisco River near Clifton (09444600)...... LIN/INV 89.4 630
Gila River at Calva (09466500) ........................... UN/UN 79.5 1,700
Gila River at Winkelman (09470000) .................. LOG/UN 27'A 628
San Pedro River below Aravaipa Creek, near Mammoth (09473100)....................................... LIN/HYP 72.7 838
Final Creek at Inspiration Dam, near Globe (09498400)......................................................... LOG/HYP 66.2 3,000
Salt River near Roosevelt (09498500).................. LOG/LOG 91.2 984
Salt River below Stewart Mountain Dam (09502000) ........................................................ LIN/NR 464
Agua Fria River near Rock Springs(09512800)........................................................ LIN/HYP 56.4 380
Agua Fria River below Waddell Dam (09513600)......................................................... LOG/UN 23.4 298
Gila River above diversions, at Gillespie Dam (09518000)......................................................... LIN/LOG 71.1 2,570
Gila River near Dome (09520500)....................... LOG/HYP 49.4 2,270
Gila River near mouth, near Yuma (09520700) ........................................................ LOG/LIN 83.6 2,000
-0.45 0.0492
-.2 .4708
-.5 .0439
-.20 .0279
.22
.49
.01
-.30
-.30
-.01
-.08
.14
.13
.1393
<.0001
.9337
.9824
<.0001
.9164
.0366
.6178
.1840
54 Summary Statistics and Trend Analysis of Water-Quality Data at Sites in the Gila River Basin

Table 10. Summary statistics for dissolved sodium used in time-trend analysis
Station name and number
Gila River near Redrock, N. Mex. (09431500)............................................
San Francisco River near Clifton (09444600)............................................
Gila River at Calva (09466500) ..............
Gila River at Winkelman (09470000) .....
San Pedro River below Aravaipa Creek, near Mammoth (09473100) ..................
Final Creek at Inspiration Dam, near Globe (09498400) ................................
Salt River near Roosevelt (09498500) ...........................................
Salt River below Stewart Mountain Dam (09502000) ...................................
Agua Fria River near Rock Springs (09512800) ...........................................
Agua Fria River below Waddell Dam (09513600)............................................
Gila River above diversions, at Gillespie Dam (09518000)....................
Gila River near Dome (09520500)..........
Gila River near mouth, near Yuma (09520700)............................................
Num ber of sam ples
139
83
142
49
37
96
114
130
81
38
127
45
183
Dissolved sodium, in milligrams per liter
Mean
28.7
142
525
184
125
67.5
286
106
42.0
33.3
598
425
437
Median
31.0
130
425
160
140
67.0
240
100
45.0
34.0
610
400
470
Mini mum
7.80
17.0
250
16.0
29.0
250
250
43.0
17.0
23.0
250
82.0
110
Maxi mum
44.0
420
1,200
790
170
89.0
950
230
56.0
43.0
1,100
920
610
Stan- JnMj
devia tion
8.00
84.5
364
138
42.9
10.6
202
44.4
8.44
5.45
245
225
12.5
Stan dard
error of mean
0.68
9.27
30.6
19.7
7.05
1.09
19.0
3.89
.94
.88
21.7
33.4
9.27
Summary Statistics and Results of Seasonal Kendall Tau Test 55

Table 11. Results of seasonal Kendall tau test on flow-adjusted dissolved sodium
[Results follow the general linear model form ffcHJo+Pj 'f(Q)+e, where f(c)(LJN) or f (c)=ln(c) (LOG) and f(Q) is one of the following functions of water discharge: linear (UN). f(O>Q; logarithmic (LOG), f(c)=ln(Q); inverse (INV), f(Q>l/Q; hyperbolic (HYP), f(Q>l/(l+PQ); NR=No relation between concentrations and discharge. Dashes, data are not flow adjusted]
Ordinary least-squares regression ansiysis using concentration of dissolved
sodium ss a function of discharge
Seasonal Kendsii tau test on flow-adjusted concentration dats
Station name and number
f(c)/f(Q)
Concen-Medisn, trstlons,
i2 , in in miiii- In mliil- percent grsms grams per
per liter liter per year
p vsiue
Gila River near Redrock, N. Mex. (09431500)......... LIN/LOG 79.6
San Francisco River near Clifton (09444600).......... LOG/LOG 94.6
Gila River at Calva (09466500)............................... UN/HYP 81.3
Gila River at Winkebnan (09470000) ...................... LOG/UN 26.2
San Pedro River below Aravaipa Creek, near Mammoth (09473100).......................................... LIN/HYP 75.9
Final Creek at Inspiration Dam, near Globe(09498400)............................................................ LIN/LIN 21.2
Salt River near Roosevelt (09498500)...................... LIN/INV 84.8
Salt River below Stewart Mountain Dam (09502000) ............................................................ LIN/NR
Agua Fria River near Rock Springs (09512800)............................................................. LIN/HYP 70.9
Agua Fria River below Waddell Dam (09513600)............................................................. LIN/LIN 15.8
Gila River above diversions, at Gillespie Dam (09518000)............................................................. LIN/LOG 69.6
Gila River near Dome (09520500)........................... LOG/HYP 57.8
Gila River near mouth, near Yuma (09520700) ............................................................ LIN/HYP 69.4
31.0 -0.05 0.0002
130 -.10 .2648
425 -.04 .0725
160 -.08 .4863
140
67.0
240
100
45.0
34.0
610
400
470
.17
.18
.01
-.28
.32
-.05
-.21
.04
.0778
<.0001
.3367
1.000
<.0001
.1152
.0776
.6569
.2848
56 Summary Statistics and Trend Analysis of Water-Quality Data at Sites In the Glla River Basin
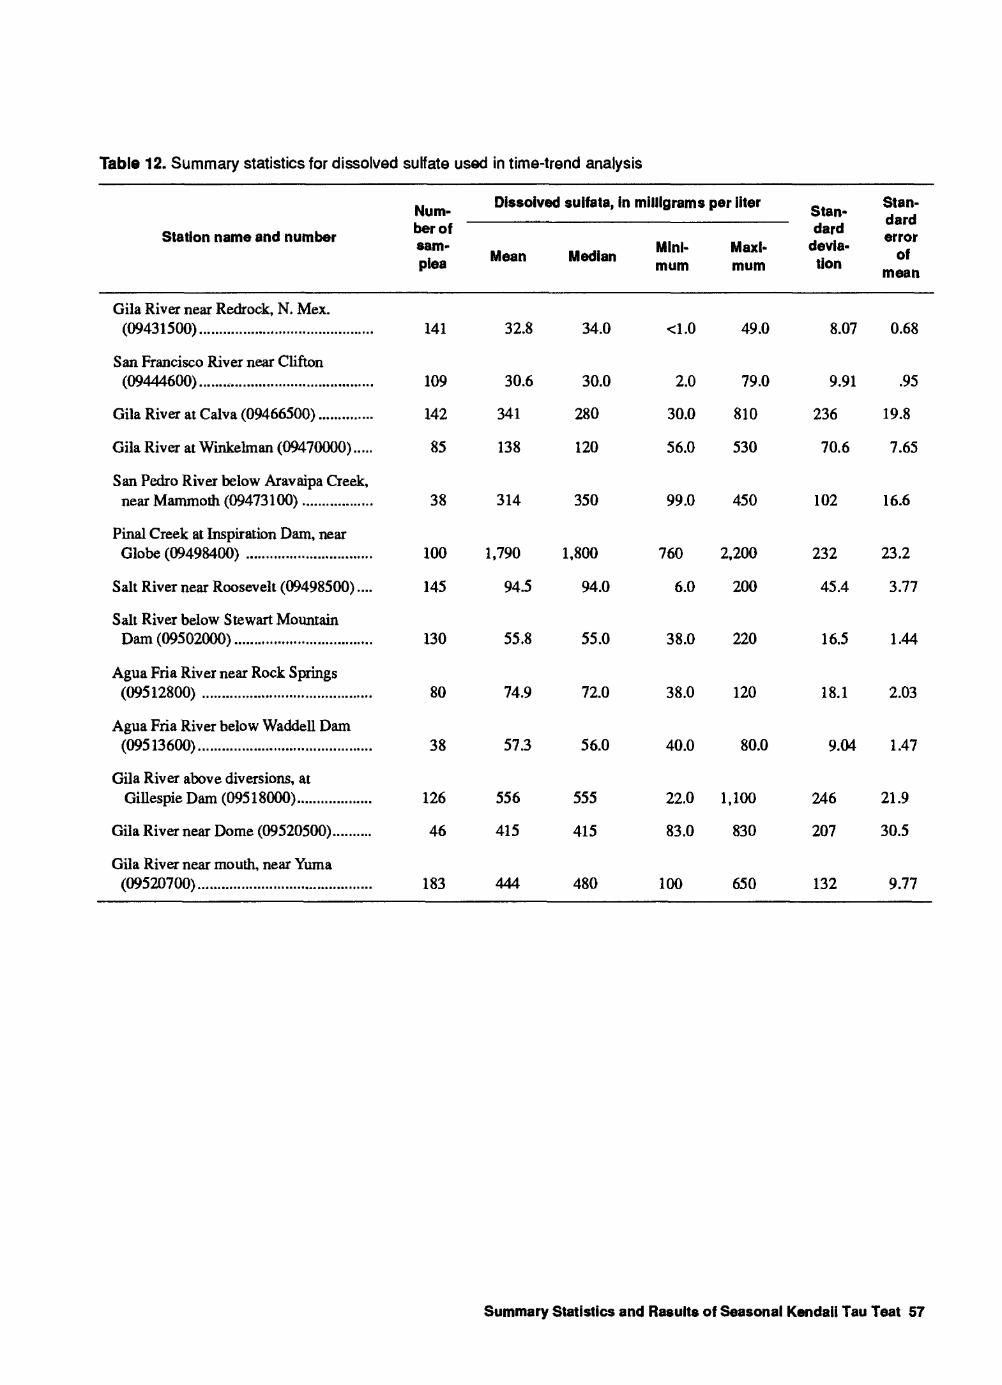
Table 12. Summary statistics for dissolved sulfate used in time-trend analysis
Station name and number
Gila River near Redrock, N. Mex. (09431500)............................................
San Francisco River near Clifton (09444600)........,...................................
Gila River at Calva (09466500) ..............
Gila River at Winkelman (09470000) .....
San Pedro River below Aravaipa Creek, near Mammoth (09473100) ..................
Final Creek at Inspiration Dam, near Globe (09498400) ................................
Salt River near Roosevelt (09498500) ....
Salt River below Stewart Mountain Dam (09502000) ...................................
Agua Fria River near Rock Springs (09512800) ...........................................
Agua Fria River below Waddell Dam (09513600)............................................
Gila River above diversions, at Gillespie Dam (09518000)...................
Gila River near Dome (09520500)..........
Gila River near mouth, near Yuma (09520700)............................................
Num ber of sam- plea
141
109
142
85
38
100
145
130
80
38
126
46
183
Dissolved sulfata, In milligrams per liter
Mean
32.8
30.6
341
138
314
1,790
94.5
55.8
74.9
57.3
556
415
444
Median
34.0
30.0
280
120
350
1,800
94.0
55.0
72.0
56.0
555
415
480
Mini mum
<1.0
2.0
30.0
56.0
99.0
760
6.0
38.0
38.0
40.0
22.0
83.0
100
Maxi mum
49.0
79.0
810
530
450
2,200
200
220
120
80.0
1,100
830
650
Stan dard
devia tion
8.07
9.91
236
70.6
102
232
45.4
16.5
18.1
9.04
246
207
132
Stan dard error
of mean
0.68
.95
19.8
7.65
16.6
23.2
3.77
1.44
2.03
1.47
21.9
30.5
9.77
Summary Statistics and Results of Seasonal Kendall Tau Teat 57

Table 13. Results of seasonal Kendall tau test on flow-adjusted dissolved sulfate[Results follow the general linear model form f (c)=P0+P] 'f(Q)+E, where f(cXLIN) or f(c)=ln(c)(LOG) and f (Q) is one of the following functions of water discharge: linear (UN), f(Q)=Q; logarithmic (LOG), f(c)=ln(Q); inverse (INV), f(O>l/Q; hyperbolic (HYP), f(Q)=l/(l+p Q) NR=No relation between concentrations and discharge. <, less than. The p value is the probability of rejecting the null hypothesis of no trend in the water-chemistry constituent Dashes, data are not flow adjusted]
Ordinary ieast-squarea regression analysis using concentration of dissolved
sulfate as a function of discharge
Seaaonal Kendall tau test on flow-adjusted concentration data
Station name and number
f(c)/f(Q)
Concen-Median, trations,
i2, In in mill)- In mini- percent grama grams
per liter per liter per year
p value
Gila River near Redrock, N. Mex. (09431500)..
San Francisco River near Clifton (09444600)...
Gila River at Calva (09466500)........................
Gila River at Winkelman (09470000) ...............
San Pedro River below Aravaipa Creek, near Mammoth (09473100)............................
Final Creek at Inspiration Dam, near Globe(09498400)............................................
Salt River near Roosevelt (09498500)...............
Salt River below Stewart Mountain Dam (09502000).....................................................
Agua Fria River near Rock Springs(09512800).....................................................
Agua Fria River below Waddell Dam (09513600)......................................................
Gila River above diversions, at Gillespie Dam (09518000)......................................................
Gila River near Dome (09520500).....................
Gila River near mouth, near Yuma (09520700)......................................................
UN/HYP
UN/HYP
UN/HYP
LOG/LOG
LOG/HYP
LOG/LIN
LOG/LOG
LIN/NR
UN/HYP
UN/LIN
UN/LOG
LOG/HYP
LIN/LOG
30.6
10.0
75.5
25.7
72.0
60.5
74.0
34.0 -0.09 0.0013
30.0 -.02 .6058
280 -.05 .0679
120 -.05 .2139
22.5
13.6
70.8
80.8
77.5
350
1,800
94.0
55.0
72.0
56.0
555
415
480
1.34
.55
.10
-.07
-.44
-.19
-.08
.02
.12
.0153
.0023
.2322
.8286
<.0001
.4623
.0202
.9032
.0572
58 Summary Statiatics and Trend Analysis of Water-Quality Data at Sitea In the Gila River Basin

Table 14. Summary statistics for dissolved chloride used in time-trend analysis
Station name snd number
Gila River near Redrock, N. Mex. (09431500)................................................
San Francisco River near Clifton (09444600) ................................................
Gila River at Calva (09466500)..................
Gila River at Winkelman (09470000).........
San Pedro River below Aravaipa Creek, near Mammoth (09473100) ......................
Final Creek at Inspiration Dam, near Globe (09498400) ....................................
Salt River near Roosevelt (09498500) ........
Salt River below Stewart Mountain Dam (09502000) ................................................
Agua Fria River near Rock Springs (09512800)................................................
Agua Fria River below Waddell Dam (09513600)................................................
Gila River above diversions, at Gillespie Dam (09518000) .......................................
Gila River near Dome (09520500)..............
Gila River near mouth, near Yuma (09520700)................................................
Num ber of sam ples
141
83
145
49
37
99
113
130
80
38
128
45
184
Dissolved chloride, In milligrams per liter
Mean
11.8
257
786
255
41.1
75.3
465
164
31.8
24.7
903
689
597
Median
12.0
230
590
210
48.0
77.0
390
160
33.5
24.0
920
610
630
Mini mum
2.0
16.0
31.0
11.0
9.6
31.0
33.0
37.0
110
16.0
20.0
70.0
150
Msxi- mum
44.0
870
2,200
1,200
59.0
110
1,500
360
50.0
40.0
1,600
1,600
1,200
Standard
devia tion
5.02
172
606
218
15.3
20.4
324.0
71.1
8.66
5.31
348
436
192
Stan dard error
of mean
0.42
18.8
50.3
31.1
2.52
2.05
30.5
6.24
.97
.86
30.7
65.0
14.1
Summary Statistics snd Results of Seasonal Kendsll Tsu Test 59

Table 15. Results of seasonal Kendall tau test on flow-adjusted dissolved chloride[Results follow the general linear model form f(c)=P0+ P,»f(Q)+e, where f(c)(LJN) or f(c)=ln(c)(LOG) and f(Q) is one of the following functions of water discharge: linear (UN), f(Q)=Q; logarithmic (LOG), f(c)=ln(Q); inverse (INV), f(Q)=l/Q; hyperbolic (HYP), f(Q)=l/(l+PQ); NR=No relation between concentrations and discharge. The p value is the probability of rejecting the null hypothesis of no trend in the water-chemistry constituent Dashes, data are not flow adjusted]
Ordinary ieast-aquarea regression analysis using
concentration of diaaolved chloride aa a function of dlacharge
Station name and number
Gila River near Redrock, N. Mex. (09431500).........
San Francisco River near Clifton (09444600) ..........
Gila River at Calva (09466500) ...............................
Gila River at Winkelman (09470000) ......................
San Pedro River below Aravaipa Creek, near Mammoth (09473100) ...........................................
Final Creek at Inspiration Dam, near Globe (09498400).............................................................
Salt River near Roosevelt (09498500) ......................
Salt River below Stewart Mountain Dam (09502000) ............................................................
Agua Fria River near Rock Springs (09512800).............................................................
Agua Fria River below Waddell Dam (09513600).............................................................
Gila River above diversions, at Gillespie Dam (09518000) .............................................................
Gila River near Dome (09520500)............................
Gila River near mouth, near Yuma (09520700) ............................................................
f(c)/f(Q)
LOG/HYP
1IN/INV
IIN/HYP
LOG/LOG
IIN/HYP
LOG/HYP
1IN/INV
1IN/NR
IIN/HYP
IIN/LIN
IIN/LOG
IIN/HYP
LOG/UN
i2, In percent
47.1
88.2
76.7
15.6
67.1
21.4
83.0
48.2
14.1
69.5
48.7
77.1
Seaaonal Kendall tau teat on flow-adjusted concentration data
Median, In mllll- grama
per liter
12.0
230
590
210
48.0
77.0
390
160
33.5
24.0
920
610
630
Concen trations, In
milli grams per liter per year
-0.07
-.01
-.07
-.12
.11
1.76
.03
.00
-.36
.06
-.05
-.02
.16
p value
0.0220
.8491
.0054
.2653
.5085
<.0001
.0123
1.0000
<.0001
1.000
.0241
.7972
.1805
60 Summary Statistics and Trend Analysis of Water-Quality Data at Sites In the Gila River Basin

Table 16. Summary statistics for total ammonia plus organic nitrogen used in time-trend analysis
[<, less than]
Station name snd number
Gila River near Redrock, N. Mex. (09431500) ............................................................
San Francisco River near Clifton (09444600) ............................................................
Gila River at Calva (09466500) ..............................
Gila River at Winkelman (09470000).....................
San Pedro River below Aravaipa Creek, near Mammoth (09473100) ..........................................
Final Creek at Inspiration Dam, near Globe (09498400) ...........................................................
Salt River near Roosevelt (09498500) .....................
Salt River below Stewart Mountain Dam (09502000)............................................................,
Agua Fria River near Rock Springs (09512800) ............................................................
Agua Fria River below Waddell Dam (09513600)............................................................,
Gila River above diversions, at Gillespie Dam (09518000).............................................................
Gila River near Dome (09520500)..........................,
Gila River near mouth, near Yuma (09520700) .............................................................
Num ber of
aam- plea
77
83
142
81
37
84
148
119
81
38
125
62
82
Total ammonia plua organic nitrogen (ss nitrogen), In mllllgrama
per liter
Mean
0.80
1.08
2.01
1.32
4.80
.64
.57
.50
.64
.60
4.56
.72
.77
Median
0.47
.40
.80
.85
.80
.60
.40
.40
.40
.50
3.70
.60
.67
Mini mum
0.10
.01
.10
.10
.30
.01
.03
.10
.30
.60
.10
.18
Maxi mum
11.0
18.0
74.0
11.0
47.0
2.00
3.50
2.90
6.20
1.40
17.0
2.00
3.80
Stan dard
devia tion
1.52
2.82
6.62
1.72
11.8
.35
.53
.43
1.04
.26
2.94
.36
.52
Stan dard error
of mean
0.17
.31
.56
.19
1.94
.04
.04
.04
.12
.04
.26
.05
.06
Summary Statistics and Results of Seaaonal Kendall Tau Test 61

Table 17. Results of seasonal Kendall tau test on flow-adjusted total ammonia plus organic nitrogen[Results follow the general linear model form f(c)=P0+ P^fCQHe, where f(c)(LIN) or f(c)=ln(c)(LOG) and f(Q) is one of the following functions of water discharge: linear (LIN), f(Q)=Q; logarithmic (LOG), f(c)=ln(Q); inverse (INV), f(Q)=l/Q; hyperbolic (HYP), f (O>1/(1+ P Q); NR = No relation between concentrations and discharge. <, less than. The p value is the probability of rejecting the null hypothesis of no trend in the water-chemistry constituent. Dashes, data is not flow adjusted]
Ordinary least-squares regression analysis using
concentration of totalammonia plus organic
nitrogen (as nitrogen) aa afunction of discharge
Sessonsi Kendall tsu test on flow-adjusted concentration data
Station nsme and number
f(c)/f(Q)i2, in
percent
Median, in milli grams
per liter
Concen trations, in milli grams
per liter per year
p vslue
Gila River near Redrock, N. Mex. (09431500).,
San Francisco River near Clifton (09444600)...,
Gila River at Calva (09466500)........................
Gila River at Winkelman (09470000) ...............
San Pedro River below Aravaipa Creek, near Mammoth (09473100)....................................
Final Creek at Inspiration Dam, near Globe (09498400)......................................................
Salt River near Roosevelt (09498500)...............
Salt River below Stewart Mountain Dam (09502000)......................................................
Agua Fria River near Rock Springs (09512800)......................................................
Agua Fria River below Waddell Dam (09513600)......................................................
Gila River above diversions, at Gillespie Dam (09518000).............................................
Gila River near Dome (09520500)....................
Gila River near mouth, near Yuma (09520700) .....................................................
UN/UN 10.6
LIN/NR
LJN/NR
LIN/NR
LOG/HYP 49.3
LIN/NR
LJN/NR
LIN/NR
LIN/HYP 12.5
LIN/NR
LIN/NR
LIN/LOG 13.3
LIN/HYP 14.6
0.47
.40
.80
.85
.80
.60
.40
.40
.40
.50
3.70
.60
.67
-.01
.02
-.02
.05
-.03
-.02
-.05
-.04
.06
.10
0.7041
.0660
.9095
.5273
.2843
.4786
.7527
.7356
.8159
.0281
.5287
.2963
.0639
62 Summary Statistics snd Trend Anslysis of Water-Quality Dsta at Sites in the Gils River Basin

Table 18. Summary statistics for total phosphorus used in time-trend analysis[<, less than]
Station name and number
Gila River near Redrock, N. Mex. (09431500)........................................................
San Francisco River near Clifton (09444600).........................................................
Gila River at Calva (09466500) ...........................
Gila River at Winkelman (09470000)..................
San Pedro River below Aravaipa Creek, near Mammoth (09473100) ...............................
Final Creek at Inspiration Dam, near Globe (09498400) ........................................................
Salt River near Roosevelt (09498500).................
Salt River below Stewart Mountain Dam (09502000) ................................................
Agua Fria River near Rock Springs (09512800) ........................................................
Agua Fria River below Waddell Dam (09513600) .........................................................
Gila River above diversions, at Gillespie Dam (09518000).........................................................
Gila River near Dome (09520500).......................
Gila River near mouth, near Yuma (09520700).........................................................
Num ber of sam ples
77
82
146
85
37
84
149
120
81
38
130
62
86
Total phosphorus, In milligrams per liter
Mean
0.25
.50
.98
.37
2.25
.10
.14
.11
.69
.06
1.93
.10
.10
Median
0.09
.10
.19
.16
.08
.07
.06
.03
.06
.06
1.70
.02
.06
Mini- Maxi mum mum
0.02 4.40
.01 7.90
.01 21.0
<.01 7.30
.02 40.0
<.0l .66
<.0l 3.80
.01 8.30
.01 39.0
.01 .16
.10 5.00
<.01 2.00
<.0l 1.00
Stan dard
devia tion
0.73
1.48
2.75
1.00
7.73
.10
.34
.75
4.39
.03
1.03
.28
.15
Stan- dsrd error
of mean
0.08
.16
.23
.11
1.27
.01
.03
.07
.49
.01
.09
.04
.02
Summary Statiatics and Results of Seasonal Kendall Tau Teat 63

Table 19. Results of seasonal Kendall tau test on flow-adjusted total phosphorus[Results follow the general linear model form f(c)=b0+ bj>f(Q)-»-e, where f(c)(LJN) or f(c)=ln(c)(LOG) and f(Q) is one of the following functions of water discharge: linear (LIN), f(Q)=Q; logarithmic (LOG), f(c)=ln(Q); inverse (INV), f(Q>l/Q; hyperbolic (HYP), f(Q>l/(l+ b Q) NR=No relation between concentrations and discharge. <, less than. The p value is the probability of rejecting the null hypothesis of no trend in the water-chemistry constituent Dashes, data are not flow adjusted]
Ordinary least-aquarea regreasion analysia uaing
concentration of totalphoaphorua aa a function of
diacharge
Seaaonal Kendail tau teat on flow-adjusted concentration data
Station name and number
f(c)/f(Q) /".in percent
Median, in milli gram a
per liter
Concen-trationa, inmilligrama
per literper year
p value
Gila River near Redrock, N. Mex. (09431500)...................................................... LIN/LIN 42.6 0.09 -0.01 0.1043
San Francisco River near Clifton (09444600)...................................................... LOG/LOG 14.6 .10 -.05 .0266
Gila River at Calva (09466500)......................... LOG/HYP 39.1 .19 -.06 .0333
Gila River at Winkelman (09470000) ............... LOG/LOG 17.6 .16 -.13 .0447
San Pedro River below Aravaipa Creek, near Mammoth (09473100)............................ LOG/LOG 63.2 .08 -.22 .1220
Final Creek at Inspiration Dam, near Globe (09498400)...................................................... LIN/LIN 48.5 .07 -.06 .1140
Salt River near Roosevelt (09498500)............... LOG/LOG 13.4 .06 -.05 .1948
Salt River below Stewart Mountain Dam (09502000)...................................................... LJN/NR - - .03 <-.01 .1017
Agua Fria River near Rock Springs (09512800)...................................................... LOG/LOG 14.5 .06 -.01 .9073
Agua Fria River below Waddell Dam (09513600)...................................................... LIN/LIN 23.6 .06 .03 .7527
Gila River above diversions, at Gillespie Dam (09518000)...................................................... LOG/HYP 22.8 1.70 -.05 .1139
Gila River near Dome (09520500).................... LIN/LIN 68.1 .02 -.05 .5309
Gila River near mouth, near Yuma (09520700) ..................................................... LIN/LIN 49.5 .06 .01 .7442
64 Summary Statiatics and Trend Anaiyaia of Water-Quality Data at Sites in the Gila River Baain

Table 20. Summary statistics for dissolved arsenic used in time-trend analysis
[Dashes, no value computed]
Station name and number
Gila River near Redrock, N. Mex. (09431500) ......................................................
San Francisco River near Clifton (09444600) ......................................................
Gila River at Calva (09466500) ........................
Gila River at Winkelman (09470000). ............. .
San Pedro River below Aravaipa Creek, near Mammoth (09473100) ............................
Final Creek at Inspiration Dam, near Globe (09498400) ..........................................
Salt River near Roosevelt (09498500). ...... .......
Salt River below Stewart Mountain Dam (09502000) ......................................................
Agua Fria River near Rock Springs (09512800) .....................................................
Agua Fria River below Waddell Dam (09513600) ......................................................
Gila River above diversions, at Gillespie Dam (09518000)..............................
Gila River near Dome (09520500)....................
Gila River near mouth, near Yuma (09520700) ......................................................
Num ber ofsam ples
45
25
88
1
22
24
48
70
38
80
11
35
Dissolved araenlc, in mlcrograms per liter Stan-
darddevla- ±; " -
1.74 2.0 <1.0 4.0 1.02
2.40 2.0 1.0 4.0 .76
4.38 4.0 <1.0 8.0 1.27
7.0 7.0
4.47 5.0 <1.0 7.0 1.53
(! ) ( ! ) <1-0 1.0 ( ! )
3.55 3.5 <1.0 6.0 1.56
2.93 3.0 2.0 6.0 .75
No data collected at this site.
11.1 11 7.0 16 2.54
9.02 9.0 4.0 14 1.86
6.91 6.0 4.0 10 2.21
6.63 10 4.0 20 3.28
Stan darderror
of mean
0.15
.15
.14
.33
.22
.09
.41
.21
.67
.56
1Data set consists of more than SO percent of values repotted as less than values.
Summary Statistics and Results of Seasonal Kendall Tau Test 65

Table 21. Results of seasonal Kendall tau test on flow-adjusted dissolved arsenic
[Results follow the general linear model form f(c)=P0= p,'f(Q>e, where f(c) (LJN) or f(c)=ln(c) (LOG) and f (Q) is one of the following functions of water discharge: linear (UN), f(Q>Q; logarithmic (LOG), f(c)=ln(Q); inverse (INV), f(Q>l/Q; hyperbolic (HYP), f(Q)=l/(l+PQ) NR=No relation between concentrations and discharge. The p value is the probability of rejecting the null hypothesis of no trend in the water-chemistry constituent. Dashes, data are not flow adjusted]
Station name and number
Ordinary ieaat-squares regression analysia uaing concentration of dissolved
araenic aa a function of discharge
Seasonal Kendall tau test onfiow-adjuated concentration
data
f(c)/f(Q) r'.in percent
Median,In
micro- grama
per liter
Concen- tratlona, In micro-
grama per liter per year
p value
Gila River near Redrock, N. Mex. (09431500)................................................................ LIN/NR 2.0 <0.01 0.4328
San Francisco River near Clifton (09444600)................................................................ LOG/LOG 47.3 2.0 .37 .5403
Gila River at Calva (09466500).................................. LIN/LIN 15.2 4.0 .04 .1003
Gila River at Winkelman (09470000).......................... Insufficient data.
San Pedro River below Aravaipa Creek, near Mammoth (09473100).............................................. LOG/LIN 68.3 5.0 -.57 .2207
Final Creek at Inspiration Dam, near Globe (09498400)................................................................ (») (») (>) (») (»)
Salt River near Roosevelt (09498500)......................... LOG/LOG 65.6 3.5 -.14 .5482
Salt River below Stewart Mountain Dam (09502000)................................................................ LIN/NR 3.0 <.01 .2189
Agua Fria River near Rock Springs (09512800)................................................................ No data collected at this site.
Agua Fria River below WaddeD Dam (09513600)................................................................ LIN/NR 11 .50 .1304
Gila River above diversions, at Gillespie Dam (09518000)................................................................ LOG/LOG 24.2 9.0 .01 .9604
Gila River near Dome (09520500).............................. LIN/LIN 18.1 6.0 .50 .3261
Gila River near mouth, near Yuma (09520700)............................................................... LOG/INV 36.8 10 -.15 .4831
'Data set consists of more than 50 percent of values reported as less than values.
66 Summary Statistics and Trend Analysis of Water-Quality Data at Sites In the Gila River Baaln

Table 22. Summary statistics for dissolved barium used in time-trend analysis [<, less than]
Station name and number
Gila River near Redrock, N. Mex. (09431500).........................................................
San Francisco River near Clifton (09444600).........................................................
Gila River at Calva (09466500) ...........................
Gila River at Winkelman (09470000) ..................
San Pedro River below Aravaipa Creek, near Mammoth (09473100) ......................................
Final Creek at Inspiration Dam, near Globe (09498400) ........................................................
Salt River near Roosevelt (09498500).................
Salt River below Stewart Mountain Dam (09502000).........................................................
Agua Fria River near Rock Springs (09512800)........................................................
Agua Fria River below Waddell Dam (09513600)..................................
Gila River above diversions, at Gillespie Dam (09518000) ................................................
Gila River near Dome (09520500).......................
Gila River near mouth, near Yuma (09520700) .........................................................
Num- Dissolved barium, In microgrsms ber per liter ^tan- .« dard
plea Mean MedisnMini mum
.. , devie' M8xi- tion mum
41 23.5 20.0 6.0 50.0 10.1
24 40.0 34.0 12.0 100 21.1
75 95.9 56.0 15.0 600 92.1
No data collected at this site.
22 66.4 63.0 29.0 130 21.6
24 47.8 26.8 12.0 200 48.9
47 47.7 . 39.4 15.0 200 32.6
61 57.5 52.0 37.0 240 31.4
No data collected at this site.
38 56.4 57.0 38.0 81.0 8.98
72 100 100 <1.0 500 84.7
11 128 100 55.0 200 69.6
20 137 100 60.0 500 121
Stan dard error
of mean
1.58
4.30
10.6
4.61
9.98
4.76
4.03
1.46
9.98
21.0
27.1
Summary Statistics and Results of Sessonsi Kendall Tau Teat 67
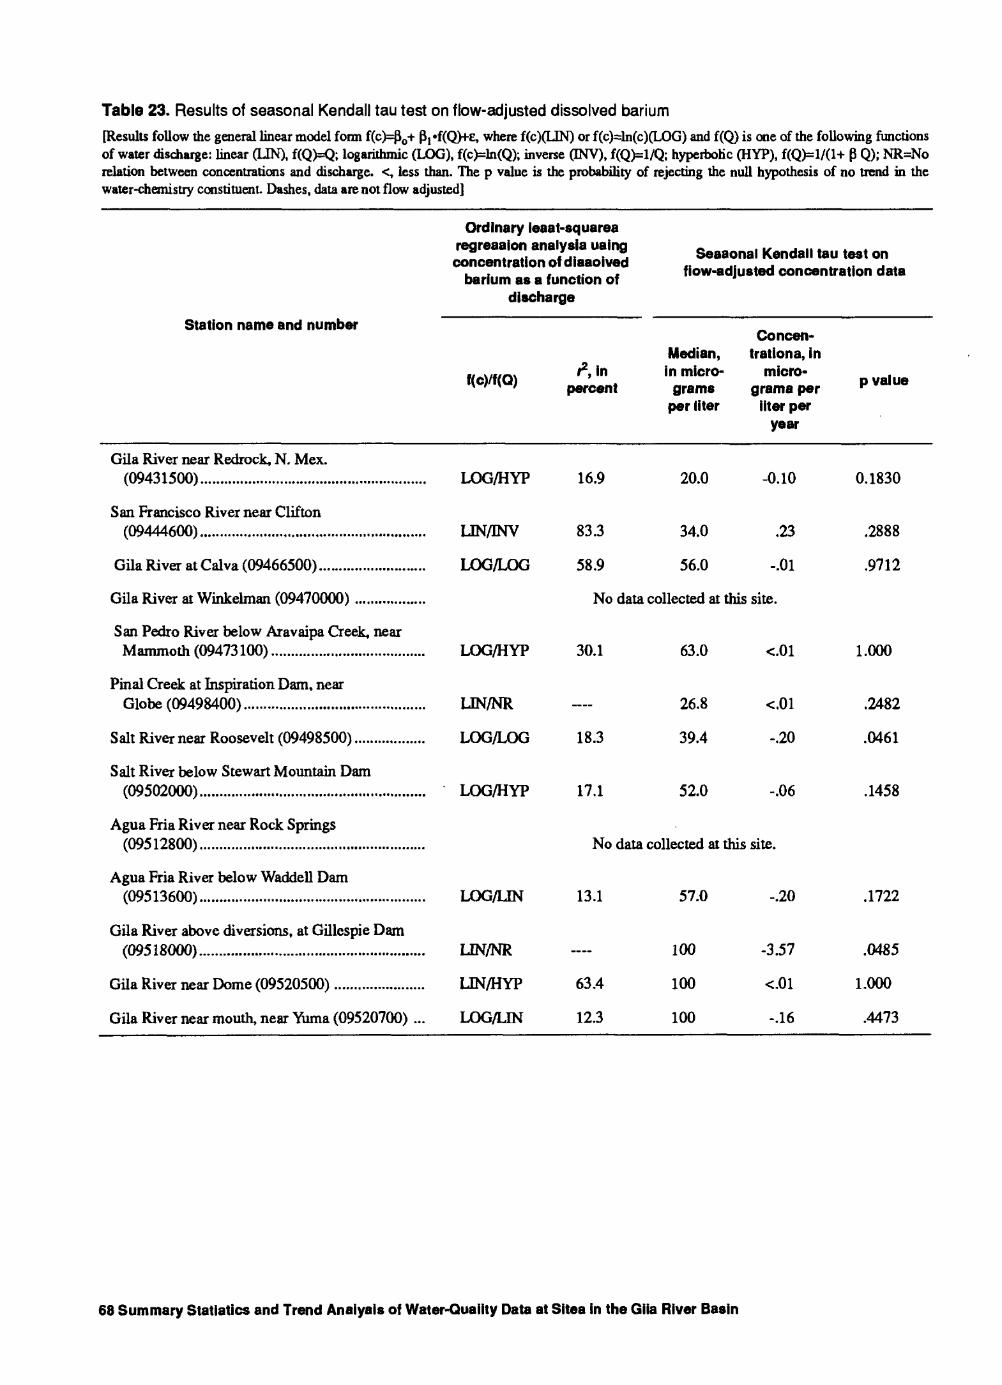
Table 23. Results of seasonal Kendall tau test on flow-adjusted dissolved barium
[Results follow the general linear model form f(c)=P0+ Pj-fCQ^E, where f(c)(LIN) or f(c)=ln(c)(LOG) and f(Q) is one of the following functions of water discharge: linear (LIN), f(Q)=Q; logarithmic (LOG), f(c)=ln(Q); inverse (INV), f(Q)=l/Q; hyperbolic (HYP), f(Q)=l/(l+ P Q); NR=No relation between concentrations and discharge. <, less than. The p value is the probability of rejecting the null hypothesis of no trend in the water-chemistry constituent Dashes, data are not flow adjusted]
Ordinary leaat-squarea regression analysis uaing concentration of diaaoived
barium as a function of discharge
Seaaonal Kendall tau test on flow-adjusted concentration data
Station name and number
Gila River near Redrock, N. Mex.(09431500) .................................................
San Francisco River near Clifton(09444600).................................................
Gila River atCalva (09466500)...................
Gila River at Winkelman (09470000)
«c)/f(Q)
LOG/HYP
LIN/INV
LOG/LOG
^.in percent
16.9
83.3
58.9
Median,in micro- grams
per liter
20.0
34.0
56.0
No data collected at this
Concen-trationa, in
micro- grama per
liter peryear
-0.10
.23
-.01
site.
p value
0.1830
.2888
.9712
San Pedro River below Aravaipa Creek, near Mammoth (09473100)...................................
Final Creek at Inspiration Dam, near Globe (09498400)...........................
Salt River near Roosevelt (09498500).
Salt River below Stewart Mountain Dam (09502000).............................................
LOG/HYP 30.1 63.0
LIN/NR - 26.8
LOG/LOG 18.3 39.4
LOG/HYP 17.1 52.0
-.20
-.06
Agua Fria River near Rock Springs (09512800).................................... No data collected at this site.
Agua Fria River below Waddell Dam (09513600) ....................................... LOG/UN 13.1
Gila River above diversions, at Gillespie Dam (09518000) .....................................................
Gila River near Dome (09520500) ....................
Gila River near mouth, near Yuma (09520700)
LIN/NR
LIN/HYP
LOG/UN
63.4
12.3
57.0
100
100
100
-.20
-3.57
-.16
1.000
.2482
.0461
.1458
.1722
.0485
1.000
.4473
68 Summary Statiatics and Trend Anaiyais of Water-Quality Data at Sitea in the Giia River Basin

Table 24. Summary statistics for total boron used in time-trend analysis
[Dashes, no value computed]
Station name and number
Gila River near Redrock, N. Mex. (09431500). ............................................
San Francisco River near Clifton (09444600)............................................,
Gila River at Calva (09466500) ...............
Gila River at Winkelman (09470000).............................................,
San Pedro River below Aravaipa Creek, near Mammoth (09473100). . .......
Final Creek at Inspiration Dam, near Globe (09498400) ..........................
Salt River near Roosevelt (09498500)..............................................
Salt River below Stewart Mountain Dam (09502000) .....................................
Agua Fria River near Rock Springs (09512800) .............................................
Agua Fria River below Waddell Dam (09513600) .....................................
Gila River above diversions, at Gillespie Dam (09518000)......................
Gila River near Dome (09520500)............
Gila River near mouth, near Yuma (09520700)..............................................
Num ber- of
aam- ples
2
45
64
43
7
12
65
2
79
38
38
11
Total boron, In micrograms per liter
Mean
40
151
674
249
273
99
275
185
155
115
2,310
618
MedianMini mum
Maxi mum
40 40 40.0
150 50 270
705 110 1,300
230 80 810
250 220 330
105 60 130
230 30 3,300
185 140 230
160 <10.0 300
110 60 200
2,000 180 22,000
No data collected at this site.
710 270 930
Stan dard
devia tion
47.6
355
144
43.1
20.2
398
51.6
29.8
3,380
226
Stan dard error
of mean
7.09
44.4
21.9
16.3
5.83
49.4
5.81
4.84
548
68.0
Summary Statistics and Results of Seaaonal Kendail Tau Test 69

Table 25. Results of seasonal Kendall tau test on flow-adjusted total boron
[Results follow the general linear model form f(c)=fJ0+ {J,»f(Q)+E, where f(c)(LIN) or f(c)=ln(c)(LOG) and f(Q) is one of the following functions of water discharge: linear (LJN), f(Q)=Q; logarithmic (LOG), f(c)=ln(Q); inverse (INV), f(O>l/Q; hyperbolic (HYP), f(O>l/(l+ 0 Q); NR=No relation between concentrations and discharge. <, less than. The p value is the probability of rejecting the null hypothesis of no trend in the water-chemistry constituent Dashes, data are not flow adjusted]
Station name and number
Ordinary leaat-aquaresregression analysis using
concentration of total boronaa a function of discharge
Seasonal Kendaii tau teat on flow-adjusted concentration data
f(c)/f(Q)
Concen-Median, trations
i2, in in micro- in micro- percent grams grama
per liter per liter per year
p value
Gila River near Redrock, N. Mex.(09431500) ..........................................................
San Francisco River near Clifton(09444600).......................................................... LIN/INV
Gila River at Calva (09466500)............................. LIN/HYP
Gila River at Winkelman (09470000)..................... LOG/UN
San Pedro River below Aravaipa Creek, near Mammoth (09473100) ................................
Final Creek at Inspiration Dam, near Globe (09498400)..........................................................
Salt River near Roosevelt (09498500).................... LOG/LOG
Salt River below Stewart Mountain Dam(09502000) ..........................................................
Agua Fria River near Rock Springs(09513800).......................................................... LIN/HYP
Agua Fria River below Waddell Dam(09513600).......................................................... UN/LOG
Gila River above diversions, at Gillespie Dam(09518000).......................................................... LOG/LOG
Gila River near Dome (09520500) .........................
Gila River near mouth, near Yuma(09520700)......................................................... LIN/LIN
Insufficient data.
51.4 150
65.0 705
24.2 230
Insufficient data.
Insufficient data.
55.4 230
Insufficient data.
-0.24
-.02
-.30
19.9
10.5
160
110
-.29
-.11
61.2 2,000 .06
No data collected at this site.
0.5163
.6235
.0315
.2450
87.6 710 -.17
<.0001
.1722
.6692
.7728
70 Summary Statistics and Trend Analyais of Water-Quality Data at Sites in the Giia River Baain

Table 26. Summary statistics for dissolved chromium used in time-trend analysis
[<, less than]
Station nsme and number
Gila River near Redrock, N. Mex. (09431500).....................................................
San Francisco River near Clifton (09444600) .....................................................
Gila River atCalva (09466500). .......................
Gila River at Winkelman (09470000)...............
San Pedro River below Aravaipa Creek, near Mammoth (09473100) ...........................
Final Creek at Inspiration Dam, near Globe (09498400) .........................................
Salt River near Roosevelt (09498500)..............
Salt River below Stewart Mountain Dam (09502000) ............................................
Agua Fria River near Rock Springs (09512800) ....................................................
Agua Fria River below Waddell Dam (09513600) .....................................................
Gila River above diversions, at Gillespie Dam (09518000).............................
Gila River near Dome (09520500)...................,
Gila River near mouth, near Yuma (09520700) .....................................................
Num ber of
sam ples
36
24
85
24
30
36
72
55
38
83
11
20
Dissolved chromium, in microgrsms per liter
Mean
0.41
.78
1.59
1.32
1.22
1.81
.94
.68
1.99
2.19
1.32
5.70
MedisnMini mum
Msxi- mum
0.02 <1.0 10.0
.67 <1.0 2.0
.56 <1.0 10.0
.42 <1.0 10.0
.31 <1.0 10.0
1.20 <1.0 5.0
.53 <1.0 10.0
.24 <1.0 10.0
No data collected at this site.
1.01 <1.0 10.0
1.00 <1.0 20.0
.14 <1.0 10.0
3.98 <1.0 20.0
Stsn- dsrd devls- tion
1.65
.45
2.81
2.20
2.50
1.30
1.35
1.50
2.62
3.17
2.95
4.53
Stan- dsrd error
of mean
0.28
.09
.30
.45
5.48
.32
.16
.20
.43
.35
.89
1.01
Summsry Statistics snd Results of Seasonal Kendsll Tsu Test 71

Table 27. Results of seasonal Kendall tau test on flow-adjusted dissolved chromium[Results follow the general linear model form f(c)=P0+ p, *f(Q)+e, where f(c)(UN) or f (c) = ln(c)(LOG) and f (Q) is one of the following functions of water discharge: linear (LIN), f(Q)=Q; logarithmic (LOG), f(c)=ln(Q); inverse (INV), f(Q>l/Q; hyperbolic (HYP), f(Q) = !/(!+ P Q); NR=No relation between concentrations and discharge. The p value is the probability of rejecting the null hypothesis of no trend in the water-chemistry constituent. Dashes, data are not flow adjusted]
Station name snd number
Ordinary least-squsresregression snalysis usingconcentration of dissolvedchromium as a function of
dischsrge
Sessonsl Kendsil tau test on flow-adjusted concentration data
f(c)/f(Q) i*, in percent
Median, in micro-
grams per liter
Concen trations in
micro- grsms per
liter per year
p value
Gila River near Redrock, N. Mex. (09431500).................................................... IIN/NR
San Francisco River near Clifton (09444600).................................................... 1IN/NR
Gila River at Calva (09466500)........................ 1IN/NR
Gila River at Winkelman (09470000)..............
San Pedro River below Aravaipa Creek, near Mammoth (09473100)........................... 1IN/NR
Final Creek at Inspiration Dam, near Globe (09498400).......................................... 1IN/HYP
Salt River near Roosevelt (09498500).............. UN/NR
Salt River below Stewart Mountain Dam (09502000).................................................... UN/NR
Agua Fria River near Rock Springs (09512800) ....................................................
Agua Fria River below Waddell Dam (09513600).................................................... UN/NR
Gila River above diversions, at Gillespie Dam (09518000)............................ UN/NR
Gila River near Dome (09520500)...................
Gila River near mouth, near Yuma 09520700)..................................................... UN/NR
21.5
0.02
.67
.56
Insufficient data.
.31
1.20
.53
None1
None1
None 1
None1
Increasing1
None1
.24 Increasing 1
No data collected at this site.
1.01 None
1.00 Increasing1
Insufficient data.
3.98 None1
0.8445
.1336
.9542
.8700
.0005
.8030
.0592
.2644
.0549
.7303
'Trend-slope estimate not reported because of more than 50 percent less than values in the data set.
72 Summary Statistics snd Trend Anslysis of Wster-Qusiity Osta at Sites in the Gils River Basin

Table 28. Summary statistics for suspended copper used in time-trend analysis[<, less than]
Station name and number
Gila River near Redrock, N. Mex. (09431500)..................................................
San Francisco River near Clifton (09444600)..................................................
Gila River at Calva (09466500) ......................
Gila River at Winkelman (09470000).............
San Pedro River below Aravaipa Creek, near Mammoth (09473100).................................
Final Creek at Inspiration Dam, near Globe (09498400) .......................................
Salt River near Roosevelt (09498500) .............
Salt River below Stewart Mountain Dam (09502000)..................................................
Agua Fria River near Rock Springs (09512800) .................................................
Agua Fria River below Waddell Dam (09513600)..................................................
Gila River above diversions, at Gillespie Dam (09518000)..........................................
Gila River near Dome (09520500)..................
Gila River near mouth, near Yuma (09520700)..................................................
Num ber cf
ssm- pies
16
6
31
8
8
8
4
26
17
26
27
Suspended copper, in micrcgrsms per liter
Mean
40.4
27.7
137
20.2
6.75
155
45.7
5.31
6.58
19.2
23.6
MedianMini mum
Maxi mum
10.0 <1 410
22.0 3.0 63.0
20.0 <5 1,500
18.0 10.0 31.0
5.5 <1 16.0
76.0 40.0 490
45.0 23.0 70.0
3.0 <1 19.0
No data collected at this site.
4.0 <1 26.0
10.0 <1 170
No data collected at this site.
7.0 <1 440
Stan dard
devia tion
101
21.5
317
7.34
6.09
171
22.8
5.26
7.20
33.8
83.4
Stan dard error
of mean
25.2
8.77
56.9
2.60
2.15
60.5
11.4
1.03
1.75
6.63
16.1
Summsry Statistics and Resuits cf Seascnsl Kendaii Tau Test 73

Table 29. Results of seasonal Kendall tau test on flow-adjusted suspended copper[Results follow the general linear model form f(c)=P0+ PVf(QHe, where f(c)(IIN) or f (c) = ln(c)(LOG) and f(Q) is one of the following functions of water discharge: linear (UN), f(Q) = Q; logarithmic (LOG), f(c)=ta(Q); inverse (INV). f(Q>l/Q; hyperbolic (HYP), f(Q)=l/(l + P Q); NR=No relation between concentrations and discharge. The p value is the probability of rejecting the null hypothesis of no trend in the water-chemistry constituent. Dashes, data are not flow adjusted]
Ordinary ieaat-»quarearegression analysis uaing
concentration of suspendedcopper as a function of
discharge
Seaaonai Kendaii tau teat on fiow-adjuated concentration data
Station name and number
f(c)/f(Q)
Concen-Medlan, trationa
i2, In in micro- in micro- percent grams grama
per liter per liter per year
p value
Gila River near Redrock, N. Mex. (09431500)................................................
San Francisco River near Clifton (09444600)................................................
Gila River at Calva (09466500)....................
Gila River at Winkelman (09470000)..........
San Pedro River below Aravaipa Creek, near Mammoth (09473100).......................
Final Creek at Inspiration Dam, near Globe (09498400) ................................................
Salt River near Roosevelt (09498500) ..........
Salt River below Stewart Mountain Dam (09502000)........................................
Agua Fria River near Rock Springs (09512800) ................................................
Agua Fria River below Waddell Dam (09513600)................................................
Gila River above diversions, at Gillespie Dam (09518000)........................................
Gila River near Dome (09520500) ...............
Gila River near mouth, near Yuma (09520700) ...............................................
LJN/LIN
LOG/HYP
39.5 10.0
LJN/NR
LJN/NR
LOG/HYP
LJN/NR
Insufficient data.
64.3 20.0
Insufficient data.
Insufficient data.
Insufficient data.
Insufficient data.
3.0
No data collected at this site.
4.0
0.01
.06
1.000
.8882
.7237
-.75
10.7 10.0 -.11
No data collected at this site.
7.0 -.88
.4884
.4636
.2587
74 Summary Statistics and Trend Anaiyaia of Water-Quality Data at Sites in tha Giia River Baain

Table 30. Summary statistics for total copper used in time-trend analysis[<, less than]
Station name and number
Gila River near Redrock, N. Mex. (09431500) ..................
San Francisco River near Clifton (09444600).. ..................
Gila River at Calva (09466500) .....
Gila River at Winkelman (09470000).................................
San Pedro River below Aravaipa Creek, near Mammoth (09473100).................................
Final Creek at Inspiration Dam, near Globe (09498400) ..............
Salt River near Roosevelt (09498500).................................
Salt River below Stewart Mountain Darn (09502000)........
Agua Fria River near Rock Springs (09512800) ................................
Agua Fria River below WaddellDam (09513600)..........
Gila River above diversions, at Gillespie Darn (09518000).........
Gila River near Dome (09520500) .................................
Gila River near mouth, near Yuma (09520700).......................
Num ber - of
sam ples
19
110
124
83
22
98
147
62
80
38
128
29
Total copper, in micrograms per liter
Mean
37.2
229
152
71.2
159
269
32.3
7.86
63.0
10.3
25.8
23.7
MedianMini mum
Maxi mum
7.76 3.0 420
26.5 <1 10,000
43.0 <1 3,200
30.0 <1 1,500
14.5 <1 3,100
95.0 <1 2,000
12.0 <1 700
6.0 <1 22.0
7.0 2.0 2,900
9.0 4.0 33.0
15.0 <1 170
No data collected at this site.
7.0 2.0 440
Standard
devia tion
94.9
1,060
361
202
657
411
67.6
4.78
357
5.90
30.9
80.3
Stan dard error
of mean
21.8
101
32.4
22.2
140
41.5
5.58
.61
39.9
96
2.73
14.9
Summary Statistics and Results of Seasonal Kendall Tau Test 75

Table 31 . Results of seasonal Kendall tau test on flow-adjusted total copper[Results follow the general linear model form f(c)=P0+ (J,«f(Q)+e, where f(c)(LEN) or f(c)=ln(c)(LOG) and f(Q) is one of the following functions of water discharge: linear (LIN), f(Q)=Q; logarithmic (LOG), f(c)=ln(Q); inverse (INV), f(O>l/Q; hyperbolic (HYP), f(O>l/(l+ P Q); NR = No relation between concentrations and discharge. The p value is the probability of rejecting the null hypothesis of no trend in the water-chemistry constituent Dashes, data are not flow adjusted]
Ordinary least-squaresregression analysis using
concentration total copper ss sfunction of discharge
Seasonal Kendsll tau test on flow-adjusted concentration data
Station nsme and number
f(c)/«Q)
Concen-Median, tratlons,
i2 , In In micro- In mlcro-parcent grsms grams
per liter per literper year
p vslue
Gila River near Redrock, N. Mex.(09431500) .........................................
San Francisco River near Clifton(09444600)........................................,
Gila River at Calva (09466500)...............
Gila River at Winkelman (09470000) .....
San Pedro River below Aravaipa Creek, near Mammoth (09473100).................
Final Creek at Inspiration Dam, near Globe (09498400)................................
Salt River near Roosevelt (09498500).....
Salt River below Stewart Mountain Dam (09502000).................................
Agua Fria River near Rock Springs (09512800) ..........................................
Agua Fria River below Waddell Dam (09513600) ..........................................
Gila River above diversions, atGillespie Dam (09518000)..................
Gila River near Dome (09520500)..........
Gila River near mouth, near Yuma (09520700) .........................................
LIN/LIN
LOG/LOG
LOG/HYP
LOG/LOG
LOG/HYP
LIN/HYP
LIN/NR
LIN/NR
LOG/HYP
LIN/NR
LIN/NR
LIN/NR
41.3
17.0
43.4
14.6
48.5
35.3
23.7
7.76
26.5
43.0
30.0
14.5
95.0
700
6.0
7.0
9.0
0.01
.05
-.04
.05
.63
-.04
-.15
.08
-.63
15.0 -.04
No data collected at this site.
7.0 -1.25
0.6674
.3266
.4196
.7701
.6056
.0597
.6184
.5815
.9073
.0327
.1001
.0001
76 Summary Statistics and Trend Anslysis of Water-Quality Data st Sites in the Gila River Basin

Table 32. Summary statistics for dissolved lead used in time-trend analysis[<, less than. Dashes, no value computed]
Num- Dissolved lead, in mlcrograma per liter >._.
Station name and number
Gila River near Redrock, N. Mex. (09431500)..................................................
San Francisco River near Clifton (09444600)...................................................
Gila River at Calva (09466500) .......................
Gila River at Winkelman (09470000) ...................................................
San Pedro River below Aravaipa Creek, near Mammoth (09473100) ..............
Final Creek at Inspiration Dam, near Globe (09498400) ........................................
Salt River near Roosevelt (09498500) .............
Salt River below Stewart Mountain Dam (09502000)...........................................
Agua Fria River near Rock Springs (09512800) ..................................................
Agua Fria River below Waddell Dam (09513600) ...................................................
Gila River above diversions, at Gillespie Dam (09518000)...........................
Gila River near Dome (09520500)...................
Gila River near mouth, near Yuma (09520700) ........................... ........................
of aam- Mean pies
41 1.39
61 1.52
95 341
37 1.69
33 1.46
60 1.53
84 1.76
64 2.92
38 1.62
98 1.27
25 6.30
Median Mini' mum
1.00 <1.0
1.00 <1.0
1.00 <1.0
1.00 <1.0
1.00 <1.0
1.00 <1.0
1.00 <1.0
1.00 <1.0
No data collected
1.00 <1.0
.66 <1.0
2.0 <1.0
Maxi mum
5.00
12.0
70.0
11.0
5.00
7.00
12.0
60.0
at this site.
16.0
12.0
7.00
74.0
Stan dard
devia tion
1.07
1.86
8.78
2.30
1.20
1.59
2.04
7.69
2.66
1.73
15.2
Stan dard error
of mean
0.17
.24
.91
.38
.21
.20
.22
.96
.43
.17
3.04
Summary Statistics and Results of Seasonal Kendall Tau Test 77

Table 33. Results of seasonal Kendall tau test on flow-adjusted dissolved lead
[Results follow the general linear model form f(c) = P0 + pVf(Q) + e, where f(c) (LJN) or f(c) = ln(c) (LOG) and f(Q) is one of the following functions of water discharge: linear (UN), f(Q) = Q; logarithmic (LOG), f (c) = ln(Q); inverse (INV), f(Q) = 1/Q; hyperbolic (HYP), f(Q) = !/(! + P Q) NR = No rekdon between concentrations and discharge. The p value is the probability of rejecting the null hypothesis of no trend in the water-chemistry constituent Dashes, data are not flow adjusted]
Ordinary least-squsresregression snslysis usingconcentration of dissolved
lead ss s function of discharge
Sessonsl Kendsll tau test on flow-sdjusted concentration data
Station name and number
I2, in percent
Medisn, in micro-
grams per liter
Concen trations, in micro-
grams per liter per year
p vslue
Gila River near Redrock, N. Mex. (09431500)................................................ UN/MR
San Francisco River near Clifton (09444600)................................................ LIN/NR
Gila River at Calva (09466500).................. LOG/LOG
Gila River at Winkelman (09470000)......... LIN/NR
San Pedro River below Aravaipa Creek, near Mammoth (09473100)...................... LIN/NR
Final Creek at Inspiration Dam, near Globe (09498400)................................................ LIN/NR
Salt River near Roosevelt (09498500)......... LIN/NR
Salt River below Stewart Mountain Dam (09502000)................................................ LIN/NR
Agua Fria River near Rock Springs (09512800) ................................................
Agua Fria River below Waddell Dam (09513600)................................................ LIN/NR
Gila River above diversions, at Gillespie Dam (09518000)........................ LIN/NR
Gila River near Dome (09520500)..............
Gila River near mouth, near Yuma (09520700) ............................................... LIN/NR
12.0
1.00
1.00
1.00
1.00
1.00
1.00
1.00
None1
Decreasing 1
Decreasing 1
None1
None1
Decreasing 1
Decreasing 1
1.00 Decreasing 1
No data collected at this site
1.00
.66
Insufficient data.
2.00
None1
Decreasing 1
None'
0.3580
.0005
.0095
1.000
.8918
.0003
.0190
.0320
.9087
.0171
.1007
1Trend-slope estimate not reported because of more than SO percent less than values in the data set
78 Summary Statistics and Trend Analysis of Water-Quslity Data at Sites in the Gils River Bssln

Table 34. Summary statistics for total lead used in time-trend analysis[<, less than]
Station name and number
Gila River near Redrock, N. Mex. (09431500) ......................................................
San Francisco River near Clifton (09444600)..........................................
Gila River atCalva (09466500)........................,
Gila River at Winkelman (09470000)......................................................,
San Pedro River below Aravaipa Creek, near Mammoth (09473100)..................
Final Creek at Inspiration Dam, near Globe (09498400) ...........................................
Salt River near Roosevelt (09498500)...............
Salt River below Stewart Mountain Dam (09502000) ..............................................
Agua Fria River near Rock Springs (09512800) ......................................................
Agua Fria River below Waddell Dam (09513600) .......................................................
Gila River above diversions, at Gillespie Dam (09518000)...............................
Gila River near Dome (09520500).....................
Gila River near mouth, near Yuma (09520700).......................................................
Num ber of aam- pies
23
75
121
49
14
64
113
62
81
38
100
29
Total lead, In micrograms per liter
Mean
20.1
11.8
26.6
48.5
94.6
8.68
13.3
6.04
17.1
4.89
14.9
15.0
MedianMini mum
Maxi mum
5.0 <1.0 330
5.5 <2.0 84.0
8.0 <1.0 400
8.0 <1.0 700
5.0 <1.0 790
3.4 <1.0 60.0
4.1 <1.0 200
2.7 <1.0 98.0
2.0 <1.0 930
3.0 <1.0 77.0
4.2 <1.0 440
No data collected at this site.
7.2 <1.0 200
Stan dard
devia tion
67.8
16.4
54.5
128
234
12.9
26.7
14.0
104
12.3
50.0
36.4
Stan dard error
of mean
14.1
1.89
4.95
18.3
62.5
1.61
2.51
1.78
11.6
2.00
5.00
6.76
Summary Statistics and Results of Seasonal Kendall Tau Test 79

Table 35. Results of seasonal Kendall tau test on flow-adjusted total lead
[Results follow the general linear model form f(c)=P0+ fa -f(Q)+e, where f(c)(LIN) or f(c)=ln(c)(LOG) and f(Q) is one of the following functions of water discharge: linear (UN), f(Q)=Q; logarithmic (LOG), f(c) = m(Q); inverse (TNV), f(Q)=l/Q; hyperbolic (HYP), f(Q)=l/(l+ p" Q); NR=No relation between concentrations and discharge. The p value is the probability of rejecting the null hypothesis of no trend in the water-chemistry constituent. Dashes, data is not flow adjusted]
Station name and numbsr
Ordinary leaat-squares regression analysis using concentration of total lead as a function of diacharge
Seasonal Kendall tau test on flow-adjuated concentration data
f(c)/f(Q) i2 , In percent
Median, in micro-
grams per liter
Concen trations, in micro-
grams per liter per year
p value
Gila River near Redrock, N. Mex. (09431500)............................................................. LOG/LOG 13.9 5.0 0.19
San Francisco River near Clifton (09444600)............................................................. LOG/LOG 27.0 5.5 .05
Gila River at Calva (09466500)................................ LOG/HYP 36.0 8.0 .05
Gila River at Winkelman (09470000)...................... LOG/UN 23.6 8.0 .04
San Pedro River below Aravaipa Creek, near Mammoth (09473100)................................... LOG/LOG 62.6 5.0 -.41
Final Creek at Inspiration Dam, near Globe (09498400).................................................. LIN/LIN 44.8 3.4 -.06
Salt River near Roosevelt (09498500)...................... LIN/NR - 4.1 -.29
Salt River below Stewart Mountain Dam (09502000).................................................... LIN/NR - 2.7 None
Agua Fria River near Rock Springs (09512800)............................................................. LOG/HYP 17.6 2.0 -.05
Agua Fria River below Waddell Dam (09513600)............................................................. LIN/NR - 3.0 -.32
Gila River above diversions, at Gillespie Dam (09518000).................................................... LOG/LIN 31.4 4.2 -.07
Gila River near Dome (09520500)........................... No data collected at this site.
Gila River near mouth, near Yuma (09520700) ............................................................ LOG/HYP 17.6 7.2 .41
0.0610
.7056
.6662
.7115
.1017
.0395
.1921
.3241
.4150
.5216
.1393
.0178
'Trend-slope estimate not reported because of more than SO percent less than values in the data set.
80 Summary Statistics and Trend Analysis of Water-Quality Data at Sites In the Gila River Basin

Table 36. Summary statistics for total manganese used in time-trend analysis[<, less than]
Station name and number
Gila River near Redrock, N. Mex. (09431500) ...................................
San Francisco River near Clifton (09444600) ...................................
Gila River at Calva (09466500) .....
Gila River at Winkelman (09470000) ...................................
San Pedro River below Aravaipa Creek, near Mammoth (09473100)...................................
Final Creek at Inspiration Dam, near Globe (09498400) ...............
Salt River near Roosevelt (09498500) ...................................
Salt River below Stewart Mountain Dam (09502000) ..........................
Agua Fria River near Rock Springs (09512800) ..................................
Agua Fria River below Waddell Dam (09513600) ..........................
Gila River above diversions, at Gillespie Dam (09518000)...........
Gila River near Dome (09520500)...................................
Gila River near mouth, near Yuma (09520700) ........................
Num ber of
sam- plea
19
69
116
36
8
52
101
63
81
38
88
29
Total manganese, in mlcrograma per liter
Mean
685
321
953
706
1,730
19,900
324
39.1
729
214
237
737
MedianMini mum
Maxi mum
40 8.0 11,000
110 10.0 3,900
300 8.0 11,000
245 20.0 11,000
120 40.0 13,000
21,500 680 41,000
220 <10 5,200
30.0 <10 170
30.0 10.0 35,000
205 70.0 490
170 40.0 1,800
No data collected at this site.
730 150 1,400
Stan dard
devia tion
2,500
751
1,920
1,830
4,550
11,700
551
31.4
4,120
120
247
302
Stan dard error
of mesn
574
90.4
178
305
1,610
1,630
54.8
3.95
458
19.4
26.3
56.1
Summary Statistics and Results of Seaaonal Kendall Tau Teat 81

Table 37. Results of seasonal Kendall tau test on flow-adjusted total manganese[Results follow the general linear model form f(c)=B0+B,«f(Q)+e, where f(c)(LJN) or f(c)=m(c)(LOG) and f(Q) is one of the following functions of water discharge: linear (UN), f(Q)=Q; logarithmic (LOG), f(c)=m(Q); inverse (INV), f(Q>l/Q; hyperbolic (HYP), f(Q)=l/(l+ B Q); NR=No relation between concentrations and discharge. The p value is the probability of rejecting the null hypothesis of no trend in the water-chemistry constituent. Dashes, data are not flow adjusted]
Ordinary least-squares
TSSSSAT1 . T?" "7r -.« .<,«.... function of flo».d|u.»d eono^MUor d.B discharge
Station name and number
Gila River near Redrock, N. Mex. (09431500)........................................................
San Francisco River near Clifton (09444600)........................................................
Gila River at Calva (09466500). .........................
Gila River at Winkelman (09470000) .................
San Pedro River below Aravaipa Creek, near Mammoth (09473 100) ......................................
Final Creek at Inspiration Dam, near Globe (09498400) .............................................
Salt River near Roosevelt (09498500)
Salt River below Stewart Mountain Dam (09502000) ...............................................
Agua Fria River near Rock Springs (09512800) ........................................................
Agua Fria River below Waddell Dam (09513600) ........................................................
Gila River above diversions, at Gillespie Dam (09518000)................................
Gila River near Dome (09520500) ......................
Gila River near mouth, near Yuma (09520700) .......................................................
Concen- Medlan, trations,
ff VffQl '2' in 'n micro" in mlcro- ^c' ^ ' percent grama grams per
per liter liter per year
LOG/LOG 20.4 40 0.04
LOG/UN 21.0 110 -.15
LOG/HYP 30.1 300 -.10
LOG/HYP 11.6 245 .04
Insufficient data.
LIN/INV 42.6 21,500 .70
LIN/NR 220 35.0
LIN/NR 30.0 -2.50
LIN/HYP 17.0 30.0 .01
LIN/HYP 10.9 205 -.03
LOG/LOG 15.8 170 -.22
No data collected at this site.
LOG/LOG 74.5 730 -.44
p value
0.4818
.0971
.0050
.6025
<.0001
.0076
.0029
.0074
.7527
.0068
.0031
82 Summary Statistics and Trend Analyaia of Water-Quality Data at Sitea In the Gila River Baain

Table 38. Summary statistics for dissolved zinc used in time-trend analysis[<, less than]
Station name and number
Gila River near Redrock, N. Mex. (09431500) .........................................
San Francisco River near Clifton (09444600) .........................................
Gila River at Calva (09466500) ...........
Gila River at Winkelman (09470000)..
San Pedro River below Aravaipa Creek, near Mammoth (09473100)....
Final Creek at Inspiration Dam, near Globe (09498400) .............................
Salt River near Roosevelt (09498500) .........................................
Salt River below Stewart Mountain Dam (09502000) ................................
Agua Fria River near Rock Springs (09512800) ........................................
Agua Fria River below Waddell Dam (09513600)..................
Gila River above diversions, at Gillespie Dam (09518000).................
Gila River near Dome (09520500).......
Gila River near mouth, near Yuma (09520700) .........................................
Num ber of
sam ples
44
65
96
36
31
84
96
67
38
77
11
29
Dissolved zinc, in microgrsms per liter
Mean
11.8
. 32.7
20.5
12.0
17.8
29.2
13.5
13.4
11.4
17.5
15.3
28.5
Median
8.0
10.0
11.5
10.0
11.0
Mini mum
<3.0
<3.0
<3.0
<3.0
4.0
Maxi mum
1,280
600
210
50.0
60.0
20.0 10.0 120
10.0 <3.0 100
8.0 <3.0 120
No data collected at this site.
10.0 <3.0 40.0
20.0 <3.0 60.0
10.2 <10.0 50.0
10.0 <3.0 430
Stan dard
devia tion
11.4
82.2
26.0
9.38
14.1
16.6
15.1
17.8
7.20
11.2
12.8
77.8
Stan dard error
of mean
1.72
10.2
2.65
1.56
2.53
1.81
1.54
2.17
1.17
1.46
3.86
14.4
Summary Statistics and Results of Seasonal Kendail Tau Test 83

Table 39. Results of seasonal Kendall tau test on flow-adjusted dissolved zinc
[Results follow the general linear model form f(c)=P0+ P,«f(Q)+E, where f(c)(LIN) or f(c)=ln(c)(LOG) and f(Q) is one of the following functions of water discharge: linear (UN), f(Q)=Q; logarithmic (LOG), f(c)=ln(Q); inverse (INV), f(Q)=l/Q; hyperbolic (HYP), f(Q>l/(l= p Q); NR=No relation between concentrations and discharge. The p value is the probability of rejecting the null hypothesis of no trend in the water-chemistry constituent. Dashes, data are not flow adjusted]
Ordinary least-squaresregression analysis using
concentration of dissolved zincss a function of discharge
Sessonal Kendsll tsu test on flow-sdjusted concentration dats
Ststion nsme snd number
f(o)/f(Q)
Concen-Medisn, trstions, in
i2, in in mioro- micro- percent grsms grams per
per liter liter per yesr
p value
Gila River near Redrock, N. Mex. (09431500)...................................................... LIN/LOG 13.3
San Francisco River near Clifton (09444600)...................................................... LOG/UN 15.3
Gila River at Calva (09466500)........................ LIN/NR
Gila River at Winkelman (09470000)............... LIN/NR
San Pedro River below Aravaipa Creek, near Mammoth (09473100)............................ LIN/NR
Final Creek at Inspiration Dam, near Globe (09498400)........................................... LIN/NR
Salt River near Roosevelt (09498500)............... LIN/NR
Salt River below Stewart Mountain Dam (09502000)............................................. LOG/HYP 10.7
Agua Fria River near Rock Springs (09512800) ......................................................
Agua Fria River below Waddell Dam (09513600)...................................................... LOG/INV 15.0
Gila River above diversions, at Gillespie Dam (09518000)............................................. LIN/NR
Gila River near Dome (09520500).................... LOG/HYP 10.3
Gila River near mouth, near Yuma (09520700) ..................................................... LOG/HYP 15.3
8.0
10.0
11.5
10.0
11.0
-0.03
-.53
-.63
1.0
-2.50
20.0 <.01
10.0 -1.67
8.0 .23
No data collected at this site.
10.0 -.27
20.0 <.01
10.2 .83
10.0 .19
0.4706
.0014
.3080
1.0000
.0102
.3032
.0001
.1882
.4623
.5826
.3261
.6568
84 Summary Statistics and Trend Analysis of Water-Quality Dats st Sites in the Gils River Basin
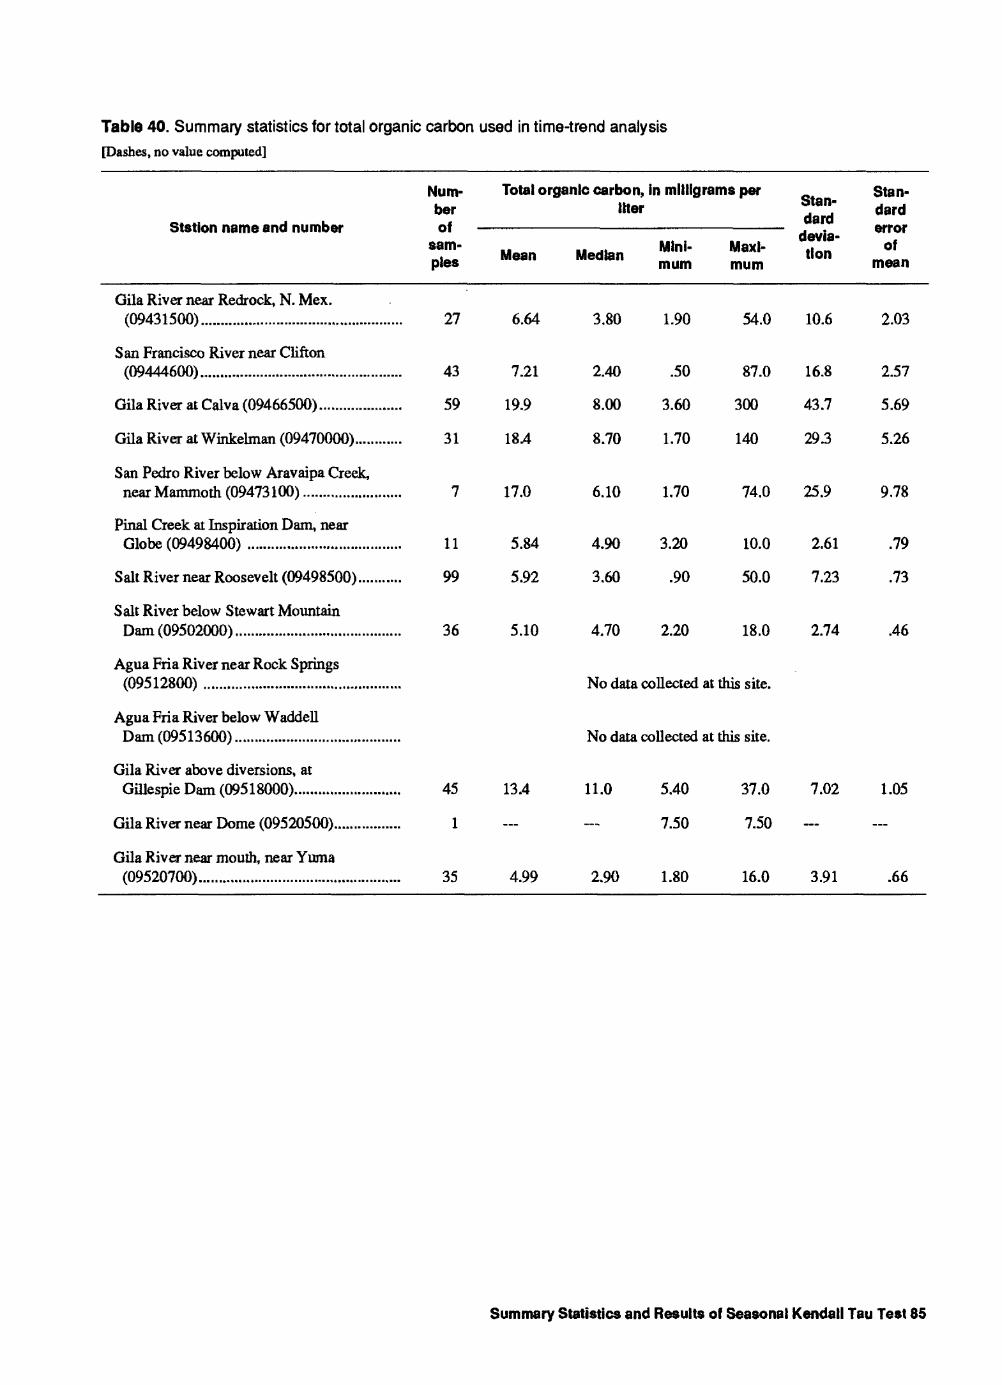
Table 40. Summary statistics for total organic carbon used in time-trend analysis[Dashes, no value computed]
Ststion name and number
Gila River near Redrock, N. Mex. (09431500)...................................................
San Francisco River near Clifton (09444600)...................................................
Gila River at Calva (09466500)... ..................
Gila River at Winkelman (09470000)............
San Pedro River below Aravaipa Creek, near Mammoth (09473100) .........................
Final Creek at Inspiration Dam, near Globe (09498400) .......................................
Salt River near Roosevelt (09498500)...........
Salt River below Stewart Mountain Dam (09502000) ..........................................
Agua Fria River near Rock Springs (09512800) ..................................................
Agua Fria River below Waddell Dam (09513600) ..........................................
Gila River above diversions, at Gillespie Dam (09518000)...........................
Gila River near Dome (09520500).................
Gila River near mouth, near Yuma (09520700)...................................................
Num- Total organic carbon, in milligrams per her liter flan- _. <*ard
sam-niA» Mean Median pies
Mini- mum
devia-Max|- tion mum
27 6.64 3.80 1.90 54.0 10.6
43 7.21 2.40 .50 87.0 16.8
59 19.9 8.00 3.60 300 43.7
31 184 8.70 1.70 140 29.3
7 17.0 6.10 1.70 74.0 25.9
11 5.84 4.90 3.20 10.0 2.61
99 5.92 3.60 .90 50.0 7.23
36 5.10 4.70 2.20 18.0 2.74
No data collected at this site.
No data collected at this site.
45 13.4 11.0 5.40 37.0 7.02
1 7.50 7.50
35 4.99 2.90 1.80 16.0 3.91
Stan dard error
of mean
2.03
2.57
5.69
5.26
9.78
.79
.73
.46
1.05
.66
Summary Statistics and Results of Seasonal Kendali Tau Test 85

Table 41. Results of seasonal Kendall tau test on flow-adjusted total organic carbon[Results follow the general linear model form f(c)=P0+ p\ «f(Q)+e, where f(c)(LJN) or f(c)=ln(c)(LOG) and f(Q) is one of the following functions of water discharge: linear (UN), f(Q)=Q; logarithmic (LOG), f(c)=ln(Q); inverse (INV), f(Q)=l/Q; hyperbolic (HYP), f(Q>l/(l+P Q); NR=No relation between concentrations and discharge. The p value is the probability of rejecting the null hypothesis of no trend in the water-chemistry constituent Dashes, data are not flow adjusted]
Station name and number
Ordinary ieaat-aquares regreaaion analysis uaing
concentration of totalorganic carbon aa a function
of discharge
Seasonal Kendaii tau teat on flow-adjusted concentration data
f(o)/f(Q)i2, in
percent
Median, inmilligrams
per liter
Concen- trationa, in miiii- grama
per liter per year
p value
Gila River near Redrock, N. Mex. (09431500)...................................................... LOG/INV 18.7 3.80 0.14 0.6967
San Francisco River near Clifton (09444600)...................................................... LOG/LOG 18.0 2.40 .01 .8984
Gila River at Calva (09466500)......................... LJN/HYP 16.3 8.00 .02 .2083
Gila River at Winkelman (09470000)............... LOG/HYP 12.5 8.70 -.16 .2801
San Pedro River below Aravaipa Creek, near Mammoth (09473100)............................ Insufficient data.
Final Creek at Inspiration Dam, near Globe (09498400)........................................... Insufficient data.
Salt River near Roosevelt (09498500)............... LJN/NR 3.60 .04 .8301
Salt River below Stewart Mountain Dam (09502000)............................................. LJN/NR 4.70 .26 .0790
Agua Fria River near Rock Springs (09512800)...................................................... No data collected at this site.
Agua Fria River below Waddell Dam (09513600)............................................. No data collected at this site.
Gila River above diversions, at Gillespie Dam (09518000).............................. LJN/NR 11.0 .09 .9559
Gila River near Dome (09520500).................... Insufficient data.
Gila River near mouth, near Yuma (09520700) ..................................................... LOG/LOG 51.1 2.90 <.01 1.000
86 Summary Statiatics and Trend Anaiyais of Water-Quality Data at Sites in the Gila River Baain