summative evaluation of the schools for idp … · 1 annex b: external impact evaluation report...
TRANSCRIPT
1
Annex B: External Impact Evaluation Report
Summative Evaluation of the Schools for
IDP Resettlement in Katakwi (SIRK)
Project, Uganda (GR002-A00279)
Prepared for Comic Relief
February 2015
Martin Prew
University of Witwatersrand School of Education
2
Contents Contents .................................................................................................................................................. 2
Acronyms and Glossary ........................................................................................................................... 3
1. Executive Summary............................................................................................................................ 4
2. Introduction ....................................................................................................................................... 5
3. The Project ......................................................................................................................................... 5
3.1 Katakwi District ............................................................................................................................. 6
3.2 SIRK ............................................................................................................................................... 7
4. Evaluation Methodology .................................................................................................................... 9
4.1 Introduction .................................................................................................................................. 9
4.2 School Performance Review (SPR) ................................................................................................ 9
4.3 Project Impact Data Collection ..................................................................................................... 9
5. Profile of the Schools Visited for the Evaluation ............................................................................. 11
6. Findings: SPR Comparison of 2010 and 2014 Data .......................................................................... 13
7. Findings: Governance, Management, Teacher Training & Support ................................................ 18
7.1 Training Programmes .................................................................................................................. 18
7.2 Impact of the Learning-focused Interventions ........................................................................... 20
8. Impact of the Agricultural-focused Interventions ........................................................................... 22
9. Findings: The Theory of Change and Achievement of the Key Proposed Outcomes ...................... 25
10. Findings: Relationship between the District & Project Team .......................................................... 27
11. Challenges to the Intervention Programme .................................................................................... 28
11.1 Introduction .............................................................................................................................. 28
11.2 Relations between LCD and Comic Relief (CR).......................................................................... 28
11.3 School Level Challenges ............................................................................................................ 29
12. Conclusions ...................................................................................................................................... 31
12.1 To what extent were the project outcomes achieved? ............................................................ 31
12.2 How has the project made a difference? .................................................................................. 32
13. Recommendations ........................................................................................................................... 33
References ............................................................................................................................................ 34
Annex A: List of People Interviewed during the Evaluation ................................................................. 35
Annex B: Evaluation Activities and Timeframes ................................................................................... 36
Annex C: Government and NGO Players Involved in Sharing Results of the Summative Evaluation and
Letter of Support from MoES ........................................................................................................... 37
Annex D: School Performance Review Process .................................................................................... 39
Annex E: SPR Data for Each School 2014 .............................................................................................. 40
Annex F: Data Collection Tools ............................................................................................................. 55
3
Acronyms and Glossary BRMS Basic Requirements and Minimum Standards (MoES document setting out
national education priorities)
CCT Coordinating Centre Tutor
CR Comic Relief
DEMIS
DEO
DIS
District Education Management Information System
District Education Officer
District Inspector of Schools
EGRA
IDP
Early Grade Reading Assessment (diagnostic tests to calibrate performance
of P1 – P3 learners reading and fluency skills)
Internally Displaced Person
KDLG Katakwi District Local Government
LCD Link Community Development
LCDU Link Community Development (Uganda)
LC1 Lowest level local government official
MLA
MoES
Monitoring of Learning Achievement (a national testing process run by the
MoES to measure learning achievement across a national sample of
schools annually).
Ministry of Education and Sports
NAADS National Agricultural Advisory Services
NGO Non-governmental Organisation
P1, P3 Denote Primary Class 1 and Primary Class 3
PLE Primary Leaving Examination - conducted in P7
PTA Parent Teacher Association
SHRP School Health and Reading Program
SIRK Schools for Internal Displaced Persons (IDP) Resettlement in Katakwi
Project
SIP School Improvement Plan
SMC School Management Committee
SPAM School Performance Appraisal Meeting
SPR School Performance Review (an LCD school functionality instrument and
process)
ToC Theory of Change
UPE Universal Primary Education
UWESO
VSLA
East African learner test (focus on community involvement cf to EGRA)
Village Savings and Lending Association
4
1. Executive Summary
Between 2010 and 2014 Comic Relief (CR) funded Link Community Development (LCD) in delivering
the Schools for Internally Displaced Person (IDP) Resettlement in Katakwi (SIRK) Project in Katakwi
District in north east Uganda. The key objective of this project was to assist communities which had
been affected by conflict to resettle in their ancestral home areas by improving the quality and
relevance of education provided and promoting schools as a focus of community activity. This
involved assessing and building the functionality of schools in these communities, and developing
the capacity of the community around the school and its income generating ability by using the
school as a centre to improve agriculture and animal husbandry in that community.
The main impact of the project was seen in the experimental agricultural and community
engagement elements of the project which were assessed to have assisted all 27 target communities
successfully return to their traditional farming areas while developing school gardens across all the
schools and feeding the learners from these gardens for at least two months each year. Where
schools and their communities embraced the project its impact on the schools and the surrounding
farming community was profound. However, the evaluation also found that the impact on school
performance levels, school safety and even most aspects of school hygiene were not significant,
although the mean scores on school functionality improved during the course of the project.
Perhaps the most important effect of the project is that five years after its start these 27 schools and
communities appear normal and function much like other communities across Uganda which have
not been impacted by conflict. While this is attributable to a number of factors, all the respondents
asserted that SIRK played a significant role in this process by implementing relevant and important
initiatives. It is particularly gratifying to see young community members who have failed the Primary
Leaving Exam making a success of farming commercially using methods that they learned from the
project while in school and influencing other youth and farmers in their community. However,
against this success is the failure of some of the community groups designed to sustain the project
along with the failure to plough much of the school land available, provide seeds and vines for the
next year’s production and provide produce for year-round school feeding.
As the communities are now settled back in their home areas and the schools are generally
functional with school improvement plans based on shared priorities and full of learners, SIRK can be
said to have had a sustainable impact. In more doubt is the durability of the specific changes in
schools, such as use of learner-centred teaching methods, improved early grade literacy and
numeracy teaching, robust school management and governance systems and techniques, and care
and support for orphans and vulnerable children. The evidence seems to indicate that these
innovations are likely to survive where there is school staff stability, community interest and
commitment to holding their school accountable, and in the schools where the project is associated
with success – particularly in gaining the school’s first Division 1 passes in PLE.
The Uganda Ministry of Education and Sports (MOES) has recognised the project as a potential
model for assisting returnees in post-conflict situations return home and engage in productive
farming activities quickly with the support of their schools and government agencies. However, the
evaluation concludes that the impact of SIRK could have been deeper and more sustained if LCD had
been more responsive to CR’s requests, if funds had come through in a predictable manner and if
subsequently the relationship between LCD and CR had not deteriorated.
5
2. Introduction
This report evaluates the impact of Link Community Development’s Schools for Internally Displaced
Person (IDP) Resettlement in Katakwi (SIRK) Project in Uganda, which was funded by Comic Relief
(CR) from 2010 – 2014 and the Baring Foundation with a total budget of £712,863 over the 5 years.
The body of the report is structured around the main delivery pillars of the project – school
performance review and district and school level training and support. The conclusion examines the
impact of the project discussed in the findings sections in relation to two key areas of concern that
CR has: whether the project made a difference to people’s lives; and how the project made a
difference with a specific focus on the role of the various project stakeholders.
The report will be shared with LCD and its key partners including the MOES in Uganda and relevant
NGOs and funders at a dissemination meeting on 31st March 2015. This will include Katakwi based
local government officials including the District Education Officer (DEO) and partner NGOs working in
the area, representatives of the project schools and other interested parties. The day-long workshop
will allow examination of the model of school and community support and development
implemented by LCD and allow for discussions on future funding and implementation or sharing of
the model. LCD Uganda has also provided the Assistant Commissioner for Basic Education Standards
with a summary document on the project, at his request.
3. The Project
The CR funding for the ‘Schools for Internally Displaced Person (IDP) Resettlement in Katakwi’ (SIRK)
Project in north-east Uganda was granted in February 2010. The project delivery commenced soon
after the grant was made. LCDU based the project in its existing office space in the district council
offices in the centre of the small rural town of Katakwi, with its large Internally Displaced Persons
(IDP) camp.
The project was aimed at assisting 27 schools sited in remoter rural areas of the Katakwi District
which had been most affected by conflict caused by the Lord’s Resistance Army and incursions by
Karamoja warriors. In 2010 IDPs were beginning to return to their farms and small rural villages.
However, the camps were still very much in evidence and contained many families and individuals
who were reluctant to return to their ancestral lands. Many had been IDPs for a number of years and
so were struggling to break the dependence on hand-outs and take the route of re-establishing their
farms in areas that had been left uncultivated for many years. Individual families feared returning to
their homes without assurance that they would be protected and that the government was
committed to supporting them. At the same time the children were often traumatised and in the
IDP camps had experienced only limited access to schooling. Many of these children had become
acclimatised to camp life with its gambling and alcohol.
Given this situation the core intention of the project was to use schools as the anchors around which
these 27 communities could re-establish themselves. The aim was to break dependency and assist
community members and their families, collected around an effective primary school, to re-establish
their lands and gradually increase the area under cultivation based on modern farming methods.
Ultimately it was planned that these community members would come to see farming as a viable
6
occupation and source of income. This was to be achieved by a complex set of school and
community development activities which were collectively to make these rural communities viable
economic and habitable entities. The school would be the hub for the delivery of these innovations
in each community.
When the project started Katakwi town was still a centre for refugees with a large IDP settlement
opposite the district council offices. There are few traces of this settlement now; over the years
these rural people have headed back to their villages to rebuild their lives following the dual impact
of the attacks by the LRA and Karamoja warriors.
3.1 Katakwi District
Katakwi District is one the more remote districts in Uganda. It is situated in the north-east of the
country. It is a relatively under-populated district with a population of 165,553 (Government of
Uganda 2014). The population is 51.2% female. The growth rate is 2.76% per annum, down from
3.62% in the 1990s (Government of Uganda 2014). This is a relatively slow growth rate compared to
other eastern districts and may indicate that the conflicts and rural nature of the district have led to
many young people leaving the area. Under 7,000 people in the district live in urban areas – this is
the population of the small town of Katakwi. Katakwi town is an administrative centre with a
number of retail outlets and a small number of businesses and NGO offices, as well as the ubiquitous
transport and boda-boda (motorbike taxi) operations. The businesses in the town mainly specialise
in supporting the needs of a small urban population and those of the much larger farming and
fishing communities.
The town of Katakwi is reachable by a 55 km marram road from Soroti which in the rainy season
becomes very slow and can be impassable for brief periods. There are no tarred roads in the district.
Many of the schools are only reachable along cattle and bicycle tracks through small farmsteads.
The district itself was created in 1997, and covers an area of 2,500 square kilometres. The people are
mainly of Iteso ethnicity. In 2005 Amuria District was created out of 16 of its western sub-counties,
leaving the district with 9 sub-counties, and Katakwi town council. The average size of households in
the district is 5.3 people.
The main economic activities on this undulating plateau are farming, forestry and fishing. 28% of the
district is used for arable farming. The main crops are sorghum, cassava, sweet potatoes,
groundnuts, and some maize and millet along with rearing cattle, goats and pigs. Fishing is practiced
using traditional labour-intensive methods in the rivers which create large wetlands, of which there
are many in the district, and in Lakes Opeta and Bisina to the south of the district. Unlike much of
Uganda the district experiences only one wet season each year, stretching from March to October,
during which the district receives 1000 – 1500 mm of rain, which in recent years often causes floods
interspersed with periods of drought. This has impacted negatively on the agricultural economy of
the area (Katakwi District Council 2013).
The district in 2013 had 77 registered primary schools of which 96% were government supported.
Private schools are still uncommon in this district, unlike other parts of Uganda. These 77 schools
educate over 48,000 learners of whom over 15% are orphans. The district’s learner teacher ratio
7
stands at 64 and the learner classroom ratio at 761. These are high but not unusual ratios in Ugandan
rural districts and indicate crowded classrooms and inadequate teacher support for individual
learner needs.
The district only has 13 secondary schools of which 62% are public. Of concern is that only 38% of
secondary school learners are female (Katakwi District Council 2013)2.
An important feature of most rural primary schools in the district is that they have a lot of land.
Many sit on over 20 acres of land and some have over 60 acres. This is a valuable resource which
schools have traditionally under-utilised. However, none of the 11 project schools visited is fenced,
although some are growing ‘live fences’ of prickly plants to keep out stray animals. This means that
school gardens are vulnerable to being eaten or trampled by animals, particularly in the dry season.
Although there are sub-county by-laws which impose fines on stray animals it appears these are
rarely if ever imposed.
At the start of the project the district’s Primary Leaving Exam (PLE) results were high by national
standards with a 96% pass rate3. However, analysis showed there were two caveats to that high pass
rate: only 2.3% of candidates achieved a Division 1 and only 43.3% of learners’ sitting PLE were
female. In addition the survival rate from P1 to P7 was very low, meaning that well under 20% of
learners who entered P1 got to sit P7. Put another way over 80% of learners dropped out of school
before P7, with girls doing so with greater regularity than boys. So the real PLE pass rate for the
cohort was well below 20%. This provided LCD with targets – to increase the number of Division 1
passes and improve overall survival rates through primary school to the PLE, with a particular focus
on the survival of female pupils.
3.2 SIRK
The aim of SIRK was to “assist communities to resettle by improving the quality and relevance of
education provided and promoting schools as a focus of community activity”. This was in response
to the project’s Theory of Change (ToC) which stated that independent farming communities could
deal better with the stress and trauma, and act as a counter to the poverty and increasing
dependency of living in IDP camps. The ToC argues that for successful resettlement, communities
need to have a functional school which assists the community resettle and provides them with
appropriate skills and the infrastructure to sustain resettlement. The ToC further asserts that access
to quality education will support resettlement if schools:
· Provide a place of care and safety that helps to heal the trauma of conflict
· Are recognized as promoting opportunity for children and prosperity for the community
· Become centres of community activities promoting social cohesion.
To this end the SIRK Project’s Key Objectives were to:
1 The Uganda Bureau of Statistics (2013) puts the national learner teacher ratio at 49 and the national learner
teacher ratio at 58.
2 This compares favourably with the national statistics which indicated that in 2010 30% of post-primary school
learners were female (Uganda Bureau of Statistics 2010)
3 Based on the number of candidates who actually sat the PLE.
8
1. Improve quality of education in 27 schools targeting an estimated 24,804 learners (12,371
boys and 12,433 girls) over the life of the project
2. Improve community participation and support for education to ensure school children are
learning
3. Improve the capacity of Katakwi District Local Government (KDLG) to manage and provide
technical support to schools.
The methodology to improve community engagement and assist former IDPs to reintegrate into
their ancestral lands was consciously experimental and innovative. It focused on developing and
supporting appropriate farming skills in the community through demonstration gardens in the
schools. These were used as a motivator for communities to create community groups around
farming activities and simultaneously support the school, and would also serve as a basis for
improving learner nutrition and sustaining learner retention in school. In its final few months LCD
identified the most effective community farming groups and purchased the oxen and ploughs along
with sheep. This was designed to assist these community groups in sustaining themselves. To
implement this ambitious programme LCD employed an agricultural expert and three social workers
alongside its education staff.
Alongside the agricultural and community mobilisation activities the project also implemented LCD’s
standard package of school support and development activities, with a focus on learner centred
teaching methods and the creation of child-friendly school environments. This included training and
support of the various school stakeholders as well as district education staff, support supervision of
teachers and the development of participatory planning and accountability.
The project aimed to assist some 50,000 people in the three sub-counties of Ongongoja, Ngariam
and Magoro, with the consequent decline in the population of camps.
The SIRK was established in collaboration with the KDLG and involved the Council committing office
space, support personnel and transport for gathering SPR data and other project activities; engaging
in joint project planning with the LCD team and in steering committee meetings; and advising staff
on the security situation in the district. The responsibilities of both parties were included in a
Memorandum of Understanding (MoU). In that MoU LCD commits to providing institutional and
capacity support to the district, particularly in its data collection processes. This relationship, which
was anticipated as being key to the success of the project, was explored in the evaluation.
Midway through the project for a number of reasons, which included levels of engagement by
different communities and reduced funding flow and availability, the scope of the project was
narrowed and the intensive focus moving from 27 schools to 10, although the other 17 schools
continued to receive scaled-down support.
This report will assess to what extent the project objectives were met using CR’s specific concerns,
and whether the Theory of Change was valid.
9
4. Evaluation Methodology
4.1 Introduction
The evaluation approach involved two separate but complementary processes: an analysis of the
School Performance Review (SPR) data which was conducted annually up to 2014, and a review of
the district, school and community based interventions. Data for the evaluation was collected during
late 2014 and early 2015. The SPR was conducted in 24 of the 274 project schools while the data for
the review of the interventions was collected from a sub-set of eleven schools. These 11 schools and
communities were selected purposively, based on a selection of those which had engaged most
actively with the project, those which had shown varying levels of interest and two which had shown
very limited interest. Four of these schools were further investigated using a case study approach to
better understand the qualitative impact of the project on these schools and their communities.
As the SPR instruments and processes have been tested extensively in Uganda with schools in the
same districts and other neighbouring districts by LCD, and the interview and data collection
instruments are adapted from ones that this evaluator has used successfully in other community and
school development projects it was agreed that there was no need to field test before undertaking
the data collection.
4.2 School Performance Review (SPR)
LCD’s SPR is a data driven method of assessing the state and performance of a school. The SPR
process was conducted in 24 of the project schools in Katakwi District. The data was collected in
June 2014 by an LCDU team, the members of which all have three years and more experience of
using the instruments, working with Coordinating Centre Tutor (CCTs) and district officials. Details of
the indicators and data collection process are included in Annexes D and E. The data was entered
into Excel and graphics generated. The data for each of the schools can be viewed in Annex E.
4.3 Project Impact Data Collection
The evaluation included three visits to Katakwi. Each visit involved visits to some of the school
communities by the evaluator. The first took place in October 2014 and was focused on a review of
the school agricultural component and the state of the community agricultural groups the project
was to foster. During that 3 day visit 9 schools were visited – from both groups of schools, including
representatives of the 17 schools which were not getting intensive support, as discussed in the
previous section. The timing was critical as the schools and communities harvest in October and
November towards the end of the rainy season. I realised that the main evaluation visit in February –
which is in the middle of the dry season – would provide little evidence of the dynamics involved in
the agricultural projects. In this first visit I interviewed the head teachers, the agriculture teacher,
and members of the community groups in each of the 9 schools. In addition, I visited the school and
community gardens in each school and also witnessed the school feeding process.
4 In 2014 two of the schools were not accessible at the time when data was being collected and one school had
no teachers present when the team came to the school so could not be SPR-ed. These schools were left out of
the analysis as they lacked endpoint data.
10
In early December 2014 I returned to observe LCD leading a process of experimenting with a
simulated school management and planning game which was being adapted for use in Ugandan
schools. I observed one school playing the simulation game and the consequent demonstration of
this game to the district and national MoES officials.
Finally I made the main evaluation visit in February 2015 when four schools, being 15% of the project
schools, were visited for intensive review as case studies. The four schools were drawn from two of
the three sub-counties. The sample was chosen against a range of indicators including engagement
with the project, size, functionality and level of remoteness. They included schools which had been
both in an IDP camp and some which are sited in villages to which IDPs were returning. This final visit
focused on all aspects of the project including the training and support to teachers that LCDU
provided as well as the support that the district office received as part of the LCDU intervention. To
ascertain the nature and impact of these interventions the following data was requested or
generated:
Project reports which were produced for funders and for internal LCD reporting and
accountability purposes.
A school data sheet which included the registration and attendance details of the school on
the day of the visit, the repetition rates, numbers of orphans, PLE results and teacher profile
of the school (see Annex E).
Observational data from a learning walk tool (see Annex E). The data came from a walk
undertaken around the school during lesson-time to get a snap-shot of the school, the
classrooms, quality of services available to the learners, and the level of child-friendliness.
Interview data from the:
o Katakwi DEO along with a school inspector;
o head-teachers in the four case study schools (15% of the project schools);
o a focus group of three teachers (two from lower primary and one from upper
primary) from each of the four schools; and
o a focus group of 3 – 5 community members in each of the four schools. Each group
included members of the community farmers’ group and SMC/PTA members;
o LCD project coordinators and managers.
All interviews were conducted using structured questionnaires and were administered by myself
with the interviewees in English. There was some need for translation in the community groups into
Ateso. This was facilitated by the members of these focus groups during the course of the interview
where it was deemed necessary to ensure understanding and full involvement by all members of the
groups. All focus groups were of mixed gender, bar one community focus group which was entirely
male. In two of the four case study schools I also observed the school planning process based on
school performance review data from 2014.
I believe that the three pronged data collection process - which included 44.4% of the project
schools - has allowed for triangulation and verification of key data and provided me as the evaluator
with adequate understanding of the elements of this project and a sound understanding of the
impact it has had on the target schools and communities.
11
5. Profile of the Schools Visited for the Evaluation
The 11 schools visited as part of the two evaluation processes have an average of 673.6 learners and
9.5 teachers per school, making an average pupil teacher ratio of 70.9. This is very high, particularly
as most of the schools have P6 and P7 classes of well under 50 learners. As a result there are P1
classes with about 200 learners in some of the schools.
In the four case study schools more detailed data was collected in February 2015. An analysis of the
learner enrolment for 2015 indicates that across the four schools there were a total of 689 P1
learners – and more were still registering. This is an average of 172 learners per P1 teacher.
However, at the other end of the school there were a total of 145 P7 learners – averaging 36
learners per class. This indicates that in these schools some 80% of the learners who would have
entered P1 seven years ago have dropped out before reaching P7. Part of this drop out is probably
related to learner repetition rates which vary from 7.6% to 39.3% across the four schools. Schools
appear to follow different policies in repetition with two repeating large numbers of P1s, while all of
them have a repeater bulge in P3 and P4, and one repeats considerable numbers of learners in P5 as
well. The repetition bulges coincide with the language of instruction changing from mother tongue
to English, and indicates that many learners struggle with this change.
If we look at the gender split in the four schools 51.6% of the learners enrolled are girls but by P7
this percentage has dropped to 42.8%. This is still considerably better – according to the
respondents – than five years ago when boys predominated at all levels and few girls got to P7.
However, more needs to be done to ensure that fewer girls drop out. Community members and
teachers report that the girls generally drop out through pregnancy, early marriage and demands for
them to undertake work in the home or family farm. The bigger concern across the schools remains
the huge drop in learner numbers – both girls and boys – between P1 and P7. None of the four
schools have seen a consistent increase in the number of learners sitting PLE. This indicates that
there is no general increase in access to P7 in these schools.
The PLE results have fluctuated in three of these four schools over the course of the project.
However, all of these three schools saw a spike in performance in 2010 – 2012, during the early
years of the project. The remaining school has seen a consistent improvement in overall
performance and girls’ performance culminating in 2014 in one boy getting a Division 1 pass and one
girl missing a Division 1 by one mark – while more girls had achieved a Division 2 pass than formerly.
Although the enrolments in these four schools varied between 318 and 1047 the schools all had
either 9 or 10 teachers. All of the teachers were trained and most had a certificate (known as Grade
3), with only one having a degree – a female head teacher. Of the 37 teachers across the schools
only 11 were women.
All the schools have brick classrooms with corrugated iron roofs. Most classrooms have cement
floors but a number have earth floors. A few schools had old half-walled classrooms. These were still
being used in two of the schools. Many of the floors are in a poor state of repair with holes and
pitted surfaces. Except in one school with a new block of classrooms, none of the classrooms had
glass in the windows, while most had bars over the windows and metal doors – some of which are
lockable. While all the schools had a head teacher’s office with a storeroom behind it, none of the
schools has an administration block, staff room, library, kitchen, or science laboratory. Two of the
schools have limited access to electricity which allows P7 learners to learn in the evening.
12
The lower primary (P1 – P3) classrooms tended to be very crowded with inadequate numbers of
desks and benches for learners, while the P6 and P7 learners generally had adequate desks and
chairs and gave the learners plenty of room. Only one school had inadequate numbers of classrooms
with teachers sharing the same classroom and teaching different grades facing opposite directions.
However, this school has a new block of classrooms so this problem will end soon.
Not one of the schools was considered safe, with none of them being fenced and all reporting thefts,
instructional materials being damaged at night and animals wandering through the school. Three of
the schools have large grounds making fencing costly, while the final school has just the ground that
the school is built on. The safety and security of the schools are somewhat improved by the
presence on the site of teachers who are housed either in grass roofed traditional round houses or in
new concrete or brick houses. While this accommodation is normally inadequate for all the teachers
and sees some crowding it does allow over half the teachers in each of these schools to live on site.
All of the schools have some sports grounds, with goal posts and one with broken netball posts. The
pitches were mostly overgrown and have not been rehabilitated after the holiday.
Hygiene and water access are a general problem with inadequate numbers of toilet booths in all the
schools with no school having changing rooms for girls, although three schools have a toilet which is
accessible by disabled learners. An ill-advised scheme by government to provide chemical toilets has
left most of the schools with lines of unusable toilet booths. Instead the schools use hole in the floor
long-drop toilets. There are inadequate numbers. The worst provisioned school had four toilets for
over a thousand learners and 10 teachers. Generally the toilets were considered to be maintained to
a reasonable level of cleanliness except in the one school which is built on a high water-table so
water comes up through the pit toilets making them largely unusable. None of the government
provided chemical toilets or large water tanks in the schools are working, due to being installed
wrongly or having broken taps. All the schools have access to borehole water but at some distance.
These water sources are shared with the community. This reality makes any attempt at school-wide
hygiene very difficult to maintain.
13
6. Findings: SPR Comparison of 2010 and 2014 Data
This section examines the SPR data from 245 of the 27 project schools from the first year of the
project and the last year. The same ten indicators were used throughout the project and the
majority of LCD and district staff who undertook the 2010 SPR process were still in place in 2014.
This is important as substantial changes of personnel undertaking the data collection can lead to
some apparent inconsistency in judgements on what constitutes ‘fully achieved’ and ‘achieved’, or
‘achieved’ compared to ‘partially achieved’.
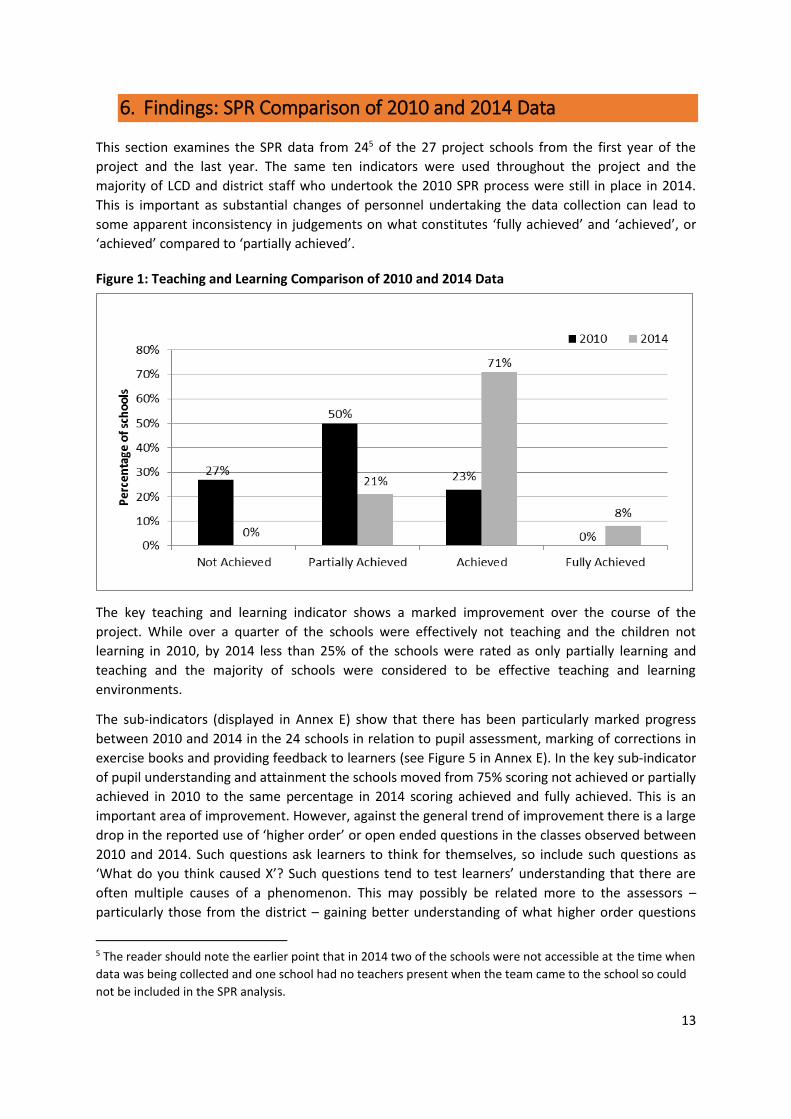
Figure 1: Teaching and Learning Comparison of 2010 and 2014 Data
The key teaching and learning indicator shows a marked improvement over the course of the
project. While over a quarter of the schools were effectively not teaching and the children not
learning in 2010, by 2014 less than 25% of the schools were rated as only partially learning and
teaching and the majority of schools were considered to be effective teaching and learning
environments.
The sub-indicators (displayed in Annex E) show that there has been particularly marked progress
between 2010 and 2014 in the 24 schools in relation to pupil assessment, marking of corrections in
exercise books and providing feedback to learners (see Figure 5 in Annex E). In the key sub-indicator
of pupil understanding and attainment the schools moved from 75% scoring not achieved or partially
achieved in 2010 to the same percentage in 2014 scoring achieved and fully achieved. This is an
important area of improvement. However, against the general trend of improvement there is a large
drop in the reported use of ‘higher order’ or open ended questions in the classes observed between
2010 and 2014. Such questions ask learners to think for themselves, so include such questions as
‘What do you think caused X’? Such questions tend to test learners’ understanding that there are
often multiple causes of a phenomenon. This may possibly be related more to the assessors –
particularly those from the district – gaining better understanding of what higher order questions
5 The reader should note the earlier point that in 2014 two of the schools were not accessible at the time when
data was being collected and one school had no teachers present when the team came to the school so could
not be included in the SPR analysis.
14
are through their contact with the project. In other words over the years they may have realised
questions they rated as higher order in 2010 were really lower order ones, thus scoring the schools
more rigorously on this indicator.
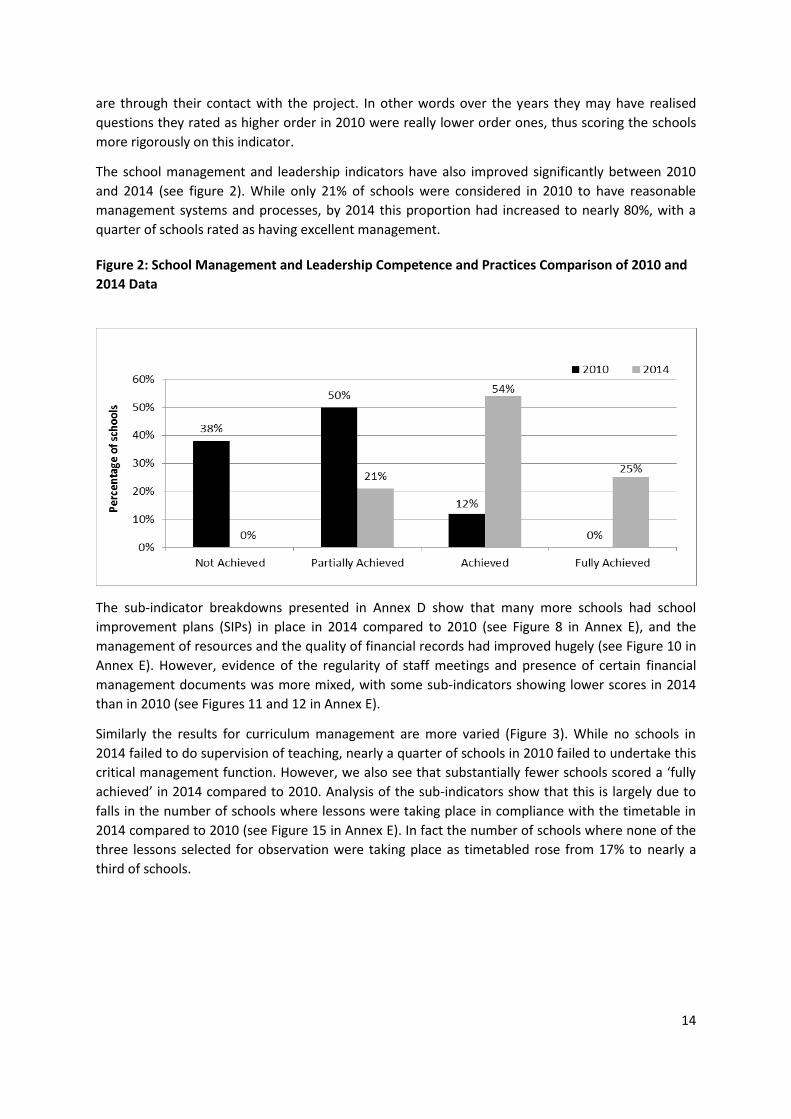
The school management and leadership indicators have also improved significantly between 2010
and 2014 (see figure 2). While only 21% of schools were considered in 2010 to have reasonable
management systems and processes, by 2014 this proportion had increased to nearly 80%, with a
quarter of schools rated as having excellent management.
Figure 2: School Management and Leadership Competence and Practices Comparison of 2010 and
2014 Data
The sub-indicator breakdowns presented in Annex D show that many more schools had school
improvement plans (SIPs) in place in 2014 compared to 2010 (see Figure 8 in Annex E), and the
management of resources and the quality of financial records had improved hugely (see Figure 10 in
Annex E). However, evidence of the regularity of staff meetings and presence of certain financial
management documents was more mixed, with some sub-indicators showing lower scores in 2014
than in 2010 (see Figures 11 and 12 in Annex E).
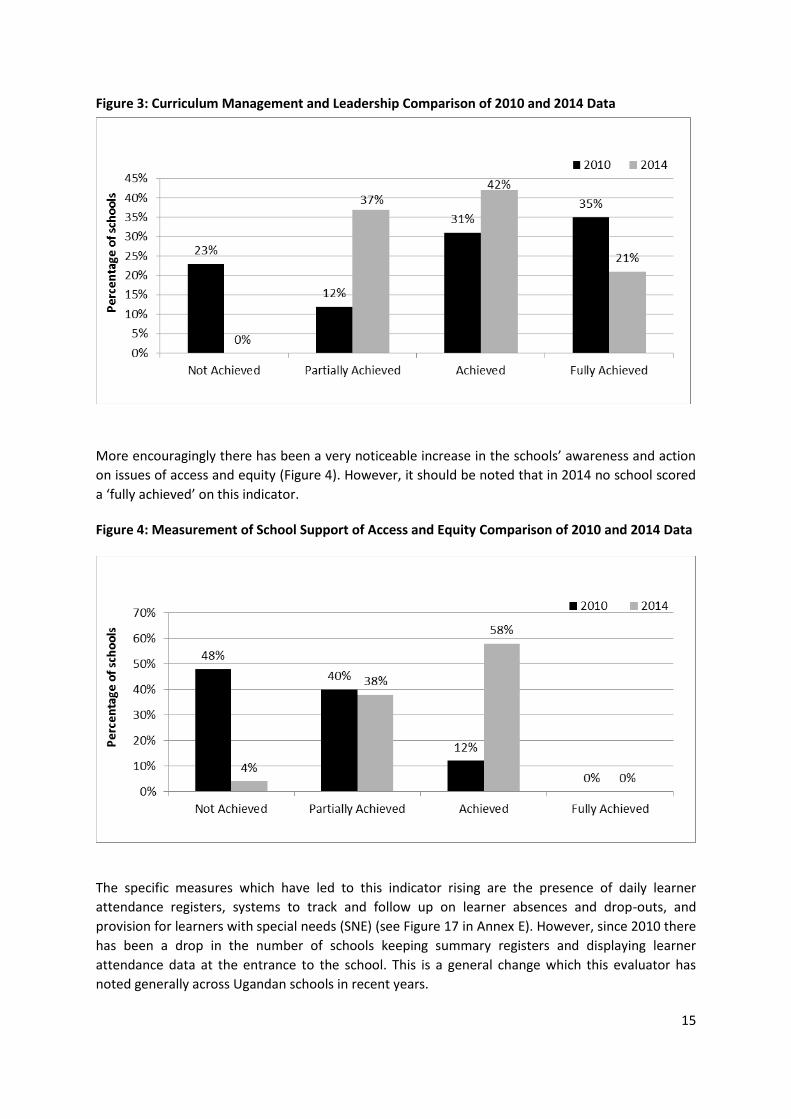
Similarly the results for curriculum management are more varied (Figure 3). While no schools in
2014 failed to do supervision of teaching, nearly a quarter of schools in 2010 failed to undertake this
critical management function. However, we also see that substantially fewer schools scored a ‘fully
achieved’ in 2014 compared to 2010. Analysis of the sub-indicators show that this is largely due to
falls in the number of schools where lessons were taking place in compliance with the timetable in
2014 compared to 2010 (see Figure 15 in Annex E). In fact the number of schools where none of the
three lessons selected for observation were taking place as timetabled rose from 17% to nearly a
third of schools.
15
Figure 3: Curriculum Management and Leadership Comparison of 2010 and 2014 Data
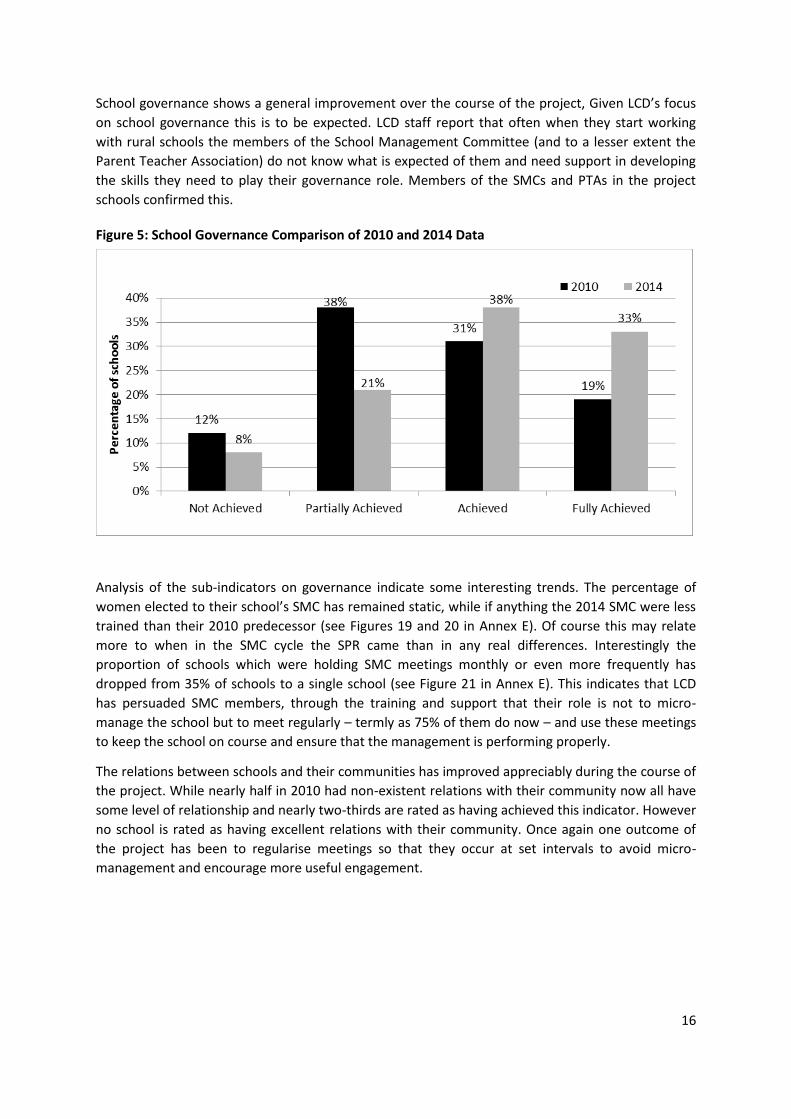
More encouragingly there has been a very noticeable increase in the schools’ awareness and action
on issues of access and equity (Figure 4). However, it should be noted that in 2014 no school scored
a ‘fully achieved’ on this indicator.
Figure 4: Measurement of School Support of Access and Equity Comparison of 2010 and 2014 Data
The specific measures which have led to this indicator rising are the presence of daily learner
attendance registers, systems to track and follow up on learner absences and drop-outs, and
provision for learners with special needs (SNE) (see Figure 17 in Annex E). However, since 2010 there
has been a drop in the number of schools keeping summary registers and displaying learner
attendance data at the entrance to the school. This is a general change which this evaluator has
noted generally across Ugandan schools in recent years.
16
School governance shows a general improvement over the course of the project, Given LCD’s focus
on school governance this is to be expected. LCD staff report that often when they start working
with rural schools the members of the School Management Committee (and to a lesser extent the
Parent Teacher Association) do not know what is expected of them and need support in developing
the skills they need to play their governance role. Members of the SMCs and PTAs in the project
schools confirmed this.
Figure 5: School Governance Comparison of 2010 and 2014 Data
Analysis of the sub-indicators on governance indicate some interesting trends. The percentage of
women elected to their school’s SMC has remained static, while if anything the 2014 SMC were less
trained than their 2010 predecessor (see Figures 19 and 20 in Annex E). Of course this may relate
more to when in the SMC cycle the SPR came than in any real differences. Interestingly the
proportion of schools which were holding SMC meetings monthly or even more frequently has
dropped from 35% of schools to a single school (see Figure 21 in Annex E). This indicates that LCD
has persuaded SMC members, through the training and support that their role is not to micro-
manage the school but to meet regularly – termly as 75% of them do now – and use these meetings
to keep the school on course and ensure that the management is performing properly.
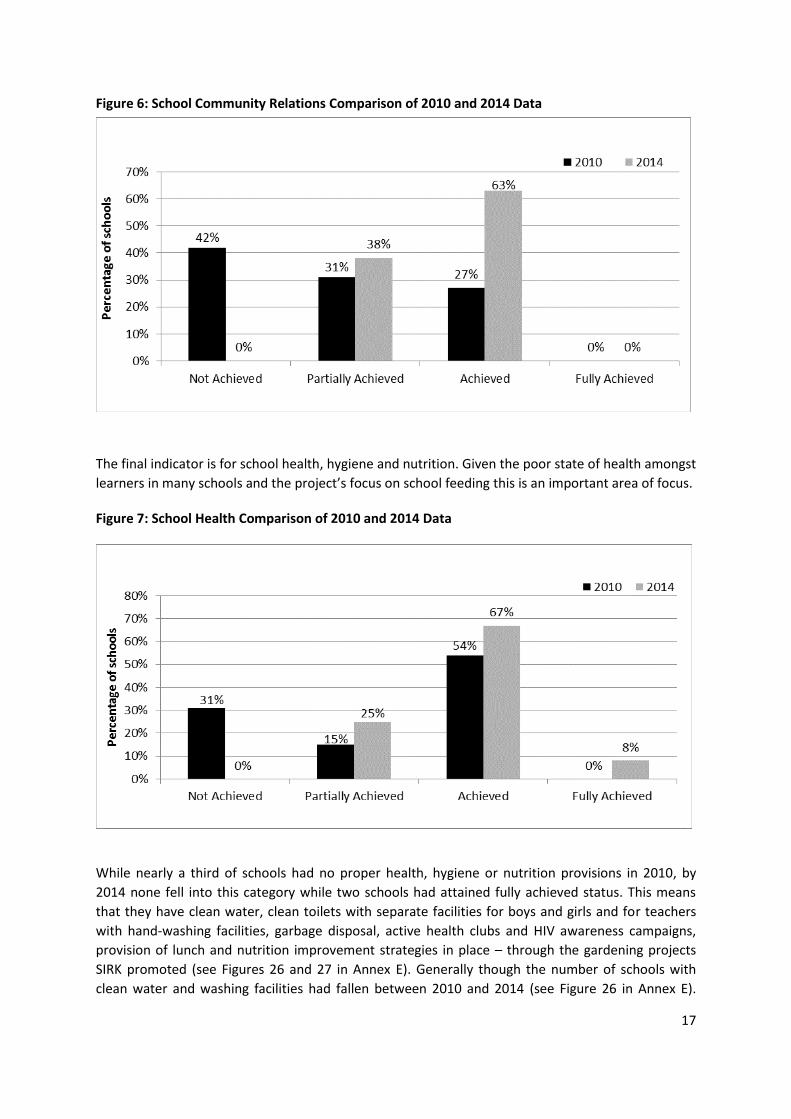
The relations between schools and their communities has improved appreciably during the course of
the project. While nearly half in 2010 had non-existent relations with their community now all have
some level of relationship and nearly two-thirds are rated as having achieved this indicator. However
no school is rated as having excellent relations with their community. Once again one outcome of
the project has been to regularise meetings so that they occur at set intervals to avoid micro-
management and encourage more useful engagement.
17
Figure 6: School Community Relations Comparison of 2010 and 2014 Data
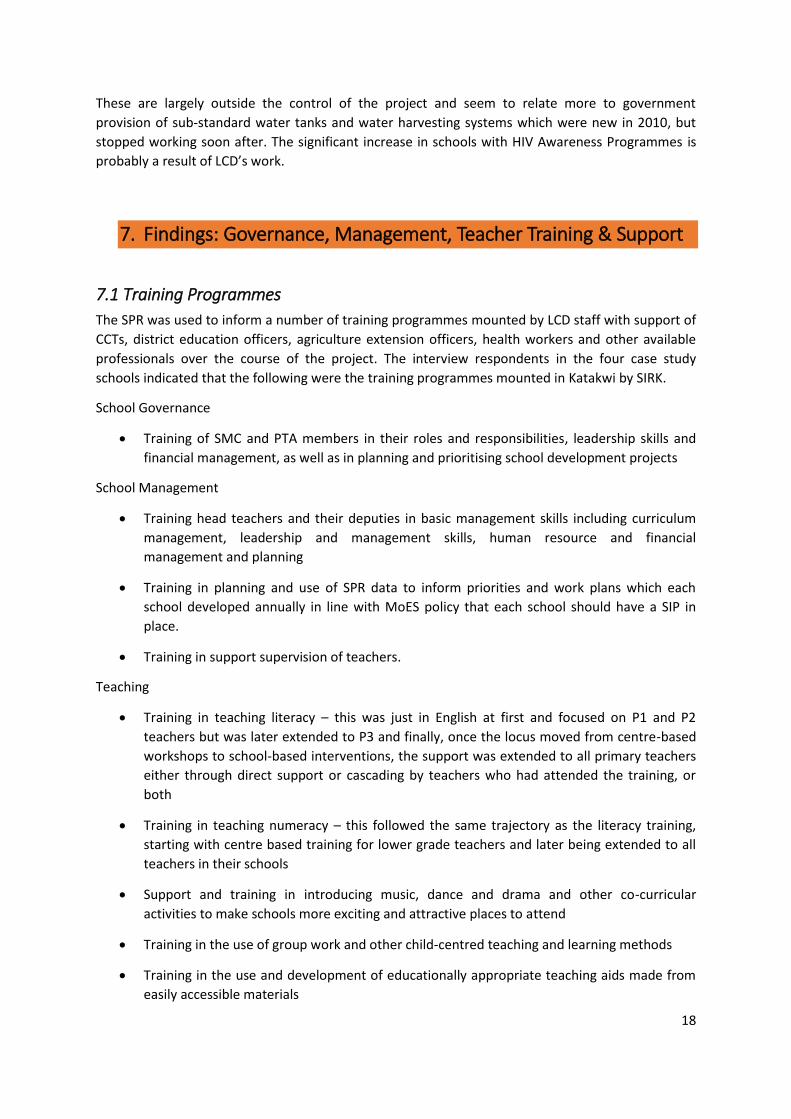
The final indicator is for school health, hygiene and nutrition. Given the poor state of health amongst
learners in many schools and the project’s focus on school feeding this is an important area of focus.
Figure 7: School Health Comparison of 2010 and 2014 Data
While nearly a third of schools had no proper health, hygiene or nutrition provisions in 2010, by
2014 none fell into this category while two schools had attained fully achieved status. This means
that they have clean water, clean toilets with separate facilities for boys and girls and for teachers
with hand-washing facilities, garbage disposal, active health clubs and HIV awareness campaigns,
provision of lunch and nutrition improvement strategies in place – through the gardening projects
SIRK promoted (see Figures 26 and 27 in Annex E). Generally though the number of schools with
clean water and washing facilities had fallen between 2010 and 2014 (see Figure 26 in Annex E).
18
These are largely outside the control of the project and seem to relate more to government
provision of sub-standard water tanks and water harvesting systems which were new in 2010, but
stopped working soon after. The significant increase in schools with HIV Awareness Programmes is
probably a result of LCD’s work.
7. Findings: Governance, Management, Teacher Training & Support
7.1 Training Programmes
The SPR was used to inform a number of training programmes mounted by LCD staff with support of
CCTs, district education officers, agriculture extension officers, health workers and other available
professionals over the course of the project. The interview respondents in the four case study
schools indicated that the following were the training programmes mounted in Katakwi by SIRK.
School Governance
Training of SMC and PTA members in their roles and responsibilities, leadership skills and
financial management, as well as in planning and prioritising school development projects
School Management
Training head teachers and their deputies in basic management skills including curriculum
management, leadership and management skills, human resource and financial
management and planning
Training in planning and use of SPR data to inform priorities and work plans which each
school developed annually in line with MoES policy that each school should have a SIP in
place.
Training in support supervision of teachers.
Teaching
Training in teaching literacy – this was just in English at first and focused on P1 and P2
teachers but was later extended to P3 and finally, once the locus moved from centre-based
workshops to school-based interventions, the support was extended to all primary teachers
either through direct support or cascading by teachers who had attended the training, or
both
Training in teaching numeracy – this followed the same trajectory as the literacy training,
starting with centre based training for lower grade teachers and later being extended to all
teachers in their schools
Support and training in introducing music, dance and drama and other co-curricular
activities to make schools more exciting and attractive places to attend
Training in the use of group work and other child-centred teaching and learning methods
Training in the use and development of educationally appropriate teaching aids made from
easily accessible materials
19
Training in use of data, continual assessment and mark schedules to monitor learner
progress and as the basis for diagnostic intervention in support of slow learners and to set
the pace of lesson development based on learner comprehension and performance
HIV and AIDS training for teachers, focusing on their own knowledge and health as well as
care and support of learners. This was conducted by local medical officers and LCD staff
Training in running a safe and hygienic school. This included sanitation, nutrition and clean
water, and was particularly linked to keeping pubescent girls in school and making schools a
safe place to learn.
School Agriculture Teachers and Community Groups (with the help of the National Agricultural
Advisory Services - NAADS)
Training in developing and managing school and community gardens, introducing new crops
particularly vegetables such as egg-plant, onions, tomatoes and cabbages, using ‘modern
methods’ of planting, spraying and managing crops, developing woodlots and simple
business management and entrepreneurship. In addition improved methods of animal
husbandry were also taught.
District
Capacity building of the school inspectors in order to conduct positive inspections which
support and develop schools
Roles and responsibility training for all district education staff
‘Training of trainers’ training for all district staff involved in the SPR data collection and
analysis process
Development of District Education Management Information Systems (DEMIS) and training
district staff on how to collect, enter, present and analyse data and how to use a database.
The ambitious targets of numbers of each stakeholder group who would be trained were never
reached. The DEO saw this failure to train a critical number of teachers in each school as a weakness,
which would impact on sustainability at school level. In addition, no training was directly focused on
learners although they were the assumed key beneficiaries of all the training.
According to the community and school-based interviewees the training was supported by a number
of support initiatives. These included:
The distribution of planting materials each year including sweet potato vines, cassava
cuttings and vegetable seeds
The provision of farming implements to all schools including hoes, axes, spades, a
wheelbarrow, a sprayer, and hose
The provision of materials to assist in the development of learning and teaching aids
including markers, manila paper
20
Tippy-taps,6 first aid kits and other basic equipment to assist in improving hygiene in schools
Drums, musical instruments and award cups to support a programme of music, dance and
drama in the schools
Training manuals to assist the trainees cascade all training inputs back in their schools.
Finally, at the end of the project LCD donated a vehicle to the district education office to allow for
continued access and support to the schools (the office possessing no other vehicle) and a laptop to
the inspector of schools to allow for continued collection, analysis and use of data from the schools
at district level.
7.2 Impact of the Learning-focused Interventions
The interviewees were very clear and unanimous in valuing the training that SIRK had brought to
them. The teachers and head teachers argued that their practice has changed as a result of the
training. They pointed to their use of instructional materials (IMs), improved learner reading skills at
the end of P1, improved numeracy approaches and some group work, to prove they have changed.
However, evidence in the classrooms was limited. I observed an excellent P1 literacy lesson which
was more a credit to the School Health and Reading Program (SHRP) and the readers it has provided
than to LCD. There were useful IMs in many classes but the teachers admitted that keeping them in
place overnight and during weekends and holidays when classrooms lack windows and often have
no locking doors is a challenge. No classroom with grouped desks was observed in any of the
schools. One teacher explained convincingly how she uses group-work when learners are sitting in
rows. Other teachers admitted that they struggle to use group work given the size of the lower
primary classes. Evidence of learner-centred methodology was limited and canes were still in
evidence in one of the case study schools during the evaluation visit.
The PLE results for these schools also provide a possible measure of impact. After five years of
engagement the PLE results should show some impact of the project. In fact a 96% pass rate in 2010
for Katakwi District had dropped to 89.4% in 2013 before an uptick to 92.4% in 2014. However, while
the rate fell there were a number of more positive indicators. The number of candidates in the
district has increased over this period by nearly 20%, with a 30.3% increase in the number of girls
surviving primary school and sitting the PLE. Also the Division 1 pass-rate improved from 2.3% of
candidates scoring this division to 4% and 3.5% at the height of the SIRK’s impact 2011 and 2012
respectively, to drop to 2.3% again in 2014. It proved hard to relate such fluctuations to the work
that LCD was doing with the schools. However, it is important to note that when questioned the
head teachers, teachers and community members in the four case study schools were adamant that
the work LCD was doing with the school had impacted on their PLE results and had led to
improvements in teaching. These were school specific and included year on year improvements. One
school argued that it had a reduced number of learners getting Division U, two schools claimed their
first learners ever getting Division 1 passes in 2014 and two argued that there were an increased
number of learners getting Division 2 rather than Division 3 and 4 passes. The DEO adds to this
argument citing the two project schools which have achieved their first Division 1 passes and
pointing out that when the project started “I could never have dreamed of such an achievement” in
6 Tippy-taps are water containers which are tipped to dispense water. Though more durable than many water
systems provided to schools these also broke over time.
21
these schools. Further she argues that even those learners who get Division 2 and 3 passes in the
district generally go on “if they can afford it” to do well in secondary schools.
The statistics show that while all these claims are true, results have been fluctuating in most of these
schools rather than steadily improving. Interestingly though, half of the case study schools got their
best PLE results in the period when the project was most active, 2010 – 2012. However, as we saw
the SPR ‘teaching and learning’ sub-indicators have improved over the five years across all the
schools. This may indicate that while the PLE results vary across the grades and particularly in lower
primary grades and are impacted on by poverty, demands on learners to look after younger siblings
or work, learner absenteeism, and so on, there have been some improvements in classroom
practice.
As LCD was only working in 35% of the primary schools in the district its impact on district-wide PLE
results was likely to be limited, although it can probably claim much of the credit for the improved
enrolment and increasing survival rates of girls in project schools. It was noticeable in two of the four
schools visited that the majority of P7 learners are girls, with 62% of P7 learners being girls in one
school. However, as noted earlier, this positive trend is overshadowed by the fact that in all the
schools only a small minority of the children who enter P1 reach P7. The reasons cited for this by
school staff and community members relate to girls getting married early, becoming pregnant or
having to look after younger siblings, and for both boys and girls dropping out to engage in farming
and other economic activities. Typically in the project schools P7 has 80% less learners enrolled than
in P1. This is a national trend, which is particularly pronounced in more rural and traditional districts
such as Katakwi. An important supplement to the argument that LCD has impacted on the enrolment
of girls and of learners generally is that overall primary school enrolment in the district increases by
between 2000 and 2500 learners every year according to the DEO, and she attributes much of this
increase to LCD’s work in mobilising SMCs and community members to get out-of-school children
into school, and making schools increasingly attractive places in which to learn.
The argument for the project impacting on the practice of head teachers is more convincing. All the
11 head teacher offices visited had walls plastered with relevant school data. This included PLE
results for a number of years, current enrolment data, the school’s improvement plan, as well as
staff names and attendance records. LCD staff say that they encourage head teachers to develop this
data-rich ‘talking office’. The head teachers are all organising annual planning processes using the
LCD SPR approach which culminates in a school performance appraisal meeting involving P6 and P7
learners, teachers, SMC and PTA members and opinion leaders from the community who together
review the school’s SPR and PLE performance. The meeting then agrees a list of school improvement
priorities which are refined to five which drive the improvement plan.
In addition almost all of the focus groups of teachers report that their head teachers undertake
support supervision of their staff and monitor subject scheming, lesson planning and delivery of the
curriculum by their teachers. It was also evident in the four schools visited that there is an
operational management team with heads of department. The level of supervision and support that
these heads of department provide to the teachers in their department varied, but the existence of
this management structure is an important development.
A further area of possible impact on the schools relates to the health, hygiene and HIV training that
LCD provided. The training for this element of the project occurred early in the project and was not
repeated regularly. Generally the project schools struggle with provision of clean water (with
learners in one school collecting water from a river, while in another water is collected from a busy

22
borehole 100 metres from the school). Most schools had huge plastic water-tanks provided by
government or donors which have ceased operating sometime back. The schools also struggle with
provision of adequate toilets as discussed earlier. In these conditions there was little that LCD could
do that would ensure that such schools used proper hygiene protocols. As a result there was little
evidence of the impact of this aspect of the training, except in every school having a senior woman
teacher and each of these having a store of sanitary pads and even spare uniform skirts for
menstruating girls.
It is reported that the HIV training had an early impact and had raised awareness and sensitivity to
the issue among teachers towards learners and each other. However, as with much of the early
training, regular transfers of teachers has appeared to dilute the impact in any particular school. This
is a problem that impacts negatively on progress across the Ugandan education system and seems to
be largely immune to logic and pressure.
Overall the most important effect of the training of teachers and head teachers may be less on their
practice and more on their confidence and improved attitude and engagement with their jobs. The
community members across the case study schools consistently reported that teachers are more
serious about their work, are absent less often, and engage with the community more positively
than in the past. They attribute these changes to the project. While these are somewhat intangible
gains until they impact on learner performance, they should not be dismissed. They talk to
increasingly professional learning environments. The LCD facilitators and a few of the head teachers
also observed that the work with LCD had made school communities more self-reliant and much
more prepared to seek local and internal solutions to their challenges. Interestingly in one LCD-led
school performance appraisal meeting - which I attended during the evaluation - after finishing the
business of the meeting, the members held a community discussion on a thorny issue. This was led
by LC1 (locally elected Local Council) officials. The issue was how to bring a direct road to the school
through the lands of community members who have opposed such a road. It was clear that the
school community believed that it had the power to sort out this thorny issue.
8. Impact of the Agricultural-focused Interventions
The interviews and the evidence collected at schools and the district office indicate that the most
significant aspect of LCD’s intervention was the agricultural programme. All 27 schools received
agricultural tools, and agricultural inputs such as seeds, vines, and insecticides along with training on
farming techniques and farm and group management for the community groups.
The impact of the programme was not universal across all 27 schools and was experienced
somewhat differently even in the schools which embraced this intervention. However, there are
certain constants that came through the visits to all 12 schools. These are that all of the schools:
Have school gardens whether on their own land or on community members’ land abutting
the school;
Have had success in getting community members to voluntarily plough the school gardens;
Have experimented with growing non-traditional crops such as eggplants, carrots, cabbage,
tomatoes and onions;
23
Have formed at least one community group which worked with the school and LCD to
improve their own farming practices and influence other farmers – but which in all cases
have lost over half their original members and in many cases have ceased to operate;
Have used the produce from their gardens to feed learners for a few months of the year;
Have developed a positive view of agriculture among learners: it is increasingly seen as a
respectable and profitable way of earning a
living by community members and learners;
Report that some learners have used the
experience that they have gained to improve
production at home on their family lands.
All the schools operate school feeding schemes for at
least a few months every year – generally in October
and November. In most schools the teachers are also
fed. The school meals consist of sweet potatoes,
cassava or maize meal with or without a relish of
green grams, eggplant or tomatoes.
All the respondents agreed that learners are more
attentive and learn better during third term as they
are not hungry. Being the main exam term this is
significant and allows schools to operate early
morning and late afternoon revision classes for the
P7s. Equally the teachers reported that they find
teaching easier if they have had lunch. Some head
teachers reported that many teachers would normally go hungry as they lack the facility and time to
make their own lunch at home during the lunch break. All the schools reported that learner and
even teacher attendance is improved when the school feeding scheme is working.
Many of the project schools treat the making of the food as a leadership and team building activity
for learners and in these schools the learners organise the whole process including the serving of the
food. In a few schools a local person is employed to cook for the learners – paid for by parental
contributions - and the learners assist with the serving.
The evaluation shows that there are weaknesses in the demonstration garden model LCDU is using.
As originally constituted the school garden and community group model were unsustainable. The
schools often occupy well over 20 acres of land, but none of the 9 schools visited in late 2014 were
using more than 4 acres and most were planting only 1 or 2 acres. As a result of planting such a small
part of their land school feeding schemes are only operational in term 3 in most schools. The value
of school feeding schemes is fully felt when children are fed throughout the year. The result of
partial feeding is that some learners dropout in terms 1 and 2 and then re-enrol in term 3 creating
unexpected challenges for their teachers – which are discussed in section 11.2. The schools claim
that they do not plough more land because they lack oxen and ploughs so are dependent on the
good will of the villagers to plough their land. This is honoured, but almost always after the owner
has ploughed their own land and that of other villagers who can pay for the service. This means that
schools plant late, leaving them more prone to flood and drought. It also means that they have no
chance of planting two crops a year – which is possible but risky in Katakwi District. As a result of this
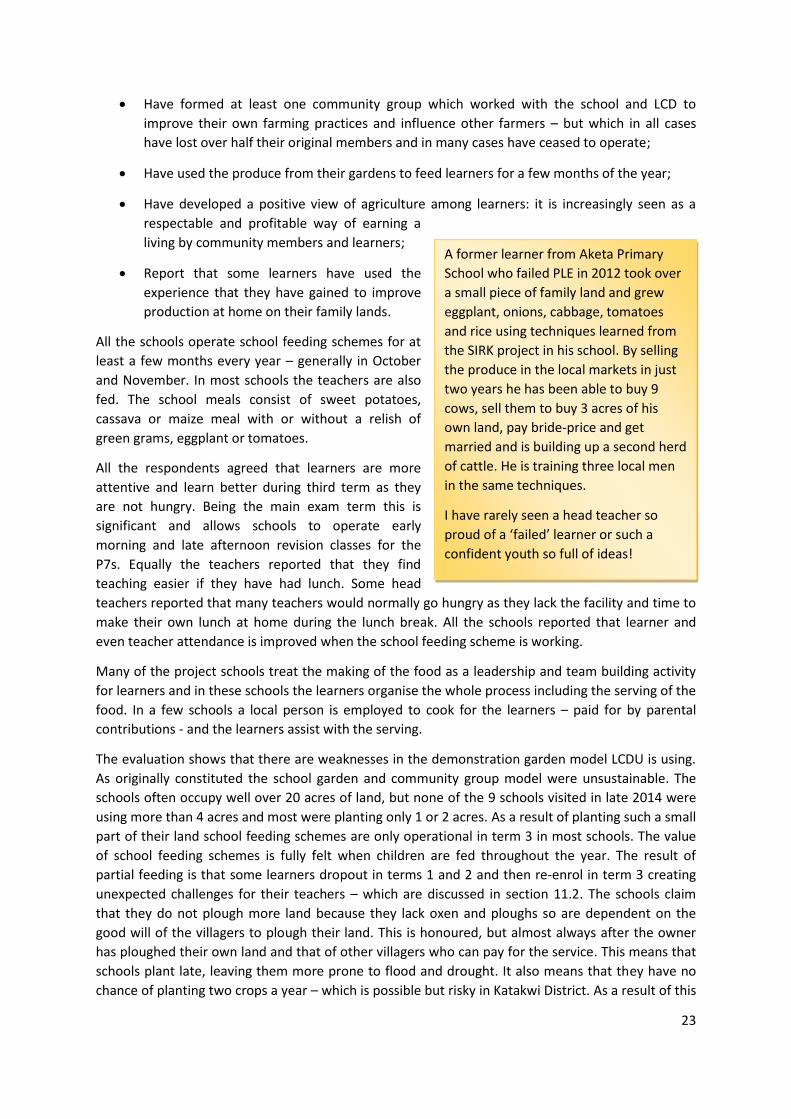
A former learner from Aketa Primary
School who failed PLE in 2012 took over
a small piece of family land and grew
eggplant, onions, cabbage, tomatoes
and rice using techniques learned from
the SIRK project in his school. By selling
the produce in the local markets in just
two years he has been able to buy 9
cows, sell them to buy 3 acres of his
own land, pay bride-price and get
married and is building up a second herd
of cattle. He is training three local men
in the same techniques.
I have rarely seen a head teacher so
proud of a ‘failed’ learner or such a
confident youth so full of ideas!
24
realisation the last phase of the project provided oxen and ploughs to five of the most committed
schools. It will be informative to see whether in 2015 this allows them to plough and plant more
land. This though leads to another challenge that the schools have been facing: the issue of seeds
and vines.
According to LCD staff the main weak link in the school feeding and school garden system appears to
be that there is little tradition in these communities of keeping back vegetable seeds, cassava
cuttings or sweet potato vines as planting stock for the next season. Part of the reason for this is that
most farmers have very limited storage capacity and do not want to keep planting stock that is likely
to be eaten by rodents or beetles. As a result they were dependent on LCD each year to provide new
vines, cuttings or seeds. Schools could – and increasingly do – store excess production and plant
stock, but this is a late addition to the project, and is only seen in a few schools.
Another weakness relates to the community groups which the project promoted and trained, Most
do still exist, but in all 12 schools visited they are usually reduced in size, from some 30 members to
between 10 and 15 members. Possibly this is the optimum size in these communities for such
committees. Larger groups possibly have more personal tensions and are more difficult to organise.
On a more positive note, in most cases they are still fulfilling the agricultural and school support role
that they were created for and in addition some have taken on other roles which are discussed
below.
Some schools have used the training and support from LCD to add value to the original project. This
includes:
Storing excess food in the third term and selling it to buy maize flour so as to extend the
learners’ feeding scheme into term 1;
Slicing and drying excess sweet potatoes produced in the third term and rehydrating them to
feed the learners in term 1;
Organising parents and other community members to contribute excess dried sweet
potatoes or cassava at the start of term 1 to continue the feeding scheme for their children
through the year;
Growing cassava and vegetables which can be harvested more regularly to supplement their
UPE grant;
Selling excess produce to buy goats, sheep or pigs which reproduce fast. Share the offspring
among community group members;
Learners from the project schools taking their skills back to their homesteads and improving
the farming methods that their parents are using (See Box 1 above);
The generation of additional projects which have been inspired by the existence of
community groups for SIRK project – this includes the development of woodlots in a small
number of schools.
The twelve community members in the four case study schools who were interviewed agreed with
findings from the schools visited in November 2014, in that they asserted that their agricultural
practices have changed as a result of the project. This involves planting rather than broadcasting,
effective use of pesticides and insecticides, use of manure, managed harvesting and effective
storage and use of produce both as a source of food and income. There is also a nascent system of

25
some local farmers specialising in producing sweet potato vines for use by other farmers and
schools.
The community groups in a minority of schools have established a side-line in developing village
saving and lending associations (VSLAs), sometimes involving teachers. These schemes collect small
amounts of money monthly from members and then distribute funds at regular intervals or
increasingly use the funds to buy animals. When these breed they share the offspring among
members. What this seems to be doing is building financial and income generating capacity. This is
critical for community members returning to their land and teachers to supplement their income.
One VSLA saved Ugx 500,000 in 2014 based on members contributing Ugx 2000 per week. This group
has 25 members of which 8 are teachers and 17 community members. The VSLAs have the
unintended consequence of binding community members and teachers together in a shared
venture. Schools report that this leads to higher levels of community engagement with the learning
process in the schools, and a readiness to protect the school against vandalism and stray animals.
Alongside the community groups a few individual local farmers have used LCD’s work with the
schools to learn new methods and commercialise their production. One middle aged farmer with
land next to the school as a member of the school’s SMC lends the school land as this school has
none of its own. In turn he has learned to grow vegetables, particularly onions, established markets
and now he provides support to the school in its production and marketing.
9. Findings: The Theory of Change and Achievement of the Key
Proposed Outcomes
The Theory of Change asserted, in summary, that dependent IDP communities would be more likely
to return to their ancestral lands and become independent of aid
if they had access to improved farming methods and a functional
school as a community anchor and generator of new ideas. All
interviewees in the four case study schools as well as in the
district office and in LCD were asked whether LCD has succeeded
in this objective and if so how it has succeeded. The answer was
unanimous that LCD played a critical role in both persuading
communities to leave the IDP camps and open up their ancestral lands which had lain unused for
many years, while also helping ease families back into their community and giving the community
shape and hope by developing schools as centres of community education and activity: exciting
centres of energy. They reported that the football, music, dance and drama competitions that LCD
introduced motivated children to enrol, a process which was reinforced with the development of
gardens and the feeding schemes.
It is impossible in the context of this study to ascertain to what extent LCD was responsible for the
speeding up and easing of a process of return that had already commenced before the project
started. The testament of members of these communities is significant. They argued convincingly as
the following quotes from community members indicate;
“Link has succeeded in its
main objective of resettling
IDP communities a hundred
percent” District Education
Officer
26
“It has helped. Training on modern agricultural means the community has coped with
resettlement. We were all in the camp; we are happy to be out. It is better to be self-
sufficient”.
“(SIRK) has helped a lot…it has aided us to come back to our homelands and has broken our
reliance on food handouts, now due to Link we have our own food and it has ended the food
insecurity and it is very pleasing for us to go back to our home areas”.
“(Resettlement) has happened and Link helped by sensitising the community and teaching
the community on skills of agriculture and poverty alleviation so our community is now using
better farming methods than before – you see we still grow tomatoes!”
“(SIRK) has helped. We have all left the camps now. We are all fully cultivating and out of
school children are in school and we have enough food to support them and we can provide
clothing, books and pens – in the camps we couldn’t do that”.
“It was difficult for people to leave the camp without Link because people were reluctant to
leave and their children were ignored as there was not enough food and no way to get
enough money to send our kids to school – they were living on fruit in the bush and drinking
… Link encouraged independency and some parents were able to give their kids a garden so
they can grow food”.
This belief was echoed by some of the teachers and head teachers. As a head teacher and a deputy
head teacher respectively said,
“Link’s work assisted communities leave the camps as it encouraged and trained people to
leave the camps and use the land and not (stay) crying in camps waiting for help – and
people have left and come home”.
“Indirectly the schools became change agents for the community – so Link has scored in
integration of people back into their communities through the work they do in schools”.
In a few schools this belief that LCD had eased resettlement was matched with pride from the
community in their school. This was expressed particularly strongly by community members of the
two case study schools which had scored their first Division 1 pass in 2014.
While the assumption that schools could be used as anchors for returning IDPs was key to the
project’s success, it was a risky assumption. It demanded a strong leap of faith and as such it can be
argued that this project was ground-breaking and a significant experiment in understanding how to
assist rural communities who have become dependent on hand-outs return home and become
economically independent. In fact if anything, those community members who bought into the
techniques that LCD was training them on claim they were more capacitated on returning home
than they had been prior to their relocation into the camps.
27
10. Findings: Relationship between the District & Project Team
As explained earlier, the SIRK was designed in such a way that the relationship between the district
and the LCD project team would be critical to the success of the project. This was because LCD had
developed the project in collaboration with the district and particularly the DEO, and had sited the
project office in the district council offices and integrated it as far as possible into the normal
activities of the district.
Situating the project so close to the district education team meant that collaboration should have
been relatively easy, while it was likely to make it possible for the district to monitor the project and
make it accountable to the district. Before the findings related to the district – project relations are
presented, it should be noted that Katakwi DEO suffered and still suffers a lack of personnel, vehicles
and funding in line with most education district offices. The DEO made clear that the LCD team
assisted her in fulfilling her duties and supervising schools, through providing transport and skilled
personnel to supplement her team. In addition she stressed that the way that LCD has assisted with
providing power to her office, access to computers, a vehicle for her to use to access schools and a
grant of Ugx 500,000 for a few months at the end of the project to supplement government
financing have all helped make her job possible.
The DEO expressed pride that SPR was introduced in her district and has been copied across the
region. She finds the approach, through generating school development priorities with the
community, adds real value to the schools and “works well”.
The DEO explained how she relied on the LCD project manager in Katakwi to deputise for her
occasionally at events and in schools. This situation – while potentially creating role confusion –
indicates that the level of trust that had developed between LCD and the DEO. The LCD interviewees
were at pains to explain that this closeness was critical to the delivery of the project and to whatever
success it has experienced. They explained that this trust allowed LCD full access to schools and
support with the processes which required district involvement such as the SPR data collection and
school planning processes.
The trust that developed between the LCD team and the DEO may have also been critical in
persuading community members to return to their lands and leave the camps. For a non-
government organisation to undertake such a political process would have been well-nigh
impossible without the visible support of government. Community members needed to see that as
they headed home government structures were aware of the project and supported it. It was
significant that LCD undertook a lot of the training it offered in collaboration with local government
departments including NAADS and the health department. The DEO believes this was a critical factor
in the success of the project.
The Assistant Commissioner for Basic Education Standards saw the project as marking a significant
innovation which the MOES would like to see further developed and mainstreamed in post-conflict
areas. He requested a summary document detailing the project.
28
11. Challenges to the Intervention Programme
11.1 Introduction
A number of challenges were mentioned by LCD and their clients at school and district levels during
the interviews and some were supported by documentation. While many were petty or very
personal, others were repeated often during the interviews. These are discussed in this section.
11.2 Relations between LCD and Comic Relief (CR)
It is important to note that a number of the respondents – at school, district and in LCD offices –
commented on the challenges that inconsistent funding caused. There was some speculation but
little knowledge – even among LCD staff – about the causes of the delays in funding. This led to
uncertainty among staff and recipients and caused some erosion of trust between the project and its
beneficiaries. On exploring this in more depth and reading the documentary evidence and
particularly the comments to LCD on its first and second year reviews, it is clear that LCD was
struggling with a number of issues in its management of the project. These included:
LCD provided CR with the Year 2 report on 24th September 2012 seven months after the
agreed deadline of 1st March 2012. In addition, according to CR’s response to the report, CR
was not informed of the delay officially or even about when the report would be delivered.
Not surprisingly CR took a grave view of this delay. This delay seems to have been
compounded by CR’s assertion that LCD failed to respond in time to a request to organise a
project visit in June 2012. LCDU argues that the CR official kept reducing the amount of time
she had available to visit the project and when she proposed trying to visit it for half a day
the national LCD manager indicated this would be inadequate. Whatever the cause, as a
result of this failed visit no one from CR ever had a chance to observe this important project
and better understand the very complex conditions under which it was being delivered.
LCD seemed to be unable to define the project outcomes in a form that CR would find
acceptable. This matter does not seem to have been resolved.
CR in both Year 1 and Year 2 reports requested more detailed qualitative information and
analysis to back up its quantitative data. The assessor was strident in requesting more
critical reflection and analysis of progress and particularly of challenges faced in project
delivery. Again this reasonable request seems to have been largely ignored by LCD.
There were a number of specific requests from CR for more detailed information, which are
found repeated in each report. It appears that LCD management ignored these requests, and
failed to either provide the information required or provide an explanation as to why such
information would be difficult or impossible to provide.
These concerns and LCD’s apparent failure to respond timeously and effectively seems to have led to
a complete breakdown in communications between LCD and CR over the last few years of the
project which created delays in fund drawdown. It also led to a certain level of confusion in LCD’s
Katakwi office as to what they were able to do, how much funding they would be accessing and
when it could be expected. Such uncertainty makes delivery of such a complex project very difficult.
29
Although much of the data for this subsection comes from CR’s reports, and was not addressed by
key LCD managers from that time, who have now left the organisation, the interview information
from LCD staff broadly reflects this analysis. These interviews indicate that although the national
managers got the reports in to LCD International on time their attempts to get more detailed
information to meet CR’s concerns were largely ignored by the Katakwi LCD management. It appears
that this impasse created delays, which changes of staff in the LCD UK office may have further
compounded. Whatever the cause the Year 2 report was sent in to CR very late.
Until 2014 there is no evidence that LCD’s Chief Executive intervened to resolve this situation. In
retrospect it is worrying that neither the CEO nor CR put more pressure on LCDU and the project
team to adhere to reporting strictures and to organise a site visit for CR. If there had been more
concerted pressure it might have led to more sustained delivery and targets – such as the training
targets for school personnel – being met. As it is, when some sort of understanding was reached
between the two parties the last tranche of funding reached LCDU in September 2014 with
impossibly tight spending timeframes.
While the communication problems between CR and LCD and the apparent failure of LCD to meet
CR’s reporting expectation are in themselves important issues, the impact it had on the flow of funds
for the project was hugely significant. It impacted negatively on the ability of the project staff to
undertake programmed activities in line with plans for nearly half of the project’s life-span.
It is worth noting that in the last months LCD International has sorted out its internal issues and has
been able to undertake project closure processes efficiently and is on track with reporting to CR.
The fallout from this situation is that CR was unable or did not provide support for LCDU in regard to
delivering the change which was intended through the SIRK project and failed to use its
organisational assets in support of the change. This also means that it is hard for this evaluator to
comment on CR’s approach to grant making. CR did not – according to the project reports and
interviewees – link LCDU and SIRK to other CR funded projects and its role did not assist the project.
Because the situation led to a temporary suspension in the flow of funds, CR’s grant management
process in reality impacted negatively on the delivery of the project – however justified CR was in
making that decision.
11.3 School Level Challenges
The interviewees discussed a number of challenges to the project beyond the control of LCD or the
government, which impacted at school level. These included the downside of feeding schemes; stray
animals destroying the gardens; the effects of increasingly unpredictable weather; and the impact of
rotation of teachers between schools.
When the feeding schemes are operating more children attend school – including under-age
children who are sent by their parents into P1. This creates challenges for the teachers in
delivering the curriculum. As one head teacher stated in November 2014,
“We will have a lot of kids come back (to school) when we start feeding next month.
But this will create problems for the teachers as they don’t fit in”.
The head teacher went on to explain this was because they may have missed months of
work and lost many of the skills they developed before they absented themselves during the
rainy season.
30
All the schools and community groups mentioned the difficulty of keeping animals out of the
school gardens, particularly at the start of the dry season when crops are being harvested.
This impacts negatively on the ability of schools to maintain vegetable stock and sweet
potato vines. Although there are sub-county by-laws which should lead to the owners of the
animals being fined, these are never used by the authorities and one school reported that
community members get angry if they try and keep their animals away from the school’s
crops, as if they have a right to feed their livestock on school gardens.
The problems created by stray animals compounds the fact that the area is very prone to
drought and flood. This has led to some of the school gardens losing crops and has caused
some of the community groups to fold as they were not able to make any profit.
Finally, the project has been affected by the regular and often apparently illogical movement
of school teachers and particularly head teachers within the district. This movement could
mean that LCD’s impact is spread to non-project schools, but its more immediate impact is
to undermine project schools’ ability to implement the training and to undermine the
morale of teachers generally. This is particularly the case – as in one of the case study
schools – where the teacher who was trained by LCD at the start of the school holiday was
moved by the end of the holiday before cascading the training to other members of staff.
31
12. Conclusions
12.1 To what extent were the project outcomes achieved?
The core SIRK objective, of assisting 27 communities to return to their ancestral lands following the
end of an armed conflict using the school as an anchor and a centre for generating and improving
agricultural practices in the target communities, was largely achieved. These communities now
appear as settled agricultural communities, much like those across Uganda. If anything, they have a
greater range of income generating opportunities than many rural communities, with cultivation of
vegetables for local markets, use of modern farming techniques, communal farming and saving
activities and the absorption of young school dropouts as productive members of these farming
communities. All of these improvements have been catalysed or augmented by the SIRK Project, and
are in line with the project’s Theory of Change. Against this success must be counted the struggle to
maintain the community groups as operational viable concerns and the problems associated with
creating community level generative capacity to provide new seeds and vines each year and to
extending the areas under crops to maximise production on school land which is presently under-
utilised and is unable to sustain a school feeding programme throughout the year.
The accompanying outcome of assisting the public schools in these communities become more
functional has also been partially achieved. The SPR results indicate general improvements in the
functionality of the schools particularly in relation to their classroom practice, management
performance, involvement of the community and school governance. Improvement in school
hygiene and safety standards have not been sustained, except in relation to understanding and
responding to the needs of menstruating girls. However, school feeding schemes based on school
gardens and community contributions have led to improved child nutrition during the dry season
and better attendance, with its attendant challenges for teachers. The project staff and selected
schools anticipate that the provision of oxen and ploughs to these schools should have the effect of
extending the school gardens and allowing school feeding to be extended throughout the year, with
consequent impact on sustained school enrolment and teacher and learner performance.
The aim of improving the performance of the schools was less clearly achieved. While there were
improvements in PLE results in the project schools, particularly early on in the project, these were
often not maintained. Where there has been general improvement is in the number of girls reaching
P7 and sitting PLE in the project schools. There is also some evidence in the project schools that
there have been improvements in learner and teacher attendance and retention rates in the lower
grades, although this has not been sustained up to P7 where learner numbers have not increased
consistently. However, female learner retention throughout the primary cycle has improved in
project schools. At the same time there have been clear improvements in school planning and
engagement with their communities, along with improved school governance practices with both
managers and governors of schools being made aware of their respective roles and playing them.
Finally, the district staff and LCD agree that the district office has been able to be more effective in
its work of monitoring and supporting schools through its collaboration with the SIRK Project team.
This has been driven by bringing innovative practices to the district, such as SPR, training the district
staff and providing material support. However, the district education office remains so understaffed
and under-resourced that it will be hard-pressed to continue the school support processes that LCD
has been driving.
32
Against this relative success, there is no doubt that the deteriorating relationship between LCD and
CR and its impact on the flow of funding undermined both the trust that the district authorities and
schools had built up in LCD and its staff and on the ability of the project to sustain its impact on
schools and communities. This impacted negatively on the project’s cost effectiveness as it appears
some funds were never drawn down and others were not used optimally as they came when the
delivery team did not expect them. However, the impact of the project on 27 communities with their
27 schools and a population of some 50,000 means that the funds were well used with an average of
some £14.25 being spent per community member, or £26,370 being spent on each community,
including its school. Given how the project has helped transform the lives of these community
members and assisted in allowing normality to re-emerge in this part of the country the cost would
appear low. Whether the money, if it had been spent in other ways, would have had a greater
impact on the return of these communities to their ancestral lands is hard to calculate. As the school
is the only government institution in most of these communities and as resettlement was unlikely to
have occurred without a community belief that the government was supporting it, we must
conclude that this was the only logical approach which had a fair chance of success. Other
approaches could have invested the money in the communities and their farms, however this might
have been less sustainable and would not have impacted directly on child nutrition and upgrading
the skills of the next generation.
12.2 How has the project made a difference?
There was unanimity among those interviewed from all stakeholder groups in each community that
the SIRK Project has had a fundamental impact on their lives and their school’s functionality. There
seems little doubt that along with assisting the communities return to their lands, its focus on
community engagement has led to closer community school relations and increased levels of
confidence in these communities and schools. LCD’s employment of young social workers and an
agricultural expert, as well as its use of local government technical experts to assist with training,
were factors in building community success and confidence. However, it seems that the key element
was LCD’s close association with the local government structures which gave the communities
confidence in returning home. NGOs often forget that vulnerable communities are unlikely to take
risks unless they are sure those in power support and are associated with the initiative. While not all
community groups survived the five years of the project, there seems little doubt that all of them
assisted in generating agricultural recovery in their particular community and school.
LCD’s impact on the agricultural practices of the communities it was working with was based on a
process of working closely with members of these communities in Ateso, and building their
suggestions and needs into the model. Hence, the final input of oxen and ploughs along with sheep
was based on careful discussions with the communities about what inputs would assist most in
sustaining the gains made by the project at school and community level.
By linking growing food and gaining an income from farming with schools and their gardens, there is
little doubt that LCD captured the imagination of some communities and their individual members.
LCD seems to have been able to open doors and provide enough support that the community groups
and some individual farmers over the course of the project felt able to save money, invest and grow
their land area, increase their variety of crops and marketing activities and so show that in Katakwi
farming can be profitable. At the same time community members have increasingly seen the school
as a useful partner and not an alien government institution. This, along with LCD’s community
advocacy work, teacher support and the SPR process, appears to have helped increase learner
enrolment, retention, teacher commitment and parental engagement with the schools.
33
Whether SIRK will lead to lasting change in the schools is hard to say, however the respondents
during the interviews were all – without any exceptions – adamant that in the schools they would
continue to use child-centred methodology and in the communities and schools the new methods of
farming would be sustained. The most significant change through the project, which has already
been sustained, is the successful resettlement of IDPs into their villages with a viable economic base.
A significant additional success has been the retaining of young people in the community who have
learned to see agriculture as a viable life-style choice.
While the policy implications of this success are recognised at district level, it is important that LCD
through the dissemination workshop and subsequent publications and engagements, convinces
politicians and other significant players that the model developed in Katakwi works and could be
replicated in other situations where refugees are reluctant to return to their ancestral homes after
being dependent on hand-outs. The Uganda Ministry of Education and Sports (MOES) has recognised
the project (see Annex C) as a potential model for assisting returnees in post-conflict situations
return home and engage in productive farming activities quickly with the support of their schools
and government agencies. This recognition needs to be further developed with the Office of the
Prime Minister and the Ministry of Agriculture.
13. Recommendations
There is no doubt that SIRK is an important initiative that should be further funded, extended and
fully documented. It is not too surprising that key elements of the approach have influenced the
MOES and UNICEF, which are using processes of school appraisal in the national Monitoring of
Learning Achievement (MLA) and BRMS initiatives which have been influenced by SPR, and a number
of NGOs copying the school agricultural extension and school feeding aspects of the project.
However, it is the opinion of this evaluator that the beauty of the project lies in its unique
combination of complementary initiatives. Its potential as a model for assisting rural communities
recover from dependency as a result of being confined in camps should be further explored and
documented. Successful rural development projects of this nature are rare and need to be fostered.
While LCD should take a lead in this, funders should be prepared to fund this extension and
documentation process. Particular attention would need to be paid to the optimal size for rural
community groups, as well as innovative ways of generating seeds and vines at school and village
level to sustain production and extend production so that more than a few acres of school land can
be ploughed. The impact of schools owning oxen and ploughs will need to be assessed to see if it
allows schools to plough more land and so extend the period when they can feed learners. If these
problems cannot be resolved with community level solutions then the model is not replicable.
However, the evaluator believes that these are challenges which can be solved by the schools and
their communities.
The impact of the project would have been more easily measured if LCD had initiated the project
with a full baseline survey, although the first SPR process provided valuable data on the schools early
on in the project’s life-cycle. By the same token an element of learner testing, such as UWESO or
EGRA, would have helped gauge whether the project had impacted on learner knowledge and skills.
The PLE is too blunt for this purpose, particularly as the project was focusing more on early grade
learners and teachers.
34
References
Government of Uganda (2014) National Population and Housing Census 2014: Provisional Results.
Kampala: GoU
Katakwi District Local Government (2013) Katakwi District: Statistical Abstract 2012 – 2013. Kampala:
Government of Uganda.
Uganda Bureau of Statistics (2010) Uganda Education Statistical Abstract. Kampala: UBOS.
Uganda Bureau of Statistics (2013) 2013 Statistical Abstract. Kampala: UBOS.
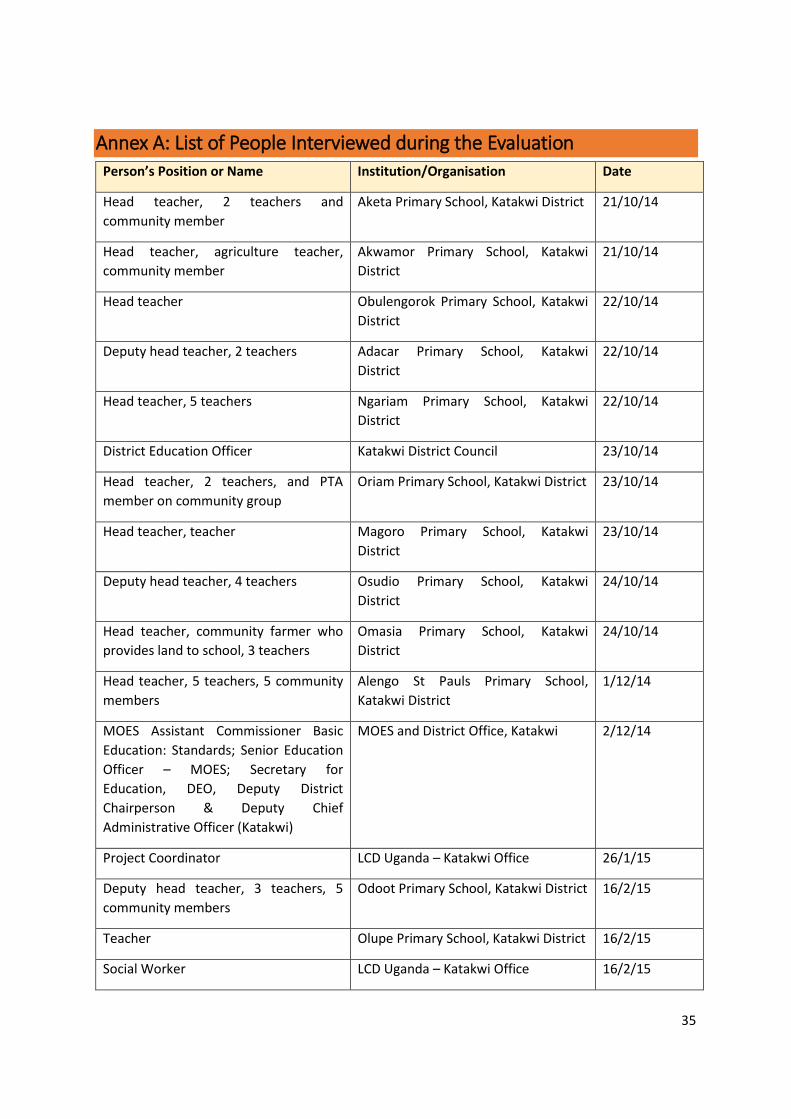
35
Annex A: List of People Interviewed during the Evaluation Person’s Position or Name Institution/Organisation Date
Head teacher, 2 teachers and
community member
Aketa Primary School, Katakwi District 21/10/14
Head teacher, agriculture teacher,
community member
Akwamor Primary School, Katakwi
District
21/10/14
Head teacher Obulengorok Primary School, Katakwi
District
22/10/14
Deputy head teacher, 2 teachers Adacar Primary School, Katakwi
District
22/10/14
Head teacher, 5 teachers Ngariam Primary School, Katakwi
District
22/10/14
District Education Officer Katakwi District Council 23/10/14
Head teacher, 2 teachers, and PTA
member on community group
Oriam Primary School, Katakwi District 23/10/14
Head teacher, teacher Magoro Primary School, Katakwi
District
23/10/14
Deputy head teacher, 4 teachers Osudio Primary School, Katakwi
District
24/10/14
Head teacher, community farmer who
provides land to school, 3 teachers
Omasia Primary School, Katakwi
District
24/10/14
Head teacher, 5 teachers, 5 community
members
Alengo St Pauls Primary School,
Katakwi District
1/12/14
MOES Assistant Commissioner Basic
Education: Standards; Senior Education
Officer – MOES; Secretary for
Education, DEO, Deputy District
Chairperson & Deputy Chief
Administrative Officer (Katakwi)
MOES and District Office, Katakwi 2/12/14
Project Coordinator LCD Uganda – Katakwi Office 26/1/15
Deputy head teacher, 3 teachers, 5
community members
Odoot Primary School, Katakwi District 16/2/15
Teacher Olupe Primary School, Katakwi District 16/2/15
Social Worker LCD Uganda – Katakwi Office 16/2/15
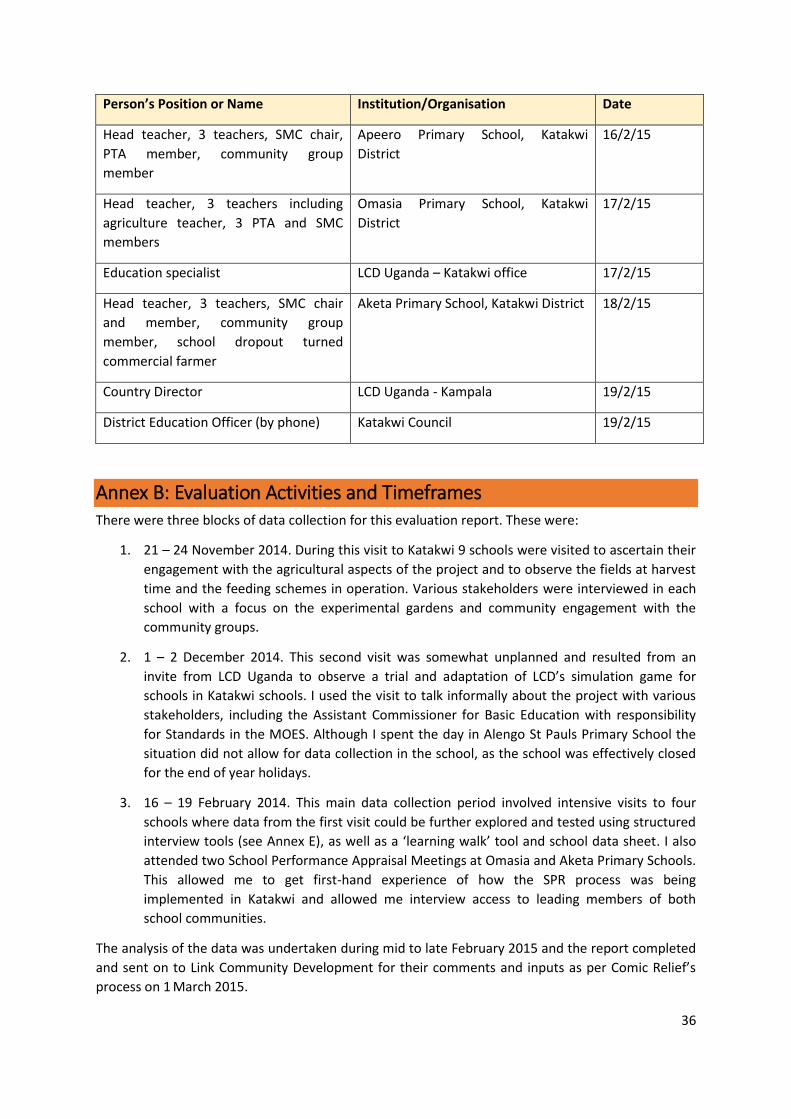
36
Person’s Position or Name Institution/Organisation Date
Head teacher, 3 teachers, SMC chair,
PTA member, community group
member
Apeero Primary School, Katakwi
District
16/2/15
Head teacher, 3 teachers including
agriculture teacher, 3 PTA and SMC
members
Omasia Primary School, Katakwi
District
17/2/15
Education specialist LCD Uganda – Katakwi office 17/2/15
Head teacher, 3 teachers, SMC chair
and member, community group
member, school dropout turned
commercial farmer
Aketa Primary School, Katakwi District 18/2/15
Country Director LCD Uganda - Kampala 19/2/15
District Education Officer (by phone) Katakwi Council 19/2/15
Annex B: Evaluation Activities and Timeframes There were three blocks of data collection for this evaluation report. These were:
1. 21 – 24 November 2014. During this visit to Katakwi 9 schools were visited to ascertain their
engagement with the agricultural aspects of the project and to observe the fields at harvest
time and the feeding schemes in operation. Various stakeholders were interviewed in each
school with a focus on the experimental gardens and community engagement with the
community groups.
2. 1 – 2 December 2014. This second visit was somewhat unplanned and resulted from an
invite from LCD Uganda to observe a trial and adaptation of LCD’s simulation game for
schools in Katakwi schools. I used the visit to talk informally about the project with various
stakeholders, including the Assistant Commissioner for Basic Education with responsibility
for Standards in the MOES. Although I spent the day in Alengo St Pauls Primary School the
situation did not allow for data collection in the school, as the school was effectively closed
for the end of year holidays.
3. 16 – 19 February 2014. This main data collection period involved intensive visits to four
schools where data from the first visit could be further explored and tested using structured
interview tools (see Annex E), as well as a ‘learning walk’ tool and school data sheet. I also
attended two School Performance Appraisal Meetings at Omasia and Aketa Primary Schools.
This allowed me to get first-hand experience of how the SPR process was being
implemented in Katakwi and allowed me interview access to leading members of both
school communities.
The analysis of the data was undertaken during mid to late February 2015 and the report completed
and sent on to Link Community Development for their comments and inputs as per Comic Relief’s
process on 1 March 2015.
37
Annex C: Government and NGO Players Involved in Sharing Results of
the Summative Evaluation and Letter of Support from MoES
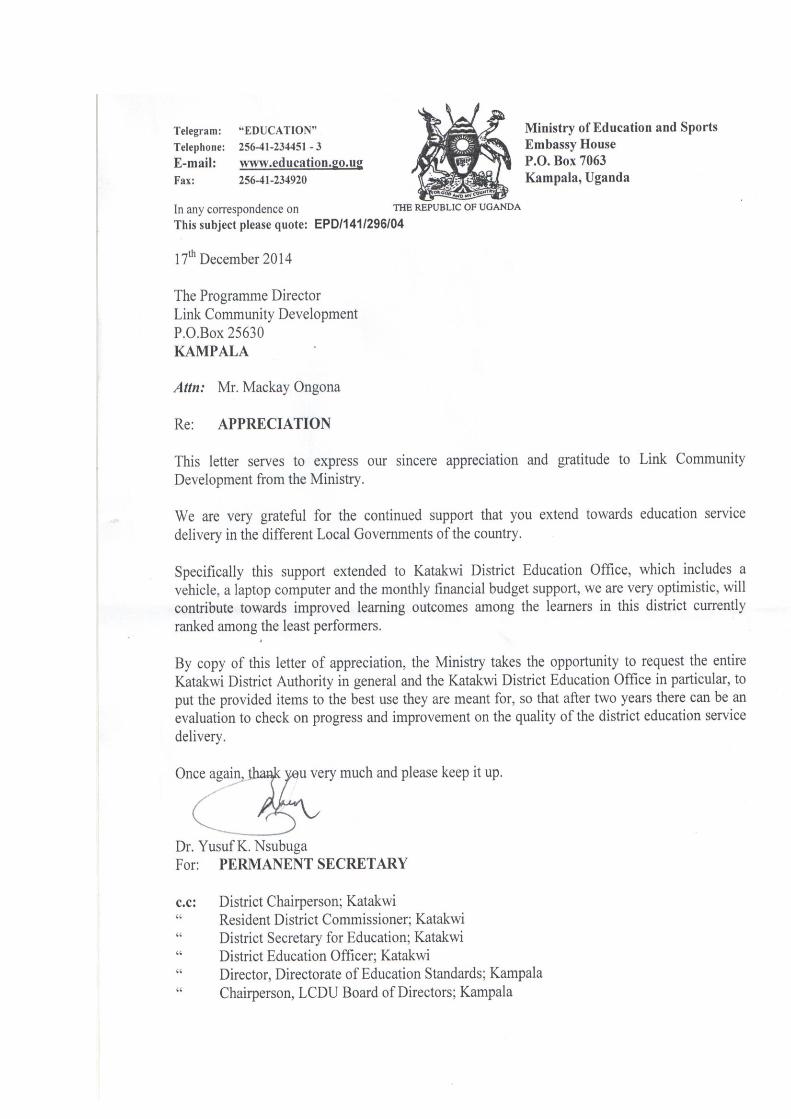
38
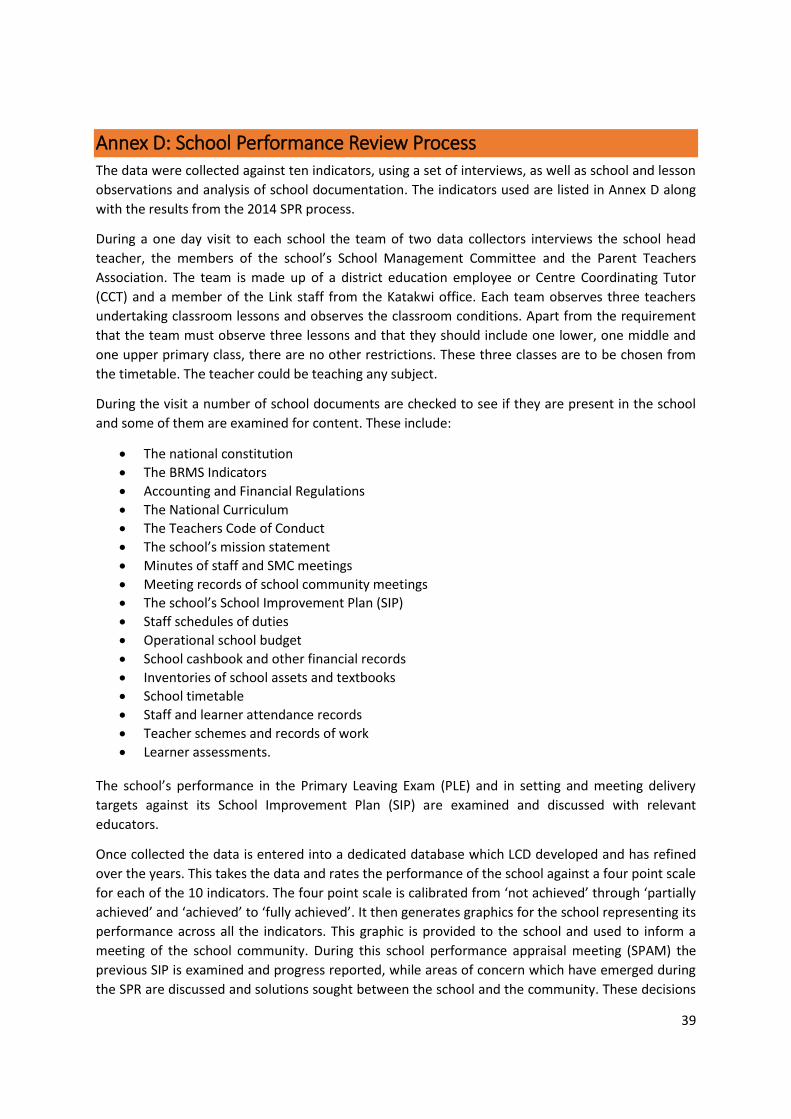
39
Annex D: School Performance Review Process The data were collected against ten indicators, using a set of interviews, as well as school and lesson
observations and analysis of school documentation. The indicators used are listed in Annex D along
with the results from the 2014 SPR process.
During a one day visit to each school the team of two data collectors interviews the school head
teacher, the members of the school’s School Management Committee and the Parent Teachers
Association. The team is made up of a district education employee or Centre Coordinating Tutor
(CCT) and a member of the Link staff from the Katakwi office. Each team observes three teachers
undertaking classroom lessons and observes the classroom conditions. Apart from the requirement
that the team must observe three lessons and that they should include one lower, one middle and
one upper primary class, there are no other restrictions. These three classes are to be chosen from
the timetable. The teacher could be teaching any subject.
During the visit a number of school documents are checked to see if they are present in the school
and some of them are examined for content. These include:
The national constitution
The BRMS Indicators
Accounting and Financial Regulations
The National Curriculum
The Teachers Code of Conduct
The school’s mission statement
Minutes of staff and SMC meetings
Meeting records of school community meetings
The school’s School Improvement Plan (SIP)
Staff schedules of duties
Operational school budget
School cashbook and other financial records
Inventories of school assets and textbooks
School timetable
Staff and learner attendance records
Teacher schemes and records of work
Learner assessments.
The school’s performance in the Primary Leaving Exam (PLE) and in setting and meeting delivery
targets against its School Improvement Plan (SIP) are examined and discussed with relevant
educators.
Once collected the data is entered into a dedicated database which LCD developed and has refined
over the years. This takes the data and rates the performance of the school against a four point scale
for each of the 10 indicators. The four point scale is calibrated from ‘not achieved’ through ‘partially
achieved’ and ‘achieved’ to ‘fully achieved’. It then generates graphics for the school representing its
performance across all the indicators. This graphic is provided to the school and used to inform a
meeting of the school community. During this school performance appraisal meeting (SPAM) the
previous SIP is examined and progress reported, while areas of concern which have emerged during
the SPR are discussed and solutions sought between the school and the community. These decisions
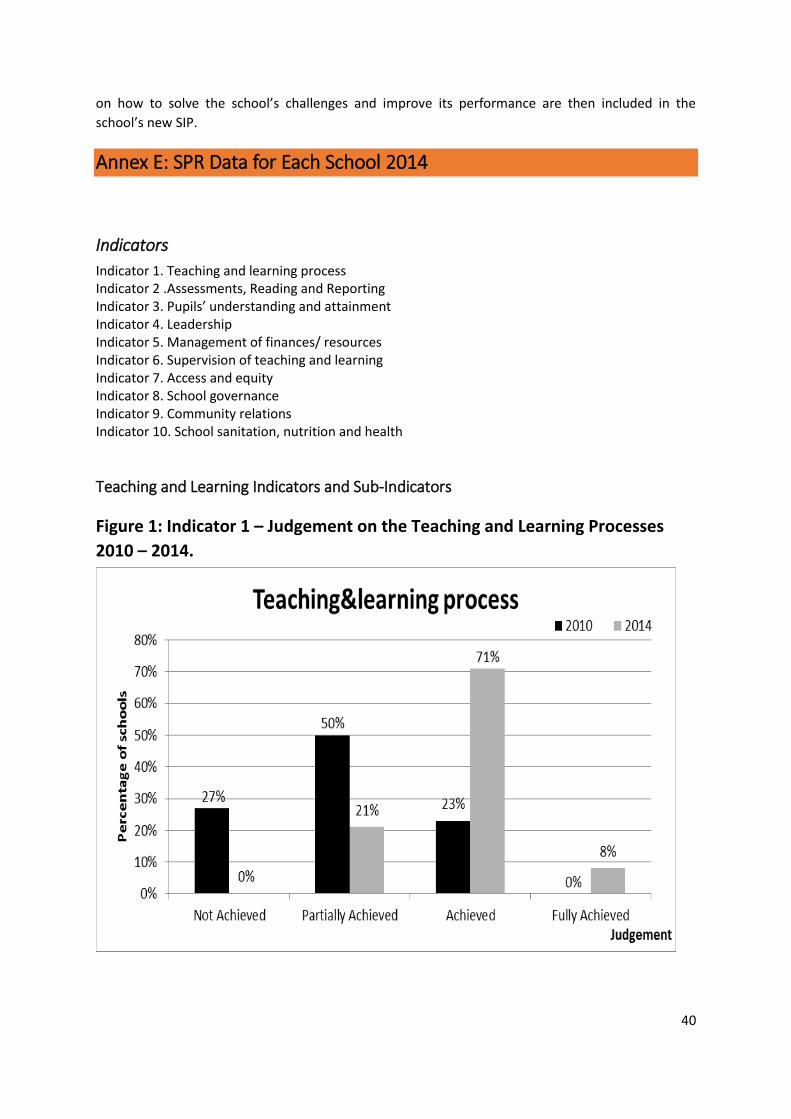
40
on how to solve the school’s challenges and improve its performance are then included in the
school’s new SIP.
Annex E: SPR Data for Each School 2014
Indicators
Indicator 1. Teaching and learning process Indicator 2 .Assessments, Reading and Reporting Indicator 3. Pupils’ understanding and attainment Indicator 4. Leadership Indicator 5. Management of finances/ resources Indicator 6. Supervision of teaching and learning Indicator 7. Access and equity Indicator 8. School governance Indicator 9. Community relations Indicator 10. School sanitation, nutrition and health
Teaching and Learning Indicators and Sub-Indicators
Figure 1: Indicator 1 – Judgement on the Teaching and Learning Processes
2010 – 2014.
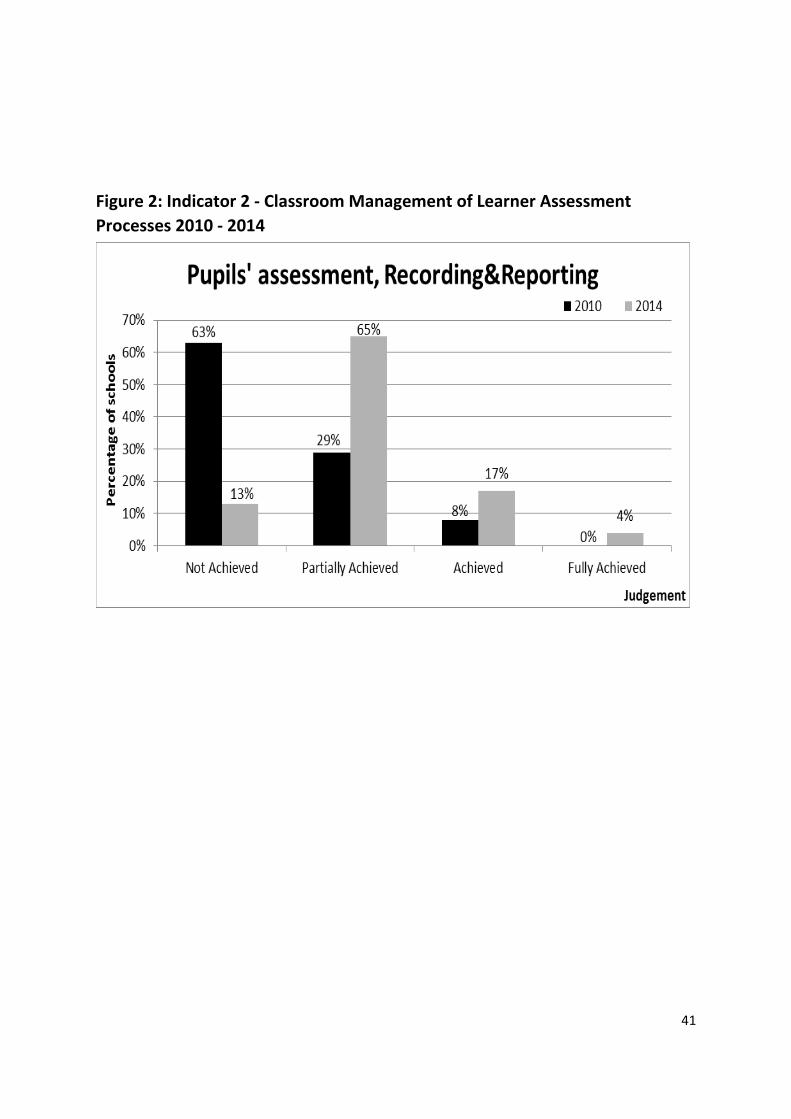
41
Figure 2: Indicator 2 - Classroom Management of Learner Assessment
Processes 2010 - 2014
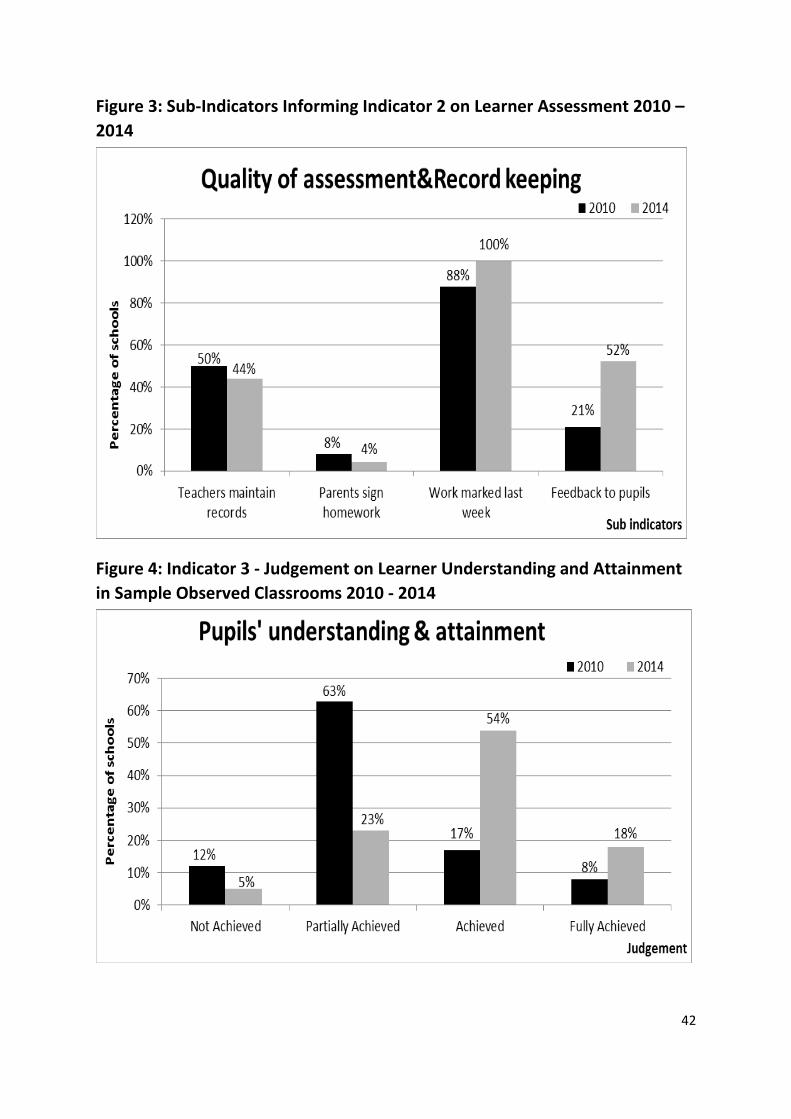
42
Figure 3: Sub-Indicators Informing Indicator 2 on Learner Assessment 2010 –
2014
Figure 4: Indicator 3 - Judgement on Learner Understanding and Attainment
in Sample Observed Classrooms 2010 - 2014
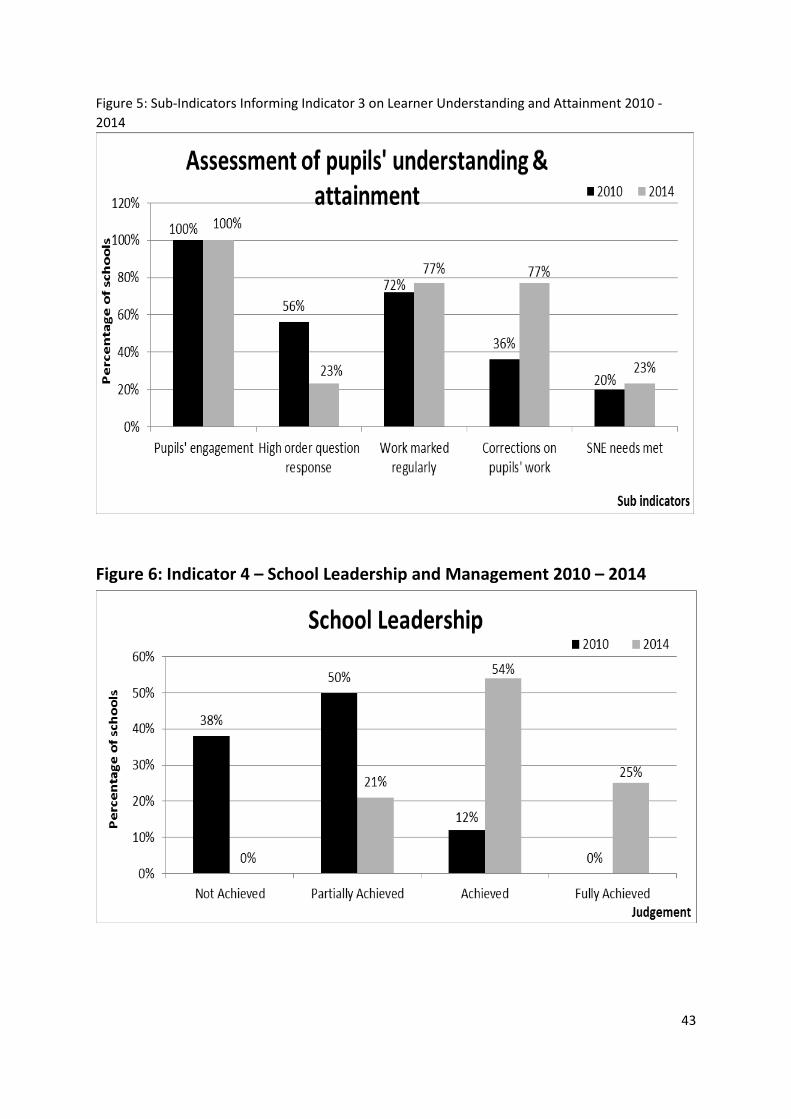
43
Figure 5: Sub-Indicators Informing Indicator 3 on Learner Understanding and Attainment 2010 -
2014
Figure 6: Indicator 4 – School Leadership and Management 2010 – 2014
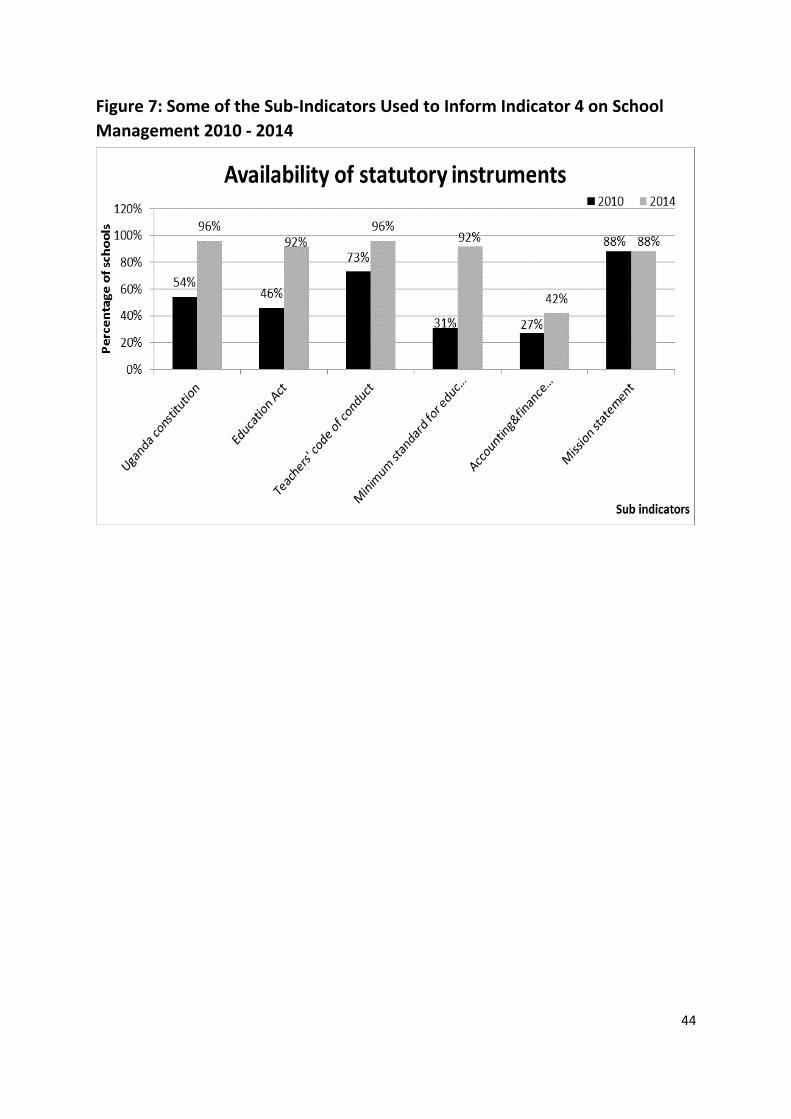
44
Figure 7: Some of the Sub-Indicators Used to Inform Indicator 4 on School
Management 2010 - 2014
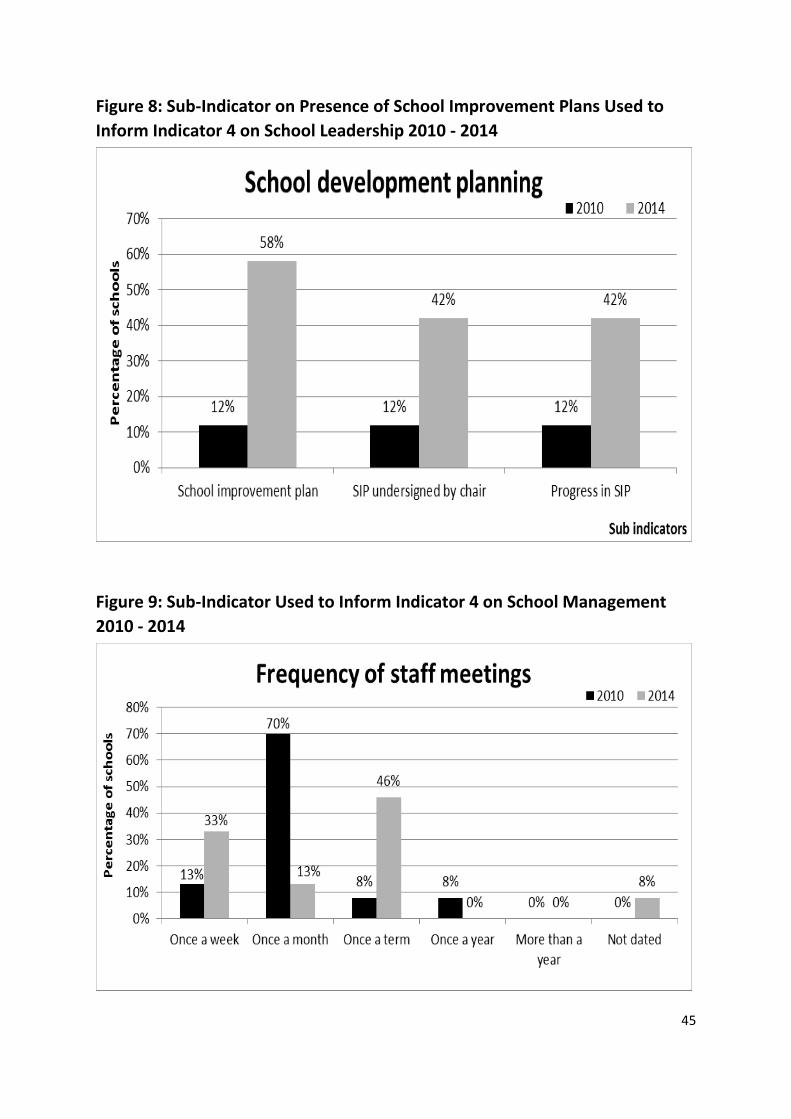
45
Figure 8: Sub-Indicator on Presence of School Improvement Plans Used to
Inform Indicator 4 on School Leadership 2010 - 2014
Figure 9: Sub-Indicator Used to Inform Indicator 4 on School Management
2010 - 2014
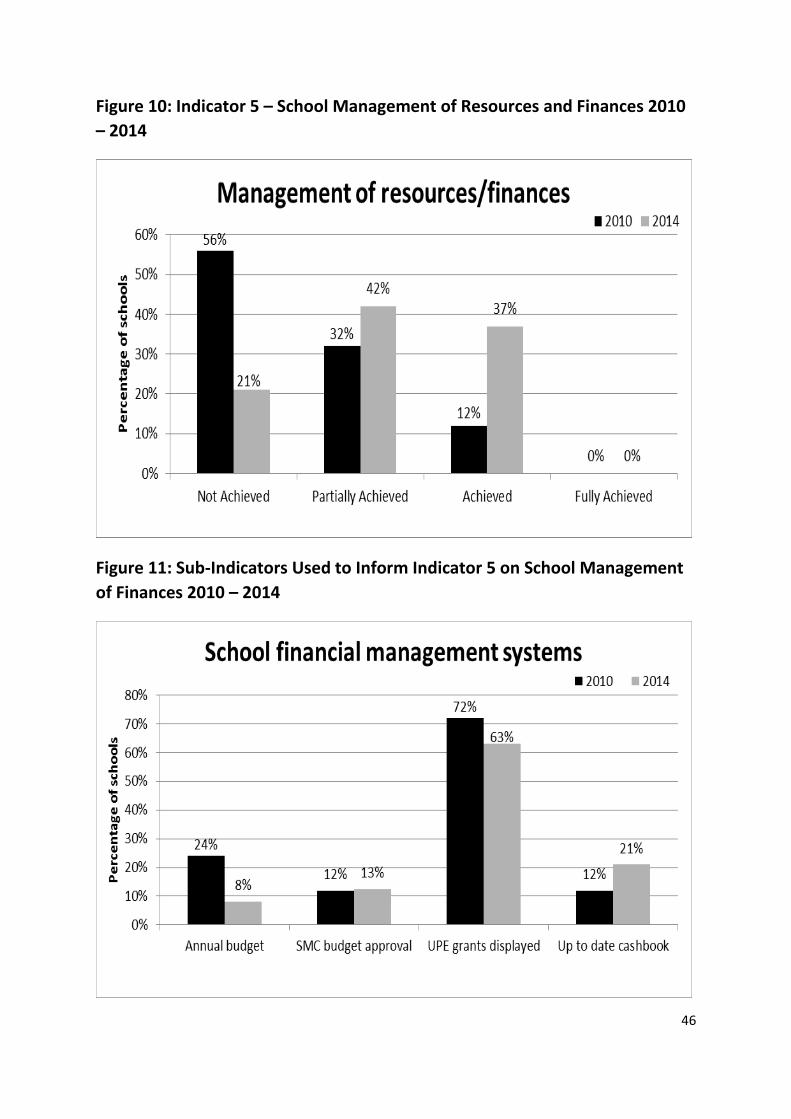
46
Figure 10: Indicator 5 – School Management of Resources and Finances 2010
– 2014
Figure 11: Sub-Indicators Used to Inform Indicator 5 on School Management
of Finances 2010 – 2014
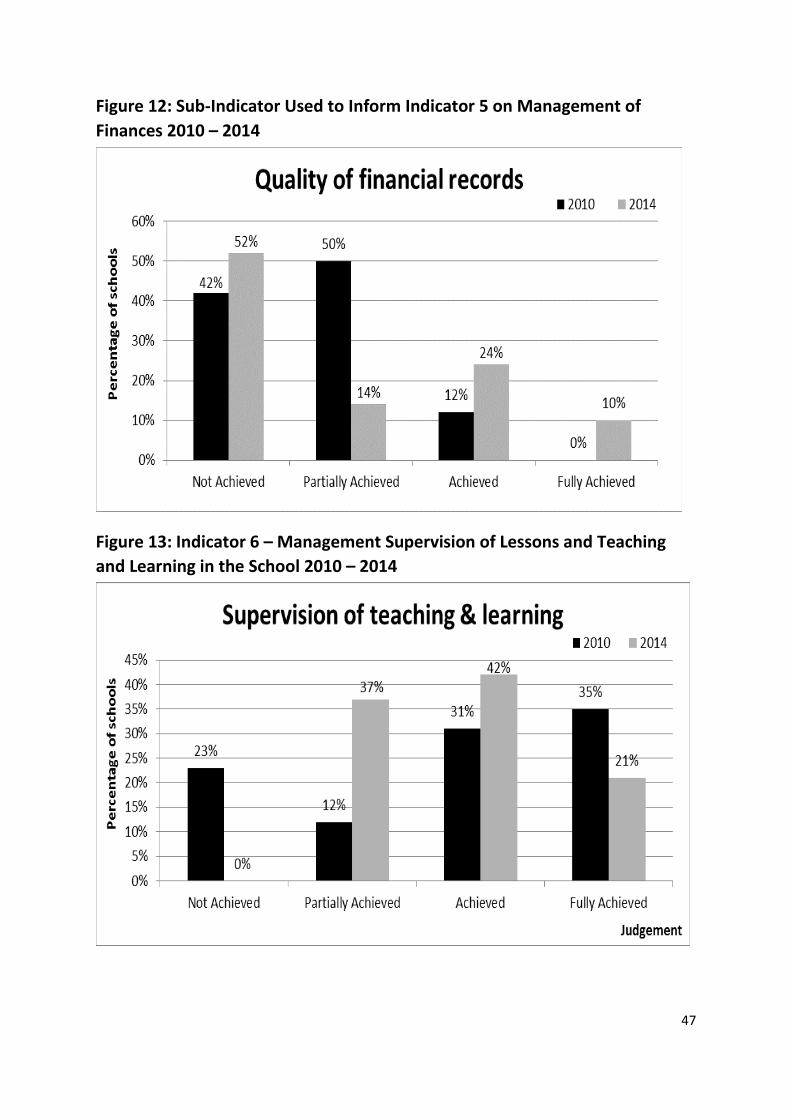
47
Figure 12: Sub-Indicator Used to Inform Indicator 5 on Management of
Finances 2010 – 2014
Figure 13: Indicator 6 – Management Supervision of Lessons and Teaching
and Learning in the School 2010 – 2014
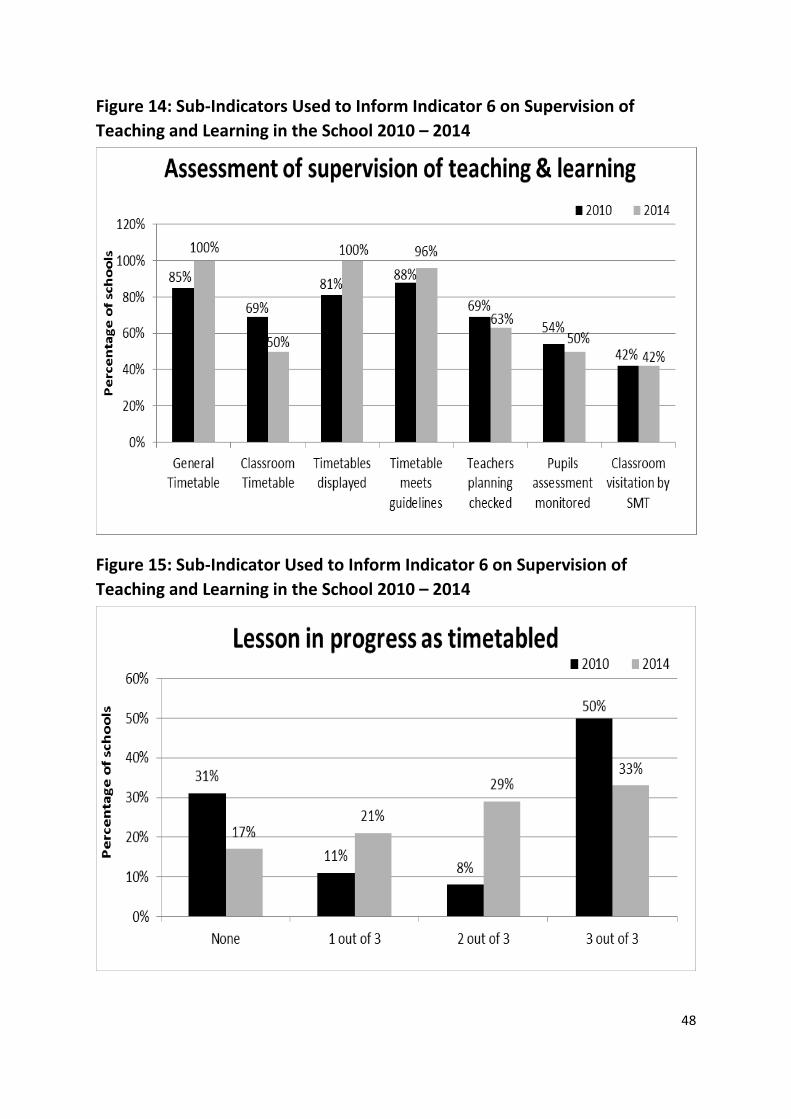
48
Figure 14: Sub-Indicators Used to Inform Indicator 6 on Supervision of
Teaching and Learning in the School 2010 – 2014
Figure 15: Sub-Indicator Used to Inform Indicator 6 on Supervision of
Teaching and Learning in the School 2010 – 2014
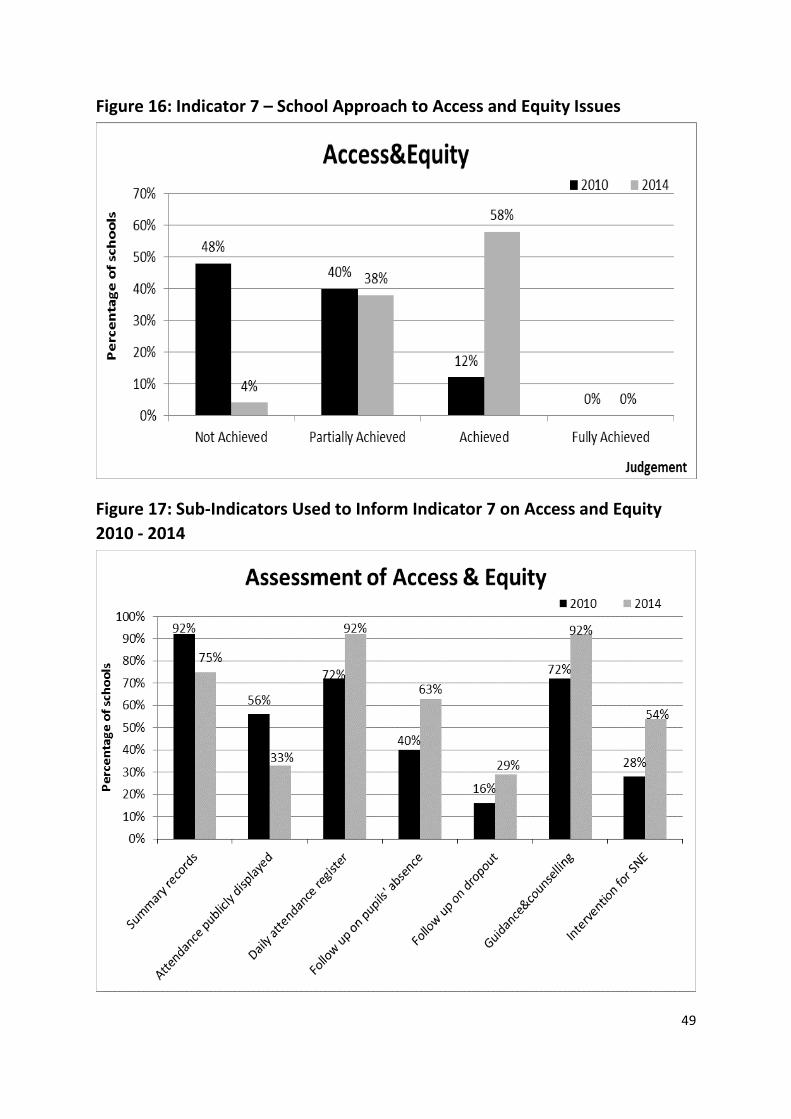
49
Figure 16: Indicator 7 – School Approach to Access and Equity Issues
Figure 17: Sub-Indicators Used to Inform Indicator 7 on Access and Equity
2010 - 2014
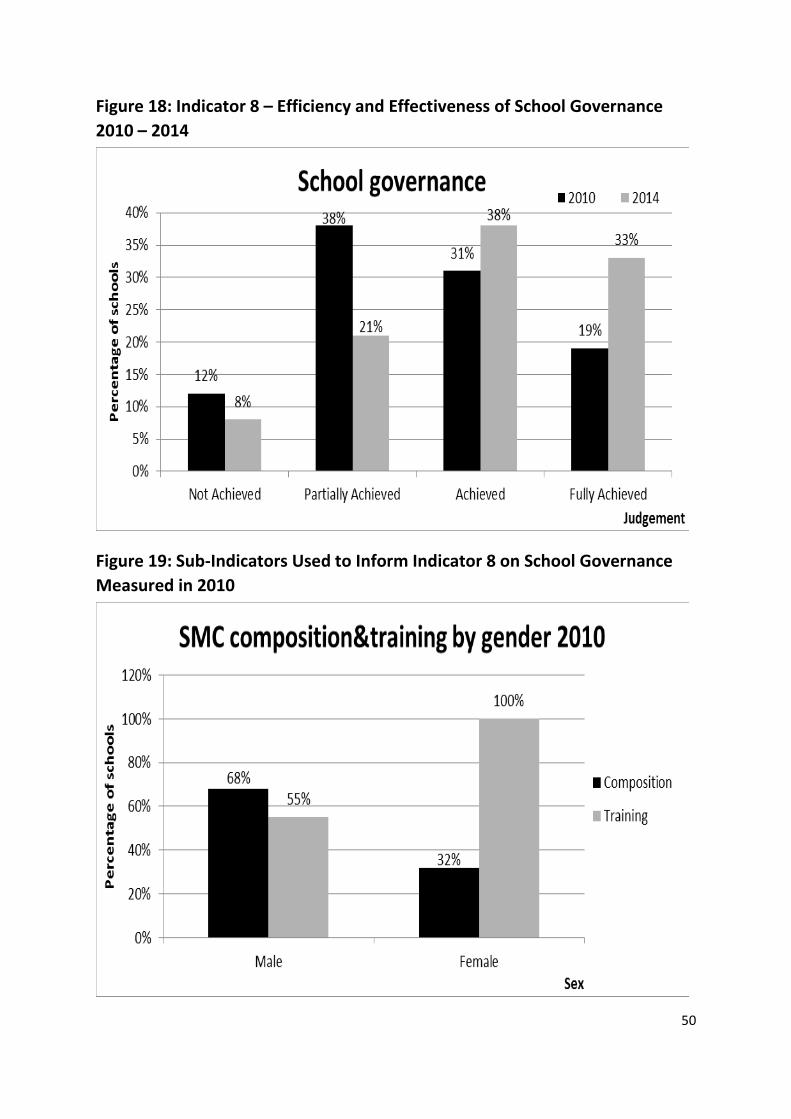
50
Figure 18: Indicator 8 – Efficiency and Effectiveness of School Governance
2010 – 2014
Figure 19: Sub-Indicators Used to Inform Indicator 8 on School Governance
Measured in 2010
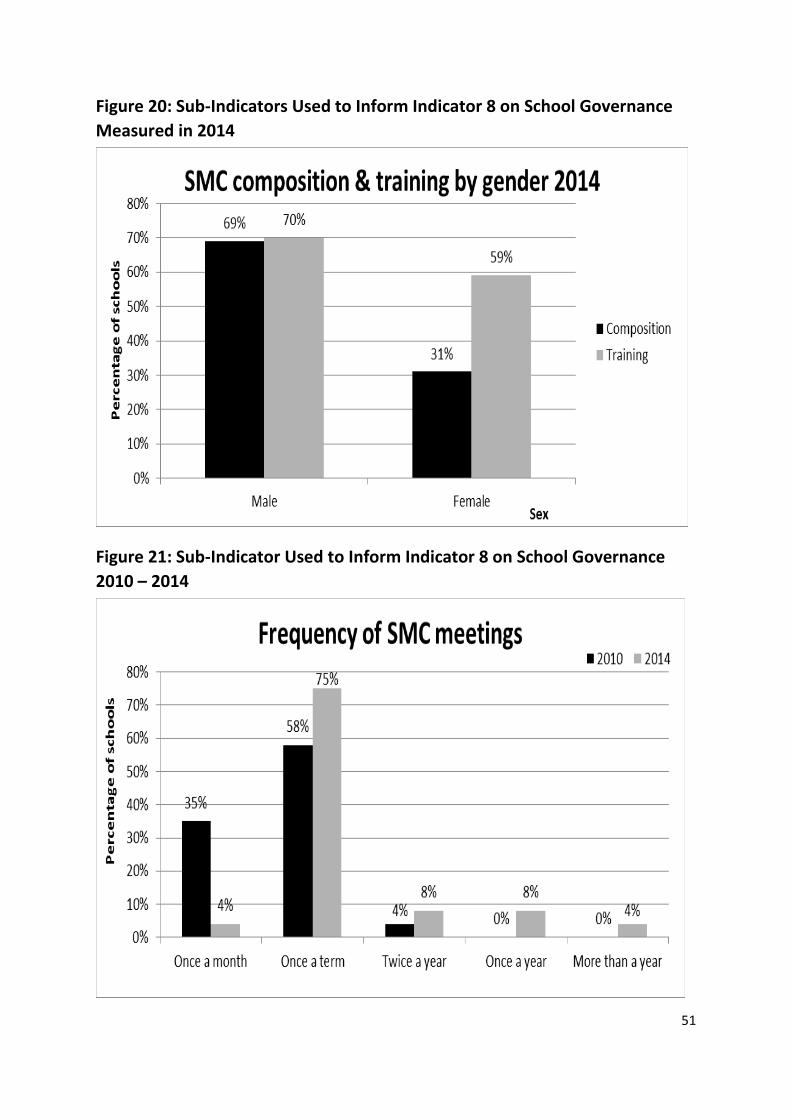
51
Figure 20: Sub-Indicators Used to Inform Indicator 8 on School Governance
Measured in 2014
Figure 21: Sub-Indicator Used to Inform Indicator 8 on School Governance
2010 – 2014
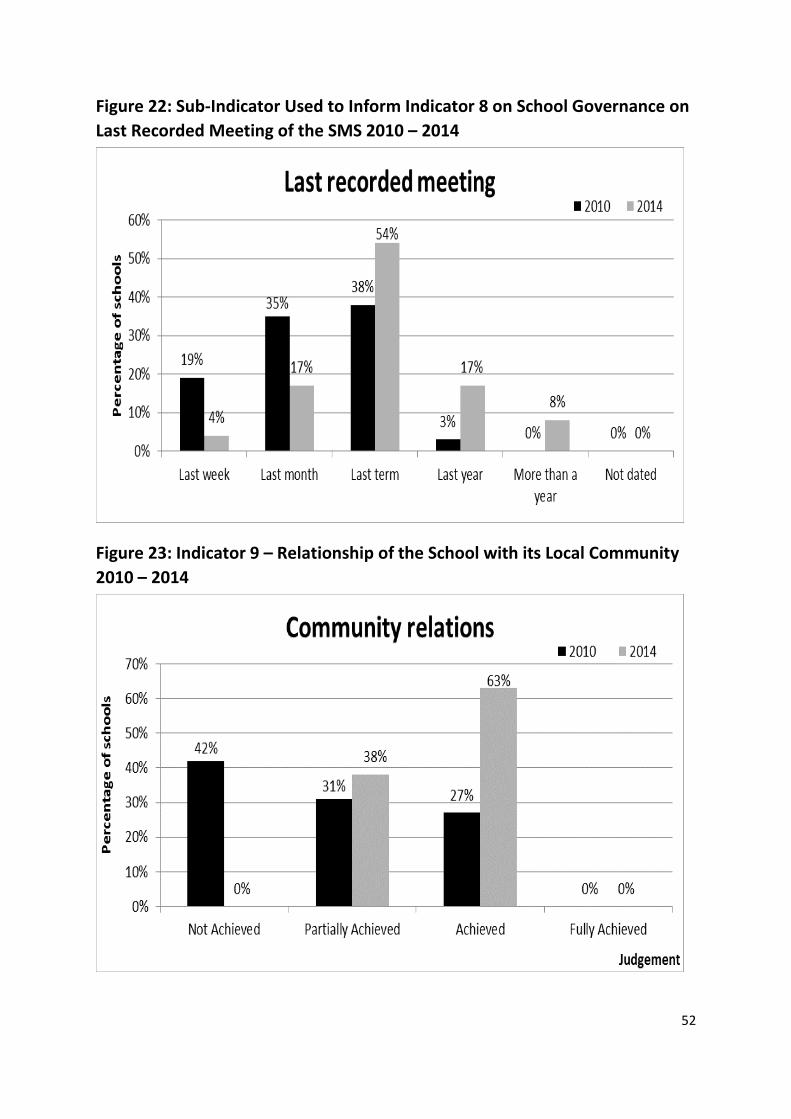
52
Figure 22: Sub-Indicator Used to Inform Indicator 8 on School Governance on
Last Recorded Meeting of the SMS 2010 – 2014
Figure 23: Indicator 9 – Relationship of the School with its Local Community
2010 – 2014
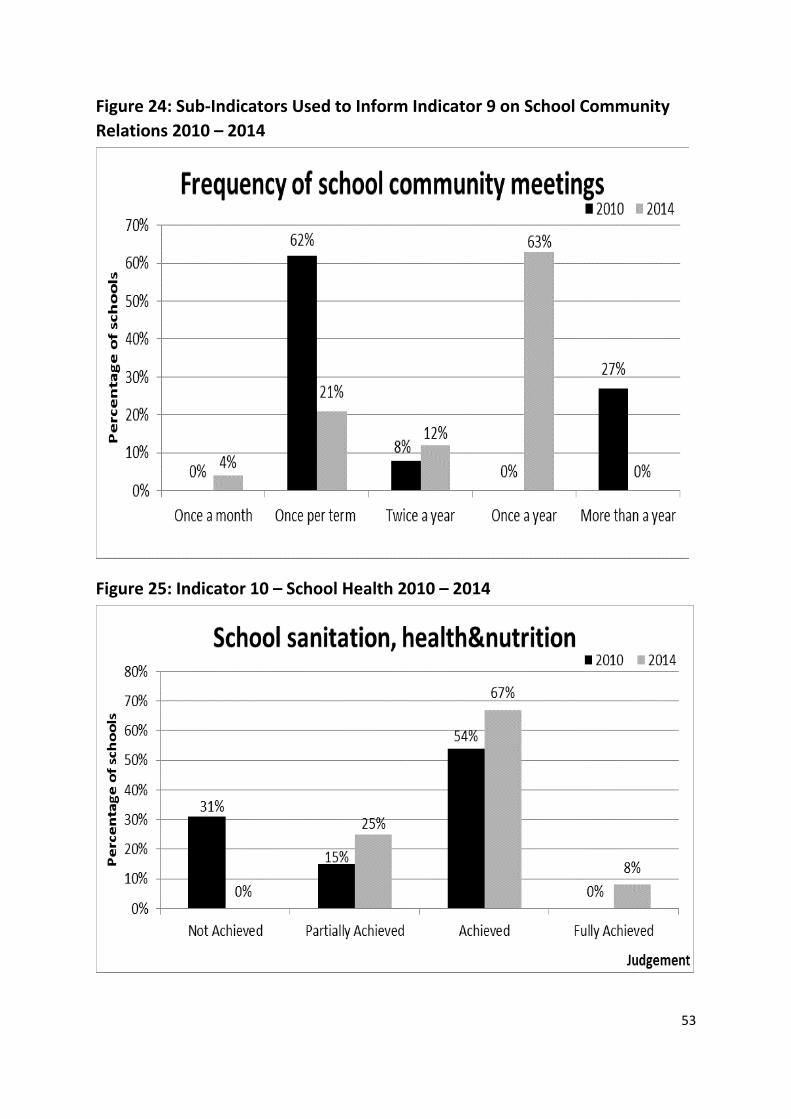
53
Figure 24: Sub-Indicators Used to Inform Indicator 9 on School Community
Relations 2010 – 2014
Figure 25: Indicator 10 – School Health 2010 – 2014
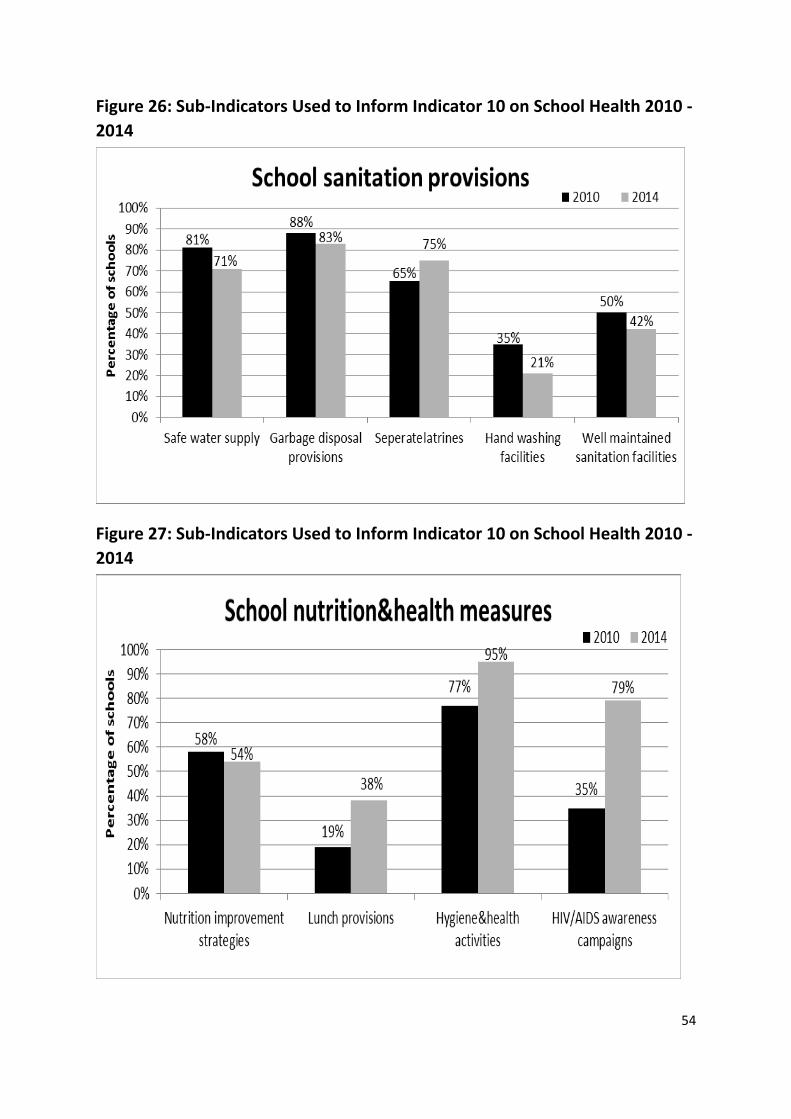
54
Figure 26: Sub-Indicators Used to Inform Indicator 10 on School Health 2010 -
2014
Figure 27: Sub-Indicators Used to Inform Indicator 10 on School Health 2010 -
2014
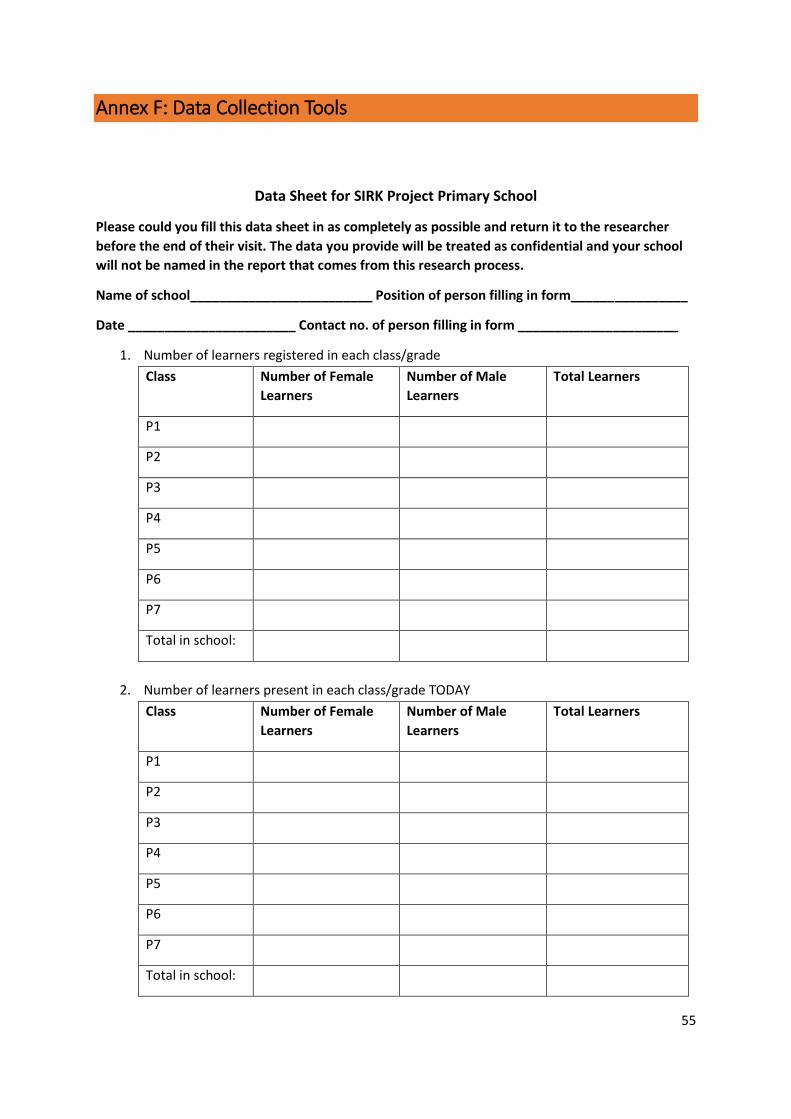
55
Annex F: Data Collection Tools
Data Sheet for SIRK Project Primary School
Please could you fill this data sheet in as completely as possible and return it to the researcher
before the end of their visit. The data you provide will be treated as confidential and your school
will not be named in the report that comes from this research process.
Name of school_________________________ Position of person filling in form________________
Date _______________________ Contact no. of person filling in form ______________________
1. Number of learners registered in each class/grade
Class Number of Female
Learners
Number of Male
Learners
Total Learners
P1
P2
P3
P4
P5
P6
P7
Total in school:
2. Number of learners present in each class/grade TODAY
Class Number of Female
Learners
Number of Male
Learners
Total Learners
P1
P2
P3
P4
P5
P6
P7
Total in school:
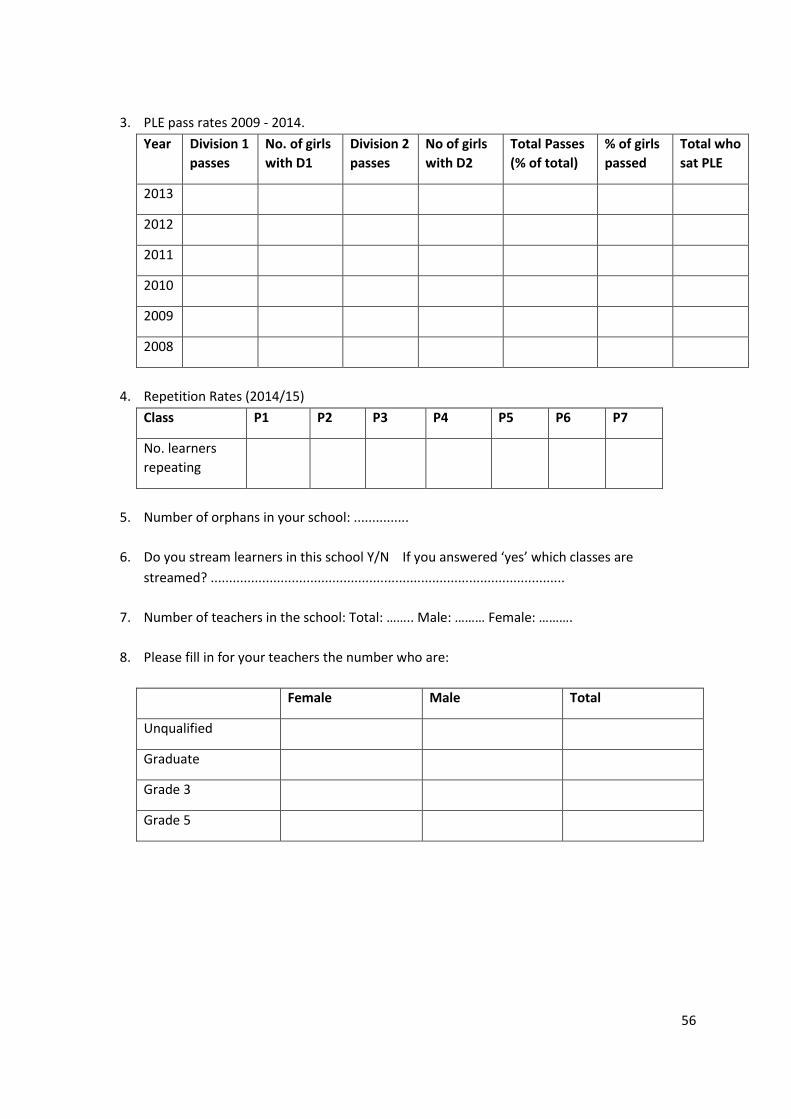
56
3. PLE pass rates 2009 - 2014.
Year Division 1
passes
No. of girls
with D1
Division 2
passes
No of girls
with D2
Total Passes
(% of total)
% of girls
passed
Total who
sat PLE
2013
2012
2011
2010
2009
2008
4. Repetition Rates (2014/15)
Class P1 P2 P3 P4 P5 P6 P7
No. learners
repeating
5. Number of orphans in your school: ...............
6. Do you stream learners in this school Y/N If you answered ‘yes’ which classes are
streamed? ................................................................................................
7. Number of teachers in the school: Total: …….. Male: ……… Female: ……….
8. Please fill in for your teachers the number who are:
Female Male Total
Unqualified
Graduate
Grade 3
Grade 5

57
Learning Walk Tool for Primary School: SIRK
Take 20 minutes during the day while lessons are in progress to walk around the school. Then fill in
the sheet below.
School ________________________________ Date ________________ Time ________________
1. Buildings – describe what classrooms and other buildings are made of:
2. Buildings – describe the state of the classroom windows, doors and floors
3. Buildings; Does the school have a (tick after all present)? Science lab ______ Library ______
Computer room ______ Kitchen _____ Head teacher office _____ Admin block _______
Staff room ______ List any other specialist rooms/buildings___________________________
4. Safety and security – describe the state of the school’s fence:
5. Safety and security – are the grounds and school buildings safe? Detail this:
6. Do the classroom doors lock? 7. Does the school have some secure rooms with bars on the windows? 8. Classes/teaching: are:
Item All time Most time Sometimes Never
Teachers in class
Teacher teaching
More than 1 teacher in a class
Learners active
Teaching aids on wall
Nice classroom environment
Enough desks
Enough chairs
Correct chairs/tables for age level
Visible chalkboard
Windows in place
Overcrowded lower school
Overcrowded upper school

58
9. School Environment: Is it attractive with flowers and trees and talking environment? (describe)
10. School Environment: Does the school have playing fields and play ground? (describe)
11. Toilets: how many toilets are there: Girls _______ Boys _______ Teachers __________
a. Are there changing rooms for girls and other provisions for menstruating girls?
b. Are there toilet facilities for disabled learners which are open/accessible?
c. Are the latrines kept clean?
12. Water: Do the students have access to clean water?
a. What is the source of the water?
13. Power: Does the school have electricity?
a. Is the electricity functioning?
b. What is the sources of the electricity? (solar/grid/generator)
c. Do all/some/none of the classrooms have access to electricity?
d. Does the staffroom/admin office/head teacher office have access to electricity?
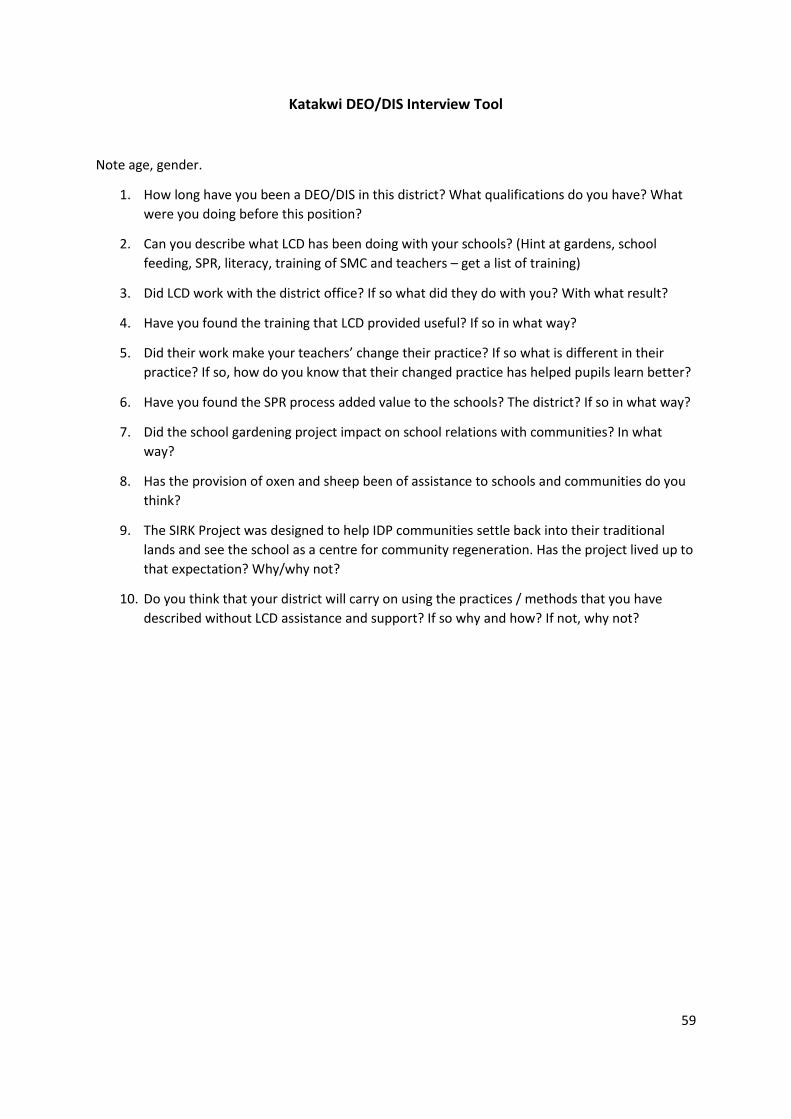
59
Katakwi DEO/DIS Interview Tool
Note age, gender.
1. How long have you been a DEO/DIS in this district? What qualifications do you have? What
were you doing before this position?
2. Can you describe what LCD has been doing with your schools? (Hint at gardens, school
feeding, SPR, literacy, training of SMC and teachers – get a list of training)
3. Did LCD work with the district office? If so what did they do with you? With what result?
4. Have you found the training that LCD provided useful? If so in what way?
5. Did their work make your teachers’ change their practice? If so what is different in their
practice? If so, how do you know that their changed practice has helped pupils learn better?
6. Have you found the SPR process added value to the schools? The district? If so in what way?
7. Did the school gardening project impact on school relations with communities? In what
way?
8. Has the provision of oxen and sheep been of assistance to schools and communities do you
think?
9. The SIRK Project was designed to help IDP communities settle back into their traditional
lands and see the school as a centre for community regeneration. Has the project lived up to
that expectation? Why/why not?
10. Do you think that your district will carry on using the practices / methods that you have
described without LCD assistance and support? If so why and how? If not, why not?
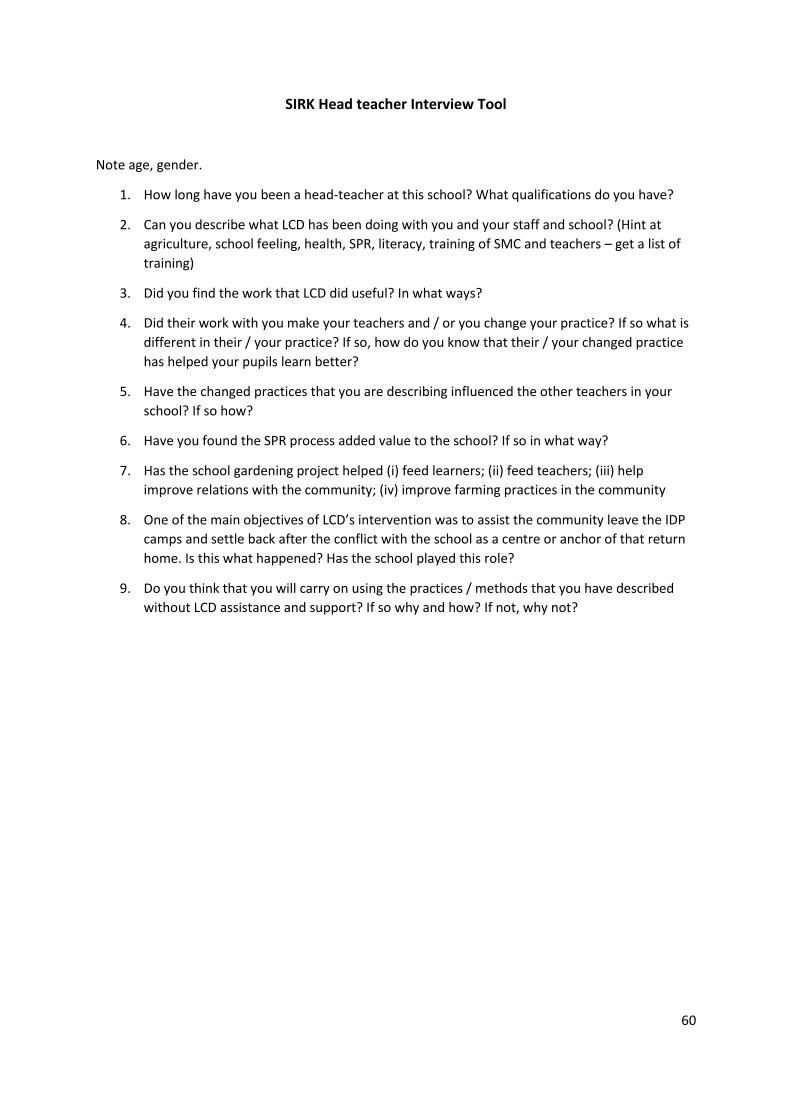
60
SIRK Head teacher Interview Tool
Note age, gender.
1. How long have you been a head-teacher at this school? What qualifications do you have?
2. Can you describe what LCD has been doing with you and your staff and school? (Hint at
agriculture, school feeling, health, SPR, literacy, training of SMC and teachers – get a list of
training)
3. Did you find the work that LCD did useful? In what ways?
4. Did their work with you make your teachers and / or you change your practice? If so what is
different in their / your practice? If so, how do you know that their / your changed practice
has helped your pupils learn better?
5. Have the changed practices that you are describing influenced the other teachers in your
school? If so how?
6. Have you found the SPR process added value to the school? If so in what way?
7. Has the school gardening project helped (i) feed learners; (ii) feed teachers; (iii) help
improve relations with the community; (iv) improve farming practices in the community
8. One of the main objectives of LCD’s intervention was to assist the community leave the IDP
camps and settle back after the conflict with the school as a centre or anchor of that return
home. Is this what happened? Has the school played this role?
9. Do you think that you will carry on using the practices / methods that you have described
without LCD assistance and support? If so why and how? If not, why not?
61
SIRK Teacher Interview Tool
Select three teachers including one from P1 – 3 and one from P6/P7. Interview them together.
Note age, gender.
1. What grade do you teach and how long have you been teaching? What qualifications do you
have?
2. Can you describe what LCD has been doing with you? (Hint at gardening, school feeding,
SPR, literacy, training of SMC and teachers – get a list of training)
3. Have you found the SPR process added value to the school? If so in what way?
4. Have you found the training that LCD provided useful? If so in what way?
5. Did their work with you make you change your practice? If so what is different in your
practice? What would I see in your classrooms which show this change in practice? If there
have been changes in practice how do you know that your changed practice has helped your
pupils learn better?
6. Have the changed practices that you are describing influenced the other teachers in your
school? If so how?
7. Has the school gardening project helped (i) feed learners; (ii) feed teachers; (iii) improve
relations with the community; (iv) improve farming practices in the community;
8. One of the main objectives of LCD’s intervention was to assist the community leave the IDP
camps and settle back after the conflict with the school as a centre or anchor of that return
home. Is this what happened? Has the school played this role?
9. Do you think that you will carry on using the methods that you have described without LCD
assistance and support? If so why and how? If not, why not?
62
SIRK Community Member/SMC Member Interview Tool
This can be either a one-on-one or focus group interview. It depends on availability of community
members.
Note age, gender.
1. Can you describe your role in the school? What job do you have?
2. Can you describe what LCD has been doing with your school? (Hint at gardening, school
feeding, SPR, literacy, training of SMC and teachers – get a list of training)
3. Have you found the School Performance Review process added value to the school? If so in
what way?
4. Did you attend any LCD training for SMC members? Have you found the training that LCD
provided for SMC members useful? If so in what way?
5. Have you seen any changes in the way that the teachers and head teacher work as a result
of the work that LCD has been doing with the school? If so what differences have you
observed? Has this helped pupils learn better?
6. Has the school gardening project helped you relate with the school? Is this general to other
community members? If so why/why not?
7. Part of the objectives of the project were to assist IDP communities settle back in their
homes after the conflicts. Has the SIRK done this for your community? Has it helped improve
farming practices in your community? To community members look to this school in any way
for leadership?
8. Do you think that the school and community will carry on using the methods that you have
described without LCD assistance and support? If so why and how? If not, why not?
63
LCD Facilitator Interview Tool
Note age, gender.
1. How long have you been a facilitator with LCD? How long on this project? What
qualifications do you have?
2. How many schools have you been working with in each district?
3. Can you describe what LCD has been doing with these staff and schools? (List all training and
support - Hint at SPR, literacy, training of SMC and teachers – get a list of training)
4. Do you think the schools found your intervention useful? If so why and in what ways? Why
not?
5. Did their work with you make the teachers and head-teachers change their practice? If so
what is different in their practice? If so, how do you know that their changed practice has
helped pupils learn better?
6. Have the changed practices that you described influenced the other teachers in the schools?
If so how?
7. Do you think that the SPR process added value to the schools? If so in what way?
8. What were your main challenges working in these schools?
9. What do you see as your main successes working with these schools?
10. Why do you think the SPR results for classroom teaching and learning and supervision of
teaching and learning have not been improving in the schools that LCD has been working in?
11. Do you think that they will carry on using the practices / methods that you have described
without LCD’s assistance and support? If so why and how? If not, why not?