summer climate of the upper columbia river valley …cfs.nrcan.gc.ca/bookstore_pdfs/23167.pdf ·...
TRANSCRIPT

SUMMER CLIMATE OF THE UPPER COLUMBIA RIVER VALLEY
NEAR INVERMERE, BRITISH COLUMBIA
by
John M. Powell
FOREST RESEARCH LABORATORY
CALGARY, ALBERTA
INFORMATION REPORT A-X-35
CANADIAN FORESTRY SERVICE
DEPARTMENT OF FISHERIES AND FORESTRY
JUNE, 1970

, TABLE OF CONTENTS
INTRODUCTION ........................................ AREA OF STUDY
Physiography •• Soils •••••.• Vegetation ••
. ............................... .
. ............................... . . .................................. .
Page
1
2 6 6
Macroclimate of the Upper Columbia River valley.... 9
LOCATION OF STATIONS
INSTRUMENTS AND METHODS Temperature and Humidity ••••• . . . . . . . . . . . . . . . . . . . . . . Precipitation •........•...•..•...... Evaporation •...••....•..•... Soil Temperature ••••••••• Soil Moisture •.•••••
. . . . . . . . . . . . . . . . . . . . . . .
. ..................... . Air masses ••• . . . . . . . . . . . . . . . . . . . . . . . . . . . . . . . . . . . . . .
RESULTS Comparison of 1961 Summer Climatic Conditions at
Invermere with the Average Conditions for the
12
18 19 19 20 20 21
Area. . . . . . . . . . . . . . . . . . . . . . . . . . . . . • . . . . . . . . . . . . . . . . 23
Frequency of the Various Air Mass Types During the Period May to October 1961................. 26
Mean Monthly Temperatures •••••••. Maximum Diurnal
and Minimum Temperatures. Temperature Range •••••••• ..................
Hourly Temperatures •••••••••••••• . . . . . . . . . . . . . . . . . . Nocturnal Inversions •••••••••••••••••••••• . . . . . . . . . Oc!currence of Frosts .....•......................•..
Degree Days and Degree Hours During the Growing Season ....••.....•.••.••••
Soil Temperatures •••• Soil Moisture •••••••• Precipitation •••••••••••• Relative Humidity •••••••• Evapora tion ••
..........................
DISCUSSION .............................................. ACKNOWLEDGMENTS ......................................... REFERENCES
APPENDIX I. CLIMATIC DATA FOR STATIONS 9 to 16 ••••••••••
26 28 31 33 36 42
45
45 48 48 51 54
55
59
60
65
APP3NDIX II. CLASS:;:FlCATION OF AIR MASSES.... • • • • • • • • • • • . 69

ABSTRACT
The summer climate of a portion of the Rocky Mountain Trench
north of Invermere, British Columbia, was studied in 1960 and 1961
through a network of 16 stations. Emphasis is given in this report to
a comparison of the climate of the Frances Creek valley with that of a
station in the main Columbia River valley at Invermere in 1961. Stations
in the north-south aligned Frances Creek valley included a transect of
five stations at elevations between 3,390 and 4,800 ft and two valley
bottom stations downstream from this transect. Air temperature, relative
humidity, soil temperature, soil moisture content, precipitation and eva
poration were observed from May to November. General sky conditions at
Invermere and the types of air masses over the area were also recorded.
The means of average monthly, maximum, minimum, diurnal range,
and hourly temperatures were calculated for each station for each month.
An analysis was made of the development and dissipation of nocturnal
inversions under different air masses, the occurrence of frosts, the
duration of the frost-free period, and the number of degree days and
hours during the growing season. The other climatic factors observed
were analysed and briefly discussed.
Frances Creek valley bottom stations were prone to have frosts
throughout the summer months, and inversions existed every night, there
being marked nocturnal thermal belts on the slopes. Maximum temperatures
were higher at west-facing stations than east-facing stations, maximum
and minimum daily temperatures occurring earlier at east-facing stations.
Nocturnal inversions were deeper and stronger under maritime Tropical

air than under maritime Polar air. The frost-free period lasted over
120 days at slope stations and stations in the main Trench but ranged
from 17 to 59 days at valley bottom stations in the Frances Creek valley
in 1961. From May to September the station at Invermere received about
15% more degree hours than any slope station in Frances Creek valley,
and 50% more than the transect valley bottom station, which received
fewer degree hours than the two other Frances Creek valley bottom sta
tions. Soil temperatures were highest at valley bottom stations and
coolest at the higher elevation stations. Soil moisture was highest at
the higher east-facing station, which also received the greatest amount
of precipitation. Valley bottom stations received least precipitation,
though deposition of dew occurred on many nights but was absent from
slope stations. High humidities occurred every night at valley bottom
stations, but diurnal humidity range at slope stations was small espe
cially on clear days. Evaporation at the Invermere station was high,
with Frances Creek valley transect stations only recording a third of
the amount.

SUMMER CLIMATE OF THE UPPER COLUMBIA RIVER VALLEY
NEAR INVERMERE, BRITISH COLUMBIA
by
1 John M. Powell
INTRODUCTION
In recent years, many climatic studies have been carried out
in North America, usually with the aim of elucidating some climatic
phenomenon of an area, or of helping explain certain biological features
of the environment. Studies involving climatic networks in the northern
Rocky Mountain area have been few (Hayes, 1941; McLeod, 1948; Parker,
1952; Lloyd, 1961; MacHattie, 1966, 1970), and none have been reported
for the mountain areas of the Rocky Mountain Trench of British Columbia2 •
Areas having similar topographic features in the region probably exper-
ience similar climatic regimes; thus, a small study in one area of a
region may be fairly representative of conditions over the whole region
with similar topographic features.
In 1960 and 1961, a climatic study was carried out in a portion
of the upper Columbia River valley, which it was hoped would help explain
the relation of climate to the distribution of tree species and of out-
breaks of the mountain pine beetle (Dendroctonus ponderosae Hopkins) in
1 Research Scientist, Canadian Forestry Service, Canada Department of Fisheries and Forestry, Calgary, Alberta.
2 A further study has been carried out in this general area by J. R. Marshall, British Columbia Department of Agriculture, since the study of the author.
- 2 -
~he area. Studies to investigate the habitat temperatures of the
mountain pine beetle (Powell, 1967) and the history of outbreaks and
their relation to seasonal weather (Powell, 1966, 1969) were run con
currently.
The main objective of the present study was that of examin-
ing the relation between the summer climate of a portion of the upper
Columbia River valley, and that which occurred in tributary valleys.
Climatic data were collected from 19 stations covering an area of over
250 sq miles, but only the 16 stations with the most complete data were
analysed. This paper compares the 1961 summer climate at Invermere, a
station representative of climate in this portion of the Columbia River
valley, with the climate of the Frances Creek tributary valley. Seven
stations were analysed in detail in the Frances Creek valley, five of
which formed a cross section and gave information of the effect of aspect
and elevation above valley floor on the summer climate. Comparative in
formation for the remaining eight network stations is given in the Appen
dix.
AREA OF STUDY
Physiography
The area of study and the physiographic features of the study
area are shown in Figs. 1 and 2. The area centers on a portion of the
Rocky Mountain Trench in the drainage of the Upper Columbia River, to
the north of Invermere (lat. 50° 30'N, long. 116° Ol'W). The Columbia
RiVEr meanders northward over a valley bottom 1 to 2 miles wide and

'" o o iii ::s o '<
-j-
'P \ \"-'
BRITISH
o \ .......... ''l ! \ ... \
COLUMBIA
Kimberley e
'.-.. -. '". '"
Cranbrooke
ALBERTA
\
Fig.l. Physiographic features of the Rocky Mountain Trench of southeastern British Columbia, and the position of the study area.

Scale: 1-:4miles 1:250,000
20' 15' OS' Contour interval 1000 ft.
Fig.2. Physiographic features of the study area, and the location of the 16 stations.
5'
- 5 -
characterized by large marshes and alluvial flats. The whole Trench
depression is flanked by a series of dissected glacio-lacustrine silt
terraces, occurring at elevations between 2,700 and 3,000 ft, which
were deposited at various times during the recession of ice when the
Trench was probably occupied by a lake (Walker,1926). The town of
Invermere is on a gravel-sand terrace at the northwest end of Windermere
Lake (2,625 ft a.s.l.) and some 120 ft above the lake. The Trench is
flanked on the east by the westernmost ranges of the Rocky Mountains,
the peaks of which rise to between 7,500 and 8,750 ft. On the west the
easternmost range of the Purcell Mountains rises to between 7,500 and
9,500 ft. The Purcell Range is dissected by large eastward flowing
streams - Toby Creek, Horsethief Creek, Forster Creek, and the SpiJJirrecheen
River - which are the main tributaries of the Columbia River in this part
of the Trench.
The Frances Creek valley is a main tributary of Forster Creek.
The confluence of Frances and Forster Creeks lies about 6 miles from
where Forster Creek joins the Columbia River opposite the town of Radium,
and 8 miles northwest of Invermere. Part of Frances Creek occupies a
major north-northwest to south-southeast valley on the west side of
Steamboat Mountain, a small mountain ridge some 15 miles long, 6,300 ft
high and situated within the main Trench area. The Frances Creek valley
bottom averages about 2 miles wide, is of undulating topography, and con
sists of a till plain with drumlinized and morainic areas. Several
shallow lakes are present in the valley bottom and these usually have
associated swamps or remain practically dry throughout the year. The
valley bottom meets the Purcell Range and Steamboat Mountain at an eleva
tiO!l of about 3,700 ft, from where steep slopes rise on the west to over

- 6 -
9,000 ft in the outer range of the Purcell Mountains, and on the east
from 4,800 to 6,300 ft on steamboat Mountain.
Soils
The soils of the area have been discussed by Kelley and Holland
(1961) and by McLean and Holland (1958). The soils of Frances Creek
valley are largely Gray Wooded soils with some areas of podzolization
in the north and on the east side of the valley. Various areas of gravel,
stony terraces, and loam have been deposited as Frances Creek has continued
to cut down its bed, or where streams, such as Hurst and Ogleston Creek,
entering the valley, have brought down material and developed fan aprons.
Along the valley bottom of Frances Creek and on much of the undulating
drumlinized areas south of Steamboat Mountain to Invermere and farther
south, Brown Wooded soils have developed. The town of Invermere lies on
an area with a mixture of Dark Brown and Brown Wooded soils.
Vegetation
The area lies within the Montane Forest Region, Ponderosa Pine
and Douglas Fir Section, with the higher slopes of the Trench falling
within the Subalpine Forest Region, Interior Subalpine Section (Rowe,
1959). The two corresponding bioclimatic zones of Krajina (1959) are
the Interior Douglas Fir Zone and the Subalpine Engelmann Spruce - Sub
alpine Fir Zone. Timberline in this part of the Trench and in the Purcell
Range generally, is at about 8,000 ft; thus, some of the summits of the
mountains of the Purcell Range facing the Frances Creek valley fall within

- 7 -
the higher zones of the Subalpine Forest, alpine vegetation areas
being found mainly on the summits of the inner parts of the Range.
The flora of the region was discussed by Ulke (1935) and Eastham
(1949), and the vegetation of this part of the Upper Columbia valley
by McLean and Holland (1958).
The distribution of the vegetation in the Frances Creek
valley is influenced by differences in elevation on the east and
west valley slopes, and with variations existing because of topo
graphy, soils, and climate. Two sub-zones of Douglas fir (Rreudotsuga
menziesii (Mirb.) Franco) are present in the Frances Creek and main
Trench area (McLean and Holland, 1958). The Douglas fir groveland
sub-zone, a zone of an open park-like appearance with areas of grass
land, is found on the east side of the main Trench just north of
Kindersley Creek to Windermere, and on the west side south of Forster
Creek to Invermere, and on an isolated area just south of Northcote
Lake in the Frances Creek valley. Rocky Mountain juniper (Juniperus
scopulorum Sarg.), lodgepole pine (Pinus contorta Dougl. var. latifolia
Engelm.), and aspen (Populus tremuloides Michx.) are the only other
trees that occur, the latter two usually only on the more mesic sites.
The Douglas fir forest sub-zone extends throughout the Frances Creek
valley bottom and up the slopes to various levels. It also occurs on
the east side of Steamboat Mountain and at higher levels on both sides
of the Trench. The main associated tree species are lodgepole pine,
aspen, and white spruce (Picea glauca (Moench) Voss). The lodgepole
pine appears dominant over large areas, but it is primarily a pioneer
species after fire. Aspen, present where grassland is found, is pre-
valent on south-facing slopes, and on the steeper west-facing slopes

- 8 -
of Steamboat Mountain. White spruce is an important member of this
zone, especially along the stream courses, on alluvial fans, or near
swamps, and again at the higher elevations on podzolized Gray Wooded
soils. White spruce is quite abundant on Steamboat Mountain and on
the west side of Frances Creek valley from about the 3,600 ft level.
This Douglas fir-pinegrass association occurs largely on Brown Wooded
soils. Black cottonwood (Populus trichocarpa Torr. & Gray), willows
(Salix spp.), and western white birch (Betula papyrifera Marsh.var.
commutata (Regel) Fern.) are often associated with white spruce along
the water courses, while white birch is also present at the higher
elevations of the zone.
On the west side of the Frances Creek valley, and at points
farther south, the Douglas fir forest sub-zone gives way to a seral
association at a number of pOints at varying levels between 4,000 and
5,000 ft. The two important tree species in this association which are
not found at the lower levels are western larch (Larix occidentalis Nutt.),
and western red cedar (Thuja plicata Donn).
The Subalpine zone is found on the west slopes of the Trench
and Frances Creek and commences at an elevation varying between 4,000 and
5,000 ft depending on whether the zone adjoins directly the Douglas fir
zone, or whether there is an intermediate cedar-larch zone. The Subalpine
zone is little represented on the central and southern summit areas of
Steamboat Mountain, the vegetation there being typical of a Douglas fir
white spruce association. On the east side of the Trench, the zone occurs
at a slightly higher elevation. The Subalpine zone on both sides of the
Trench extends to the timberline or summits of the mountains and is

- 9 -
characterized by the dominance of Engelmann spruce (Picea engelmannii
Parry), and alpine fir (Abies lasiocarpa (Hook.) Nutt.) though Douglas
fir and lodgepole pine are still present.
Macroclimate of the Upper Columbia River Valley
The Trench area falls within the Dfb zone of Koppen's classi
fication (Chapman, 1952) which is characterized by cold, snowy climates
where the mean temperature of the coldest month is less than 26.6 Fv,
and of the warmest month more than 50 F. The summers are cool with the
mean temperature of the warmest month less than 71.6 F, and there are
no distinct dry seasons, the driest month of the summer having more than
1.2 inches of precipitation. The upper levels of the area would fall
within the Dfc zone which has cool short summers, where there are less
than 4 months with mean temperatures more than 50 F.
In the area of the Trench around Invermere, there have been
several climatological stations, but only the station at Windermere
(1913 to 1948) covered 30 years, the length of record recommended by
the World Meteorological Organization for establishing "normals". The
stations in the British Columbia portion of the Trench with the longest
records of temperature and precipitation are Cranbrook and Golden, both
over 60 miles from the area of study. Long records of precipitation are
also available from Brisco, Canal Flats, and Wasa. The annual and monthly
long-term means for temperature and precipitation for these stations are
shown in Table 1. The mean monthly hours of sunshine at Windermere
(Table 1) are slightly less than those at Kamloops (2046) and slightly

TABLE 1. Mean Annual and Monthly Temperature (OF), Precipitation (Inches) and Hours of Sunshine for' a Number of Long Recording Stations in the Rocky Mountain Trench.
Station Jan Feb Mar Apr May Jun Jul Aug Sep Oct Nov Dec Yr No. of Elevation years (ft)
TEMPERATURE
Golden 13 19 31 42 52 58 64 61 52 41 28 17 40 67 2,583
Windermere 13 19 31 42 51 58 63 60 51 41 27 16 40 35 2,840
Cranbrook 16 22 32 42 51 58 64 62 53 42 29 20 41 63 3,013
Kimberley 17 24 30 42 51 58 64 62 54 42 28 20 41 25 3,016
PRE C I PIT A T ION I-' 0
Golden 2.34 l.38 0.92 0.80 l.12 l.61 l.36 l.42 l.40 l.54 l.84 2.39 18.12 62 2,583
Brisco l.62 l.02 0.67 0.86 l.43 2.06 l.17 l.44 l.20 l.29 l.25 l.90 15.91 45 2,750
Windermere 0.81 0.56 0.42 0.56 1.16 l.83 l.09 l.40 l.16 0.89 0.72 0.99 11.59 35 2,840
Canal Flats l.32 l.17 0.97 0.83 l.60 2.06 l.12 l.42 l.15 l.16 l.42 l.78 16.00 34 2,680
Wasa l.20 l.01 0.79 0.84 l.49 2.05 0.98 l.31 l.24 l.29 l.15 l.56 14.91 45 3,050
Cranbrook l.70 l.15 0.89 0.75 l.18 l.88 l.05 l.04 l.ll l.02 l.41 l.88 15.06 61 3, 013
Kimberley l.60 l.07 0.85 0.69 l.37 2.04 0.80 l.27 0.95 l.05 l.43 l.71 14.83 25 3,016
SUNSHINE
Windermere 64 102 158 208 240 230 300 262 182 138 63 48 1,993 27 2,840

- 11 -
more than those of Summerland (1972) and Oliver (1951) (British Columbia
Department of Agriculture, 1967), but summer temperatures are lower than
at Kamloops, Summerland, and Oliver, partly a reflection of the increased
elevation.
The area is dominated at all times by maritime air moving in an
easterly direction from the Pacific Ocean, but the air masses have been
greatly modified by the time they reach the Trench. The north-south align
ment of the mountain systems acts as a principal barrier to the penetra
tion of the air masses into the Trench. Moist air is able to enter and
spread into the Trench in the north near Boat Encampment, and in the south
below the 49th parallel. There is also some evidence that moist air is
able to penetrate into the Trench via the Spillimacheen valley and pos
sibly through other valleys that penetrate the Purcell and Selkirk ranges.
There is a marked rain-shadow effect within the East Kootenay part of the
Trench. This effect is most marked in the Invermere area, where more pre
cipitation is received in summer than in winter, while least occurs in
spring. The change of monthly precipitation patterns from Golden to
Invermere was shown by Kelley and Holland (1961). Amounts of summer pre
cipitation were similar throughout the area, but there was a noticeable
decrease in winter precipitation from Golden to Invermere. Kerr (1950)
applied Thornthwaite's moisture index to British Columbia and showed the
area around Invermere to be in the semi-arid region with an index of -20
to -40.
In summer, warm, dry continental air from the Great Basin area
of the United States sometimes penetrates into the southern portion of the
upp,:r Columbia River valley, bringing to the area its hottest weather.
Because the area is mountainous, summer daytime temperatures are warm or

- 12 -
moderate and nights are cool. The Trench area has the most continental
features of any of the southern interior valleys of the Province. This
fact is supported from a recent study by MacKay and Cook (1963), who
showed a continentality of between 40 and 50% for the area, the degree
of continentality being based on the mean annual temperature range.
The main wind directions in the Trench are very much governed
by the alignment of the Trench with winds mainly from the northwest, or
from the southeast (Table 2). In summer, there is also a strong component
from the northeast. Average wind speeds are higher in summer and there
are few periods of calm.
LOCATION OF STATIONS
The locations of the climatic stations are shown on the map of
the study area (Fig. 2). The latitude, longitude, and the elevation of
each station are given in Table 3. Stations 1 to 5 occur in a transect
about a mile wide, crossing the Frances Creek valley. The cross-section
profiles of the valley on either side of this mile-wide band are shown
in Fig. 3. The alignment of Frances Creek valley parallels that of the
main Trench and is from the north-northwest to the south-southeast. The
transect of stations is approximately perpendicular to this axis. Station
6 is situated about 4 miles south of the transect stations and about l~
miles to the north of the confluence of Frances and Forster Creeks,
while station 7 is situated about 2 miles to the south of the confluence.
Stations 3, 6, and 7 are all valley-bottom stations. Station 8 is some
8 miles to the southeast of station 7, on a terrace in the main Trench.

- 13 -
TABLE 2. Annual and MOnthly Percentage Frequency of Winds and Mean Wind Speed in Miles Per Hour, by Direction, for Windermere During the Period January 1930 to August 1940 (after Boughner and Thomas, 1948)
Jan Feb Mar Apr May Jun Jul Aug Sep Oct Nov Dec Yr.
Percentage Frequency (by directions)
North 6 5 5 3 3 3 3 5 5 3 3 3 4 Northeast 8 7 8 12 15 17 20 21 17 14 9 7 13 East 2 3 3 3 2 2 1 2 2 2 2 2 2 Southeast 22 27 42 32 28 31 23 19 22 27 30 32 28 South 1 3 3 2 3 1 1 2 3 2 2 2 2 Southwest 3 3 4 5 6 6 7 9 8 6 3 3 5 West 2 3 2 2 1 1 1 2 1 1 3 1 2 Northwest 34 30 26 36 39 36 40 35 36 35 33 31 34 Calm 22 19 7 5 3 3 4 5 6 10 15 19 10
Mean Wind Speed in Miles per Hour (by directions)
North 1.8 2.6 4.0 4.1 3.9 3.9 3.7 2.4 3.8 5.7 2.0 2.0 3.3 Northeast 2.7 2.1 3.7 3.9 3.8 3.8 3.0 3.2 3.1 3.5 2.0 2.9 3.1 East 2.3 3.1 5.0 5.3 3.7 5.3 6.9 3.0 4.9 6.0 3.1 2.0 4.2 Southeast 9.4 8.9 8.5 8.6 8.5 8.4 10.7 11.1 7.9 6.6 6.4 8.6 8.6 South 3.1 4.8 5.6 5.3 8.7 5.9 8.1 2.1 7.4 10.9 2.8 2.9 5.6 Southwest 2.4 2.4 3.4 4.6 5.1 4.5 3.5 4.1 3.7 4.2 2.1 2.1 3.5 West 1.3 2.0 3.0 3.7 3.8 5.2 2.8 3.0 2.8 2.3 1.9 1.7 2.8 Northwest 2.4 3.0 4.6 5.5 5.9 5.4 5.0 6.2 4.3 4.5 2.8 2.8 4.4
Average Wind Speed in Miles per Hour
3.3 3.8 5.8 5.9 6.1 5.8 5.6 5.6 4.7 4.6 4.0 4.0 4.9

TABLE 3. The Location and Description of the Climatic Stations of the study Area.
Stn. Lat. oN .Long. Ow Elev.ft Slope Elev.ft Soils Vegetation type No. ( a • s •. 1.) per cent direction above
valley bottom
MAIN S TAT ION S
1 50°38.9' 116°17.8' 4800 45-50 ENE 1400 Douglas fir/lodgepole pinel Engelmann spruce/w.red cedar/ w. larch
2 50°39.7' 116°17.7' 4000 20 ENE 600 Gray Wooded- Douglas fir/pinegrass/lodgepole Kinbasket Silt Ia9m pine
3 50°41.3' 116°16.0' 3390 flat Alluvium- White spruce/aspen/willow Wigwam Complex
4 50°41.9' 116°14.2' 4000 18 WSW 600 Gray Wooded Douglas fir/pinegrass/aspen/ lodgepole pine
5 50°41.7' 116°13.0' 4600 10 WSW 1200 Douglas fir/w.spruce/lodgepole pine
6 50°38.2' 116°12.0' 3240 5 WSw 30 Brown Wooded- Douglas fir/lodgepole pine Misko Loam I-'
7 50°35.5' 116°09.2' 3030 flat 20 Brown Wooded- Douglas fir/grassland/ .f:=""
Elko Loam Rocky Mt. juniper 8 50°30.5' 116001.6 ' 2740 3 WNW 120 Brown Wooded- Grassland/Douglas fir
Dark Brown-Elko-Saha
o THE R STATIONS
9 50°30.7' 115°59.2' 2960 8 WSW 340 Brown Wooded- Douglas fir/grassland Wycliffe Stl t Loam
10 50°30.2' 115°57.2' 5000 20 sw 2380 Douglas fir/pinegrass/lodge-pole pine
11 50°31.7' 116°04.2' 3180 15 ESE 550 Brown Wooded- Douglas fir/grassland Wycliffe Silt Loam
12 50°31.1 ' 116°06.0' 3240 5 SE 610 Brown Wooded- Douglas fir/grassland Wycliffe Silt Loam
13 50°29.3' 116°08.5' 3500 10 NE 230 Lodgepole pine/aspen/w.spruce
14 50°46.2' 116°09.4' 2900 5 SW 310 Gray Wooded- Douglas fir/pinegrass Kinbasket Silt Leam
15 50°46.5' 116°09.3' 4800 15 SW 2220 Douglas fir/pinegrass/lodge-pole pine
16 50°38.5' 116°01.0' 3612 10 SSE 40 Douglas fir/lodgepole pinel w.red cedar

.J UJ > UJ .J
« UJ (I)
z « UJ ~ UJ > o m « tlIJ UJ U.
8000 I Scale :Miles SW ~
7000
6000
6000
4000
c as
0::
" m I m
""" .x Q) Q) ~
0
1 3;" % ~ 0 1 I I I I I I
" 4( I
4( """ .x • • ~ 0
c: 'iii +' c ::J 0 ~ +' as 0
.Jl E ., Q) ..
U)
/'""-.i
3000~'------------------------------------------------------------------------------~ Fig.3. Valley profiles of Frances Creek valley, 114 miles apart, showing the five stations of the valley transect.
I t--' \,)1
I

- 16 -
Also summarized in Table 3 are the descriptive features
of each station. In addition to these tabulated data, all stations
except stations 1 and 3 were essentially dry sites. station 1 was
a mesic site and station 3 was a wet site, the latter being subject
to spring flooding by Frances Creek. Stations 7 and 8 were in exposed
grassland areas. At station 6, there was considerable regeneration after
fire and logging. Station 3 was in a clearing close to the creek on the
site of some old farm buildings. Each of the slope stations (nos. 1, 2,
4, and 5) had been the site of some selective logging operations in the
past, but none of very recent origin, and a considerable canopy from
mature trees existed at each station. At station 4, the distribution of
the trees was typical of open-grown parkland. A small gully, which lay
just to the north of station 5, may have acted as a passage for cold air
drainage, causing the station to be more favorably situated in this
respect. The station was near the saddle summit of steamboat Mountain.
The profiles of the valley bottom at stations 3, 6, 7, and 8 are shown
in Fig. 4. Station 8 was some 25 yards southeast of the British Columbia
Forest Service, Ranger Station building at Invermere.
The other eight stations (nos. 9 to 16) of the network for which
data were analysed are also indicated on Fig. 2. Stations 9, 11, 12, and
14 were all situated on various terraces of the main Trench. Stations 10
and 15 were on the upper slopes of mountains forming the range on the east
side of the Trench. Station 13 is situated near the exit of Toby Creek
into the main Trench, and the climatological station, Radium Hot Springs
(no. 16), is near the exit of Sinclair Creek into the main Trench. Addi
tional descriptive information for these stations is containeci in Table 3,

-17-
4000 SW NE
~
3800 (I) (I) ~
U=
3600
3400
STATION III
3800 ..J UJ > 3600 UJ ..J
« 3400 UJ C/)
Z « 3200 UJ ~
STATION VI UJ > 0 NE m > « .~ c t- -;; (1).2 UJ ~(I)" o ~ as UJ u.UU; lL.
3000
STATION VII
- (I)
> ~
(I) c E 0 - ~ (I) .. (I)~
2800 ~ "0 as (I) .: oJ
~
2600 STATION VIII
0 ~ % % 1 I I
Miles
Fig.4. Profiles of the valley bottom near stations 3,6,7, and 8.

- 18 -
but all tabulated climatic data are contained in Appendix I., Tables
A-G.
INSTRUMENTS AND METHODS
Temperature and Humidity
Each network station was equipped with a Fuess or Short and
Mason hygrothermograph with a weekly chart. Hygrothermographs were
maintained at stations 3, 7, and 8 from April 27 to November 3; at
station 5 from May 1 to November 3; at stations 1, 2, and 4 from May 18
to November 3; and at station 6 from June 1 to November 3, 1961. At
the beginning and end of the field season, all the hygrothermographs
were test-run under the same conditions to ensure that they were read
ing correctly and that each instrument was in agreement with the others.
Throughout the period of observation, spot checks of a sling psychrometer
against the hygrothermographs were made at least every other week to show
up any gross errors in the humidity recordings. Maximum and minimum
thermometers were maintained at all stations as a check against the
maximum and minimum temperatures recorded by the hygrothermographs during
each week. The hygrothermographs and the thermometers were exposed in
Stevenson or similar type screens, with the floor of the screen approxi
mately 4 ft above the ground surface at each of the sites. An attempt
was made to place screens in the open where this was possible.
Hourly values of temperature and relative humidity were ex
tracted and tabulat,=d from the hygrothermograph charts for the entire
period of record at each station. Hourly, daily, monthly, and means for
the whole period were calculated for all temperature data. Monthly and

- 19 -
hourly means of humidity were calculated for some stations. The number
of degree days above 42 F were calculated for all stations and the number
of degree hours above 32 F were calculated for stations l, 3, ~and 8.
Precipitation
Stations l to 8 were each supplied with a rain gauge for their
period of operation. Rainfall at station 3 was measured with a standard
Canadian 3.57-inch-diameter gauge having a receiving area of lO sq inches,
at station 8 with a U.S. Weather Bureau 8-inch stick gauge as employed by
the British Columbia Forest Service for their forest fire reporting sta
tions; and the gauges at the other stations were of the plastic wedge
type with an approximate 2t sq inch opening. Huff (l955) compared this
wedge gauge with standard gauges and found them to compare most favorably
with the standard gauges. Precipitation was measured once a week, ex
cept at station 8 where it was measured daily. It was noticed during
the present study that in one week, the plastic wedge gauge was prone
to lose a certain amount of water by evaporation. All gauges were placed
vertically; thus, those on the slopes probably recorded less than what
actually fell, as a truer catch had been shown to be recorded when gauges
were perpendicular to the slope (Hamilton, 1954). Snow that collected in
the gauges was melted to obtain a water equivalent.
Evaporation
Three copper evaporation pans, each with a diameter of l2 inches
and a depth of 6 inches with a center pin, were used to estimate the amount
of '~vaporation from a water surface. The pans were shielded from direct
insolation and from rain by a thin sheet of plywood placed over the

- 20 -
supporting stand, and were covered with l-inch diameter wire mesh to
prevent objects such as leaves from entering the pan and to prevent
animals and birds from drinking the water. The pans were about 4 ft
above the ground. Evaporation was recorded at stations 3 and 5 from
June 2l to September 27; at station 8 from June 28 to August 9; and
at station l from August 9 to September 27, 1961. Evaporation from
a water surface was calculated as the amount of water lost (cc) from
the pan. At each weekly visit, the pan was refilled so that the center
pin just broke the meniscus of the water level. The amount of water
necessary to refill the pan, therefore, equalled the amount of water
evaporated during the previous week.
Soil Temperature
Soil temperatures were recorded at the 4 inch level by means
of Weston dial thermometers or bent-stem thermometers (station 8).
Soil temperatures were recorded at weekly intervals at stations l to 5,
and 7 from June l4 to September 27; and at station 8 on July 26 and from
August l6 to September 27.
Soil Moisture
Soil moisture was determined by the gravimetric method as follows:
every 2 weeks, two soil samples, each about 500 g, were collected from the
top 6 inches of soil from each site. Two samples were taken at each sta
tion to reduce individual sample variations. The samples were sealed in
cans, weighed to g:ive fresh weight, oven-dried to constant weight at l05 C,

- 21 -
and re-weighed for dry weight. All pebbles over 2.5 rom were screened
from the dried samples and their weight was subtracted from the fresh
and ovendry weights of the sample. The gravimetric water content is
calculated as loss of weight on drying divided by dry weight and is
expressed as a percentage. Samples were taken at stations 1 to 5, and
7, on May 25 and June 8, and at stations 1 to 7 on June 21, July 5, 19,
August 2, 16, 30, September 13, 27, and November 3. No measurements
were taken by this method at station 8.
Air masses
The types of air masses present were classified according to
the OOOOZ and 1200Z h upper air charts for the 500 and 700 mb levels
for western North America, for the period of study. The temperatures
at these levels were extracted for the following radiosonde stations:
Prince Rupert, Port Hardy, Tatoosh Island, Seattle, Spokane, Prince
George, Edmonton, Calgary, and Great Falls. Data for the 700 mb level
were only complete from May 1 to August ll, 1961. Data for Calgary were
only available for the OOOOZ reading from July 7 to September 8, 1961.
From this temperature data and the maps indicating direction of movement
of the air masses, upper air temperatures were interpolated for the area
of study. These temperatures were then classified into air mass tempera
tures according to the values given by Godson (1950), Penner (1955),
Meteorological Branch (1956), and Walker (1961) for the latitudes 45°-
50 0 N for each air mass. These values are summarized in Table 4, and the
temperature limits used for each air mass are given in brackets. The

- 22 -
TABLE 4. Typical Air Mass Summer Temperatures for Middle Latitudes (45°- 50 0 N), with the Temperature Classes Used to Classify Air Masses in Brackets. (Data from Godson (1950), Penner (1955), Meteorological Branch (1956), and Walker (1961) ).
A I R MAS S Pressure Maritime Maritime Maritime Continental* level Tropical Polar Arctic Tropical ~mbl
700 8 to 12 C o to 1 C -10 to -14 C 10 C (4 & warmer) (3 to -6) (-7 and cooler)
500 -7 to -9 -17 to -19 -28 to -33 -11 (-13 & warmer) (-14 to -24) ( -25 & cooler)
*Only given by Godson (1950), and not used as a separate category in the present study.
TABLE 5. Monthly Maximum, Minimum and Mean Temperatures (OF) for May to October 1961, Compared with the Averages for the Period 1956 to 1962, at Station 8.
TEMPERATURE of
Period May June July August September October Mx Mn M Mx Mn M MxMnM Mx Mn M Mx Mn M Mx Mn M
1961 67 41 54 83 48 65 80 51 66 83 51 67 60 36 47 49 30 40
1956 -1962 67 40 53 73 ·47 60 81 50 65 77 48 63 66 39 53 52 32 42*
* Data for 1957 missing
TABLE 6. MOnthly Precipitation Totals for the MOnths May to October and the Six-MOnth Total for the Periods 1961, and 1956 to 1961, at Station 8.
PRE C I P I TAT ION (I N C H E S)
Period May June July August September October 6-mths
1961 2.28 1.67 1.90 0.97 2.68 0.60 10.10
1956 -1961 1.04 2.14 1.19 0.94 1.34 0.94* 7.59
* Data for 1957 missir~

- 23 -
months May Lo October were accepted as falling within the temperature
range of the typical summer air mass. Perhaps intermediate temperature
values would have been more suitable for the transition months May and
October. This was tried for Ma~ but the pattern was similar except that
there were three more days classified as having maritime Tropical (mT)
air, two less with maritime Polar (mF), and one less with maritime Arctic
(mA). In October, the use of an intermediate value would increase the
number of days with mT and mF air, and reduce those with mA air. The
temperature regime under the different air masses was analysed, and mean
values of maximum and minimum temperatures at each station under the
summer air masses were obtained.
The general daily condition of the sky was recorded at station
81 , and these were grouped into four categories: clear; sunny, few clouds;
cloudy with few sunny periods; overcast, or cloudy with rain; and correla-
ted with air mass type.
RESULTS
Comparison of 1961 Summer Climatic Conditions at Invermere with the Average Conditions for the Area
The monthly maximum and minimum, and mean temperatures at station
8 (Invermere) during the summer of 1961 were compared with average condi-
tions at that station for the period 1956-1962 (Table 5). Similarly, the
monthly precipitation totals were compared for the summer of 1961 and for
the period 1956-1961 (Table 6). Temperatures in June and August in 1961
1 Observations by Mr. A. Davidson, Dispatcher, Forest Ranger Station, Invermere, who was kind enough to maintain the hygrothermograph and rain gauge at station 8, and who made substantial notes on the daily weather conditions, far above and beyond those required for Forest Fire Danger Surveys.

- 24 -
were well above average, mainly owing to much higher mean maximum
temperatures, the minimum in each case being within 2 F of the average
for the 5-year period. Temperatures were considerably below average
in September and October 1961, especially those in September when the
mean maximum was 6 F below average. The monthly precipitation showed
considerable variation in the 6 years. Only the May and September
totals of 1961 were wetter than for the period 1956-1961, and no months
in 1961 were excessively dry.
Six or 7 years is not usually considered long enough to show
average trends because of the great variation from year to year. Data
are therefore summarized in Tables 7 and 8 for other stations with
records of varying length available in the Invermere area and for near
by stations in the Trench with longer records. Station 8, during the
period 1956-1962, had a higher monthly mean temperature from May to
August and higher precipitation in June and September than other earlier
Invermere-area stations, while August was considerably drier. However,
it is misleading to generalize when comparing different periods of record.
From the 1956-1961 average amounts, the summer precipitation regime for
station 8 was slightly lower than at nearby stations in the Trench, such
as Brisco, Spillimacheen and Canal Flats. Averages for the 6-month period,
May to October, for these latter three stations were all at least 1 inch
more than for the Invermere area stations (Table 8). Sinclair Pass and
Radium Hot Springs, a few miles into the Rocky Mountain Range east of
Steamboat Mountain, both recorded greater average summer precipitation
than the stations in the Trench. As will be shown later (Table 24), no

- 25 -
TABLE 7. Mean Monthly Temperature (OF) for May to October, 1961, and for the Period 1956-1962 for Station 8, Compared With Other Stations in the Area.
Station Period of Elev- TEMPERATURE of observation at ion
(ft) May Jun Jul Aug Sep Oct
8 1961 2740 54 65 66 66 47 38
8 1956-62 2740 53 60 65 63 53 42
Windermere 1913-49 2840 51 57 63 61 52 41
Wilmer 1909-25 3100 51 58 64 61 52 41
Spillimacheen 1958-68 2615 51 58 63 61 53 42
Radium. Hot 1955-68 3570 49 56 62 60 51 40 Springs
TABLE 8. Average Monthly Precipitation (Inches) for May to October at Station 8, Compared With Other Stations in the Area.
Station Period of Elev- PRE C I P I TAT ION (INCHES) observation ation
(ft) May Jun Jul Aug Sep Oct 6-mths
8 1956-61 2740 1.04 2.14 1.19 0.94 1.34 0.96 7.61
Windermere 1913-49 2840 1.16 1.83 1.09 1.40 1.16 0.89 7.53 Invermere Hts. 1913-25 1.21 1.53 1.19 1.50 1.14 0.68 7.25
Invermere Comfort Ranch 1915-30 1.15 1.,78 0.99 1.56 1.18 0.91 7.57
Wilmer 1909-25 3100 1.20 1.64 1.29 1.53 1.10 0.78 7.54
Spillimacheen 1958-68 2615 1.57 2.16 1.72 1.48 1.52 1.20 9.65
Brisco 1924-68 2750 1.43 2.06 1.17 1.44 1.20 1.29 8.59
Radium Hot 1955-68 2.88 2.40 1.83 Springs 3570 1.93 1.97 1.52 12.53
Sinclair Pass 1935-55 4410 2.36 3.01 1.91 2.03 1.59 1.68 12.58
Canal Flats (1924-50 2680 1.60 2.06 1.12 1.42 1.15 1.16 8.51 (1962-68

- 26 -
comparably large totals of summer precipitation occurred in the Frances
Creek valley, which is in the rain-shadow of the Purcell Range.
Frequency of the Various Air Mass Types During the Period May to October 1961
In Table 9 are summarized the number of days particular air
masses were present over the area from May to October 1961. During June,
July, and August, there were twice as many days with mT air as with mP
air, and mA air was absent. During the transitional months, May and
September, mP air predominated with both the Polar and Arctic Fronts
present over the area. In June, July, and August, the Polar Front domi-
nated the area, but frontal activity occurred only on about 50% of the
days, the percentage being much higher in winter (90%) (Walker, 1961).
In summer, cold air that enters the mountain valleys is rapidly modified
by insolational heating whereas in winter, the cold air remains. Kendrew
and Kerr (1955) commented that in summer, continental Tropical (cT) air
may invade southern British Columbia on the surface as well as aloft.
There was evidence that cT air was probably present twice (see Appendix
II), but cT was not set up separately because at the 500 and 700 mb levels
there was little temperature difference between the cT and roT air masses
(Table 4).
Mean MOnthly Temperatures
The mean monthly daily temperatures (mean of 24 hourly values
for each day) for the eight stations from May to October 1961, are shown
in Table 10. Of the valley transect stations (1 to 5), the valley bottom

- 27 -
TABLE 9. Number of Days Each Air Mass Type Was Present in the Invermere Area During May to October 1961.
Air mass No. of days air mass present
May Jun Jul Aug Sep
maritime Arctic 7 0 0 0 2 maritime Polar 23 11 11 3 23 maritime Tropical 1 19 20 23 5
Oct
11
13
7
TABLE 10. Mean Monthly Temperatures (OF) For All Stations, May to October 1961.
station Elev- TEMPERATURE (0 F ) No. ation
(ft) May Jun Jul Aug Sep Oct
1 4800 60.3 60.2 63.0 42.0 32.4 2 4000 62.3 61.5 63.0 46.2 37.6 3 3390 45.5 54.8 55.5 55.9 39.3 30.1 4 4000 61.1 60.7 63.5 44.0 33.6 5 4600 49.8 61.7 61.2 64.5 45.1 36.4 6 3280 59.0 60.0 59.3 41.9 32.1
7 3030 47.4 53.7 59.1 59.5 41.3 31.8 8 2740 53.7 65.4 65.8 66.8 47.1 33.4
TABLE 11. Mean Monthly Maximum and Minimum Temperatures (OF) From May to October 1961, For All Stations.
Stn. TEMPERATURE (OF) No. May June JUlY August SepteInber October
Mx Mn Mx Mn Mx Mn Mx Mn Mx Mn Mx Mn
1 71.0 51.1 69.6 :;e. 0 72.0 55.2 47.9 36.1 36.8 28.0 2 74.9 51.0 72.6 52.4 74.6 54.1 54.2 40.3 43.4 33.4 3 60.9 30.6 73.9 35.6 74.4 39.1 76.6 38.1 54.1 27.8 i t 3.5 21.3 4 76.0 49.3 75.7 50.4 79.1 52.7 55.5 36.0 43.5 29.3 5 62.3 42.0 77.2 51.6 76.0 52.6 78.7 55.1 54.8 38.5 43.0 31.3 6 80.4 38.0 80.8 40.5 84.3 41.2 59.4 27.4 46.5 21.8
7 63.5 31.8 80.0 37.8 77.8 40.2 81.7 40.9 56.9 28.3 45.5 21.8
8 66.5 40.9 82.5 48.4 79.8 51.3 83.1 50.6 59.6 36.3 49.4 30.4

- 28 -
station (3) consistently had lower mean monthly temperatures than the
other s • The dif'f'erence amount ed to more than 5 F in June, July, and
August. On the east-f'acing slope Qf' the valley, the lower station (2)
had higher mean temperatures than the higher station (1), but on the
west-f'acing slope the position was reversed, with station 5 having
higher means than station 4. The dif'f'erences between the pairs of' slope
stations became greater during September and October than during the 3
summer-months. The two valley-bottom stations (6 and 7) downstream f'rom
station 3 also had lower means than the slope stations, out they were
usually several degrees warmer than station 3. Station 8 had mean monthly
temperatures 2 or more degrees F warmer in the summer than any of' the
stations in the Frances Creek valley.
Maximum and Minimum Temperatures
Mean monthly daily maximum and minimum temperatures f'or the
eight stations are shown in Table 11. At the transect stations, higher
maximum temperatures were recorded on the west-f'acing slope than on the
east-f'acing slope, while maximum temperatures in the valley bottom were
intermediate. Maximum temperatures at station 1 were consistently lower
than at other stations by over 3F. This was expected, because the angle
of' insolation was more acute on the east-f'acing slope than on the west
f'acing slope during the af'ternoon when maximum temperatures were usually
achieved. By October, the range between the daily mean maximum at sta
tions 2 to 5 was small (0.5 F). The maximum temperatures at stations 6,
7, ruld 8 were higher than those of' the valley transect stations. The

- 29 -
mean monthly daily minimum temperatures were markedly lower at the
valley bottom stations (3, 6, and 7) than at stations on the slope
or in the main Trench. From June to August, they were often over 10F
cooler. The minimum temperatures on the slopes of Frances Creek were
usually slightly higher than those at station 8. From June to August,
the highest minimum in the Frances Creek valley were recorded at sta
tion 5, followed closely by stations 1 and 2. In September and October,
the highest minimum of the Frances Creek stations were recorded at sta
tion 2 with temperatures over 10 F warmer than those at station 3, just
600 ft lower. Generally, there was greater local variation in minimum
temperatures than in maximum temperatures, though under calm, clear con
ditions there may be considerable variation in the maximum at the various
stations. The seasonal trends of temperature from May to October 1961
are illustrated in Fig. 5. These show the 5-day running means of maxi
mum and minimum temperatures for stations 1, 3, and 5. The trends of
the maximum temperatures at the three stations were similar, with station
5 usually having the highest minimum and station 1 the lowest, while the
minimum was consistently cooler at station 3.
The maximum and minimum temperatures for the 3 summer-months
were sorted with regard to the type of air mass present on that day for
stations 1 to 5, and 8. The mean maximum and minimum temperatures for
the two prevailing summer air masses are shown in Table 12 for these sta
tions. There is a pronounced difference in the maximum temperatures
between the two air masses, and days with mT air were considerably higher
than days with mP air. There was less difference between the minimum
temperatures under the two air masses. The differences ranged from

90~1~----------~--------~--------~~---------r---------'-----------'
80
70
~ 60 w 0:: ::> t-« 50 0:: w Q.
~ UJ t- 40
30
20
'. .. "'.:
.. ~ :
... ~. : '.'
'.: .;~ " : .' i ... \. .'\ t I \ I:') t ,'. ;1 \
,~~, I'. .. I ~ '. I '., I· /. .\ I \.7,. t • t;t \ I \. I \ I\. ,. ., .. F , • ,.,' t' t ~ t" I .' '\' '. f! :. f, ", ,.." • r .• l ~. \ ' 1 ,.. ~,
.... '\ I' ~ f \ t ;,. ~,I ,~. \ , .. \ '\ ,.' .\,. \ ~ '. ..\,.' ...... , ,.-.. " . ,. ..-. . .. , ... , :. f .:
Stations
........... 1 __ III _____ V
Temperature (A) Maximum (8) Minimum
I .. , '.A i ., , , '. " ....... . , , . - ,v . "" ' I .. . . . ,. -' "... .\
,I·· '~" I" ... \ /' , .. . ' .. '
8
: ...• , ... , .. ,., ... . , ;' ,.' ... . r' 1\ ·V-, '\ ..... /~, . :' '. : . • \ .' '.' 1\ • . \ (\', '.
May June July August
DATE
": \ 1:"'\ /;"'\'" . , ,t:. \ ,..1 : '_'I ,; ':, I~' i\ ". ,-J: . "': .... :. .: .....: 1 ' ..... : \:' l 8
September
\ r' :\ I \ . \' , :. \! \
'. : .... ), . .
October
Fig.5. Five-day running means of maximum and minimum temperature (OF},May to October 1961, for stations 1,3, and 5 in the Frances Creek valley.
I W C I

- 3l -
2.8F at the valley bottom station (3) to 8.3F at the higher east
facing slope station (l). Differences in the maximum temperatures
under. the two air masses ranged from 9.8 F at the lower east-facing
slope station (2) to l2.9F at the higher east-facing slope station
(l). The stations on the east-facing slope recorded the lower maxi
mum temperatures of the transect stations, the highest being recorded
at the higher west-facing slope station (5).
Diurnal Temperature Range
The mean daily temperature range (Table l3) in the various
months reflected the diurnal extremes of temperature. The greatest
range was at the three Frances Creek valley-bottom stations (3, 6, and
7), this range often being twice that of the slope stations. Least
range was on the east-facing slope, the range on the west-facing slope
being 5 to 8 F higher from June to August, and 2 to 5 F higher in
September and October. The daily temperature range at station 8 was
greater than that on the slopes, but usually 5 to 6 F less than that
at station 3, the valley bottom station that showed the least range.
A range of 50 to 60 F was not uncommon at the valley bottom stations,
but a range of only about 30Fwas experienced at east-facing slope
stations from May to August.
Table l4 shows the mean daily temperature range under dif
ferent air masses for the 3 summer-months. Ranges were considerably
greater under the mT air, than under the mP air. This was probably due
to the greater amount of cloudiness that was associated with l~he mP air.

- 32 -
TABLE 12. Mean Maximum and Minimum Temperatures (OF) at Six Stations Under the Two Dominant Summer Air Masses, During June to August 1961.
Air No.of Maximum Temperature Minimum Temperature mass days Station no. Station no. type 1 2 3 4 5 8 1 2 3 4 5 8
mP 30 62.2 67.4 67.0 68.6 69.0 73.2 47.1 49.5 35.6 46.1 48.2 46.6 mT 62 75.1 77.2 78.8 81.0 81.5 85.7 55.4 54.4 38.4 53.1 55.5 51.6
TABLE 13. Mean Monthly Daily Temperature Range (OF) At All Stations May to October 1961.
Daily Temperature Range (OF) Stn. no. May June July August September October
1 19.9 17.6 16.8 11.8 8.8 2 23.9 20.2 20.5 13.9 10.0
3 30.3 38.0 35.3 38.5 26.3 22.2 4 26.7 25.3 26.4 19.5 14.2
5 20.3 25.6 23.4 23.6 16.3 11.7 6 42.4 40.3 43.1 32.0 24.7
7 31.7 42.2 37.6 40.8 28.6 23.7 8 25.6 34.1 28.5 32.5 23.3 19.0
TABLE 14. Mean Daily Range of Temperature (OF) (June to August) Under the Two Summer Air Masses at Six Stations.
Daily Temperature Range (OF) Air mass Station no.
type 1 2 3 4 5 8
mP 15.1 17.9 31.4 22.5 20.8 26.6
mT 19.7 22.8 40.4 27.9 26.0 34.1

- 33 -
Exact data on cloudiness were not available, but general daily sum
mations of degree of cloudiness were available for station 8, and
these were arbitrarily divided into four categories (Table 15).
Hourly Temperatures
The mean daily hourly temperatures from May 19 to October 31,
1961 for stations 1 to 5 are shown in Fig. 6. Most notable is the marked
temperature range for station 3. The periods of maximum and minimum tem
peratures show some variation. Minima were recorded at station 1 between
0400 and 0500 hours, at stations 2 and 3 at 0500 hours, but not until
0600 hours at stations 4 and 5. The earliest maxima (1300 hours) occurred
at station 1, and the latest (1500 hours) at station 4, with maxima at
other stations being recorded at 1400 hours. The actual times of the
maxima and minima varied with the month of the year and this is illus
trated in Table 16, which shows the mean hour of maxima and minima tem
perature at each station. The earliest minimum usually occurred at the
east-facing slope stations. In September and October, there was a 3-hour
spread in the times of the minima, varying from 0500 to 0700 hours. The
minima were usually latest at stations 5 and 8. The maxima were earliest
at station 1 in all months, and in certain months this station was joined
by station 2 in having the earliest maxima. This was as one would expect,
for after mid-day these east-facing stations were in an unfavorable posi
tion for receiving direct solar radiation. Usually, the maximum occurred
latest at station 4 of the transect stations, but later maxima were exper
ienced at stations 7 and 8. The maximum at station 8 usually occurred
three hours after the maximum at station 1, and was some 10F higher.

TABLE 16.
Stn. Temp. and no. Hour
1 T H
2 T H
3 T H
4 T H
5 T H
6 T H
7 T H
8 T H
- 34 -
TABLE 15. Number of Days with Certain Sky Conditions Under the Two Summer Air Masses for June to August 1961.
Sky conditions Air mass mP mT
Clear 0 9 Sunny, few clouds 12 41 Cloudy, with few sunny periods 11 9 Overcast; Cloudy with rain 7 3
Hour of the Maximum and Minimum Temperatures in the Different Months at the Eight Stations.
TEMPERATURE (OF) May June July August September October
Mx MIl Mx MIl Mx MIl Mx MIl Mx MIl Mx MIl
68.7 51.9 67.3 52.9 70.5 56.8 46.6 37.6 35.4 29.6 13 04 13 04 14 05 13 05 13 06
71.7 52.6 69.9 53.0 73.0 55.0 54.7 43.3 44.3 36.5 16 05 15 04 14 05 14 05 13 05
58.3 31.2 70.8 36.1 70.3 39.7 74.0 39.3 52.2 29.3 4.1.5 22.8 15 05 16 05 14 05 15 05 14 05 14 05
73.5 50.4 72.1 50.4 76.7 53.8 53.7 37.8 41.8 31.3 15 06 15 05 15 06 15 06 15 07
59.7 41.8 76.6 52.3 71..8 52.4 76.5 56.1 53.1 40.0 42.2 33.5 14 05 15 05 14 05 14 06 14 07 14 07
76.7 38.7 76.6 41.7 80.4 41.9 56.3 31.1 44.5 25.3 15 05 14 05 15 06 16 06 15 07
61.1 32.7 75.8 38.8 74.0 42.0 78.0 42.2 54.5 30.6 43.7 24.8 16 05 16 04 17 05 15 06 15/16 06 15 06
64.2 42.3 79.1 49.8 76.3 51.6 80.5 50.6 57.9 39.2 46.7 32.9 16 05 16 05 16 05 17 06 15 06 16 07

u. o
-35-
65
60
55
'.
40
35 Stations
1__ ....... IV II· -.- ---- V 111-
30~~~~~~~~~~~~~--~~~~--~~~~
2 4 6 8 10 12 14 16 18 20 22 24 HOURS
fig. 6. Mean daily hourly temperatures (Of) from May 19 to October 31,1961, for stations 1 to 5.

- 36 -
Nocturnal Inversions
Inversions occurred every night in the Frances Creek valley.
Temperatures were lower in the valley bottom than on the slopes but
there was some variation relative to the position of the slope stations.
On the east-facing slope, 47 out of 166 nights were warmer at the higher
level (stn.l) than at the lower level (2). All but one of these warmer
nights at station 1 occurred in June, July, or August, usually when mT
air was present. In August, more than two -thirds of the nights were
warmer at the higher level. On the west-facing slope, only on May 26
was the night temperature higher at the lower level (4); the higher sta
tion (5) was warmer on all other occasions. When minimum. temperatures
on the west- and east-facing slopes, from June to August were compared,
temperatures were higher on 25 nights at station 1 on the east-facing
slope than at station 5 on the west-facing slope, and on a further 24
nights the minimum. temperatures were the same. During September and
October, temperatures were usually warmer at station 5, for only on 4
nights were temperatures cooler than station 1, and on only 5 nights
were temperatures the same. On 133 nights, the temperature was warmer
at station 2 than at station 4; the reverse occurred on 21 nights.
Occasionally, the inversions were associated with valley fogs; these
were more frequent during the early autumn.
The nocturnal inversion under the different air masses in
summer in the valley transect is shown as the difference between station
3 and the slope stations (Table 17). Under mP air, the greatest differ
ence existed at station 2, with a decrease of temperature upwards, which
suggests that the maximum. thermal belt on the east-facing slope existed

TABLE 17.
Air mass
mP
mT
- 37 -
Average Amount of Nocturnal Inversion (OF) Between Stations (3 as base) Under Different Air Masses During June to August 1961.
Amount of Nocturnal Inversion (OF) Station no.
124 5
11.5
17.0
13.9
16.0
10.5
14.7
12.6
17.1
near the 4,000-ft level. On the west-facing slope, the maximum thermal
belt existed at the higher level (4,600 ft). This suggests that the
inversion was tilted. Under mT air, the inversion was deeper, though
temperatures were similar at 4,600 to 4,800 ft. On the average, the
temperature inversion was 5 F deeper under mT air than mP air at the
higher levels and thus, was more strongly developed. Usually, there-
fore, the higher the maximum temperature during the previous day, the
greater the chance of a strongly developed inversion and, therefore,
the greater the chance that station 1 would be warmer than station 2.
The relation between amount of temperature inversion and daily range
in temperature was still more marked. Sky cover lowered the magnitude
of an inversion especially under mP air. The average inversion magni-
tude under mP air for the days with overcast conditions was 10 F, for
the cloudy days 15 F, and for the basically sunny days 17 F.
Figure 7 presents a series of cross-sections of tenperature
distribution at 3-hour intervals to show the development and dissipa-
tion of the nocturnal inversion in the Frances Creek valley, under each

Maritime PolarJune 30/July 1,1961
FT.5500~-------------,
5000
1500 4500 Hrs.
4000
3500
FT. 5500 ~-------------,
5000
1800 4500 Hrs.
FT.5500~------------~
5000
2100 4500 Hrs.
4000
FT.5500~--------------,
5000
2400 4500 Hrs.
4000
3500
M aritim e Trop icalJune 24/25,1961
Isopleths:temperature of.
Horizontal scale:1 mile=8mm.
Maritime Tropical (contin ental trop ical)
August 3/4,1961
\
Fig.7. Profiles of the Frances Creek valley, with isotherms (OF) at 3·hour intervals showing development and dissipation of nocturnal inversions under different summer air masses.

Maritime PolarJune 30/July1,1961
FT.5500~------------~
0300 Hrs.
FT.5500~------------~
5000
0600 4500 Hrs.
4000
3500
FT.5500~------------~
0900 4500 Hrs.
4000
3500
FT. 5500~~--~,,--------~
1200 Hrs.
4000
3500
~5 '----.:
- 39-
Maritime TropicalJune24/25,1961
Isopleths:temperatureoF.
Horizontal scale:1mile=8mm.
Maritime Tropical (continental tropical)
August 3/4,1961
fig.7. (cont'd.) Profiles of the frances Creek valley, with isotherms(Of} at 3·hour intervals showing development and dissipation of nocturnal inversions under different summer air masses.

- 40 -
air-mass type, typical days being chosen for each type. The inversion
was less developed under mP air, and most strongly developed under cT
air. On each occasion, the lag in the cooling of the west-facing slope
at 1800 hours was most noticeable, and this effect continued until 2000
hours; and under mT and cT air, even until 2200 when there was still a
noticeable tilt in the inversion layers. The most pronounced develop
ment of the inversion took place between 2000 and 0200 hours after which
there was a steady increase or strengthening of the inversion until around
sunrise. The development of the inversion, therefore, set in before sun
set and lasted until after sunrise; net outward radiation increased pro
gressively early in the evening and generally reached a maximum shortly
after sunset after which net radiation remained constant the entire night.
By 0600 hours the warming of the east -facing slope had commenced and by
0800, under the examples of mP and mT air, the inversion had been dis
sipated. This was not true under the cT air example, but this was because
the example occurred some 6 weeks after the summer solstice, and sunrise
was later than in the other examples which were close to the solstice.
By 1000 hours, the east-facing slopes were considerably warmer, which
shows the dominating effect of incoming solar radiation; but by midday,
the west-facing slopes were as warm or warmer.
Figure 8 illustrates the rapid fall of temperature on a number
of clear days for station 3 when solar insolation no longer reached the
station, and the rapid rise in the morning when solar insolation again
fell on the station. The pattern of temperature change was similar on
all these clear days even though it covers a range from May 19 to September
14. There was always a marked drop from after 1600 hours to 2000 or 2200

90
80
70
u. o
~ 60 ::> l-e( 0::: ~ 60 ::E LIJ I-
40
30
May19/20 __ '"'une3/4 ___ _
,",une23/24 __ ,",U ly9/10 '-'-'
DATES
o--oAug.3/4 e eAug.12/13 .tr--ASept.13/14
i I II • I I ,
i : . , I , . , I , . , I , ; i ; i
20 14 16 18 20 22 24 02 04 06 08 10 12 HOURS
Fig.S. Diurnal patterns of temperature (OF) on a number of days throughout th e su m mer at station 3.

- 42 -
hours depending on time of season, then a gradual fall throughout the
rest of the night until 0500 hours after which a rapid rise occurred.
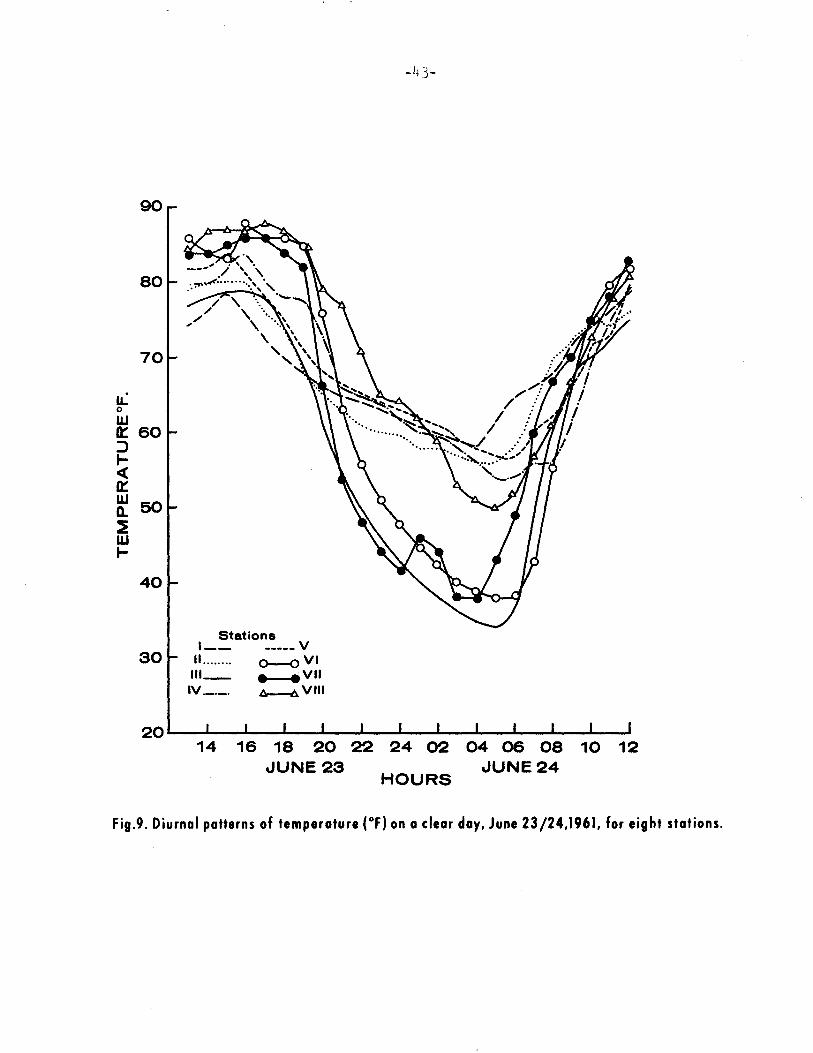
The diurnal temperature change at eight stations on June 23/24 is shown
in Fig. 9. The pattern of change at the valley bottom stations (3, 6,
and 7) was very similar as was that at the slope stations (1, 2, 4, and
5). stations on east-facing slopes tended to have a very short period
with temperatures around the maximum but stations on level ground, such
as 6, 7, and 8, had a much longer period with temperatures near the maxi-
mum.
Occurrence of Frosts
Frosts only occurred at the three valley-bottom stations dur
ing the three summer months (June to August), being recorded in each
month at stations 3 and 7 and in June and July, at station 6 (Table 18).
Even in May, stations 3 and 7 recorded 20 and 18 days of frost, respec
tively, when other stations recorded very few. During the 184 days from
May to October, frosts were recorded at the valley bottom stations on
almost half the days but slope stations only recorded frosts on about
20% of the period. This was also the position for station 8. If station
5 was typical, the slope stations in the Frances Creek valley were frost
free for 125 to 140 days, a similar length to that recorded at station 8
in the main Trench. Table 19 shows that the length of the frost-free
period in 1961 at station 8 was longer than the average from 1956 to 1962.
However, the average duration of the frost-free period at station 8 and at
the nearby stations of Wilmer and Windermere (about 110 days) was con
siderably longer than for other stations in the Trench, which indicates
90
80
70
lL o w 0:: 60 :J ... « 0:: ~ 50 ~ w ...
40
Stations 1__ _ ____ V
30 II........ 0--0 VI 111_ • .VII IV _._. Ilr---I:i. V III
14 16 18 20 22 24 02 04 06 08 10 12 JUNE 23 JUNE24
HOURS
Fig.9. Diurnal patterns of temperature (OF) on a clear day, June 23/24,1961, for eight stations.

- 44 -
TABLE 18. Number o~ Days o~ Frost (Temperature 32°F or Below) and Length o~ Frost-~ree Period at All Stations in the Period May to October 1961.
Stn. no.
1
2
3 4
5 6
7
8
No. o~ Days o~ Frost
May June July Aug Sept Oct
Oa 0 0 0 11 24
Oa 0 0 0 3 16
20 8 5 5 21 31
Oa 0 0 0 9 24
2 0 0 0 8 20
4 3 0 25 31
18 4 3 2 22 31
2 0 0 0 7 20
Total
35b
19b
90
33b
30
63c
80
29
Length o~ ~rost-~ree
period(days)
114d
127d
17
126d
141
59
49
132
a Only data ~or May 18-31; b Only data ~or 167 days;
c Only data 153 days; d A longer ~rost-~ree period is probable.
TABLE 19. Dates o~ Last and First Frost and Duration o~ the Frost-~ree Period ~or Station 8 and Average Dates and Length o~ the Frost~ree Period ~or a Number o~ Other Stations in the Rocky Mountain Trench.
stn.
8
8
Windermere
Wilmer Sinclair
Pass
Golden
Cranbrook Cranbrook
Airport Kimberley
Airport
Period
1961
1956-62
1913-49
1909-25
15 yr.
47 yr.
32 yr.
12 yr.
8 yr.
Date o~ Last Frost
Mean Earli- Lat-est est
May 12
May 15 Apr 26 Jun 12
May 27 May 10 Jun 23
May 27 May 4 Jul 10
Jun 24 May 27 Jul 13
Jun 5 May 6 Jul 13
Jun 10 May 17 Jul 7
Jun 6 May 15 Jul 12
May 31 May 10 Jun 27
1 ~rom Boughner et al. (1956)
Date o~ First Frost
Mean Earli- Lat-est est
Sep 22
Sep 12 Sep 1 Sep 29
Sep 12 Jul 20 Oct 7
Sep 18 Sep 2 Oct 7
Aug 18 Jul 20 Sep 8
Sep 8 Jul 17 Oct 6
Aug 27 Jul 19 Sep 20
Sep 10 Aug 20 Oct 8
Sep 4 Jul 29 Sep 19
Mean duration
o~ ~rost-
~ree period
132
118
1081
1141
551
951
781
961
961

- 45 -
that more favorable frost-free conditions were present in the Windermere
Lake area. Similar favorable conditions were also experienced on the
slope areas of the tributary valleys (cf. Table 18).
Degree Days and Degree Hours During the Growing Season
At most stations, the growing season (based on period when
temperatures are above 42F ) does not begin until well into May; it
is only likely to start near the end of April in the main Trench. At
many stations the growing season ended on September 6/7 in 1961 but at
other stations it continued for a further two weeks. The valley bottom
station (3) had the shortest growing season. During May to September,
station 8 received about 9% more day degrees above 42F than station 5,
the station in the Frances Creek valley with the highest number of day
degrees (Table 20). The valley bottom stations (3, 6, and 7) all had
less day degrees than the slope stations, and at station 3 this was
particularly marked. Station 7, at the entrance to the valley, had 400
or about 30% more day degrees than did station 3, some 8 miles up the
valley.
Station 8 received 15% more degree hours above 32 F than sta
tion 5 and 50% more than station 3, from May 1 to October 31 (Table 21).
Of the Frances Creek stations, stations 1 and 5 received, respectively,
22 and 31% more than station 3 in the period May 19 to October 31.
Soil Temperatures
The maximum soil temperatures were not recorded until the mid
dle of August (Table 22). After the beginning of September, there was

- 46 -
TABLE 20. Number of Growing Day Degrees Above 42 F (Based on Mean of Hourly Readings) During the Summer of 1961 at the'Stations.
No. of Degree Days Above 42 F Station Apr May Jun Jul Aug Sep
no.
1 175* 548 564 654 85
2 241* 609 606 649 141
3 151 381 420 434 38
4 220* 574 578 667 118
5 255 590 596 698 139
6 509 557 557 75
7 191 502 530 546 61
8 35 361 710 705 754 180
* Only data for May 19-31.
TABLE 21. Number of Degree Hours Above 32 F at Four Stations During the Period May to October 1961.
Month
May
(May 19-31)
June
July
August
September
October
No. of Degree Hours Above 32F Station no.
1 3 5
10254 13306
(7324 ) (6247) (8204 )
20348 16702 21350
20978 175'70 21727
23136 17852 24203
7359 6405 9539
2507 2133 2454
8
15919
24241
24361
25522
11012
5424

TABLE 22. Soil Temperatures (OF) For Seven Stations Taken at Weekly Intervals from June 14 to September 27, 1961.
Time of SOl L TEMPERATURES (OF)
Stn. observation June I July August September no. (hours) 14 21 !28 5 12 19 26 2 9 16 23 30 6 13 20 27
1 1300-1600 45.9 46.445.3 46.6 46.6 47.8 48.2 48.9 52.2 48.9 50.9 48.2 45.1 42.8 43.0 39.6
2 1200-1500 50·9 52.7 51.1 52.3 53.4 53.4 52.5 54.7 53.2 54.7 53.8 52.2 51.6 51.8 45.7 41.4
3 0930-1130 58.3 59.9 57.7 59.7 62.1 59.4 57.9 60.6 60.3 62.1 59.5 58.1 52.3 49.1 49.5 41.7
4 1030-1230 56.8 56.3 53.4 56.8 57.7 57.0 55.2 58.5 57.9 60.3 58.5 56.7 50.7 48.9 48.9 42.4
5 1030-1230 52.5 54.0 52.2 52.7 53.6 54.0 53.4 54.5 55.0 56.3 55.4 54.3 50.5 46.8 47.1 41.9 ..f;:7 -.;j
7 1330-1630 60.4 63.9 63.0 61.7 65.1 63.7 63.7 65.1 64.2 65.8 63.1 61.3 54.0 52.7 52.0 45.3
8 0800-0900 67.3 70.0 62.4 61.2 51.8 47.8 50.5 44.1

- 48 -
a fairly rapid fall in temperature with the onset of cooler air tem
peratures and smaller amounts of daily insolation. Valley bottom
stations had higher soil temperatures, and there was a considerable
difference between east- and west-facing slopes, with the east-facing
slope the cooler. On this cooler slope, the higher station was usually
2 or more degrees F cooler than the lower station.
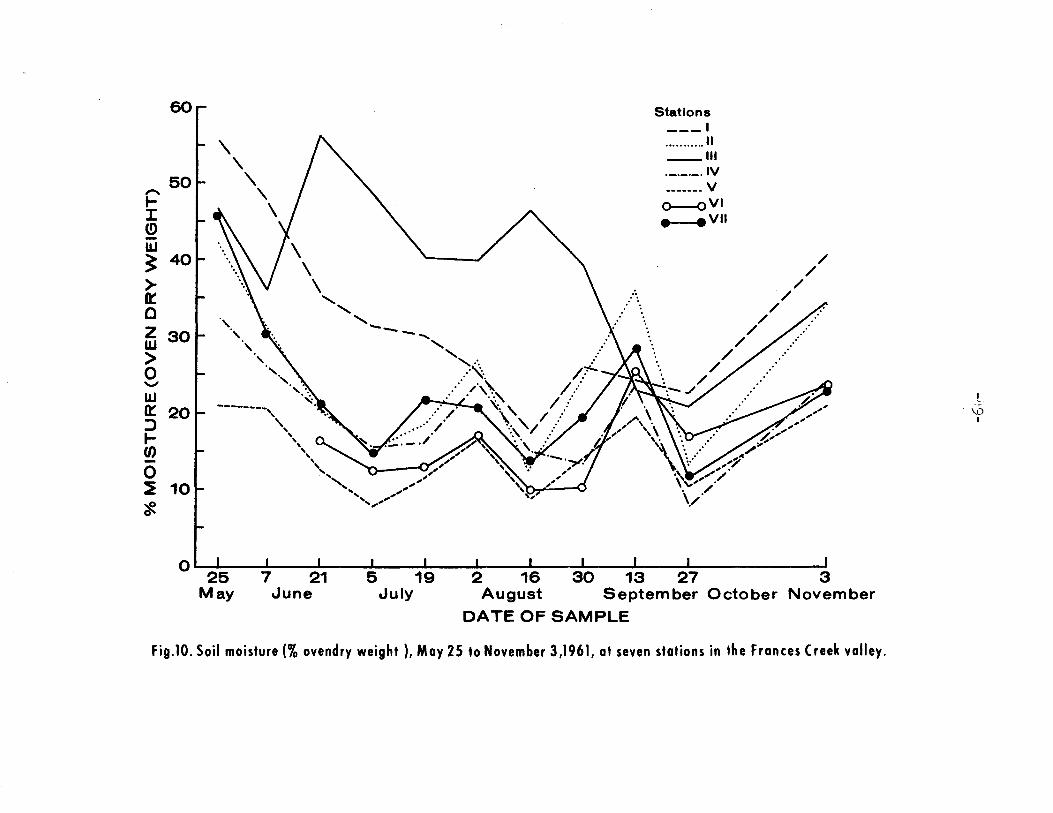
Soil Moisture
The rapid fall of the soil moisture levels in the spring was
most noticeable (Fig. 10). During the summer, there was a response of
soil moisture levels to precipitation. The replenishing of the soil
moisture content in the autumn was apparent. The soil moisture at
station 3 was exceptionally high from late June to the end of August
(40-55% moisture by ovendry weight); this was caused by a high water
table as the adja cent area was subject to flooding by Frances Creek.
Station 1 at the higher level on the east-facing slope had the highest
soil moisture level of the other stations.
Precipitation
Precipitation was measured at weekly intervals and the totals
are given for 3-week periods in Table 23. Station 1, situated at the
highest elevation and on the west side of the valley in the lee of the
mountain ridge, received more precipitation than other transect stations.
Amounts at stations 2 to 5 were very similar with a slight tendency for
the lowest station (3) to receive the least amount. When the records
-t-J: (!) -UJ
60
50
~ 40
> 0:: o Z 30 UJ > a -UJ 0:: 20 :::> t-en a ~ 10 ~
o ,. ~
-------, " " " " ' ...
May June
", ,,' .... , ',,,'
5 19 July
Stations ___ I
••••.••••.• 11 __ III
._._._.IV ______ • V
~VI
• .VII
2 16 30 13 27 3 August September October November
DATE OF SAMPLE
Fig.10. Soil moisture (% ovendry weight ), May 25 to November 3,1961, at seven stations in the Frances Creek valley.
\.0 I

- 50 -
TABLE 23. Three Weekly Totals of Precipitation from April 23 to November 3, 1961, and the Total from May 19 to November 3, for the Stations.
PRECIPITATION (I N C H E S ) Total Stn. Apr 28 May 19 Jun 9 Jun 29 Jul 20 Aug 10 Aug 31 Sep 21 Oct 12 May 19-no. May 18 Jun 8 Jun 28 Jul19 Aug 9 Aug 30 Sep 20 Oct 11 Nov 3 Nov 3
1 0.66 0.67 1.27 1.01 1.25 1.84 0.92 1.09 8.71
2 0.62 0.58 0.97 0.89 1.14 1.42 0.81 0.67 7.10
3 1.51 0.68 0.69 0.81 0.84 1.09 1.30 0.69 0.60 6.70
4 0.88 0.70 0.90 1.10 0.96 1.21 0.73 0.52 7.00
5 0.79 0.72 1.00 0.88 1.22 1.15 0.80 0.56 7.12
6 0.72 0.66 0.63 0.89 1.24 0.48 0.38
7 1.56 1.16 0.52 1.04 1.17 0.45 0.32
8 2.16 0.36 1.22 1.14 1.13 0.75 2.21 0.81 0.39 8.01
TABLE 24. Three Weekly Totals of Precipitation from May 31 to November 2, 1960, and the Total from June 11 to November 2, for Nine Stations.
PRECIPITATION (I N C H E S ) Total Stn. May 31* Jun 11 Jun 29 Jul 20 Aug 10 Aug 31 Sep 21 Oct 12 Jun 11-no. Jun 11 Jun 29 Jul 20 Aug 10 Aug 31 Sep 21 Oct 12 Nov 2 Nov 2
1 0.59 0.08 0.27 0.50 0.80 0.89 0.60 3.73 2 0.25 0.11 0.19 0.33 0.86 1.25 0.59 3.58
3 0.36 0.46 0.11 0.20 0.39 0.61 1.28 0.39 3.44
4 0.26 0.36 0.10 0.20 0.42 0.52 1.56 0.39 3.55
5 0.00** 0.59 0.16 0.21 0.40 0.61 1.25 0.38 3.60
7 0.25 0.05 0.15 0.30 0.55 1.30 0.20 2.80
8 0.35 0.90 0.30 0.23 0.19 0.89 1.61 0.41 4.53
* ** Two-week period only One-week period only
- 51 -
were comparable, stations 6 and 7 received less precipitation than the
other valley stations. When rain clouds were present in the area, they
tended to parallel the slopes and did not always cover the whole area.
It is probable that during the week some evaporation of rainfall occurred
from the rain gauges, especially when only small total amounts fell or
when rain fell early in the weekI. It was likely, therefore, that the
totals at stations 1 to 7 were lower than the amount that actually fell.
This may help to explain why a larger amount was recorded at station 8
where precipitation was measured daily. A comparison of the actual 3-
week totals at station 8 and the rest of the stations suggests that often
different rainfall regimes existed over the area. In 1960, from June 6
to November 2, station 8 received 0.66 inCh more precipitation than any
of the transect stations (1-5), and 1.46 inch more than station 7. In
1960, station 3 again received slightly less precipitation than the slope
stations (Table 24).
Relative Humidity
Mean monthly humidity values (Table 25) were usually higher at
station 3, except in September. Generally, conditions on the slopes and
at station 8 were muCh drier. The use of monthly means hides much of the
daily moisture conditions of the individual sites. Figure 11 shows the
diurnal moisture pattern for four of the stations on one of the hottest
days of the year (August 3/4) and on one of the days with considerable
overcast conditions and rain (July 27/28). On the overcast day, all sta-
tions had essentially the same moisture regime though the actual period
1 On one occasion 0.70 inch of rain was noted at station 6 but, 3 days later only 0.62 inch was recorded.

- 52 -
TABLE 25. Mean Monthly Relative Humidity (%) May to September 1961, for Six Stations.
Relative Humidity (%) Stn. May Jun Jul Aug Sep no.
1 56.5* 53.1 59.3 54.6 68.8
2 6l.3 70.4 70.3 85.3
3 73.4 68.1 74.4 73.4 79.5
4 50.4* 55.5 63.7 57.6 74.5
5 64.4 55.3 66.2 57.3 73.7
8 65.6 55.9 63.2 62.1 77.3
* Only data for May 19-31
TABLE 26. Weekly Evaporation Amounts (c.c.) from 12-inch Diameter Evaporation Pans Maintained at Four Stations Between June 2l and September 27, 1961.
Weekly Evaporation (c.c.) Stn. June JUlY August September no. 28 5 12 19 26 2 9 16 23 30 6 13 20 27
1 1650 870 1000 410 280 650 270
3 1455 1200 1660 1280 1050 1020 1585 1600 875 ll30 670 490 772 415
5 1500 1165 1665 1245 ll30 910 1700 1950 950 1250 680 400 865 357 8 3242 4582 3428 3004 2524 4434

-~ ...., > t: a 60 ~ ::> I:
~ 40 .... « .J LIJ 0:: 20
> ....
o 12 14
100
Q 60 ~ ::> I: LIJ > 40 .... « .J LIJ
0:: 20
.... ' . .....
-53-
Stations ,--"'-V ___ _
VIII.. ..... .
....... , •... \ '. \ '. \ '.
\ '. \ '. \ . ,". '" , ". ~ ,
'.;.' , . \
-_\ '
""" , .
16 18 20 22 24 02 04 06 08 10 HOURS
12
(a) CLEAR DAY -August3-4,1961
Stations 1--
'"-V ___ _
VIII ........ .
"). ",,"'--" \ ",
\
. \ " . ~ \ ..... \
'. \
". ~- " '. '\.,
"
o 12 14 16 18 26 22 2~ d2 O~ ~6 08 1'0 HOURS
..J 12
(b) CLOUDY DAY WITH RAIN- July27-28,1961
Fig.11. Diurnal relative humidity patterns for four stations on a clear day {August 3/4,1961}, and a cloudy day with rain (July 27/28,1961).

- 54 -
with 100% relative humidity conditions varied. On the whole, condi
tions of 100% relative humidity were rarely measured at slope stations.
On a clear, dry, warm day, 100% moisture conditions still occurred at
station 3 in the valley bottom and there was a trend towards these con
ditions at station 8. At the slope stations, the atmosphere remained
much drier, at least at 4 ft above the ground. The diurnal range,
therefore, was considerable at valley bottom stations but small at
slope stations. One may note the variations in the time and duration
of maximum. and minimum. humidity. Higher moisture levels exist later
on the slopes than in the valley bottom and it is probably caused by
the warmer moist air rising up the slopes from the valley bottom with
the onset of up-slope winds. The pattern of diurnal humidity in the
valley bottom suggested that condensation of moisture in the form of
dew was very important at such stations and that dew formation probably
occurred on all clear nights and many cloudy nights.
Evaporation
An attempt was made to estimate the relative rates of evapo
ration at some of the stations (Table 26). Only three evaporation pans
were available. After one pan had been used at station 8 for 6 weeks,
it was moved to station 1 to enable a comparison between the valley
bottom and the two slopes of Frances Creek valley.
During July and August, the amount of evaporation at station
8 was almost three times that at stations 3 and 5. The amount of evapo
rat.ton at these otter stations usually varied by less than 100 cc during
the whole study. From the end of August, the amount of evaporation at

- 55 -
station 1 was less than at stations 3 and 5, although for 2 weeks in
August the amount of evaporation was similar to that at station 3.
The difference probably resulted from less direct insolation, lower
maximum temperatures, and a higher percentage cloud cover. Overall
evaporation at station 5 was higher than at station 3 because the
former had a drier atmosphere and higher maximum temperatures and
wind speed.
DISCUSSION
The differences between north-facing and south-facing slopes
have long been known, their differences being equivalent to a marked
change in latitude, for both means and extremes of temperatures are
greatly affected. The main difference between east- and west-facing
slopes is that the diurnal cycle is distorted, emphasizing the morning
as against the afternoon or vice versa. This has some effect on ex
tremes, e.g., higher maximum temperatures on west-facing slopes but
little effect on mean values.
A striking feature of the summer climate of the Fr~ces Creek
valley was the occurrence of inversions every night. McLeod (1948) and
MacHattie (1970) found inversions to occur on most summer nights in the
Kananaskis River valley, Alberta, while Hayes (1941) reported inversions
to occur 94% of the time from May to September during a 4-year study at
Priest River, Idaho. Hayes also noted that the magnitude of the inversion
increased in July, August and September. Young (1921) noted the relation
ship between temperature inversion and the daily range of temperature, and
also that the highest minimum temperatures occurred at pOints 200 to 1,500
ft a~ove the valley floor. Pierce (1934) found that the height of the

- 56 -
IIthermal belt" depended on the length of the night, rate of radiation,
cloudiness, and wind velocity, as well as local topography. Thompcon
and Di ckson (1958), in a study near Salt Lake Ci ty, found "that sky
cover lowers the magnitude of an inversion only if cloud cover of at
least six-tenths has been predominant for more than eight daylight
hours. 1I They also found that the two most prominent factors related
to the development of inversions were the existence of areas allowing
the pre-cooling of air, and the warming effect of the descending air
which counteracts further radiational cooling. In Frances Creek valley,
the east-facing slope and then the valley bottom would act as areas for
pre-cooling of air and it is probable that a similar up-and-down valley
wind circulation was in operation. Cold air drainage to the valley bottom
is probably restricted to a very small thickness of air (Geiger, 1957;
Molga, 1962), and would not necessarily be recorded by a station 4 ft
above the ground. The basic c'ause of the nocturnal cold air drainage
is the steady net discharge of heat by radiation from solid surfaces,
including foliage, to cold clear sky. Foliage plays an important role
(Brooks and Berggren, 1943) as it is a poor retainer of heat. The ex
posed leaves quickly become cooler than the surrounding air and, there
fore, continue to absorb heat from the air. This steady withdrawal of
heat from the air causes an extra large amount of chilling. As chilled
air is denser than unchilled, it tends to underrun the lighter air caus
ing a fast flow of cold air down the slope. The process of air drainage
is most active before midnight (Pierce, 1934), though the inversion
slo"vly grows in intensity until sunrise. The regularity of the period
of down-valley wind at night and the up-valley wind during the day has

- 57 -
been noted in a number of studies in western Canada (Hewson and
Longley, 1944; MacHattie, 1968; Munn and storr, 19(7). The descent
of warm air from the east-facing slope into the valley bottom after
sunrise was well shown in the profiles of Fig. 6, where the upper
isotherms became tilted and then were dissipated completely as the
valley Qottom was suddenly warmed and the daytime up-valley and up
slope wind was again restored.
MacHattie (1966) noted that low humidities occurred more
frequently on the steeper slope of the Kananaskis River valley and
that the mean nightly maximum humidity decreased sharply with eleva
tion above the valley floor. Lloyd (1961) noted that the humidity
at 2 ft above the ground on slopes, near Priest River, Idaho, never
reached 100% and that dew occurred in the valley bottom, but not on
north and south slopes 65 ft above the creek.
The altitudinal and slope.aspect variations of forest fire
danger factors were not generally recognized until a study by Hayes
(1941). The results from a microclimatic network can greatly aid the
local forest ranger in his efforts at fire protection by giving him a
knowledge of seasonal and diurnal changes in the fire hazards of the
various vegetational zones and slopes. The thermal belts on the
slopes with their generally low humidities have the most dangerous
burning conditions during the night, the least dangerous being in the
valley bottoms where humidities are high, winds light, and temperatures
low. During the day, the greatest fire danger would exist in the thermal
belt on the west-facing slope, but high burning conditions may also be

- 58 -
present in the valley bottom. Thus, the exposure of each station to
drying influences is most important, and the inversion is a significant
phenomenon contributing to fire danger variations at night.
A preliminary study of the occurrence of some of the major
forest insects and diseases in the area showed some interesting distri
bution patterns. Damage by the Douglas-fir bark beetle (Dendroctonus
pseudotsugae Hopk.) was restricted to isolated trees in the drier, warmer
areas of the valley, to the south of station 6. The past and present
outbreaks of the mountain pine beetle (Dendroctonus ponderosae) on lodge
pole pine in the Frances Creek valley have occurred largely on the west
facing slope of Steamboat MOuntain and on the slopes just above the valley
bottom (Powell, 1961). Outbreaks or infestations have been rare on the
east-facing slope of the valley, probably because of the wet condition
of the stands which helps to maintain a high tree vigour, and the low
maximum temperatures which would be less favorable for the development
of the beetle (Reid, 1962; Powell, 1967). On this wetter, cooler slope
of the valley, the incidence of lodgepole pine dwarf mistletoe
(Arceuthobium americanum Nutt.) and western gall rust (Endocronartium
harknessii (J. P. MOore) Y. Hiratsuka) was greater but this may have been
because of the condition of the stand, the former occurring in overmature
stands and the latter in young regeneration, rather than some climatic
features of the site. On the dry valley bottoms and terraces of the main
Trench, the growth of Douglas-fir was exceedingly slow but the bushy
growth was sufficient to provide good Christmas trees, an important
industry of this area. The Douglas-fir needle cast (Rhabdocline
pseu.dotsugae Syd.), however, is an important problem. to this industry,

- 59 -
and was found on the drier sites, especially on the terraces around
Invermere and extending northwards to around station 7 and on the east
side of the Trench to north of station 14. 1 Parker has shown that the
build-up of the disease depends on very high humidities at the time of
ascospore dispersal. Dispersal of the spores takes place in June and
thus, all areas of the valley bottom or gullies on the slopes, which
are likely to have long periods of high humidity, may be continuous
areas of infection. In such areas, the disease is able to persist from
year to year and only infects very large areas when very favorable con-
ditions for spread and infection occur.
ACKNOWLEDGMENTS
Thanks are due to the follOwing technicians and summer student
assistants of the Forest Research Laboratory, Calgary, Alberta, for their
help in obtaining, extracting, and tabulating some of the climatic data:
M. Co~bo, W. Cummings, E. J. Gautreau, G. S. M. Lucuik, D. Peach, J. F.
Tomlinson and G. A. Van Sickle. Special thanks go to Mr. D. Strachen,
Meteorological Office, Vancouver Airport, British Columbia, for his co-
operation in making available the upper air weather maps; and to Dr. A.
K. Parker, Forest Research Laboratory, Victoria, British Columbia, for
loan of five hygrothermographs and data collected by him in June and early
July at stations 9, 10, 11, 12, and 14, in connection with his Rhabdocline
studies.
1 Dr. A. K. Parker, Forest Research Laboratory, Dept. of Fisheries and Forestry, Victoria, British Columbia. Personal communication, 1961 •.

- 60 -
REFERENCES
Boughner, C. C., R. W. Longley and M. K. Thomas. 1956. Climatic
summaries for selected meteorological stations in Canada.
Vol. III. Frost data. Can. Dep. Transport, Meteorol. Div.,
Toronto. 94 p •
Boughner, C. C. and M. K. Thomas. 1948. Climatic summaries for
selected meteorological stations in Canada, Newfoundland
and Labrador. Vol. II. Humidity, wind speed and direction.
Can. Dep. Transport, Meteorol. Div., Toronto. 88p.
British Columbia Department of Agriculture. 1967. Climate of British
Columbia. Tables of temperature, preCipitation and sunshine.
Report for 1966. 53 p.
Brooks, F. A. and W. P. Berggren. 1943. Analytical interpretation of
density-currents of air chilled by nocturnal radiation.
Trans. Amer. Geophys. Union. 24: 189 -204 •
Chapman, J. D. 1952. The climate of British Columbia. In Trans. 5th.
British Columbia Natur. Resources Conf., Victoria. p. 1-47.
Eastham, J. W. 1949. Observations on the flora of the southern Rocky
Mountain Trench in British Columbia. Trans. Roy. Soc. Can.,
Sect. V, 43: 1-19.
Geiger, R. 1957. The climate near the ground. A translation by M. N.
Stewart and others. (2nd Edition). Cambridge, Mass., Harvard
Univ. Press. 494p.
Godson, W. L. 1950. The structure of North American weather systems.
Centeno Proc. Roy. Meteorol. Soc. 89-106.

- 61 -
Hamil ton, E. L. 1954 • Rainfall sampling on rugged terrain. U • S •
Dep. Agr., Tech. Bull. 1096. 4lp.
Hayes, G. L. 1941. Influence of altitude and aspect on daily vari
ations in factors of forest -fire danger. U.S. Dep. Agr.,
Cir. No. 591.
Hewson, E. W. and R. W. Longley. 1944 • Meteorology theoretical and
applied. New York" J. Wiley & Sons. 468 p.
Huff, F. A. 1955. Comparison between standard and small orifice
raingages. Trans. Amer. Geophys. Union. 36: 689-694.
Kelley, C. C. and W. D. Holland. 1961. Soil survey of the Upper
Columbia River valley in the East Kootenay District of
British Columbia. Report No.7. British Columbia Soil
Surv., Dep. Agr., ottawa. 107p. plus maps.
Kendrew, W. G. and D. Kerr. 1955. Climate of British Columbia and
Yukon Territory. Ottawa. Queen's Printer. 222p.
Kerr, D. P. 1950. The regional climatology of southern British
Columbia. Univ. Toronto, Ph.D. Thesis. 280p.
Krajina, V. J. 1959. Bioclimatic Zones in British Columbia. Univ.
British Columbia. Bot. Sere No. 1. 47p.
Lloyd, M. 1961. The contribut ion of dew to the summer water budget
of northern Idaho. Bull. Amer. Meteorol. Soc. 42: 572 -580.
MacHattie, L. B. 1966. Relative humidity in Rocky Mountain Forests of
southern Alberta in summer. Can. Dep. Forest., Forest Fire
Res. Inst., Inform. Rep. FF-X-l. 54p.
MacHattie, L. B. 1968. Kananaskis valley winds in summer. J. Appl.
Meteorol. 7: 348-352.

- 62 -
MacHattie, L. B. 1970. Kananaskis valley temperatures in summer.
J.'Appl. Meteorol. (in press).
MacKay, D. K. and F. A. Cook. 1963. A preliminary map of continent
ali ty for Canada. Geogr. Bull. No. 20: 76 -81.
MacLeod, J. C. 1948. The effect of night weather on forest fire danger.
Can. Dep. Mines & Resources, Dominion Forest Serv., Forest
Fire Res. Note No. 14. 29p.
McLean, A. and W. D. Holland. 1958. Vegetation zones and their relation
ship to the soils and climate of the upper Columbia valley.
Can. J. Plant Sci. 38: 328-345.
Meteorological Branch, Canada Department of Transport. 1956. Character
istic properties of North American air masses. Synoptic Tech.
Stud. No. 17, Toronto, Onto
Molga, M. 1962. Agricultural meteorology. Part II. Outline of agro
meteorological problems. (Transl. reprint of Part II (pages
218-517) of Meteorologia rolnicza published by Paiistwowe
Wydawnictwo Rolnicze i Lesne, Warszawa, 1958). Warszawa,
Poland. Cent. Inst. Inform. Nault. Tech. Ekon., 1962. 351p.
Munn, R. E. and D. Storr. 1967. Meteorological studies in the Marmot
Creek Watershed, Alberta, Canada, in August 1965. Water
Resources Res. 3: 713-722.
Parker, J. 1952. Environment and forest distribution of the Palouse
Range in northern Idaho. Ecol. 33: 451-461.
Penner, C. M. 1955. A three-front model for synoptic analyses. Quart.
J. Roy. Meteorol. Soc. 81: 89 -91.

- 63 -
Pierce, L. T. 1934. Temperature variations along a forested slope
in the Bent Creek Experimental Forest, North Carolina. Mon.
Weather Rev. 62: 8-12.
Powell, J. M. 1961. The mountain pine beetle, Dendroctonus monticolae
Hopk., in western Canada. Can. Dep. Forest., Forest Entomo1.
& Patho1. Lab., Calgary, Alberta. Interim Rep. May. 35p.
Powell, J. M. 1966. Distribution and outbreaks of Dendroctonus
ponderosae Hopk. in forests of western Canada. Can. Dep.
Forest., Forest Res. Lab., Calgary, Alta. Inform. Rep.
A-X-2. 19p.
Powell, J. M. 1967. A study of habitat temperatures of the bark beetle
Dendroctonus ponderosae Hopkins in lodgepole pine. Agr.
Meteorol. 4: 189-201.
Powell, J. M. 1969. Historical study of the relation of major mountain
pine beetle outbreaks in western Can~da to seasonal weather.
Can. Dep. Fisheries and Forest., Forest Res. Lab., Calgary,
Alta. Inform. Rep. A-X-23. IIp.
Reid, R. W. 1962. Biology of the mountain pine beetle, Dendroctonus
monticolae Hopk., in the East Kootenay Region of British
Columbia. I. Life cycle, brood development, and flight
periods. Can. En tomol. 94: 531-538.
Rowe, J. s. 1959. Forest Regions of Canada. Can. Dep. Northern Aff.
& Natur. Resources, Forest. Br., Bull. 123.
Thompson, A. H. and C. R. Dickson. 1958. Ground layer temperature
inversions in an interior valley and canyon. Final Rep.
Quartermaster Res. & Eng. Command, U.S. A.rIr.ly, Proj. No.
7-83-05-004 B. 195p.

- 64 -
Ulke, T. 1935. List of the vascular plants of the Horsethief Creek -
Purcell Range, B. C. Can. Field Natur. 49: 49-55, 71-76.
Walker, E. R. 1961. A synoptic climatology of parts of the Western
Cordillera. McGill Univ., Publ. in Meteorology, No. 35.
218p.
Walker, J. F. 1926. Geology and mineral deposits of Windermere Map
area, British Columbia. Can. Geo:l.. Surv., Mem. 148. 69p.
Young, F. D. 1921. Nocturnal temperature inversions in Oregon and
California. Mon. Weather Rev. 49: 138-148.

- 65 -
APPENDIX I
CLIMATIC DATA FOR STATIONS 9 TO 16
Table A. Mean Monthly Temperatures (OF) from May to October 1961 for Stations 9 to 16.
Station Elevation Temperature OF
No. (:rt) May Jun JUI Aug sep Oct
9 2960 62.4 62.9 63.5 44.5 36.6
10 5000 58.7 57.6 61.4 46.3 31.9 11 3180 64.5 62.9 65.8 48.7 39.6 12 3240 65.6 65.5 66.8 49.1 40.2
13 3500 47.7 58.7 59.0 60.8 40.5 31.5 14 2900 60.0 62.0 62.8 45.7 36.7
15 4800 45.5 36.5 16 3612 45.1 61.3 61.6 63.4 45.4 37.1
Table B. Mean Monthly Maximum and Minimum Temperatures (OF) From May to October 1961, for Stations 9 to 16.
Temperature OF Station May June JUlY Aug sept Oct
No. Mx Mn Mx Mn Mx Mn Mx Mn Mx Mn Mx Mn
9 80.5 44.9 80.1 48.2 80.3 45.3 57.6 34.2 46.7 28.6
10 72.2 48.0 73.1 47.5 77.6 50.9 52.1 33.0 40.6 26.4 11 77.7 50.4 77.7 53.5 78.2 53.5 55.8 40.7 44.7 34.1 12 80.6 52.5 79.2 54.9 81.2 55.5 58.7 42.5 46.3 34.5 13 61.4 36.0 74.3 46.4 73.2 47.5 75.4 48.7 49.9 32.4 39.3 24.8 14 82.1 44.6 82.5 46.5 84.8 46.0 61.3 33.6 48.5 27.8 15 57.5 37.8 46.5 31.4 16 63.0 37.1 77.3 45.3 76.5 46.6 79.3 47.5 55.5 35.3 45.3 28.9

- 66 -
Table C. Mean Monthly Daily Temperature Range (OF) From May to October 1961, at stations 9 to 16.
Daily Temperature Range (OF) Stn. no. May Jun Jul Aug Sep Oct
9 35.6 31.9 34.5 23.4 18.1
10 24.2 25.5 26.7 19.1 14.2 11 27.3 24.2 24.7 15.1 10.6 12 28.1 24.3 25.7 16.2 11.8
13 25.7 29.3 25.7 26.7 17.5 14.5 14 37.5 36.0 38.8 27.7 20.7
15 19.7 15.1 16 25.9 32.0 29.9 31.8 20.2 16.4
Table D. Hour of the Maximum. and Minimum. Temperatures in the Different Months at Stations 9 to 14.
stn. 1emp May June July Aug sept Oct no. and Hour Mx MIl Mx MIl Mx Mn Mx Mn Mx MIl Mx Mx1
9 T 78.6 46.5 77.1 46.1 80.5 50.6 57.9 39.2 46.7 32.9 H 16 06 15 06 17 06 15 06 16 07
10 T 70.7 50.3 68.3 49.7 74.5 52.0 50.0 35.1 38.5 28.6 H 16 08 15 06 15 06 15 06 14 06
11 T 76.7 51.9 76.0 53.9 76.9 53.8 55.3 42.9 44.2 36.1 H 16 05 14 06 13 06 15 07 16 07
12 T 79.2 53.7 77.4 52.8 80.5 55.6 56.3 42.7 45.8 36.6 H 15 06 15 06 15 07 15 07 15 07
13 T 59.4 36.6 72.4 46.1 70.9 47.8 74.1 49.9 48.6 34.2 37.9 27.0 H 15 05 15 05 15 05 15 05 14 06 13 07
14 T 79.6 44.4 78.2 46.9 82.2 46.9 58.2 37.1 46.9 31.1 H 15 05 15 05 14 05 15 06 15 06

- 67 -
Table E. Number of Days of Frost (Temperature 32F or below) and Length of Frost-Free Period at Stations 9 to 16 in the Period May to October 1961.
No. of Days with Frost Length of stn. frost-free no. May Jun Jul Aug Sep Oct Total period (days)
9 0 0 0 15 22 37a
99c
10 0 0 0 16 25 41a 99
c
11 0 0 0 2 12 14a 118c
12 0 0 0 4 12 16a 114c
13 9 0 0 0 18 25 52 III
14 0 0 0 15 24 39a
97c
15 0 8 18 26b
16 7 0 0 0 12 22 41 98
a Only data for 153 days c A longer frost-free period probable
b Only data for 77 days
Table F. Number of Growing Day Degrees Above 42F (Based on Mean of Hourly Readings) During the Summer of 1961 at Stations 9 to 15.
Stn. No. of Degree Days above 42 F
no. May June July August September
9 617 679 666 122
10 505 483 600 67
11 677 691 738 212
12 711 729 746 225
13 202 508 526 666 56
14 600 622 628 142
15 326* 152
*Only data for August 16-31

- 68 -
Table G. Three Weekly Totals of Precipitation from April 23 to November ~ J, 1961, For Stations 13, 14 and 16.
PRECIPITATION (r: N C H E S ) Total Stn. Apr 28 May 19 Jun 9 Jun 29 Jul 20 Aug 10 Aug 31 Sep 21 Oct 12 May 19 no. May 18 Jun 8 Jun 28 Jul 19 Aug 9 Aug 30 Sep 20 Oct 11 Nov 3 Nov 3
13 2.12 0.41 0.94 0.83 1.52 1.13 1.75 0.82 0.31 7.71
14 0.68* 1.42 1.50 0.66 0.45
16 1.95 0.85 0.72 1.64 1.44 1.36 2.05 1.02 0.93 10.01
* Only data for July 26 - August 9.

- 69 -
APPENDIX II
CLASSIFICATION OF AIR MASSES OVER THE INVEBMERE AREA FROM TEMPERATURES (TABLE 4) OF THE 500 AND 700 mb LEVELS, FOR THE PERIOD MAY TO OCTOBER 1961.
Date May June July August September October
1 mP mT mP mT mP mP
2 mP mT mP mT mP mP
3 mA mT mT mT(cT) mP mP
4 mA mT mT lIlT(cT) mT roT
5 mA mT roT lIlT(cT) roT mT
6 mA mT mT lIlT mP mP
7 mA mP mP lIlT mP mA
8 mA mP mP mT mP mP
9 mP mP roT mP mT mP
10 mP mP roT mP mP mP
11 mA mP roT mT mP mA
12 mP mP mT mT mT mA
13 mP mP lIlT mT roT mP
14 mP mT roT roT mP mT
15 mP mT mT mT mP roT
16 mP m.T(cT) mP mP mP roT
17 mP lIlT(cT) mP mP mP mP
18 mP mT(cT) mP mP mP roT
19 mP mT mT mP mP mP
20 mP roT roT mP mP mP
21 mP roT mT mT mA mA
22 mP mT mT lIlT mA mA
23 mP mT mT mT mP mA
24 mP roT mT mT mP mA
25 mP mT mT lIlT mP mA
26 mT lIlT mT :tnT mP mA
27 mP mP mP lIlT mP mA
28 mP mP mP mT mP mA
29 mP mP mP lIlT mP mP
30 mP mP mP lIlT mP mP
31 mP mT mP mT
mA - maritime Arctic; mP - maritime Polar; lIlT - maritime Tropical; cT - continental Tropical.