summer jobs and internships surveys1.q4cdn.com/.../2017/summer-jobs-and-internships.pdf• a third...
TRANSCRIPT

1
Teens and young millennials join the workforce
Summer Jobs and Internships Survey
TD Ameritrade is a trademark jointly owned by TD Ameritrade IP Company, Inc. and The Toronto-Dominion Bank. © 2017 TD Ameritrade.
About TD Ameritrade Holding Corporation
Millions of investors and independent registered investment
advisors (RIAs) have turned to TD Ameritrade’s (Nasdaq: AMTD)
technology, people and education to help make investing and
trading easier to understand and do. Online or over the phone. In a
branch or with an independent RIA. First-timer or sophisticated
trader. Our clients want to take control, and we help them decide
how - bringing Wall Street to Main Street for more than 40 years.
TD Ameritrade has time and again been recognized as a leader in
investment services. Please visit TD Ameritrade’s newsroom
or www.amtd.com for more information, or read our stories at Fresh
Accounts.
Brokerage services provided by TD Ameritrade, Inc., member
FINRA (www.FINRA.org)/SIPC (www.SIPC.org).
TABLE OF CONTENTS
W ORKING LIFE……………………………………. COLLEGE LIFE………………………………………… PERSONAL FINANCES.……………………………… APPENDIX……………………………………………….
3 5 8
13
…..
3
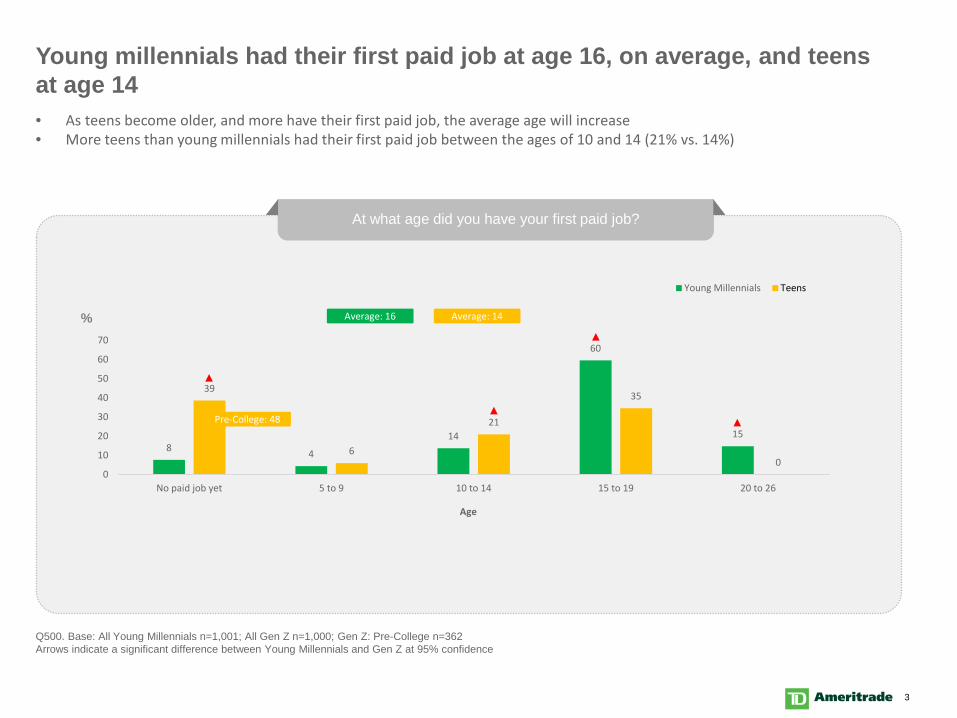
Young millennials had their first paid job at age 16, on average, and teens at age 14
Q500. Base: All Young Millennials n=1,001; All Gen Z n=1,000; Gen Z: Pre-College n=362 Arrows indicate a significant difference between Young Millennials and Gen Z at 95% confidence
At what age did you have your first paid job?
• As teens become older, and more have their first paid job, the average age will increase • More teens than young millennials had their first paid job between the ages of 10 and 14 (21% vs. 14%)
8 4
14
60
15
39
6
21
35
0 0
10
20
30
40
50
60
70
No paid job yet 5 to 9 10 to 14 15 to 19 20 to 26
Age
Young Millennials Teens
Average: 16 Average: 14
Pre-College: 48
%
4
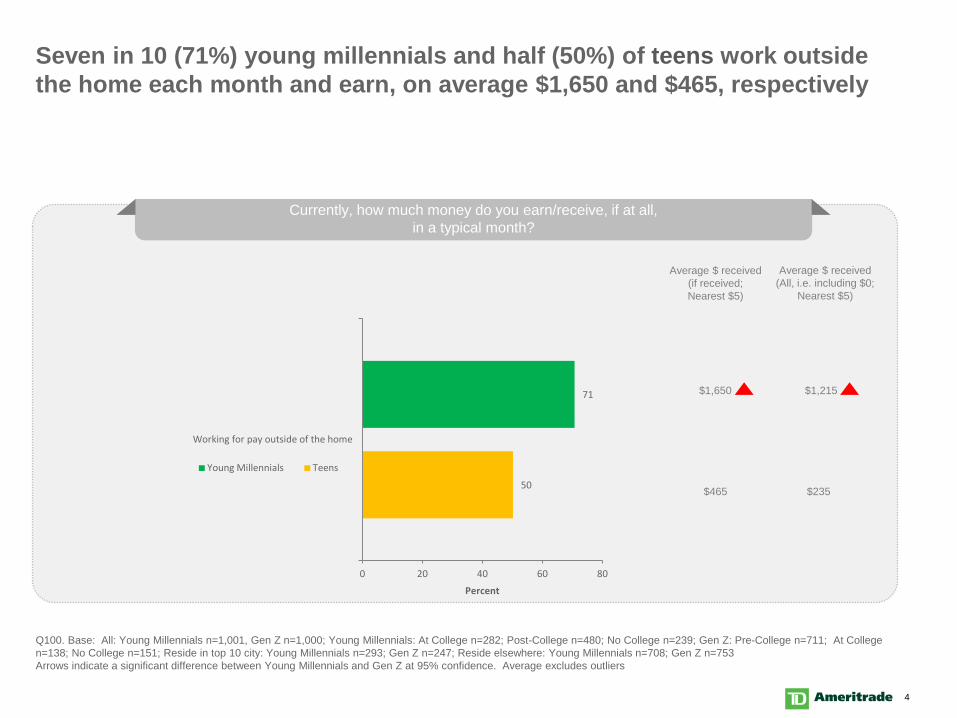
Currently, how much money do you earn/receive, if at all, in a typical month?
Seven in 10 (71%) young millennials and half (50%) of teens work outside the home each month and earn, on average $1,650 and $465, respectively
71
50
0 20 40 60 80
Working for pay outside of the home
Percent
Young Millennials Teens
Average $ received (if received; Nearest $5)
Average $ received (All, i.e. including $0;
Nearest $5)
$1,650 $1,215
$465 $235
Q100. Base: All: Young Millennials n=1,001, Gen Z n=1,000; Young Millennials: At College n=282; Post-College n=480; No College n=239; Gen Z: Pre-College n=711; At College n=138; No College n=151; Reside in top 10 city: Young Millennials n=293; Gen Z n=247; Reside elsewhere: Young Millennials n=708; Gen Z n=753 Arrows indicate a significant difference between Young Millennials and Gen Z at 95% confidence. Average excludes outliers
5
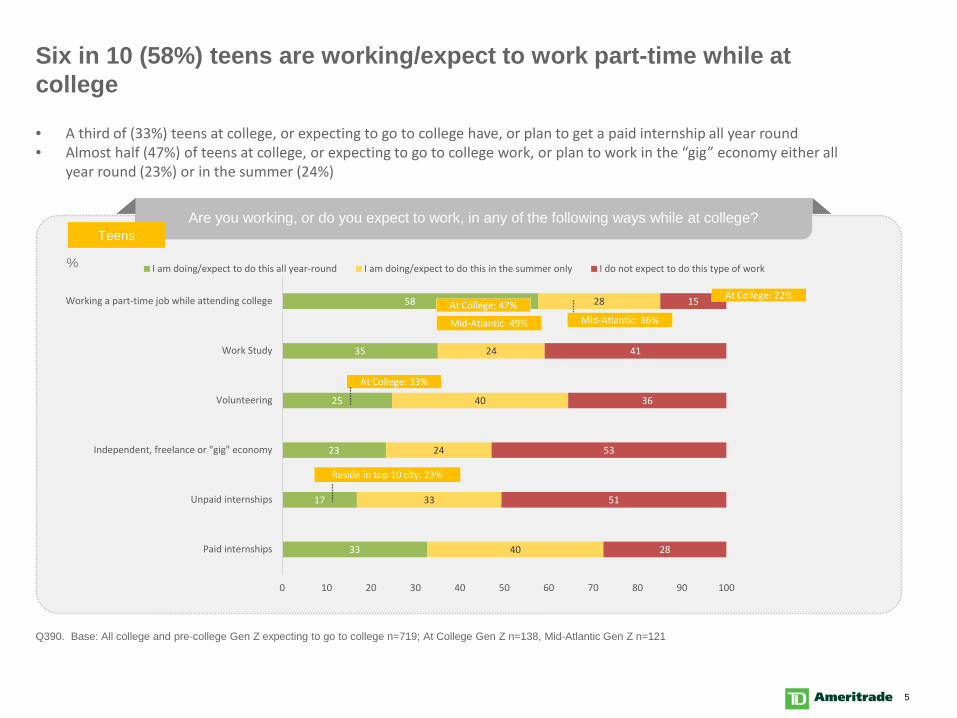
Six in 10 (58%) teens are working/expect to work part-time while at college
Q390. Base: All college and pre-college Gen Z expecting to go to college n=719; At College Gen Z n=138, Mid-Atlantic Gen Z n=121
Are you working, or do you expect to work, in any of the following ways while at college?
• A third of (33%) teens at college, or expecting to go to college have, or plan to get a paid internship all year round • Almost half (47%) of teens at college, or expecting to go to college work, or plan to work in the “gig” economy either all
year round (23%) or in the summer (24%)
%
33
17
23
25
35
58
40
33
24
40
24
28
28
51
53
36
41
15
0 10 20 30 40 50 60 70 80 90 100
Paid internships
Unpaid internships
Independent, freelance or "gig" economy
Volunteering
Work Study
Working a part-time job while attending college
I am doing/expect to do this all year-round I am doing/expect to do this in the summer only I do not expect to do this type of work
At College: 47% At College: 22%
At College: 33%
Mid-Atlantic: 49%
Reside in top 10 city: 23%
Teens
Mid-Atlantic: 36%
6
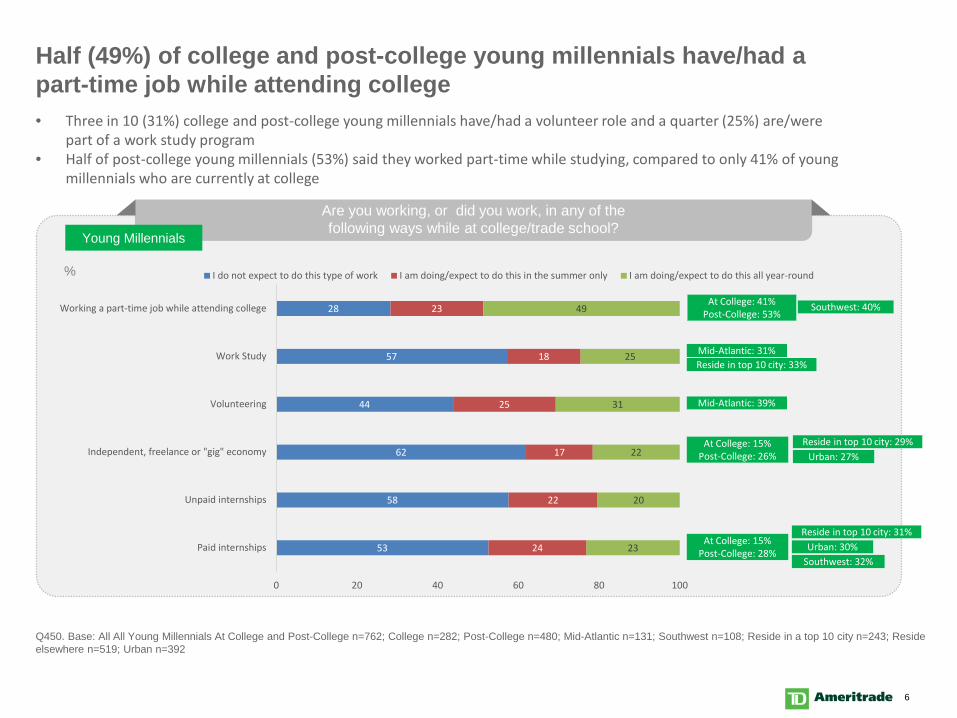
Half (49%) of college and post-college young millennials have/had a part-time job while attending college
Q450. Base: All All Young Millennials At College and Post-College n=762; College n=282; Post-College n=480; Mid-Atlantic n=131; Southwest n=108; Reside in a top 10 city n=243; Reside elsewhere n=519; Urban n=392
Are you working, or did you work, in any of the following ways while at college/trade school?
• Three in 10 (31%) college and post-college young millennials have/had a volunteer role and a quarter (25%) are/were part of a work study program
• Half of post-college young millennials (53%) said they worked part-time while studying, compared to only 41% of young millennials who are currently at college
53
58
62
44
57
28
24
22
17
25
18
23
23
20
22
31
25
49
0 20 40 60 80 100
Paid internships
Unpaid internships
Independent, freelance or "gig" economy
Volunteering
Work Study
Working a part-time job while attending college
I do not expect to do this type of work I am doing/expect to do this in the summer only I am doing/expect to do this all year-round
At College: 15% Post-College: 28%
Reside in top 10 city: 31% Urban: 30%
Southwest: 32%
At College: 15% Post-College: 26%
Reside in top 10 city: 29% Urban: 27%
Mid-Atlantic: 39%
Mid-Atlantic: 31% Reside in top 10 city: 33%
At College: 41% Post-College: 53%
Southwest: 40%
%
Young Millennials
7
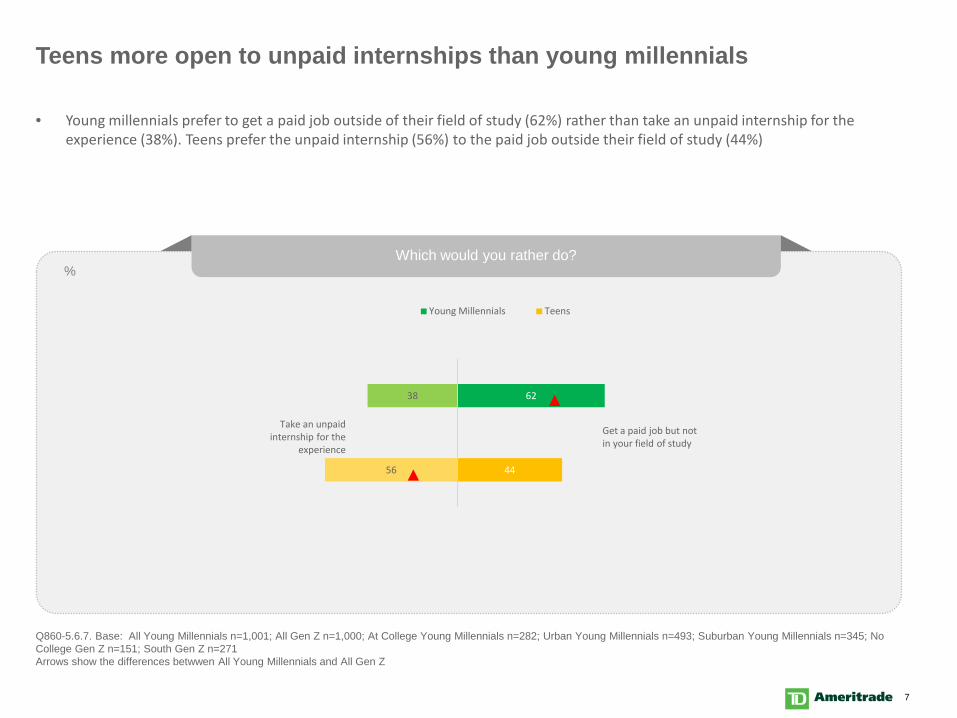
Teens more open to unpaid internships than young millennials
Q860-5.6.7. Base: All Young Millennials n=1,001; All Gen Z n=1,000; At College Young Millennials n=282; Urban Young Millennials n=493; Suburban Young Millennials n=345; No College Gen Z n=151; South Gen Z n=271 Arrows show the differences betwwen All Young Millennials and All Gen Z
• Young millennials prefer to get a paid job outside of their field of study (62%) rather than take an unpaid internship for the experience (38%). Teens prefer the unpaid internship (56%) to the paid job outside their field of study (44%)
Which would you rather do?
38
56
62
44
Take an unpaid internship for the
experience
Get a paid job but not in your field of study
Young Millennials Teens
%
8
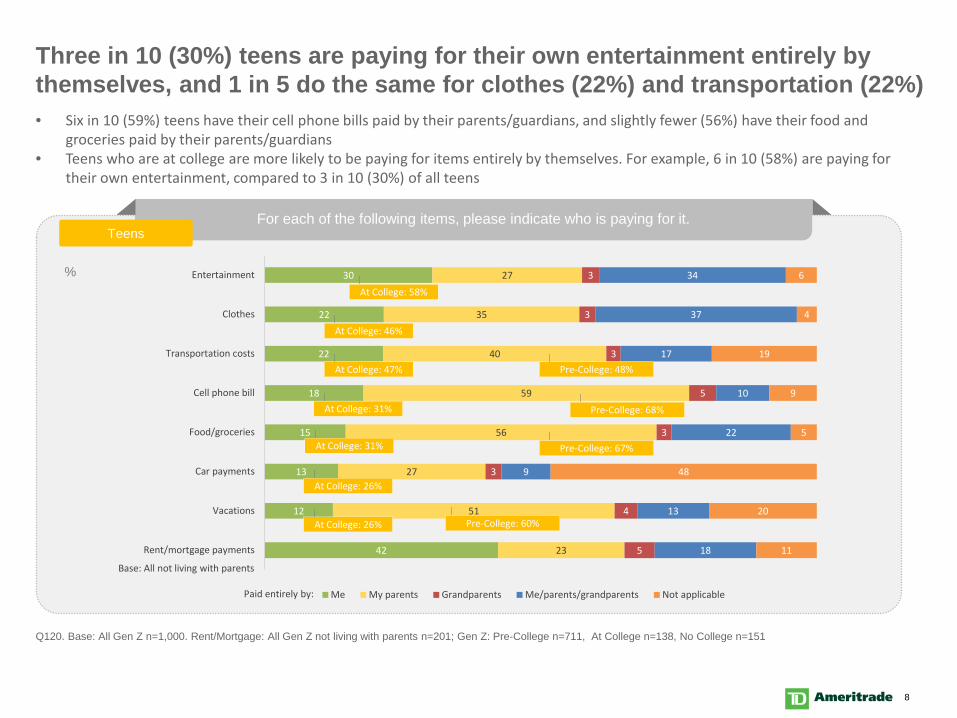
For each of the following items, please indicate who is paying for it.
%
Three in 10 (30%) teens are paying for their own entertainment entirely by themselves, and 1 in 5 do the same for clothes (22%) and transportation (22%) • Six in 10 (59%) teens have their cell phone bills paid by their parents/guardians, and slightly fewer (56%) have their food and
groceries paid by their parents/guardians • Teens who are at college are more likely to be paying for items entirely by themselves. For example, 6 in 10 (58%) are paying for
their own entertainment, compared to 3 in 10 (30%) of all teens
Q120. Base: All Gen Z n=1,000. Rent/Mortgage: All Gen Z not living with parents n=201; Gen Z: Pre-College n=711, At College n=138, No College n=151
Paid entirely by:
Base: All not living with parents
42
12
13
15
18
22
22
30
23
51
27
56
59
40
35
27
5
4
3
3
5
3
3
3
18
13
9
22
10
17
37
34
11
20
48
5
9
19
4
6
Rent/mortgage payments
Vacations
Car payments
Food/groceries
Cell phone bill
Transportation costs
Clothes
Entertainment
Me My parents Grandparents Me/parents/grandparents Not applicable
At College: 47%
At College: 31%
At College: 31%
At College: 26%
At College: 26%
Pre-College: 68%
Pre-College: 48%
Pre-College: 67%
Pre-College: 60%
At College: 58%
At College: 46%
Teens
9
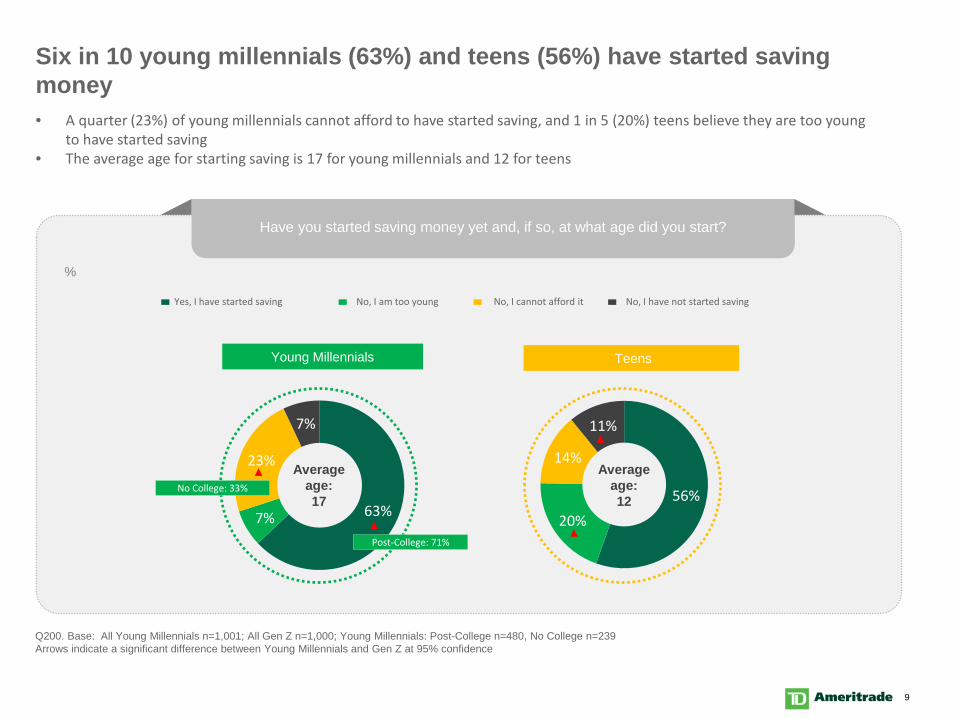
Six in 10 young millennials (63%) and teens (56%) have started saving money
Q200. Base: All Young Millennials n=1,001; All Gen Z n=1,000; Young Millennials: Post-College n=480, No College n=239 Arrows indicate a significant difference between Young Millennials and Gen Z at 95% confidence
Have you started saving money yet and, if so, at what age did you start?
63% 7%
23%
7%
56% 20%
14%
11%
Average age: 17
Average age: 12
No, I have not started saving No, I cannot afford it No, I am too young Yes, I have started saving
• A quarter (23%) of young millennials cannot afford to have started saving, and 1 in 5 (20%) teens believe they are too young to have started saving
• The average age for starting saving is 17 for young millennials and 12 for teens
Young Millennials Teens
Post-College: 71%
No College: 33%
%
10
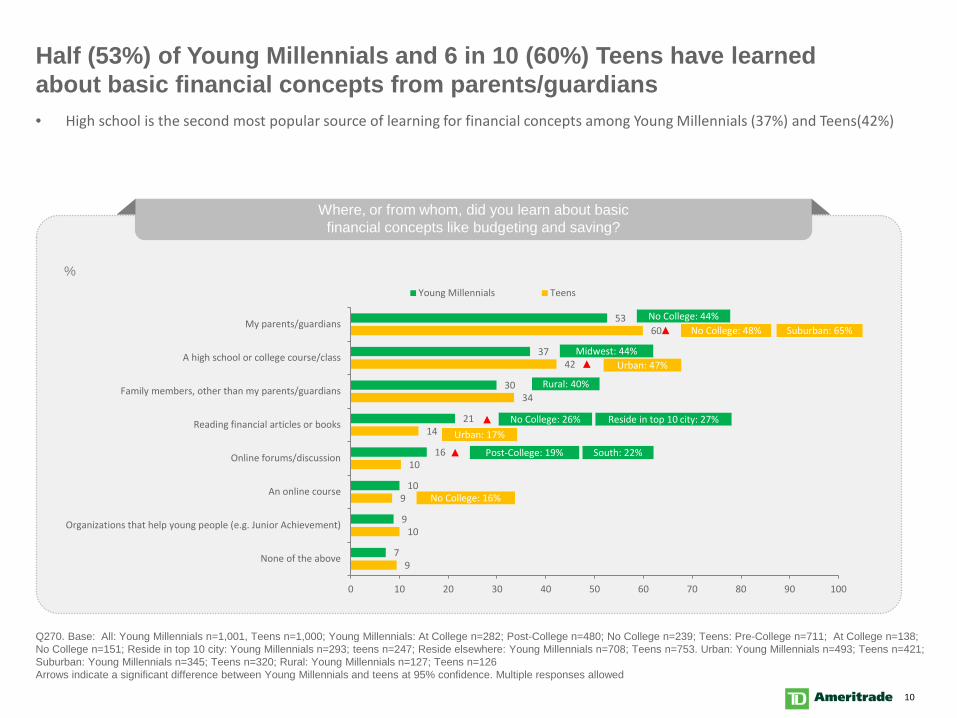
Half (53%) of Young Millennials and 6 in 10 (60%) Teens have learned about basic financial concepts from parents/guardians
Q270. Base: All: Young Millennials n=1,001, Teens n=1,000; Young Millennials: At College n=282; Post-College n=480; No College n=239; Teens: Pre-College n=711; At College n=138; No College n=151; Reside in top 10 city: Young Millennials n=293; teens n=247; Reside elsewhere: Young Millennials n=708; Teens n=753. Urban: Young Millennials n=493; Teens n=421; Suburban: Young Millennials n=345; Teens n=320; Rural: Young Millennials n=127; Teens n=126 Arrows indicate a significant difference between Young Millennials and teens at 95% confidence. Multiple responses allowed
Where, or from whom, did you learn about basic financial concepts like budgeting and saving?
53
37
30
21
16
10
9
7
60
42
34
14
10
9
10
9
0 10 20 30 40 50 60 70 80 90 100
My parents/guardians
A high school or college course/class
Family members, other than my parents/guardians
Reading financial articles or books
Online forums/discussion
An online course
Organizations that help young people (e.g. Junior Achievement)
None of the above
Young Millennials Teens
• High school is the second most popular source of learning for financial concepts among Young Millennials (37%) and Teens(42%)
No College: 44% No College: 48%
%
No College: 16%
No College: 26%
Post-College: 19%
Reside in top 10 city: 27%
Rural: 40%
South: 22%
Midwest: 44%
Suburban: 65%
Urban: 47%
Urban: 17%
11
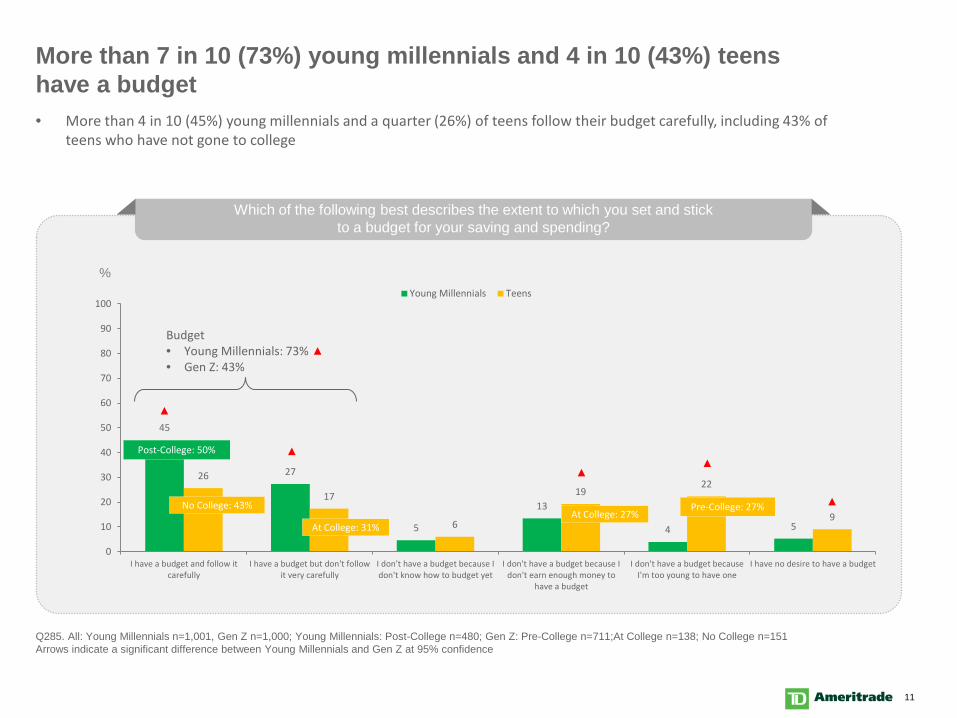
More than 7 in 10 (73%) young millennials and 4 in 10 (43%) teens have a budget
Q285. All: Young Millennials n=1,001, Gen Z n=1,000; Young Millennials: Post-College n=480; Gen Z: Pre-College n=711;At College n=138; No College n=151 Arrows indicate a significant difference between Young Millennials and Gen Z at 95% confidence
Which of the following best describes the extent to which you set and stick to a budget for your saving and spending?
45
27
5
13
4 5
26
17
6
19 22
9
0
10
20
30
40
50
60
70
80
90
100
I have a budget and follow itcarefully
I have a budget but don't followit very carefully
I don't have a budget because Idon't know how to budget yet
I don't have a budget because Idon't earn enough money to
have a budget
I don't have a budget becauseI'm too young to have one
I have no desire to have a budget
Young Millennials Teens
• More than 4 in 10 (45%) young millennials and a quarter (26%) of teens follow their budget carefully, including 43% of teens who have not gone to college
Post-College: 50%
No College: 43%
At College: 31%
Budget • Young Millennials: 73% • Gen Z: 43%
At College: 27% Pre-College: 27%
%
12
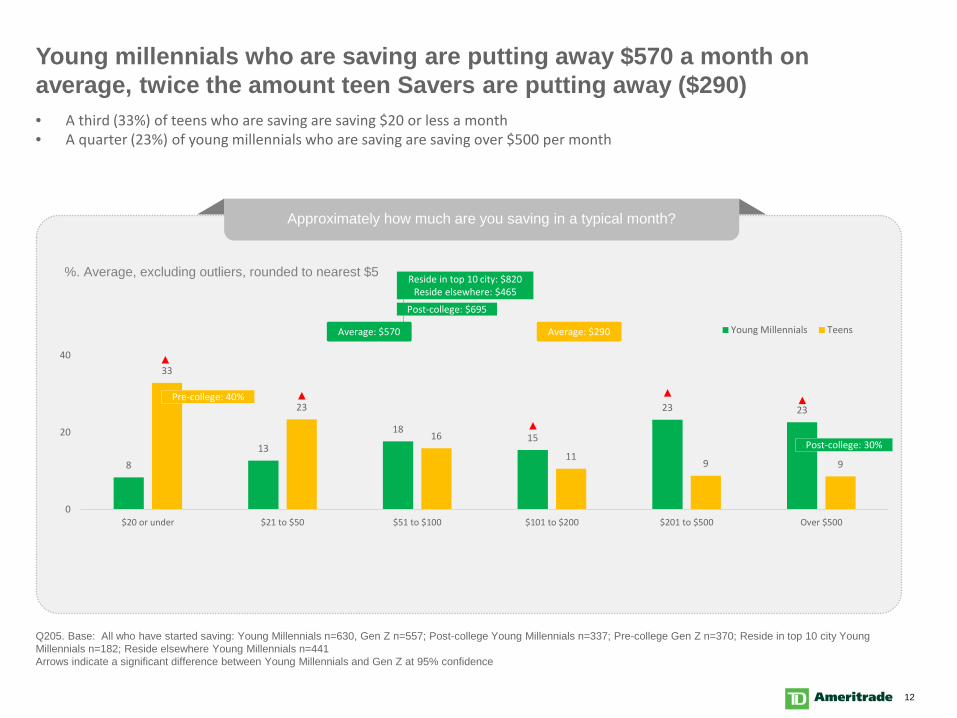
Young millennials who are saving are putting away $570 a month on average, twice the amount teen Savers are putting away ($290) • A third (33%) of teens who are saving are saving $20 or less a month • A quarter (23%) of young millennials who are saving are saving over $500 per month
8 13
18 15
23 23
33
23
16
11 9 9
0
20
40
$20 or under $21 to $50 $51 to $100 $101 to $200 $201 to $500 Over $500
Young Millennials Teens
Approximately how much are you saving in a typical month?
Q205. Base: All who have started saving: Young Millennials n=630, Gen Z n=557; Post-college Young Millennials n=337; Pre-college Gen Z n=370; Reside in top 10 city Young Millennials n=182; Reside elsewhere Young Millennials n=441 Arrows indicate a significant difference between Young Millennials and Gen Z at 95% confidence
Average: $290
Pre-college: 40%
Post-college: 30%
%. Average, excluding outliers, rounded to nearest $5
Average: $570
Post-college: $695
Reside in top 10 city: $820 Reside elsewhere: $465
13
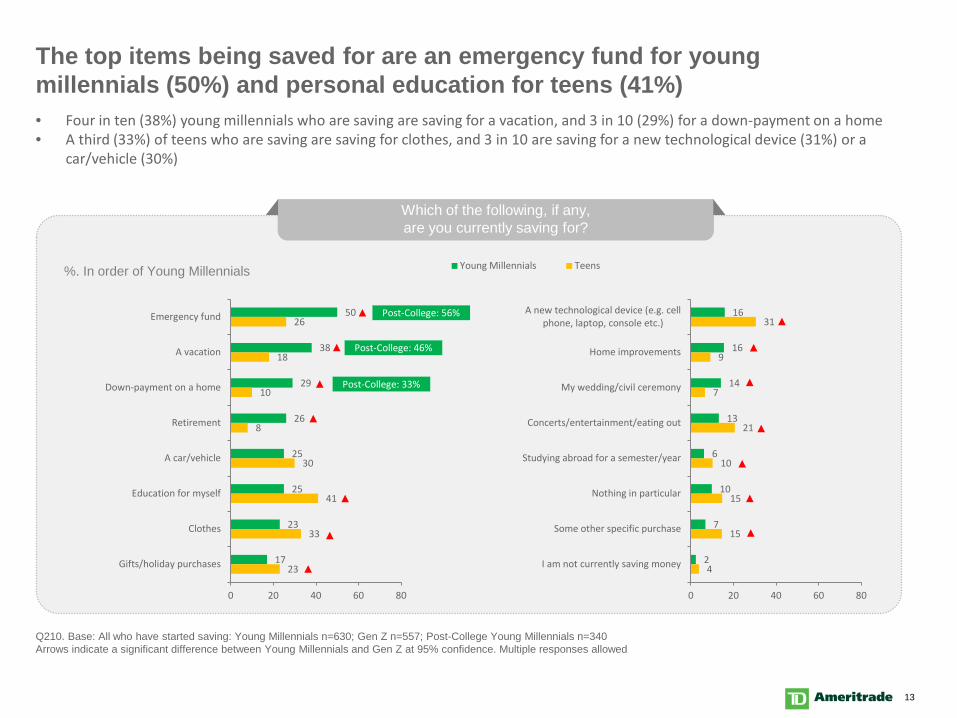
The top items being saved for are an emergency fund for young millennials (50%) and personal education for teens (41%)
Q210. Base: All who have started saving: Young Millennials n=630; Gen Z n=557; Post-College Young Millennials n=340 Arrows indicate a significant difference between Young Millennials and Gen Z at 95% confidence. Multiple responses allowed
Which of the following, if any, are you currently saving for?
50
38
29
26
25
25
23
17
26
18
10
8
30
41
33
23
0 20 40 60 80
Emergency fund
A vacation
Down-payment on a home
Retirement
A car/vehicle
Education for myself
Clothes
Gifts/holiday purchases
Young Millennials Teens
16
16
14
13
6
10
7
2
31
9
7
21
10
15
15
4
0 20 40 60 80
A new technological device (e.g. cellphone, laptop, console etc.)
Home improvements
My wedding/civil ceremony
Concerts/entertainment/eating out
Studying abroad for a semester/year
Nothing in particular
Some other specific purchase
I am not currently saving money
• Four in ten (38%) young millennials who are saving are saving for a vacation, and 3 in 10 (29%) for a down-payment on a home • A third (33%) of teens who are saving are saving for clothes, and 3 in 10 are saving for a new technological device (31%) or a
car/vehicle (30%)
Post-College: 46%
%. In order of Young Millennials
Post-College: 56%
Post-College: 33%

Appendix
This survey was conducted by Head Solutions Group on behalf of TD Ameritrade Holding Corporation.1
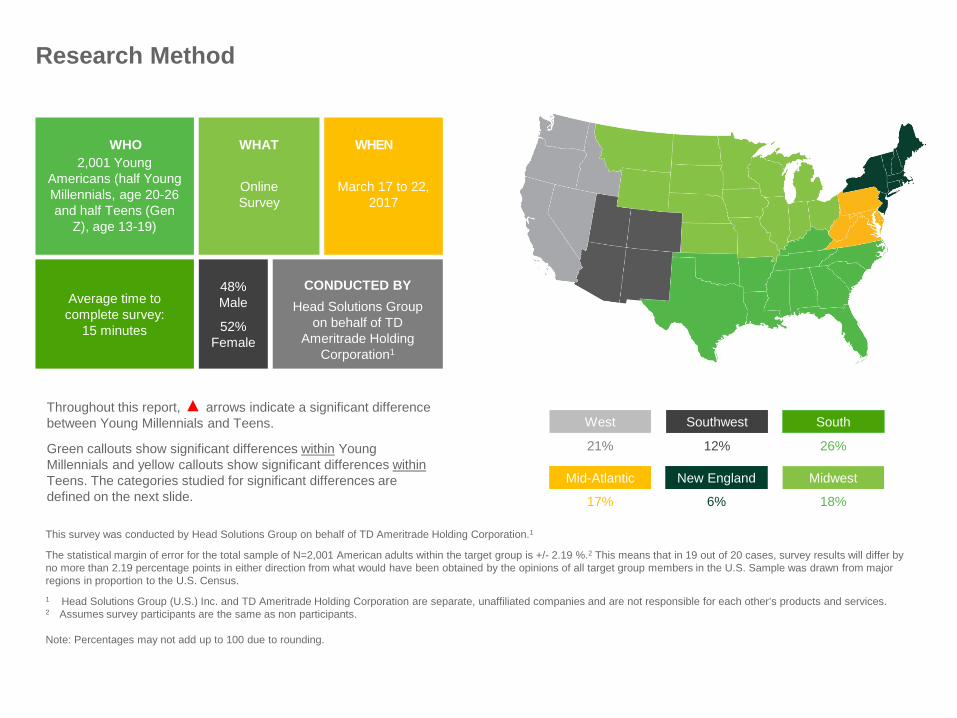
The statistical margin of error for the total sample of N=2,001 American adults within the target group is +/- 2.19 %.2 This means that in 19 out of 20 cases, survey results will differ by no more than 2.19 percentage points in either direction from what would have been obtained by the opinions of all target group members in the U.S. Sample was drawn from major regions in proportion to the U.S. Census. 1 Head Solutions Group (U.S.) Inc. and TD Ameritrade Holding Corporation are separate, unaffiliated companies and are not responsible for each other’s products and services. 2 Assumes survey participants are the same as non participants. Note: Percentages may not add up to 100 due to rounding.
New England
6%
Mid-Atlantic
17%
South
26%
Southwest
12%
West
21%
2,001 Young
Americans (half Young Millennials, age 20-26 and half Teens (Gen
Z), age 13-19)
Online Survey
March 17 to 22,
2017
Average time to complete survey:
15 minutes
Head Solutions Group on behalf of TD
Ameritrade Holding Corporation1
48% Male
52% Female
Midwest
18%
WHEN WHAT WHO
CONDUCTED BY
Research Method
Throughout this report, arrows indicate a significant difference between Young Millennials and Teens.
Green callouts show significant differences within Young Millennials and yellow callouts show significant differences within Teens. The categories studied for significant differences are defined on the next slide.