summer training report on g.s radiators ltd. ludhiana (punjab)
TRANSCRIPT

A PROJECT REPORT ON
“MARKETING STRATEGIES AND RATIO ANALYSIS”
UNDERTAKEN AT
GS RADIATORS LTD. LUDHIANA (PUNJAB)
A Project report submitted in the partial fulfillment of the
requirement for the degree Of Master of Business
Administration M.B.A(CIT)
Submitted To: - Submitted By: -
Mrs. Minakshi Rajwant
Kaur
(Prof. of MBA Dept.). MBA (CIT)
Roll No. 4964
MASTER TARA SINGH MEMORIAL COLLEGE FOR WOMEN,
1

LUDHIANA, PUNJAB
SESSION 2014-16
PREFACEThis project is the result of six weeks training at GS Radiators,
Ludhiana. Summer training is an integral part of “Masters in
Business management” course and it aims at providing a firsthand
experience of industry to students. This practical experience helps the
students to view the real business world closely
I was really fortunate of getting an opportunity to pursue my Summer
Training in such a reputed, well established, fast growing and
professionally managed organization. This summer internship training
and consequent report helps the student to practically learn the modern
industrial activities and study real techno-business area. This practical
training develops the feeling of awareness among the students.
The report contains first of all brief introduction about the company.
Finally there comes data presentation and analysis in the end of my
project report. I also put forward some of my suggestion hoping that
they will help GS Radiators, Ludhiana. Move a step forward to being
the very best.
2

I tried my level best to conduct a research to gain a thorough
knowledge about the project on topic, “Study of Marketing Strategies
and RATIO Analysis of GS Radiators”. I put the best of my efforts.
ACKNOWLEDGEMENTS
I am neither a research expert nor a trend spotter; I am a management student with foundation of management principles and theories, who is curious about various sectors and its latest happenings.
Definitely, I can’t ignore the technology, with internet as the backbone and those search engines which helped me in building up this research project.
To being with, I am obliged to Mr. RANJODH SINGH (Managing Director’s GS Radiators Ltd).who allotted me this interesting topic and without whose guidance and constructive criticism this repot might have not been completed .I would like to thank Broker, Agents franchise owners and individuals. I appreciate for their cooperation and contributions for helping me in making project factual and information.
I would like to express my heart full gratitude to Mr. GUNJAN SONKER (Relationship Manager), NIRMAL BANG SECURITIES (PVT) LTD. Who helped me in sharpening my thinking by cheerfully providing challenging comments and questions? Without the individuals have provided, this project would have lost much of its refreshing realism. I’m also thankful to the management & all employees of GS Radiators LTD.
I also express my gratitude to Mrs. (Director), Mrs. (H.O.D) and ALL FACULTY MEMBERS OF MBA DEPARTMENT OF MASTER TARA SINGH MEMORIAL COLLEGE FOR WOMEN who have been instrumental in making this report useful one.
Lastly, I would like to thanks to the ALMIGHTY and my parents for their moral and financial support and my colleagues with whom I shared my dad-to-day experiences and received lots off suggestions that improved my work quality.
RAJWANT KAUR
3
MBA (CIT)
4964
ABSTRACT
G.S. Radiators is a company that has been steadily growing throughout the
past decade. The following report will help G.S. radiators maintain the
growth that has been enjoyed in the past, with a strong emphasis on the
growth of the Radiators and products division. Furthermore, by comparing
G.S. Radiators strengths and weaknesses to that of the competition,
opportunities can be identified and capitalized on. G.S. Radiators entered
into Punjab market with its technologically advanced Radiators. But when
it entered in an Indian market, it had to face very tough competition and still
it‘s facing tough competition, but now it has gained the top position among
different companies in India. Not only G.S. Radiators has highest market
share in Radiators Market, but also in accessories of Radiators market.
G.S. Radiators created its own marketing strategies and also defined there
target market to penetrate into Indian market. G.S. Radiators aims to have
more market share in Indian market.
4
The major competitors in Radiators market are Telco, BANCO,
Sandan, and Cougar. In this project we try to find out some important
things; the different kind of marketing strategies of G.S. Radiators in Indian
market. Market strategy, positioning strategy, (Product Strategy, Price
Strategy, and Promotion Strategy), and Competitive advantage of G.S.
Radiators.
5

TABLE OF CONTENTS
Chapter No. Chapter Name Page No.
1. INTRODUCTION
INTRODUCTION
9
2. COMPANY PROFILE
PROFILE
HISTORY OF COMPANY
PRODUCTS OF COMPANY
CUSTOMERS
EXPORTERS & SUPPLIERS
FUTURE PLAN
VISION AND MISION
COMPACY POLICY
EXPORT & IMPORT
10-24
6

PURCHASE POLICY
SALES POLICY
WELFARE & SOCIAL ACTIVITES
SAFETY MEASURES
3. INDUSTRY PROFILE
TYPES OF RADIATORES
MANUFACTURING PROCESS
QUALITY MANAGEMENT
FUNCTONS OF DEPT.’S
PRICING POLICIIES
MARKETING STRAGIES &
ADVERTISEMENT
25-45
4. SWOT ANALYSIS OF THE COMPANY 46
7

5. OBJECTIVES & RESEARCH METHODOLOGY
INTRODUCTION OF SUBJECT MATTER OF PROJECT
NEED OF STUDY
SCOPE OF STUDY
OBJECTIVES OF STUDY
RESEARCH METHODOLOGY
LIMITATIONS OF STUDY
47-50
6. DATA ANALYSIS AND INTERPRETATION
PROBLEM STATEMENT RATIO ANALYSIS
MEANING OF RATIO ANALYSIS
NATURE OF RATIO ANALYSIS
IMPORTANCE OF RATIO ANALYSIS
LIMITATIONS OF RATIO ANALYSIS
CLASSIFICATIONS OF RATIOS
GS RADIATORS ‘S RATIO ANALYSIS
51-69
7. FINDINGS & SUGGESTIONS
FINDINGS
SUGGESTIONS
CONCLUSION
70-79
8. BIBLOGRAPHY
QUESTIONARE
ANNEXURE
BALANCESHEET OF THE COMPANY PROFIT AND LOSS A/C
80-83
8

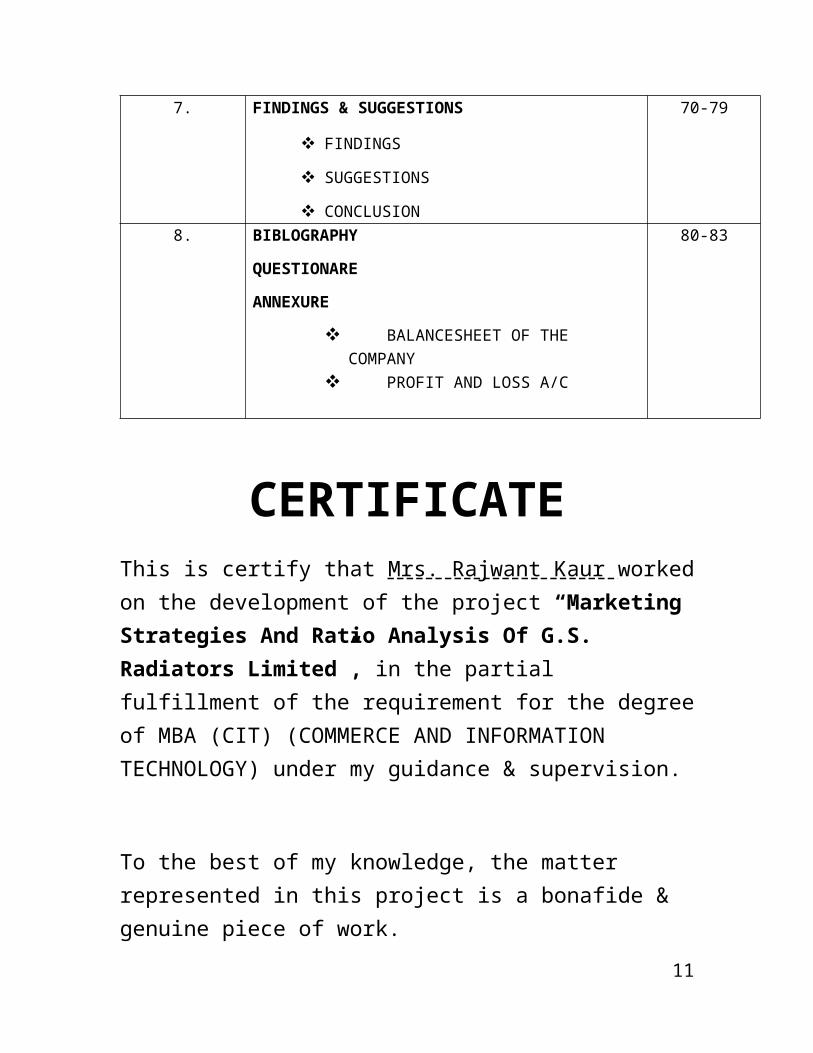
CERTIFICATEThis is certify that Mrs. Rajwant Kaur worked on the development of the project “Marketing Strategies And Ratio Analysis Of G.S. Radiators Limited”, in the partial fulfillment of the requirement for the degree of MBA (CIT) (COMMERCE AND INFORMATION TECHNOLOGY) under my guidance & supervision.
To the best of my knowledge, the matter represented in this project is a bonafide & genuine piece of work.
During her association with the project I found her to be sincere & motivated individual. She has shown keen interest in this project & him conduct was excellent.
I wish him all success in her career.
Place: Ludhiana Mr. Gurpreet Singh
(manager.)
G.S. Radiators Ltd.
9

10
CHAPT
ER NO.
1
GS Radiators established in 1992 has continually improved in all
the fields, whether it is products, delivery timing, or after sales
services. It is on fast moving track towards growth. It has attained
a prominent position in domestic as well as global automotive
industry.
Because of their quality excellence their radiators are well
accepted by various vehicle manufactures like M&M, Hindustan
Motors, Swaraj Ltd., Punjab Tractors Ltd. Taking the
advantage of globalization, they have made the strong presence
in the overseas market of Europe, Australia and USA etc.
11

COMPANY PROFILE
G.S. RADIATORS Date of Incorporation : 17th October, 1988
Promoters : G. S .Family
Board of Directors : S. Bhagat Singh
S. Jagat Singh
S. Ranjodh Singh
Mr. P.P.Singh
Mr. Iqbal Chand (Nominee IFCI)
12
CHAPT
ER NO.
2
Mr. Malkiat Singh (Nominee PSIDC)
Date of Commencement : April, 1992
Of Commercial production
Line of Business : Automobile Components
Installed capacity : 1, 00,000 units per annum
Number of Employees & Workers : 243
Contract Person : S. Ranjodh Singh (Managing
Director)
GS Group : GS Radiators Ltd.
G.S distributors.
G.S Engitech Pvt. Ltd.
Bankers : State Bank of Patiala
Product Manufactured : Radiators for all type of vehicles
(Car, Jeep, Tractor, Hcv, Lcv)
Selling Market : It is divided into 3 sub markets.
Original Equipment Market(OEM).
Replacement Market.
Export Market.
13

Regd. Office & Works : G. S. Estate,
Post Box No. 714
G. T. Road Ludhiana-141003
(INDIA)
Phones : 0161-2512241
0161-2512242
0161-2512243
Fax : 0161-2512431
E-Mail : [email protected]
Website : www.gsradis.com
MEMBERSHIP OF VARIOUS ASSOCIATIONS:-
GS Radiators also contributes its mite in philanthropic & social
facets of national life by actively associating & involving it selves
with professional bodies namely:
1. Automotive Components Manufacturers Association of India.
2. Society of Automotive Engineers, U.S.A.
3. PHD Chamber of Commerce & Industry.
4. Confederation of Indian Industry.
5. Engineering Exports Promotion council.
14

6. Indian Trade Promotion Organization.
7. Punjab Motor Parts Manufacturer Association.
HISTORY OF G.S.RADIATORS Ltd:-
In this era of ever growing demand for Automobiles in India, just
manufacturing is no longer a singular achievement. The most important
aspect of present time is the demand for a quality product that can pass the
most stringent condition of its applications.
GS Radiators Ltd. Established in 1988, is part of ‘G.S. Group’, leader in
chassis as suspension components in India. G.S Radiators adopted the latest
technology from Calsonic Llanelli Radiators Ltd, U.K.
GS Radiators & GS Radis is one of leading manufacturer of radiators for
OEM’s domestic as international after market. In a short span of time, GS
Radiators Ltd. has developed a wide range of radiators for leading vehicle
manufacturers in India like Ashok Leyland, Swaraj Mazda, and Swaraj
Tractors, Mahindra & Mahindra, & ITL-Renault & Hindustan Motors.
GS Radiators has a product range of more than 250 Models to choose from.
15

TECHNOLOGY & EQUIPMENT : backbone
The latest technology from Llanelli Radiators Limited, United Kingdom
along with the best machinery from global suppliers are wholly supported by
a team of highly qualified & professional for manufacturing a new
generation of radiators of the country. The equipment includes a gas-fired
state of art conveyor zed baking oven to ensure a uniform high performance
for the radiator core matrices. The plant also has an imported precision tube
forming machine that user a continuous timing process to produce consistent
quality locked seam tubes.
COLLABORATORS: Heading Edge
GS Radiators is proud of its association with LLANELLI RADIATORS
LIMITED, UNITED KINGDOM & the world leader in heat exchange
technology. Throughout its history of more than 8 decades, Llanelli
Radiators have been in forefront of heat exchange technology development
with many notable achievements acknowledging by the leading automobile
manufacturers of the world. A major breakthrough in technology being the
states of art HYPER FORM assembly line are manufacturing more than
20,000 Radiators in a week.
In response to the need of global internationalization Llanelli Radiators has
now joined hands with Calsonic Corporation of JAPAN. The Calsonic
family now comprises subsidiary companies involved in co-operation
technical development center, ventured & plants in 30 countries round the
world.
16

GS Radiators having through bred engineering technology package from
Llanelli Radiators has access to the best of their expertise, RESEARCH &
DEVELOPMENT & test facilities, which are among the best in the world.
GS Radiators has an opportunity to update the process technology from time
to time with the changes taking place at Llanelli Radiators, U.K.
GS AUTO INTERNATIONAL LIMITED:-
At GS Auto International Limited, a team of 100 young dedicated
technicians works in close co-operation with each other & has succeeded in
bringing to our customers these automotive components, unchallenging in
quality & workmanship.
The strength of GS Radiators is its people, sound, engineering skills,
crystallized over a period of 5 decades which have been handy in not only
keeping the customers happy but also are going to be asset in the
liberalization of Indian economy.
G. S. SALES CORPORATION:-
Every business has to survive with in the periphery of healthy & unhealthy
environment. The mushrooming up to small manufacturing units in the last 2
decades & absence of any Marketing Support System added to the plight of
small manufactures. A mission namely “GS Sales Corp.” was embarked
upon in 1994 to provide a platform to the local units by exploring synergies.
OUT SOURCING :-
17

It is mainly from the domestic manufactures. Testing & Inspection, using in
house facilities, perpetuate consistency & incessant thirst of quality.
PRODUCT RANGE OF GS RADIATORS:-
Our product range include cooling solutions for the AUTO MOTIVE, INDUSTRIAL, MARINE AND RAILWAYS etc.
18

PRODUCTS IMAGES:-
Radiators:-
Filler Tanks:-
19
PRODUCTS
Radiators
Heaters
Plastic Tankers
Concentric and plate type Pressure caps
Brass tank & Heaters
PRODUCTS
Filler Necks
Connector Pipes & Radikool Coolants
Brass Bushes
Drain cock & Plugs
Rubber Gaskets

Radiator Filler Necks & Pressure Caps:-
P-cap-13-Psi-Mini-ss-Plated:-
Water-cooled Single Cylinder diesel engine &
Air-cooled-Welding-Generator:-
20

Tractor Radiators:-
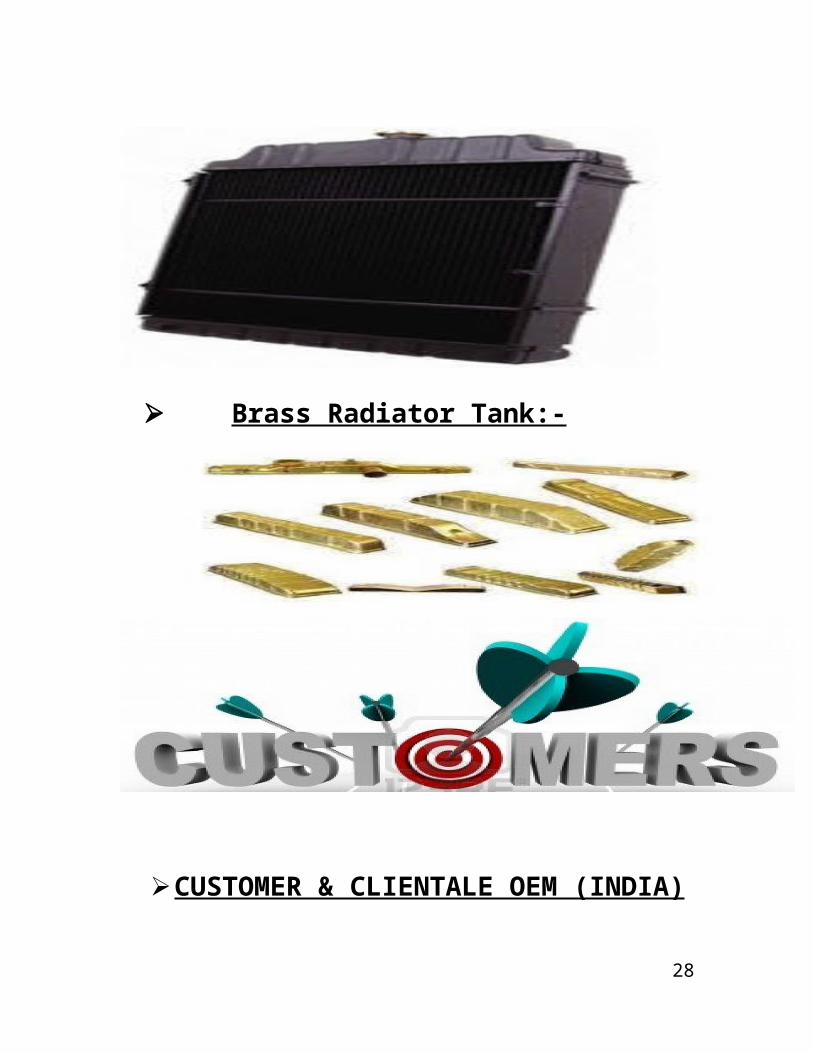
Brass Radiator Tank:-
21

CUSTOMER & CLIENTALE OEM (INDIA)
22
M/s Ashok Leyland
M/s Mahindra & Mahindra Ltd,
Auto Divn Bssby.
M/s Mahindra Nissan Ltd
M/s Punjab Tractor Limited
M/s Mahindra & Mahindra Ltd,
Auto Divn, Nasik
M/s Hindustan Motors Ltd
M/s HMT Tractor Division
M/s Mahindra & Mahindra Tractor
Divn
M/s Swaraj Mazda Ltd
M/s TELCO
M/S Class India Pvt. Ltd, Marinda
M/s Sonalika Tractors

The main Suppliers and Exporters of GS Radiators Ltd.
23

24
“GSR plans for future are to run side by
with the information technology. They are
soon going to launch their automatic
purchase receiving system. In this system,
customer has to just feed his purchase
order in the given format on GSR site and
that order will automatically added to
GSR’s data base. They are also planning a
form to be made available on their site for
their field employees to claim their
TA/DA” bills. Other facilities like warranty
claim, product enquiries, customers view
on the product etc are also going to
launched.
FUT
URE
PLA
N:-
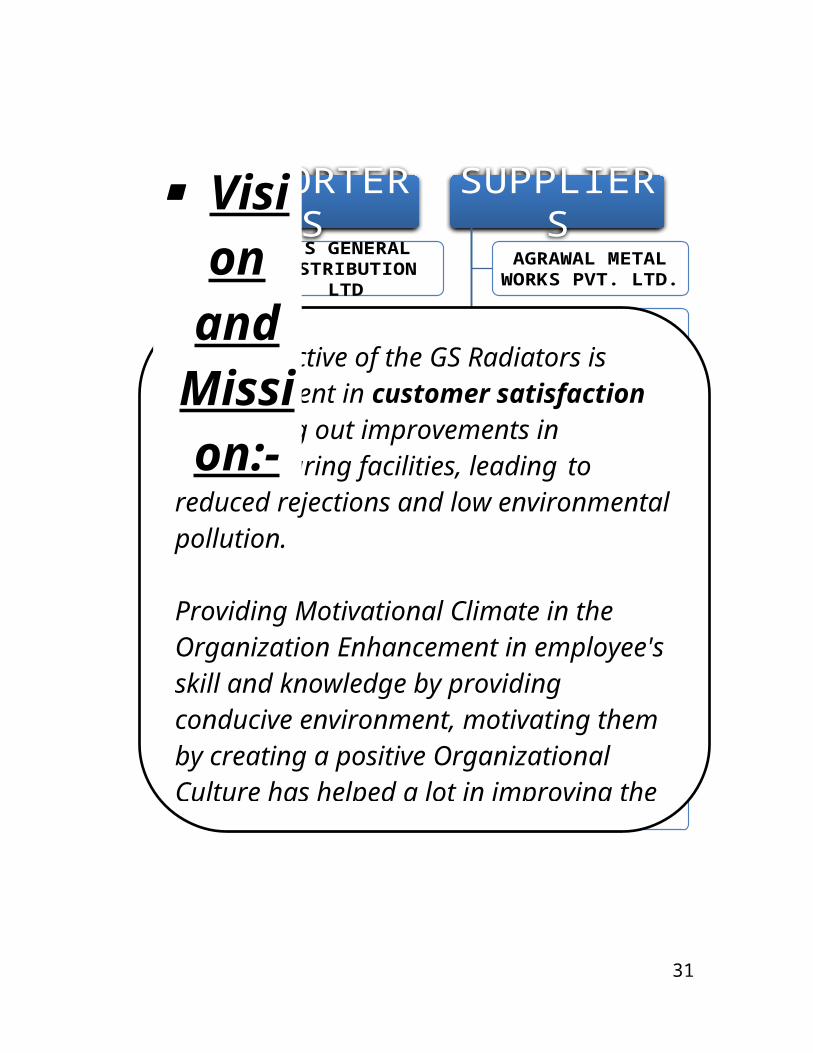
Vision and Missi

25
EXPORTERSA S GENERAL
DISTRIBUTION LTD
ADRAD PTY LTD.
KIRKLAND AND ASSOCIATES LTD.
MATT BUCKLEY TRACTOR SPARES LTD.
PADIS EUROPE B.V.
TVH FORKLIFT PARTS NV WAREGEM
QUALITY TRACTOR PARTS LTD.
SUPPLIERSAGRAWAL METAL WORKS PVT. LTD.
BERI MERCURIO LTD
GUPTA METAL SHEETS PVT LTD.
JUGAL TUBE PVT.LTD.
KOTHARI METALS LTD.
LONDON METALS & OMMODITIES
MAJOR METALS LTD.
NEELKANTH STEELS
S.R.JAIN CHEMICALS(P) LTD.
“ The objective of the GS Radiators is enhancement in customer satisfaction by carrying out improvements in manufacturing facilities, leading to reduced rejections and low environmental pollution.
Providing Motivational Climate in the Organization Enhancement in employee's skill and knowledge by providing conducive environment, motivating them by creating a positive Organizational Culture has helped a lot in improving the competencies of our personnel. Spirit De Corps and team spirit is the inherent trait from the very inception of GS Radiators.”
Vision and Missi

Company policies:-
26
EXPORT IMPORT POLICY :- To accelerate the country’s transition to a globally vibrant
economy with maximum benefit from expanding global market opportunities.
To stimulated sustained economic growth by providing access to essential raw materials, components, consumable and capital
goods required for augmented production. To provide consumer with good quality at reasonable price.
Purchase policy:- Company maintains the goodwill of approval vendors. Purchase preference is given to those who have adopted
internationally known quality management system. There are continuous checks on inventory levels so as to avoid the
situation of over stocks.
SALES POLICY:- Company maintains the goodwill of all the customers.
Sales preference is given to those who have adopted internationally known quality management system.
There is continuous check on inventory levels to avoid the situation of overstocks.

WELFARE ACTIVITIES :-
Provide uniform and shoes to the employees
Provide canteen and mess facility.
Provide medical coverage to the employees.
Providing ambulance and first aid facility.
Various awards and rewards given to employees.
SAFETY MEASURES:-
GS Radiators Ltd. lays utmost care towards health and safety of
all personnel. Central safety committee at the apex level and the
department safety committee at the shop floor are formed to
monitor the safety activity. Training on safety, firefighting is given
to all level of employees at the regular intervals. The company is
generally providing Personal Productive Equipment’s like helmets,
ear plugs, safety shoes, googles etc. to their employees.
SOCIAL ACTIVITIES:-
Educational Institutes run by GS Group:
1. Guru Nanak Public School.
2. Ramgarhia Girls College.
3. Ramgarhia Middle School.
4. Ramgarhia Senior Secondary School.
27 CHAPTER
GS RADIATORS:-
Radiator
Radiator: a part of the cooling system in a liquid-cooling engine, removing
excess heat from the engine and dissipating it into the atmosphere.
The radiator is important in internal engines because the engine cannot run
properly when it is overheated. At high enough Temperatures, oil lubricating the
engine’s moving parts breaks down and burns away. Eventually some of those
parts jam or melt and engine stops running.
A radiator works on the principal that that the heat flows from the hottest region
to the coolest region, and heat in any substance radiator into cooler air surrounding
it. Most cars and trucks use a liquid to transfer heat away from the engine. Engines
used in lawn mowers, chain saws, airplanes, most motorcycle, and some cars rely
only on the transfer of heat from metal to the air. They are called air –cooled
engines.
In liquid –cooled engines, a coolant – usually a mixture of water and chemicals –
circulates through hollow chambers that surround the engine’s cylinders. Heat
28
CHAPTER

produced by burning fuel is transferred from the metal into the coolant. A pump
circulates coolant through the engine to the radiator. Hot coolant arrives at the
radiator, which exposes the coolant to cooler metal and lowers its temperature.
Afterwards, the coolant is pumped through the engine to repeat the cycle.
In a down – flow radiator, the tubes run vertically. In a cross – flow radiator, the
tubes run horizontally, which generally allows for longer tubes and increased heat
transfer. Some radiators have zigzag pattern of tubes to increase their length and
surface area. Making the walls of the tubes as thin as possible improves efficiency
by reducing the distance heat must travel through metal to air. Also some metals
transfer heat better than others.
Thin metal fins support the tubes and also help transfer heat to the air by
increasing surface area, which increase the efficiency of the radiator. The cooling
system normally includes a fan to draw air past the tubes. The fan is important
when the engine is running and generating heat but the car isn’t moving quickly
and causing air to flow past the fins.
CLASSIFICATION OF RADIATORS:-
29

BASIC CONSTRUCTION:-
1. Vertical Flow:
Radiators which have their cores mounted in vertical position so that the hot engine
coolant moves from upper tank, vertically downwards through the core, and finally to the
lower Vertical Flow Radiators.
2. Cross Flow:
Radiators having their cores mounted in horizontal position so that the hot engine coolant
moves from side tank to the opposite side tank, depending on design, In this type of
radiator, the filler well in most cases is in the side tank.
CONSTRUCTION OF CORES:-
1. Gill type radiators core:
The Gill type radiator core has the advantage of fewer soldered joints and is therefore a
stronger construction as compared to pack type core.
2. Pack type radiator core:
It provides much larger surface area for heat radiation for the same size of the core, in
other words it is more efficient. Other is the ease of core assembly of the pack type.
Therefore it is much easier to manufacture Pack type cores as compared to Gill type
cores.
30
BASIC CONSTRUCTION
VERTICAL FLOWCROSS FLOW
CONSTRUCTION OF THE CORE
GILL TYPE RADIATOR COREPACK TYPE RADIATOR CORE
MA NUFACTUR
Production process is process of goods and services by combining as
utilizing the inputs available from different factors of production.
STEPS IN MANUFACTURING PROCESS:-
Preparing for production
Raw material
Basic processing of raw material
Making of parts/components/assemblies
Quality check
Assembly/manufacturing
Quality
Finished & packed
Delivering or shipping
MANUFACTURING CRITERIA OF GS
RADIATORS:
Work instructions & specifications at all stages.
Development of employees at all levels of organization through
continuously training & education.
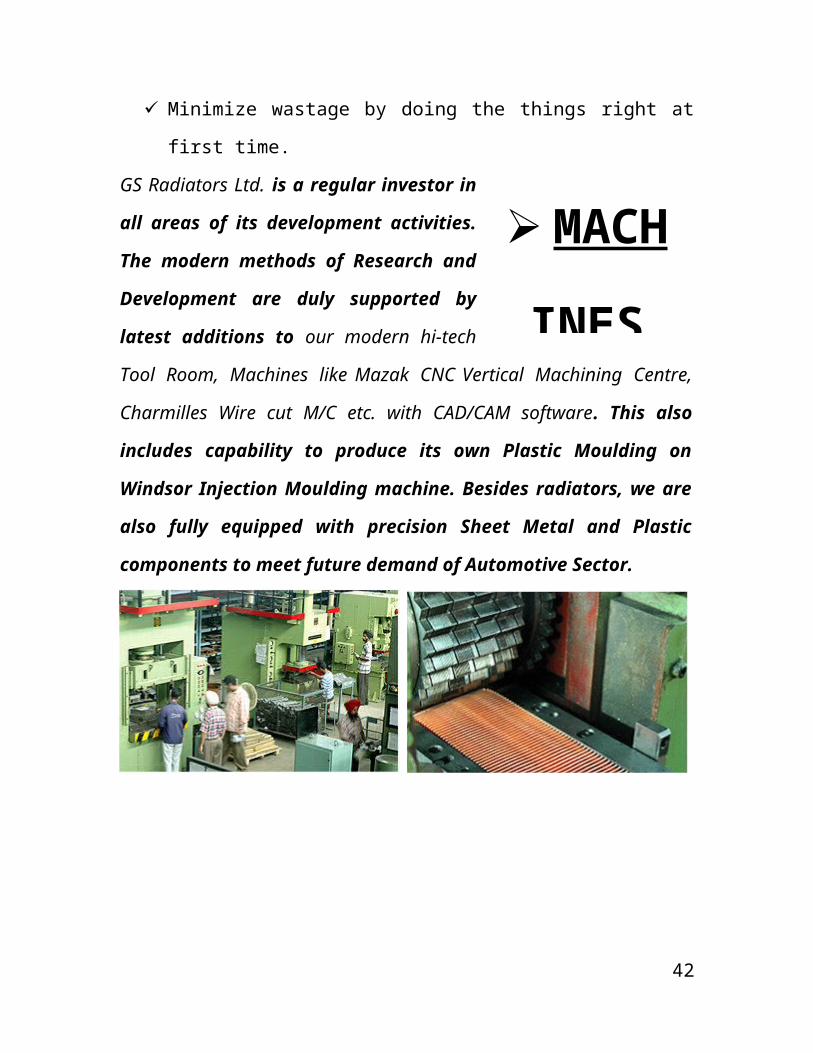
Minimize wastage by doing the things right at first time.
31
MA NUFACTUR

GS Radiators Ltd. is a regular investor in
all areas of its development activities.
The modern methods of Research and
Development are duly supported by
latest additions to our modern hi-tech
Tool Room, Machines like Mazak
CNC Vertical Machining Centre, Charmilles Wire cut M/C etc. with
CAD/CAM software. This also includes capability to produce its
own Plastic Moulding on Windsor Injection Moulding machine.
Besides radiators, we are also fully equipped with precision
Sheet Metal and Plastic components to meet future demand of
Automotive Sector.
01. RADIATOR TYPE :
COPPER BRASS CORES WITH BRASS
32
MAC
HINES
USED
M
ANU
FAC

TANKS SOLDERED CONSTRUCTION.
COPPER BRASS CORES WITH
PLASTIC TANK
02. CORE SYSTEM : A) FLAT FIN/GILL TYPE – 2 TO 6 ROW
B) MCCORD TYPE/PACKTYPE-
2TO4ROW
03. MACHINE/EQUIPMENT :- 1. TUBE MILL:
Machine imported from West Germany. Brass foil, coated with solder on
both sides is formed into seam locked tube.
Solder coating given – 25 microns
Machine speed – 40 Mts. /Min
2. FIN ROLLING MACHINE:
Machine imported West Germany. Electronic Controls Provided.
a) Flat Fin – Capacity 3R, 4R, 5R, 6 Speed: 20m / min.
b) Corrugated Fin - Capacity 2R, 3R, 4R Speed: 20m / min.
c) Material: Copper Foils – 0.04 to 0.05mm thick used.
3. CORE ASSEMBLY FIXTURES:
Semi-Automatic – Indigenous make as per collaborator’s design.
4. BAKING OVEN:
Machine imported from UK Continuous baking system with belt conveyor
operating with PID Controls Speed adjustable. Core from core assembly are
33
M
ANU
FAC

moved to baking through conveyor and handing is minimized to avoid
damages.
5. RADIATOR ASSEMBLY:
a) Fixtures designed indigenously
b) Assembled radiators move to final finishing by ground conveyor.
6. PAINTING:
Conveyorised Spray booth supplied by a reputed Indian manufacturer.
Radiators are painted in dust free atmosphere. Further it ensures paint free
working atmosphere. Radiators are baked at 120xC for a total time of 40
Min.
7. PACKING:
a) Carton Box Packing
b) Wooden Boxes provided for longer destinations.
C. DEVELOPMENT FACILITIES:
Full-fledged design office exists in the plant with experienced design
engineers.
D. TESTING FACILITIES:
All design are tested as per IS 7611.Following tests are done.
1. 100% Leak test.
2. Vibration test.
3. Impulse test.
4. Bump test.
5. Heat dissipation test (Plenum Chamber)
34

E.QUALITY ASSURANCE:
POLICY: QUALITY-COST-DELIVERY-SERVICE (QCDS)
1. All process sheets are made available by collaborators & updated
periodically.
2. Each Station has check sheets with control parameter for monitoring.
3. Patrol Inspector to monitor process.
4. Statistical process control systems are used in the manufacturing line.
5. All chemicals & chemical lab.
6. All incoming materials are checked against specified standard.
7. Acceptance tests as per IS 7611 are conducted for each batch of radiators.
8. IS 9002 – Preliminary Stage.
F. DEVELOPMENT FOR NEW RADIATOR:
1. Generally samples are to be provided by the customers with the following:-
a) Material specification/dry weight.
b) Heat dissipation at specified water flow & air flow.
c) Water capacity.
d) Operating pressure.
e) Required performance tests with parameters
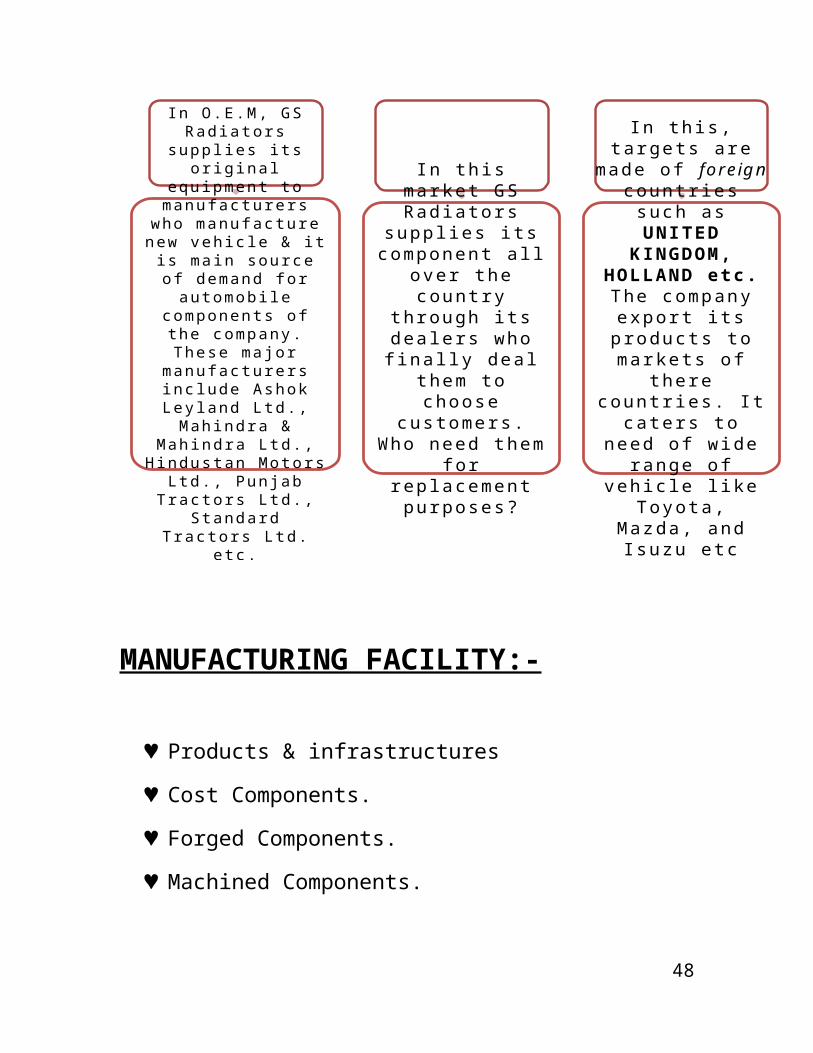
SELLING MARKETS:-
35

MANUFACTURING FACILITY:-
Products & infrastructures
Cost Components.
Forged Components.
Machined Components.
36
Original Equipment
Market
In O.E.M, GS Radiators supplies its original
equipment to manufacturers who
manufacture new vehicle & it is main source of
demand for automobile components of the
company. These major manufacturers include Ashok Leyland Ltd.,
Mahindra & Mahindra Ltd., Hindustan Motors Ltd., Punjab Tractors
Ltd., Standard Tractors Ltd. etc.
Replacement Market
In this market GS Radiators supplies its component all over the country
through its dealers who finally deal them to choose customers. Who need them for replacement purposes?
Export Market
In this, targets are made of foreign countries such as
UNITED KINGDOM,
HOLLAND etc. The company export
its products to markets of there
countries. It caters to need of wide
range of vehicle like Toyota, Mazda, and
Isuzu etc
QUALITY MANAGEMENT SYSTEM

QUALITY - AN - OBSESSION
Consistency in our product quality speaks for itself. Our quality objective is to meet or rather exceed customer's expectations. We have maintained International Quality management system by incorporating Quality standard of ISO / TS / 16949 duly accredited, by AQSR International Inc. Ann Arbor Michigan USA.
QUALITY ASSURANVE & INFRASTRUCTURE:-
37
QUALITY ASSURANCE
At G.S. Radiators, quality is an established result of a well-designed & organized system. The concept of Total Quality Control ‘TOM is the hallmark of GS Radiators’ quality assurance team, with extreme core being exercised right from the selection of materials. Instead of today’s highly competitive & quality conscious marketGS Radiators offer the high performance’ core Matrix of Gill & Tubes far heavy commercial vehicles as well as off-highway application such as Tractors & Bull Dozers & Pack Construction or Serpentine Louvered Matrix for Car, Jeeps.
DEVELOPMENT INFRASTRUCTURE
Full – Fledged DESIGN facilities with experienced design engineers – to provide the optimum cooling solutions for the engine management system using advance CAD/CAM solutions & 3D-CNC machining facilities.Facilities exist for prototype development testing.Tool-Room with machines having close accuracy.Calibration facilities.
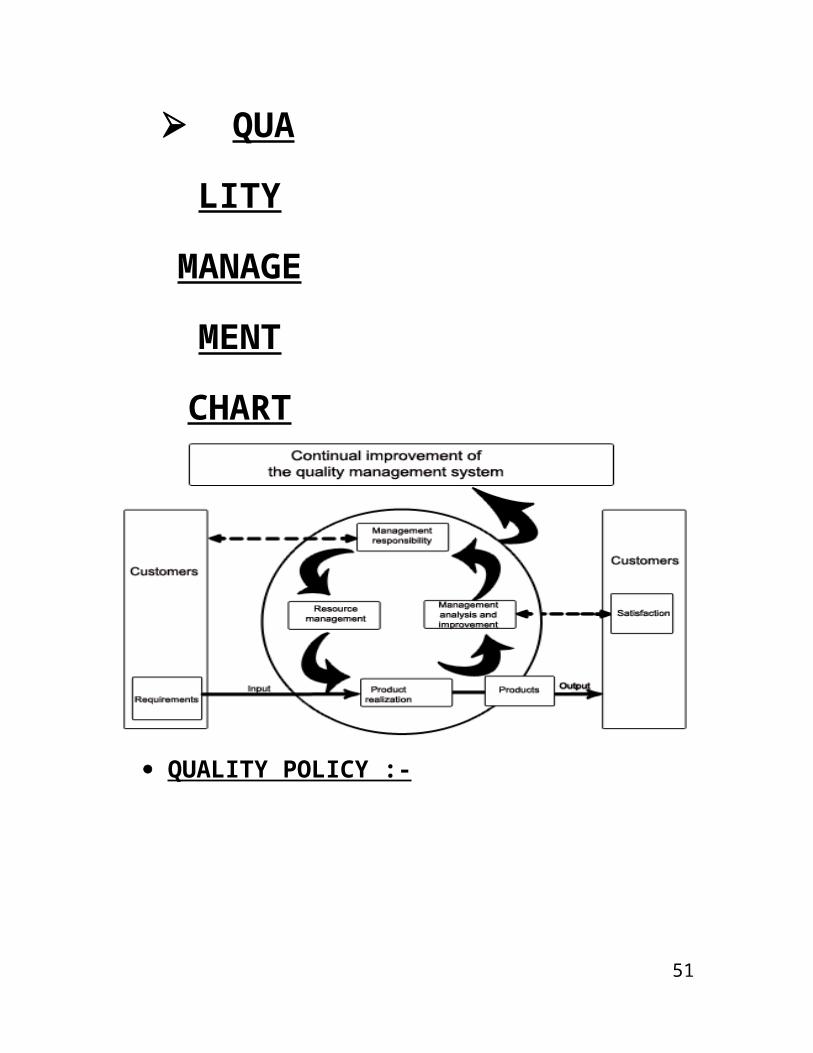
QUALITY MANAGEMENT SYSTEM

QUALITY POLICY :-
38
QU
ALITY
MANA
GEME
NT
CHAR
T

PRICING STRATEGIES OF G.S.
RADIATORS:-
Price of the G.S. Radiators Firm depends upon the cost of raw material, in
such a manner that with increase in the cost of
raw material there will be increase in the market
price of the machinery. But with a decrease in the
raw material the price of the machine will
automatically proportion.
Labor cost puts great effect on the increase and decrease of the product of
G.S. Radiators because they use to have the very
39
FUN
CTION
S OF
VARIO
US
DEPAR
TMEN
TS
PR
ICI
NG
POL
ICI
ES
&
STR

skilled labor in the factory. So that it will conclude a large portion of cost of
the production of the products.
Inflating and deflation of the market scenario influences in most of the
industries and semi industrial. They use to change their pricing strategy
according to the market scenario. So that different strategies are very helpful
to them to survive in the market well.
Along with the above the competitors are also in great influence on the
pricing strategy of the G.S. Radiators because the customer is very much
aware about the market rate of all the other industries.
GS RADIATORS HAS TWO MAIN
PRICING POLOCIES:-
PRICE ADJUSTMENT
STRATEGIES:-
Geographical Pricing:
A firm decides how to price its products to
consumer in different parts of the country. They
use to charge the different price rates from the
different customers belonging to different areas
of the country. Areas like Gujrat, Bangalore,
Gurgaon, Noida, and Ludhiana are the core area of the G.S. Radiators.
Discount Pricing and Allowances:
40
Finance
It looks after controlling of financial matter of the company and also financial matter pertaining to the purchase of major raw material.
HOD - Purchase
It is responsibilities for management of procurement activities. It ensures timely receipt of material meeting the specification. It also carries out supplier Quality Audits.
Exports
This department looks after the export of the group. It accepts the overseas orders and arranges for the dispatch of the same.
Marketing
It looks after the marketing activities and coordinates the order & schedules received from customer. It coordinates the execution of contracts as per the guidance provide by CMD.
Personnel
It is responsible for all the time of activities, legal matter, pertaining to labour courts, worker welfare and recruitments of personnel.
EDP
This department is concerned with the processing of the data electronically on computers.
PR
ICI
NG
POL
ICI
ES
&
STR
PR
ICIN
G
POLI
CIES

Discounts in the machinery tools are reduction from final selling price that
are available to different channel members and final consumer for
performing different functions.
It can be in a following ways.
1. Trade Discounts.
2. Cash Discounts
3. Quantity Discounts
4. Seasonal Discounts
5. Allowances.
Customer Segment Pricing:
In this type customer pays different prices for the same machinery tool.
Location Pricing:
Different Location are price differently even though the cost of the offering
each location is the same.
Time Pricing:
In this pricing strategy the firm used to charge a price differently in the
delivery period of the machinery to the consumer if the consumer wants its
machine most in the earlear period he has to pay high for it. In the same way
if there is a delay in the delivery of the ordered machine their may be a
chances of discounts and other cash allowances.
Odd Pricing:
41
Skimming Price Policy sets highest price to first profit from price in elastic customer then successfully lowering the price often under the increasing competition that is
called ‘Skim the cream’ This means to say that to have an high profit at the most groom period So that there will be an extra income for to compete in the competition in the near
future and to cover the risk and uncertainties.
Skimming Price Policy
The Penetration Price Policy is a policy where the firm will have low price first and try to increase their market share at the most by increasing the volume of
their product sales. They use to compete to competitors by most reasonable price.
But the G.S. Radiators are the organization where there is a less chance
of decrease in the price tag of their machinery tools.
Penetration Price Policy
The G.S. Radiators firm is a firm who is not very much aware about the odd
pricing of the products them does’ not believe in the odd pricing.
G.S. Radiators is type of firm who is not very much belonging to a singly
pricing strategy. They believe that there should be a different price strategy
for the different consumer to the different areas at the different market
scenario. To some extent they use to have a penetration price policy because
there are 300 competitors are standing in the Ludhiana only and 22 to 30 are
such type of competitors who are producing the products at their quality
product level.
So, that the manager of the firm used different price strategies in a different
period after knowing the competitors pricing. For this I have done a
comparison of same segment competitors like Sandan, Telco, Banco and
Cougar. These are the firms which are very much aware about the customer
need and satisfaction. They often use to produce their product by an advance
technology which will reduce their cost of the production and also helpful to
attract the more and more customers.
42
POLICY ADOPTED BY
G.S. RADIATORS.

G.S.
Radiators
Sandan Banco Telco M.G.P Cougar
Raw material
Quality A B B A B or C B
Value of
Money B C B A C C
Service after
Sales B C A A B B
Product Quality
A B B A C B
Grade A - Excellent
Grade B - Good
Grade C - Not Good
43
COMPARISON CHART OF
GS RADIATORS WITH
OTHER COMPANIES:-

.
ADVERTISEMENT :-
Advertisement is the mass communication of the information intended to
enforce buyers so as to maximize profits. Advertisement is a word which
means to turn the mind toward. It may be to give public notice or to
announce publicity.
To give information to prospective buyer about the machinery tool.
To create demand
To educate people in the use of products
To remove and overcome competition
To build goodwill and create brand loyalty
44
1. Advertisement policy
2. Demonstration
3. Public Realtions
MARKETING STRATEGIES
OF G.S. RADIATORS

WHY G.S. RADIATORS COMES INTO ADVERTISEMENT
MARKET?
The manager of the G.S. Radiators believes in the advertisement. In his point
of view he thinks that instead of reducing the cost of the product we should
advertise their product at the large level and will recover the cost of
advertisement by increasing the sales volume and large profit of the firm.
It creates demand by informing about the prompt availability of the special
machinery tools.
It promotes sales by marinating the present demand and expending the
market by attracting more and more customers.
It makes the goodwill by making the name of the firm and his product
famous and known in every industry field.
Helps in control the sales volume in out of the seasonal fluctuation in
demand.
It facilitates quick turn over rate by promoting highly responsive
market and thus enables the firm to keep smaller inventories which in turn
reduces May expenses and losses.
It reduces the cost of production by making large scale production through
creation of demand
It increase profit by increases sales reduction in cost of production and cost
of distribution. As the cost of per unit reduced which will increase sales in
turn to which there will be increase in the profits.
45

TYPES OF ADVERTISEMENT BY THE G.S.
RADIATORS :-
46
Yellow pages bookIt is a book in which there are several yellow pages. Yellow
pages is the sign of indication to the consumer who want to buy
the machinery tool for the further production in their
factory. It is the most popular and famous type of
advertisement in the field of industry advertisement.
Press MediaPress media of advertisement
refers to publication of advertisement in newspapers
magazines and journals. This is the most important media. A large
number of national state and local newspaper industrial and
technical journal and a wide variety of magazines are available
in which various types of advertises are frequently appear.
Magazines and JournalsMagazines and Journals are used by the firm periodically
may be monthly, quarterly, or yearly. G.S. Radiators use to advertise their products in
various types of magazine like ordinary magazines, special
magazines, industry magazines, machinery tool magazines etc.
etc.
Painted DisplayPainted Display refers pained bulletins and wall paintings. These displayed on structure blade of metal or roofs of the
building. They are usually of big size that can be easily read and see from the large distance but
this is much costlier which discourage the G.S. Radiators
firm.
TYPES OF ADVERTISEMENT

Exhibitions and Demonstrations:-
These are becoming very popular these days in our county in the field of
industry of machinery tools. There are many types of exhibitions held in the
industrial area and also in the different states related to the industry like
Gurgaon, Ludhiana, and Noida. They are organized on a large scale in the
industrial places where masses of industrial consumer can reach easily. They
can order a special type of machine as they required to the manufacturer.
PUBLIC RELATIONS
Public relations is the management of relationships and communication to
establish goodwill and mutual understanding between an organization and
its publics. Public relations is more wide ranging than marketing which
primarily focuses on markets, distribution channels and customers. By
communicating to other groups, public relations creates an environment
which it is easier to conduct marketing. Public relation activities include
publicity, corporate advertising, seminars, publications, charitable donations.
FUNCTIONS OF PUBLIC RELATIONS:-
Facilitates company's overall Reputation.
Aids Promotion.
Helps in tackling social and environmental issues.
Ensures that customers are treated well.
Develops reputation as a good supplier and customer.
47
48

49
SWOT ANALYSIS OF
G.S.RADIATORS
Strengths:Better Quality.
Competitive Staff.
Advance technology from Clasonic Lienelli Radiators
Limited U.K.
Long Life product.
Computerized System.
High production capacity.
High product range.
Better promotion activities.Weaknesses:Slightly higher prices.Communication gap.
Long hierarchy.
Opportunities:A brand image is very good
& production base is too wide, G.S.Radiators can
have some good customer with whom direct business
can be established this, G.S.Radiators will have better quality, regularity
supply.Threats:Frequent increase in prices of
raw material.Serious untimely pioneer cuts.
Government policies.Increasing transportation cost.
Increasing wages & salary limit fixed by Government.
CHAPTER NO. 5

INTRODUCTION TO THE SUBJECT
A marketing strategy is a process that can allow an organization to
concentrate its limited resources on the greatest opportunities to increase
sales and achieve a sustainable competitive advantage.
A strategic marketing plan usually evolves from an organization’s overall
corporate strategy and serves as a guide for specific marketing programs and
policies. Marketing strategy is based on a situation analysis- a detailed
assessment of the current marketing conditions facing the company, its
product lines, or its individual brands. From this situation analysis, a firm
develops an understanding of the market and the various opportunities it
offers, the competition and the market segments or target markets the
company wishes to pursue. Marketing strategy is the complete and
unbeatable plan, designed specifically for attaining the marketing
objectives of the firm/business unit. The marketing objectives
indicate what the firm wants to achieve; the marketing strategy provides
the design for achieving them.
EXAMPLE: - if the marketing objectives of a business unit stipulate that
next year, it should achieve a sales revenue of Rs. 1,000 crore and a net
profit of 15 percent of sales revenue, it is the job of marketing strategy to
50
indicate how and wherefrom this sale and profit will come, which product
lines/products/brands will accomplish this task and how.
NEED FOR THE STUDY :-
1. The study has great significance and provides benefits to various parties whom
directly or indirectly interact with the company.
2. It is beneficial to management of the company by providing crystal clear picture
regarding important aspects like liquidity, leverage, activity and profitability.
3. The study is also beneficial to employees and offers motivation by showing how
actively they are contributing for company’s growth.
4. The investors who are interested in investing in the company’s shares will also
get benefited by going through the study and can easily take a decision whether to
invest or not to invest in the company’s shares.
OBJECTIVES OF THE STUDY:-
To identify need of new innovations of the company towards sales promotion.
To know about the different strategies for sales promotion of G.S. Radiators
SCOPE OF STUDY:-
Help in Decision Making.
Help in communicating, coordination and control.
Aid in financial forecasting and comparison.
Help in finding out financial solvency and communicating values.
51

Research methodology includes the various steps in defining a problem by
making a search. The various steps used in research of a program as following:-
Determine / Define the problem
Specifying what information is needed.
Decide the technique for acquiring information
Gather & process the information
Analysis and interpret the information
Present the findings
52
RESEARCH DESIGNThe research design of
this survey has been considered as
descriptive research as the survey is directed
towards marketing strategies opted by G.S.
Radiators.
SAMPLING DESIGN
Universe for this project is G.S.
Radiator, Ludhiana.
SAMPLE SIZE
In view of the constraints,
sample size was restrained to 10.
SAMPLING UNIT
Employees of the G.S. Radiators,
Ludhiana.
RESEARCH
METHODOLOGY

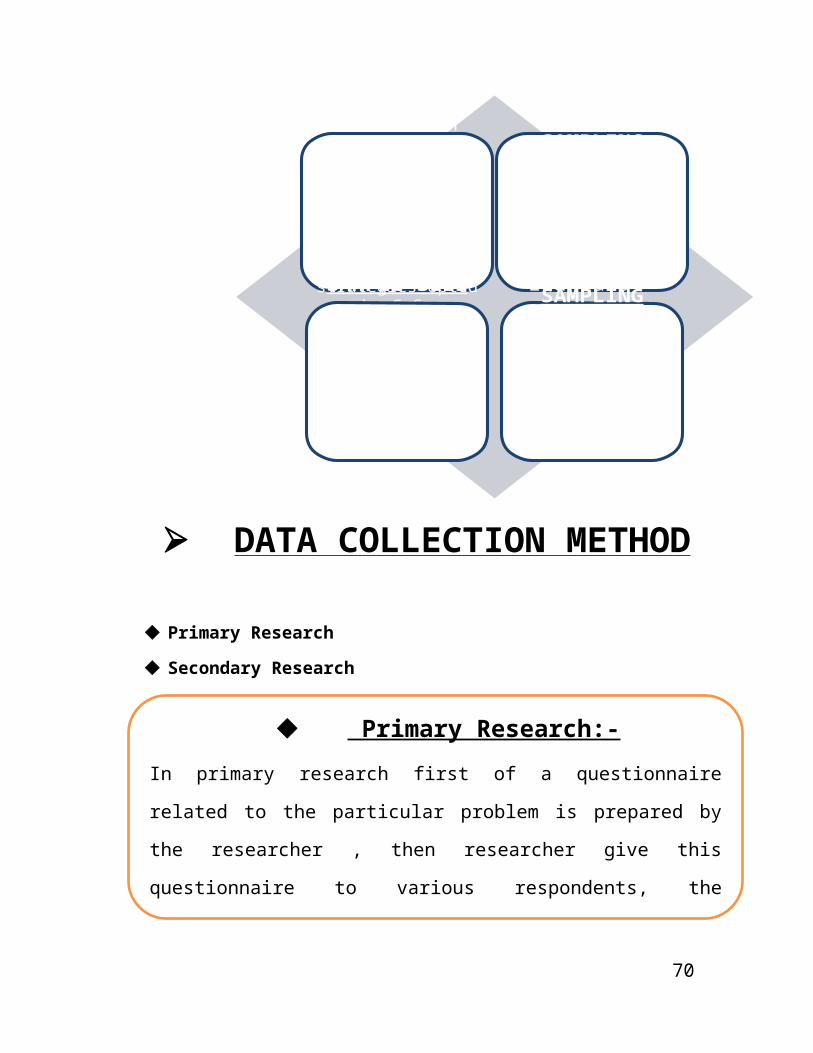
Primary Research
Secondary Research
LIMITATIONS OF THE STUDY:-
Study was confined to managerial level.
Sample selected was simple random sample restricted to 10 employees.
The study was confined only at G.S. Radiators.
The sources of information were only through questionnaire.
53
Primary Research:-
In primary research first of a questionnaire related to the particular problem
is prepared by the researcher , then researcher give this questionnaire to
various respondents, the respondent has to fill this questionnaire, the
researcher collects the data from various respondents after filling of
questionnaire, this type of research is known as primary research.
Secondary Research
There are two types of secondary research
a) Internal: in this type of research the required information & data is collected
from within the company. Required data is collected from various charts,
business reports, company service reports etc.
b) External: in this type of research the required information & data is collected
from various magazines, newspaper etc. .
DATA COLLECTION METHOD

CHAPTER NO. 6
INTRODUCTION OF RATIO ANALYSIS
PROBLEM STATEMENT:-
How to measure the financial position of the company with the help of ratio analysis?
ABOUT RATIO ANALYSIS: The ratio analysis is the most powerful tool of
financial analysis. Several ratios calculated from the accounting data can be grouped
into various classes according to financial activity or function to be evaluated. •
DEFINITION : “The indicate quotient of two mathematical expressions “and as
“The relationship between two or more things. “It evaluates the financial position
and performance of the firm.
NATURE OF RATIO ANALYSIS:-
Selection of relevant data from the financial statements depending upon the
objective of the analysis.
Calculation of appropriate ratios from the above data.
Comparison of the calculated ratios with the ratios of the same firm in the past, or
the ratios developed from projected financial statements or the ratios of some other
firms or the comparison with ratios of the industry to which the firm belongs.
54
IMPORTANCE AND LIMITATIONS OF RATIO ANALYSIS:-
55
IMPORTANCE OF RATIO
ANALYSIS Aid to measure
general efficiency
Aid to measure financial solvency
Aid in forecasting and planning
Aid in intra-firm comparison
Evaluation of efficiency &
Effective tool
LIMITATIONS OF RATIO ANALYSIS
Limitations of
accounting records
Lack of proper standards
No allowances for price level changes
Quantitative factors are ignored
Limited use & Personal bias

CLASSIFICATIONS OF RATIOS
The use of ratio analysis is not confined to financial manager only. There are different parties
interested in the ratio analysis for knowing the financial position of a firm for different purposes.
Various accounting ratios can be classified as follows:
1.
Traditional Classification:- Balance sheet (or) position statement ratio.
Profit & loss account (or) revenue statement ratios.
Composite (or) inter statement ratios.
1. Functional Classification These include liquidity ratios, long term solvency and leverage ratios, activity ratios and
profitability ratios.
2. Significance Ratios: Some ratios are important than others and the firm may classify them as primary and
secondary ratios. The primary ratio is one, which is of the prime importance to a concern.
The other ratios that support the primary ratio are called secondary ratios
56
CLAS
SIFI
CATI
ON
1. Traditional Classification
2. Functional Classification
3. Significance ratios

IN THE VIEW OF FUNCTIONAL CLASSIFICATION THE RATIOS ANALYSES ARE:
57
Current ratioQuick (or) Acid-test (or) Liquid ratioAbsolute liquid ratio (or) Cash position ratio
LIQUIDITY RATIOS
PROPRIETORY RATIOLEVERAGE
RATIO
Working capital turnover ratioFixed assets turnover ratioCapital turnover ratio Current assets to fixed assets ratio
ACTIVITY RATIO
Net profit ratioReturn on total assets Earnings per shareOperating profit ratioPrice – earnings ratio
PROFITABILITY RATIO

DATA ANALYSIS AND INTERPRETATION
FINANCIAL ANALYSIS OF GS RADIATORS
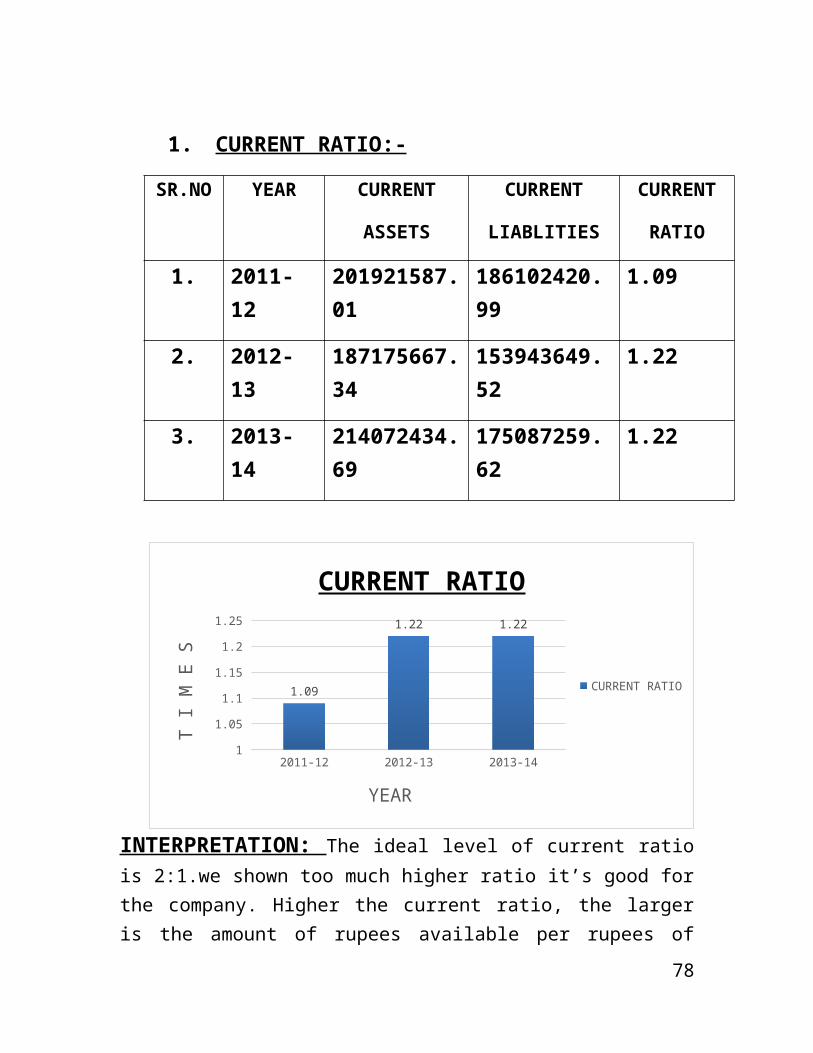
1. CURRENT RATIO:-
SR.NO YEAR CURRENT
ASSETS
CURRENT
LIABLITIES
CURRENT
RATIO
1. 2011-12 201921587.01 186102420.99 1.09
2. 2012-13 187175667.34 153943649.52 1.22
3. 2013-14 214072434.69 175087259.62 1.22
INTERPRETATION: The ideal level of current ratio is 2:1.we shown too much higher ratio it’s good for the company. Higher the current ratio, the larger is the amount of rupees available per rupees of current liabilities. The
58
2011-12 2012-13 2013-14
CURRENT RATIO 1.09 1.22 1.22
1.025
1.075
1.125
1.175
1.225
1.09
1.22 1.22
CURRENT RATIO
CURRENT RATIO
YEAR
T I M
E S

more is the firm’s ability to meet current obligation and greater is safety of fund of short term creditors.
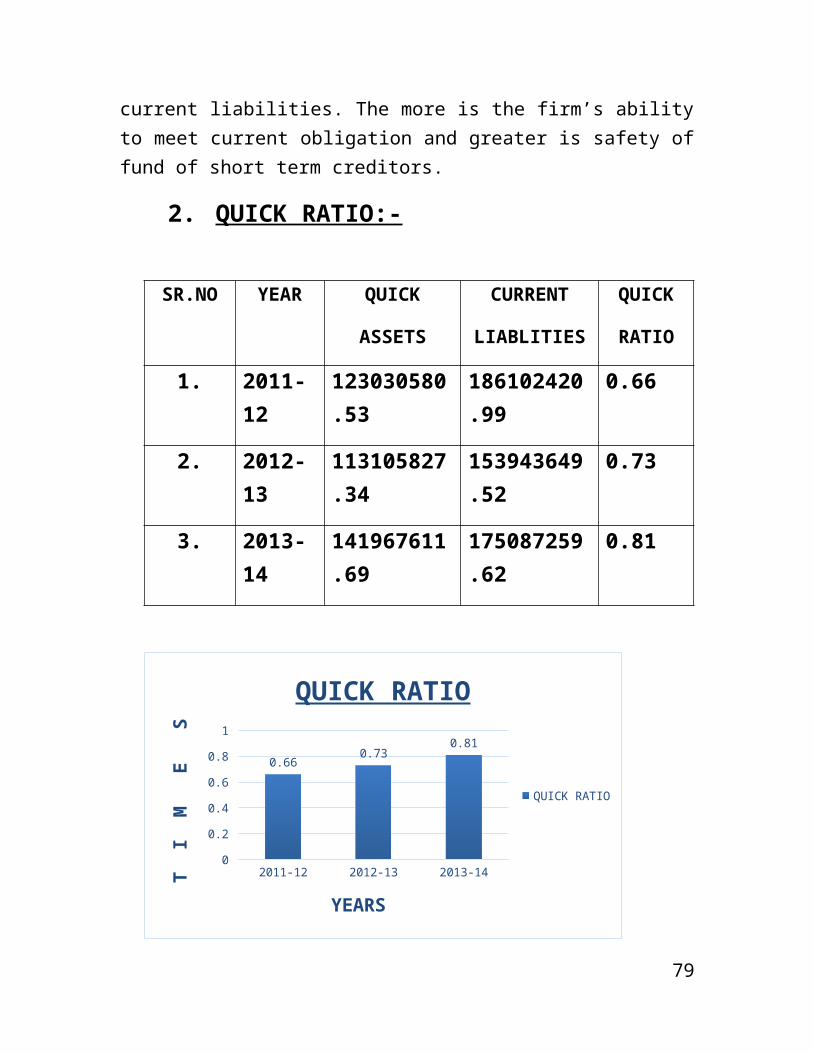
2. QUICK RATIO:-
SR.NO YEAR QUICK
ASSETS
CURRENT
LIABLITIES
QUICK
RATIO
1. 2011-12 123030580.53 186102420.99 0.66
2. 2012-13 113105827.34 153943649.52 0.73
3. 2013-14 141967611.69 175087259.62 0.81
2011-12 2012-13 2013-14
QUICK RATIO 0.66 0.73 0.81
0.05
0.15
0.25
0.35
0.45
0.55
0.65
0.75
0.85
0.660.73
0.81
QUICK RATIO
QUICK RATIO
YEARS
T I
M E
S
INTERPRETATION: A quick ratio is an Indication that the firm is liquid and the ability to meet its current liabilities in time. The Ideal quick ration is 1:1, Company Quick ratio is less than the ideal ratio. So, The Quick ratio is increased because the sundry debtors are increased due to the increase in the corporate tax and for that the provision created is also
59

increased. So, the ratio is also increased from 2011 and the ration is less than ideal ration from 2011 to 2014. This shows Company has not strong liquidity position.
3. ABSOLUTE LIQUID RATIO
SR.NO YEAR CASH & BANK
BALANCE
CURRENT
LIABLITIES
CASH
RATIO
1. 2011-12 27093502.41 186102420.99 0.15
2. 2012-13 24483513.43 153943649.52 0.16
3. 2013-14 33049995.43 175087259.62 0.19
2011-12 2012-13 2013-14
ABSOLUTE LIQUID RATIO 0.15 0.16 0.19
0.010.030.050.070.090.110.130.150.170.19
0.150.16
0.19
ABSOLUTE LIQUID RATIO
ABSOLUTE LIQUID RATIO
YEARS
T I M
E S
INTERPRETATION: According to the rule of thumb the absolute liquid assets is 0.5/1. But when we calculate the figure is less 0.15 in 2012, 0.16 in 2013 and 0.15 in 2014 that means the company was able to satisfy its primary cash requirement with cash generation by operation.
60

Because of in both years the company Liquidity ratio is extremely increasing in each year for that company has sufficient Assets to meet the requirement of its liabilities.
4. INVENTORY TURNOVER RATIO
SR.NO YEAR COST OF GOOD SOLD
AVERAGE INVENTORY
INVENTORY TURNOVER
RATIO
1. 2011-12
271567212.70 88426236.00 3.07
2. 2012-13
279655789.56 7680423.24 3.66
3. 2013-14
391968603.45 73087331.50 5.36
INTERPRETATION: Inventories are a major part of current assets. If any company wants to manage its working capital efficiency, it has to manage its inventories efficiently. The Table
61
2011-12 2012-13 2013-14
INVENTRY TURNOVER RATIO 3.07 3.66 5.36
0.5
1.5
2.5
3.5
4.5
5.5
3.073.66
5.36
INVENTRY TURNOVER RATIO
INVENTRY TURNOVER RATIO
YEARS
TIM
ES

shows that inventory ratio is increasing which shows the good
financial position & reputation of the company.
5. DEBTOR TURNOVER RATIO:-
SR.NO YEAR SALES AVERAGE DEBTORS
D.T RATIO
1. 2011-12 346343670.90 86381915.96
4.01
2. 2012-13 333379729.35 89779696.02
3.71
3. 2013-14 495871905.82 98769965.08
5.02
2011-12 2012-13 2013-14
DEBTOR TURNOVER RATIO 4.01 3.71 5.02
0.5
1.5
2.5
3.5
4.5
5.5
4.013.71
5.02
DEBTOR TURNOVER RATIO
DEBTOR TURNOVER RATIO
YEARS
TIM
ES
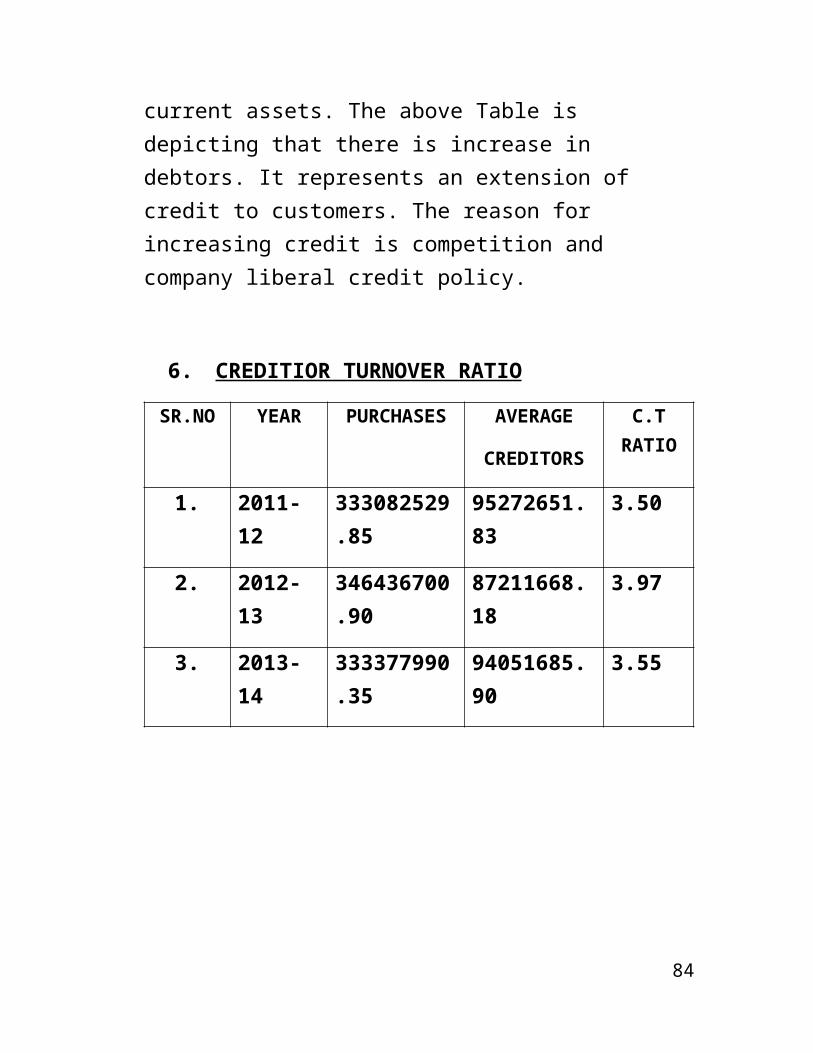
INTERPRETATION: Debtors constitute a substantial portion of total current assets. In India it constitute one third of current
62

assets. The above Table is depicting that there is increase in debtors. It represents an extension of credit to customers. The reason for increasing credit is competition and company liberal credit policy.
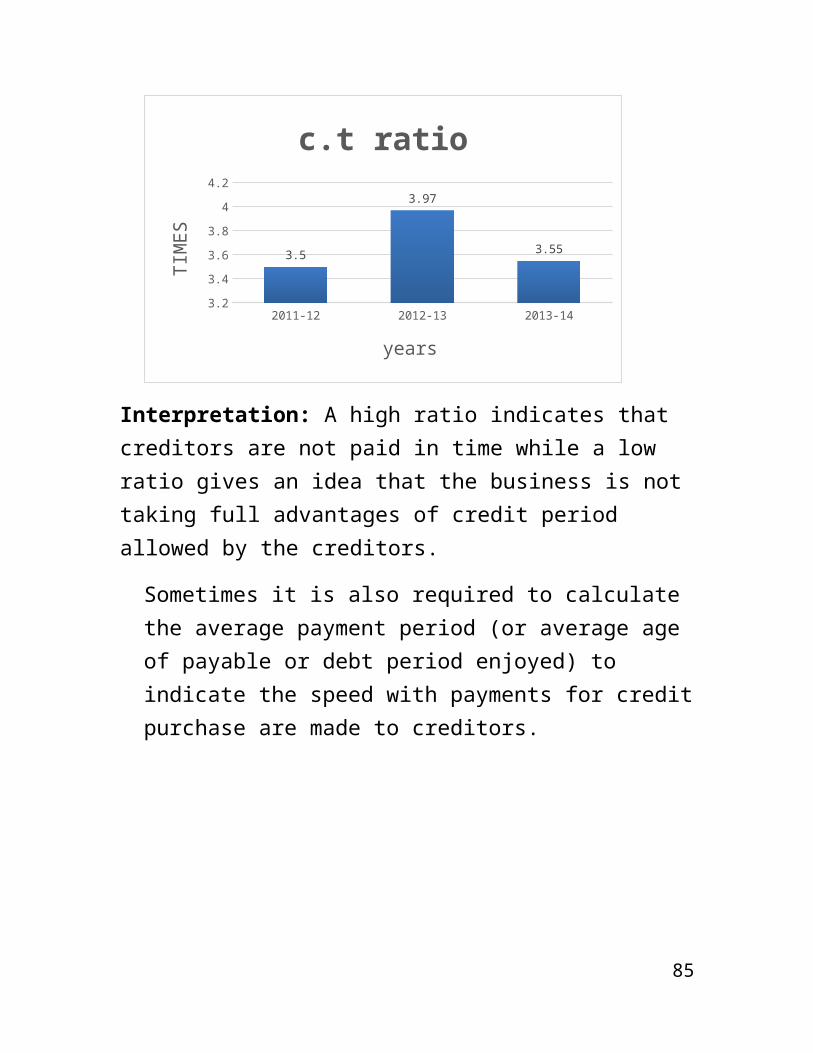
6. CREDITIOR TURNOVER RATIO
SR.NO YEAR PURCHASES AVERAGE
CREDITORS
C.T RATIO
1. 2011-12 333082529.85
95272651.83 3.50
2. 2012-13 346436700.90
87211668.18 3.97
3. 2013-14 333377990.35
94051685.90 3.55
2011-12 2012-13 2013-14
c.t ratio 3.5 3.97 3.55
3.25
3.35
3.45
3.55
3.65
3.75
3.85
3.95
4.05
3.5
3.97
3.55
c.t ratio
years
TIM
ES
63
Interpretation: A high ratio indicates that creditors are not paid in time while a low ratio gives an idea that the business is not taking full advantages of credit period allowed by the creditors.
Sometimes it is also required to calculate the average payment period (or average age of payable or debt period enjoyed) to indicate the speed with payments for credit purchase are made to creditors.
64

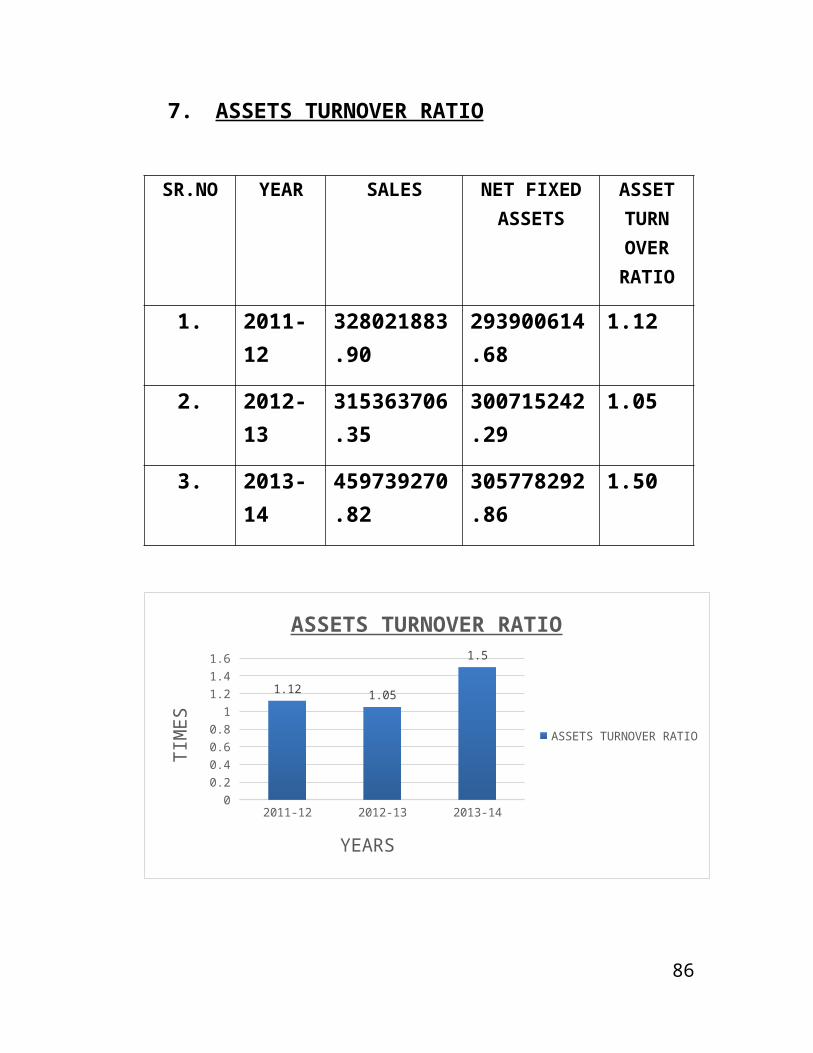
7. ASSETS TURNOVER RATIO
SR.NO YEAR SALES NET FIXED ASSETS
ASSET TURN OVER RATIO
1. 2011-12 328021883.90 293900614.68 1.12
2. 2012-13 315363706.35 300715242.29 1.05
3. 2013-14 459739270.82 305778292.86 1.50
2011-12 2012-13 2013-14
ASSETS TURNOVER RATIO 1.12 1.05 1.5
0.1
0.3
0.5
0.7
0.9
1.1
1.3
1.5
1.121.05
1.5
ASSETS TURNOVER RATIO
ASSETS TURNOVER RATIO
YEARS
TIM
ES
INTERPRETATION: Higher is the ratio the better is the performance it indicates that fixed assets are being efficiently utilized. An improvement in the ratio indicates better performance and decline in it would show a declining efficiency or improvident investment. Increase in Fixed Assets Turnover Ratio indicates that fixed assets have been used as efficiently as they had been used in previous years.
65

8. NET PROFIT RATIO
SR.NO YEAR PROFIT AFTER
TAX
SALES NET PROFIT MARGIN (%)
1. 2011-12 5069952.82
328021883.90 1.55
2. 2012-13 5399458.96
315363706.35 1.71
3. 2013-14 8121536.16
459739270.82 1.77
2011-12 2012-13 2013-14
NET PROFIT RATIO 1.55 1.71 1.77
1.425
1.475
1.525
1.575
1.625
1.675
1.725
1.775
1.55
1.71
1.77
NET PROFIT RATIO
NET PROFIT RATIO
YEARS
PERC
ENTA
GE
INTERPRETATION: The net profit ratio is the overall measure of the firm’s ability to turn each rupee of income from services in net profit. If the net margin is inadequate the firm will fail to achieve return on shareholder’s funds. High net profit ratio will help the firm service in the fall of income from
66

services, rise in cost of production or declining demand. And G.S Radiators Ltd profit margin increase every year because of its inventory turnover ratio but it is not enough.
9. OPERATING PROFIT RATIO
SR.NO YEAR OPREATING PROFIT
SALES OPERATING PROFIT
MARGIN (%)
1. 2011-12 3769295.11 328021883.90 1.15
2. 2012-13 4211845.51 315363706.35 1.33
3. 2013-14 7014475.23 459739270.82 1.53
2011-12 2012-13 2013-14
OPERATING PROFIT RATIO 1.15 1.33 1.53
0.1
0.3
0.5
0.7
0.9
1.1
1.3
1.5
1.7
1.15
1.33
1.53
OPERATING PROFIT RATIO
OPERATING PROFIT RATIO
YEARS
PER
CEN
TAG
E
INTERPRETATION: This ratio shows that effectiveness of a company's management by comparing operating expense to net sales. In compare the operating ratio is increasing in 2014 that means increase in operating cost that increase total productivity.
67

This means that the company has able to generate more margin as it expense in operating sector. Using this ratio the investors interested in investing more in money in the company.
10. DEBT EQUITY RATIO:-
SR.NO YEAR TOTAL DEBT NET WORTH D.E RATIO
1. 2011-12 213277910.53 106592246.86 2.00
2. 2012-13 205900282.36 102992044.93 2.00
3. 2013-14 243182150.00 107786896.24 2.26
2011-12 2012-13 2013-14
DEBT EQUITY RATIO 2 2 2.26
1.875
1.925
1.975
2.025
2.075
2.125
2.175
2.225
2.275
2 2
2.26
DEBT EQUITY RATIO
DEBT EQUITY RATIO
YEARS
TIM
ES
INTERPRETATION: The Company focus on this ratio to improve its market position but overall the company leverage is good. But a lower D/E ratio, the lenders enjoy a better margin of safety. The calculate figure is 0.19 in 2014 which means that the
68

company has been constructive in the growth of their financial control in Previous Years.
11. INTEREST COVERAGE RATIO
SR.NO YEAR EBIT INTEREST I.C RATIO
1. 2011-12 23160083.52 18090130.70
1.28
2. 2012-13 24247360.04 18847901.08
1.29
3. 2013-14 24378339.00 16256802.80
1.50
2011-12 2012-13 2013-14
INTEREST COVERAGE RATIO 1.28 1.29 1.5
1.175
1.225
1.275
1.325
1.375
1.425
1.475
1.525
1.28 1.29
1.5
INTEREST COVERAGE RATIO
INTEREST COVERAGE RATIO
YEARS
TIM
ES
69
INTERPRETATION: Interest coverage ratio is 1.28 in the year 2011. But it is increased automatically to 1.50 in year 2014. And it is increasing from last three years. In this positon outside investors is interested to invest the money in this company.
12. EQUITY RATIO
SR.NO YEAR SAHRES HOLDERS
FUNDS
TOTAL ASSETS
EQUITY RATIO
1. 2011-12 106592246.86 306282157.39 0.35
2. 2012-13 102992044.93 295148327.19 0.35
3. 2013-14 107786896.24 316408258.54 0.34
2011-12 2012-13 2013-14
EQUITY RATIO 0.35 0.35 0.34
0.335
0.337
0.339
0.341
0.343
0.345
0.347
0.349
0.351 0.35 0.35
0.34
EQUITY RATIO
EQUITY RATIO
YEARS
TIM
ES
70

INTERPRETATION: This ratio ensures whether the capital employed has been effectively used or not. This is also test of marginal efficiency and business performance. Higher total equity turnover ratio is always required in the interest of company.
13. RETURN ON EQUITY RATIO
SR.NO YEAR EBIT CAPITAL EMPLOYED
R.O.I RATIO
1. 2011-12 3369952.82 32292500 10.44
2. 2012-13 3899458.96 32292500 12.08
3. 2013-14 5821536.16 32292500 18.02
2011-12 2012-13 2013-14
RETURN ON EQUITY FUNDS
10.44 12.08 18.02
13579
1113151719
10.4412.08
18.02
RETURN ON EQUITY FUNDS
RETURN ON EQUITY FUNDS
YEARS
PERC
ENTA
GE
71
INTERPRETATION: This ratio indicates what percentage of profits earned are enjoyed by equity shareholders. Return on Equity Share Capital or earnings per share helps to determine the market price of equity shares of the Company while comparing with the ratios of other companies. It will indicate whether the capital is effectively used or not. It is effectively used by G.S. Radiators Ltd.
14. RETURN ON INVESTMENT RATIO
SR.NO YEAR NET PROFIT
SHARES HOLDERS
FUNDS
R.O.E. RATIO
1. 2011-12 3369952.82
106592246.86 0.03
2. 2012-13 3899458.96
102992044.93 0.04
3. 2013-14 5821536.16
107786896.24 0.05
72

2011-12 2012-13 2013-14
RETURN ON INVESTMENT RATIO
0.03 0.04 0.05
0.0050.0150.0250.0350.0450.055
0.030.04
0.05
RETURN ON INVESTMENT RATIO
RETURN ON INVESTMENT RATIO
YEARS
TIM
ES
INTERPRETATION: Return on investment is very low in all the past three years from 2011 to 2014 and hardly reached at 0.05 but in year 2014 due to less earnings. This doesn’t shows the sound position of the company.
15. RETURN ON ASSETS
SR.NO YEAR NET PROFIT
AVERAGE TOTAL ASSETS
R.O.A. RATIO
1. 2011-12 3369952.82
316251108.64 1.07
2. 2012-13 3899458.96
300715242.20 1.30
3. 2013-14 5821536.1 305778292.86 1.90
73

6
2011-12 2012-13 2013-14
RETURN ON ASSETS 1.07 1.3 1.9
0.1
0.3
0.5
0.7
0.9
1.1
1.3
1.5
1.7
1.9
1.07
1.3
1.9
RETURN ON ASSETS
RETURN ON ASSETS
YEARS
TIM
ES
INTERPRETATION: The Return on assets shows as to how
much is the profit earned by the firm.
CONCLUSION OF DATA ANALYSIS AND
INTERPRETATION
Total value will be calculated for all the values on the LIKERT SCALE and T
Testwill be applied to check the relation between various dimensions of retention.
The data is processed and analyzed by tabulation interpretation so that the findings
can be communicated and can be easily understood. The findings are presented in
the best possible way. Tables and graphs will be used for illustration of principal
findings of the research.
74

FINDING AND ANALYSIS:-
1. What market segments are you targeting?
Interpretation:
The major target market of G.S. Radiator’s is OEM, Replacement and
Export market. All the respondents replied that their company deals in OEM,
replacement market and export market.
75
CHAPTER NO. 7

2. Rank the following from 1- 6 on the basis of how you have positioned your brand/products, where 1 is more important.
Parameters 1 2 3 4 5 6 Total
Score
Mean
Score
Rank
Price 1 7 2 0 0 0 49 2.33 2
Quality 9 0 1 0 0 0 58 2.76 1
Level of Customer
Service
0 3 6 1 0 0 42 2.00 3
Consistency 0 0 1 6 2 1 27 1.28 4
Credibility 0 0 1 2 3 4 20 0.95 5
Novelty 0 0 0 1 4 5 16 0.76 6
Pric
e
Qualit
y
Level
of C
usto
mer
Ser
vice
Consis
tenc
y
Credi
bilit
y
Novel
ty0
0.5
1
1.5
2
2.5
3
2.33
2.76
2
1.28 0.950000000000001 0.76000000000000
3
Interpretation:
G.S. Radiators company’s products having good quality is having highest
mean score i.e. 2.76 among the respondents. On the other hand the mean
score of the factor, Novelty of G.S. Radiator’s product is very low which
76

0.76 is because their company does not provide any novelty to their
customers.
3. Which out of the following products do you deal in?
Responses Percent of CasesN Percent
Connector Pipes 10 9.1% 100.0%Brass tank & headers 10 9.1% 100.0%Brass bushes 10 9.1% 100.0%Plastic tanks 0 0.0% 0.0%Rubber gaskets 10 9.1% 100.0%Heaters 10 9.1% 100.0%Concentric and plate type oil coolers 10 9.1% 100.0%Drain cock & plugs 10 9.1% 100.0%Radiators 10 9.1% 100.0%Radikool coolants 10 9.1% 100.0%Pressure caps 10 9.1% 100.0%Filler Caps 10 9.1% 100.0%
Total 110 100.0% 1100.0%
77
Interpretation: From the bar diagram it is revealed that G.S. Radiators
deals with products, but no one respondents response in the favour of plastic
tanks. They said that their company does not deal in plastic tanks.
78
4. How do you determine the price?
Determine the Price
Frequency Percent
Valid
Percent
Cumulative
Percent
Cost plus pricing 10 100.0 100.0 100.0
Value base pricing 0 0.0 0.0 0.0
Rate of return pricing 0 0.0 0.0 0.0
Psychological pricing 0 0.0 0.0 0.0
Competitor indexing 0 0.0 0.0 0.0
Total 10 100.0 100.0 100.0
Cost p
lus pr
icing
Value b
ase pr
icing
Rate of
retur
n pric
ing
Psyc
holog
ical p
ricing
Compe
titor
index
ing
0
20
40
60
80
100
120
100
0 0 0 0
Interpretation :
From the bar diagram it is revealed that all the respondents respond that cost
plus pricing method used by their company to determine the price. On other
hand no one respondent response in the favour of other options.
79

5. What is the distribution channel used for distribution of your products?
Distribution channel
Frequency Percent
Valid
Percent
Cumulative
Percent
Dealers/ distributors 10 100.0 100.0 100.0
Retailers 0 0.0 0.0 0.0
Wholesalers 0 0.0 0.0 0.0
Agents 0 0.0 0.0 0.0
Own stores 0 0.0 0.0 0.0
Total 10 100.0 100.0 100.0
Dealers/ distribu-tors
Retailers Wholesalers Agents Own stores 0
20
40
60
80
100
120
100
0 0 0 0
Interpretation: The above chart clearly shown that
dealers/distributors are main distribution channel of G.S. Radiators
according to their employees and whereas company have not own stores.
80

6. What is the percentage that is spent on advertising per
annum?
Percentage spent on advertising
Frequency Percent Valid Percent
Cumulative
Percent
< 10% 10 100.0 0.0 100.0
10 – 20% 0 0.0 0.0 0.0
20 – 30% 0 0.0 0.0 0.0
30 – 40% 0 0.0 0.0 0.0
40 – 50% 0 0.0 0.0 0.0
> 50% 0 0.0 0.0 0.0
Total 10 100.0 100.0 100.0
< 10% 10 – 20% 20 – 30% 30 – 40% 40 – 50% > 50%0
20
40
60
80
100
120
100
0 0 0 0 0
Interpretation: According to the respondents their company spent less
than 10% on advertising per annum. Whereas no one respondents choose
another options.
81

8. Rank the following from 1- 6 on the basis of how you spend on Research and Development.
Parameters 1 2 3 4 5 6 Total
Score
Mean
Score
Rank
New Equipment 0 7 1 0 1 1 42 2.00 2
New Process 0 0 7 1 0 2 33 1.57 3
Value Engineering 8 0 1 1 0 0 55 2.61 1
Training 0 0 1 8 1 0 30 1.42 4
Skill Level 1 1 0 0 7 1 26 1.23 5
Process Integration 1 2 0 0 1 6 24 1.14 6
New Equipment New Process Value Engineering Training Skill Level Process Integration0
0.5
1
1.5
2
2.5
3
2
1.57
2.61
1.421.23 1.13999999999999
Interpretation:
From the above table it can interpret that company spends on value
engineering in research and development category i.e. respondents rated first
rank to value engineering, and least rank to process integration.
82

9. Rank the following from 1-8 on the basis of how you tap the OEM market (OEM Strategy)
Parameters 1 2 3 4 5 6 7 8 Total
Score
Mean
Score
Rank
Product
Development
0 7 0 2 0 0 1 0 61 1.69 2
R & D 7 1 1 0 1 0 0 0 73 2.02 1
Price 0 0 0 7 1 2 0 0 45 1.25 4
Lead Time 0 0 1 0 8 0 0 1 39 1.08 5
Quality 1 0 7 1 0 1 0 0 58 1.61 3
Testing 0 0 1 0 1 7 1 0 33 0.91 6
Evaluation 1 1 0 0 0 0 2 6 25 0.69 8
Customer
feedback
1 1 0 0 0 0 6 2 29 0.80 7
Product Develop-
ment
R & D Price Lead Time Quality Testing Evaluation Customer feedback
0
0.5
1
1.5
2
2.5
1.69
2.02
1.251.08
1.61
0.91 0.690000000000001
0.8
Interpretation:
From the above table according to Weighted Average Method we can
interpret that most of the respondents given 1st rank to R & D that their
company tap OEM market, 2nd rank to product development, 3rd rank to
quality and least rank to evaluation.
83
The organizational study enables me to gather knowledge regarding the
working of an organization. The study has brought light to know the
organization as a whole. Different products and efficiency in working for
attaining of a common goal.
I have been able to understand the activities and strategies of G.S.
Radiators their way of working and their way of approaching the customers
and the importance of Advertising, i.e. how beneficial is the advertising for
any firm to communicate about their offers and events to the consumers. The
results of the survey proved to be encouraging.
The respondents were very positive in providing the information about
how GS. Radiators has to go for promotion and why do they go for G.S.
Radiators and what measures G.S. Radiators has to take in improving the
service to their customers, Though there are many competitors in the market
for this segment,
The company G.S. Radiators is doing well by satisfying its customers by
having good relationship with them and. I offer my best wishes for the
same and hope that my work will be of some use for the company
effectiveness.
84
CONCLUSION
GS Radiators should also come up with aluminum based radiators. As
the market share for these is increasing, it is better to be equipped with
both the segments.
A market survey should be conducted every quarter.
Local mechanics should be given some kind of incentive or benefit, so
as to bring in more business.
They can increase the dealer network so that it helps to increase the
market share.
They can also offer some sort of discount to the dealer.
The firm should have a special type of workers who are always
prepared for the service to the customer after sales because there is a
chance of breakdown of machinery and better service will always
makes and better satisfaction.
The percentage spent on advertising per annum should increase from
the present percentage. Advertisements could be given via radio,
television, newspaper or by way of hoardings.
85
SUGGESTIONS
Kotler Philip and Keller Kevin Lane Marketing Management; Pearson
Education Pte. Ltd. Delhi 110092, 2006.
Kotler, Philip, and Garry Armstrong (1996), Principles of Marketing
(New Delhi: Pretice Hall Of India).
Kotler, Philip, Marketing Management: Analysis, Planning,
Implementation and Control, Prentice Hall of India, New Delhi.
Mamoria C.B. Marketing Management,(2000) Kitab MahalAgencies,
Ashok Rajpath, Patna-80004.
Marketing concepts & strategies William M.Pride and O.C. Ferreell
published by Biztantra New Delhi year2006.
Schiffman, L.G., and Kanuk, L.L., Consumer Behaviour, Prentice
Hall of India, New Delhi, 2000.
WEBSITE:-
86
BIBLIOGRAPHY
CHAPTER NO. 8
WWW.GSRADISINDIA.COM
QUESTIONAIRE
STUDY OF MARKETING STRATEGIES AND RATIO ANALYSIS OF GS RADIATORS
Name :___________________ Designation:___________________
3. General Company Information
Company Name:
Registered Address:
Telephone No. :
General e –mail Address:
Website:
Date of Incorporation (dd/mm/yyyy) :
Date of Commencement (dd/mm/yyyy):
Proprietor:
Brief description of the main product:
2. On what basis have you segmented the markets?
(a) Geographic (Region, City, Rural, Urban or Semi Urban areas)
(b) Demographic (Age, Income, Occupation, Socio – economic classification)
(c) Psychological Segmentation (Psychological/Personality traits, lifestyle or values)
(d) Behavioral Segmentation (Occasions, Benefit, User status, Usage rate,
Loyalty status, Attitude towards products.)
3. What market segments are you targeting?
(a) OEM (b) STU (c) IRL (d) DEF (e) Replacement market (f) Export market
87

4. Rank the following from 1- 6 on the basis of how you have positioned
your brand/products, where 1 is more important.
(a) Price (b) Quality (c) Level of Customer Service (d) Consistency (e) Credibility (f) Novelty
5. Which out of the following products do you deal in?
(a) Connector Pipes (b) Brass tank & headers (c) Brass bushes (d) Plastic tanks (e) Rubber gaskets (f) Heaters (g) Concentric (h) Drain cock & plugs (i) Radiators (j) Radikool coolants (k) Pressure caps (l) Filler Caps
6. How do you determine the price?
(a)Cost plus pricing (b) Value base pricing
(c) Rate of return pricing (d) Psychological pricing
(e) Competitor indexing
7. What is the distribution channel used for distribution of your products?
(a) Dealers/ distributors (b) Retailers
(c) Wholesalers (d) Agents
(e) Own stores
8. Which out of the following is the preferred source for promotion?
(a) Advertising (b) Sales promotion
(c) Events and experiences (d) Public relations and publicity
(e) Personal selling (f) direct marketing
88

(g) Exhibitions and Trade fairs
9. What is the percentage that is spent on advertising per annum?
(a) < 10% (b) 10 – 20%
(c) 20 – 30% (d) 30 – 40%
(e) 40 – 50% (f) > 50%
10. Rank the following from 1- 6 on the basis of how you spend on Research and
Development
(a) New Equipment (b) New Process (c) Value Engineering (d) Training (e) Skill Level (f) Process Integration
11. Rank the following from 1-8 on the basis of how you tap the OEM market (OEM
Strategy)
(a) Product Development (b) R & D (c) Price (d) Lead Time (e) Quality (f) Testing (g) Evaluation (h) Customer feedback
89