summit county manufacturing workforce...
TRANSCRIPT

Summit County Manufacturing Workforce Brief
Sylvio Mecone
Team Northeast Ohio

Overview
1. Historical Manufacturing Employment
2. Age Cohort Employment Distribution in Manufacturing
3. Who might we need to as replacements: Occupations
4. A look at Maintenance Mechanics
5. Education
6. Talent Gap vs Interest Gap

2000
2500
3000
3500
4000
4500
5000
5500
6000
6500
20
30
40
50
60
70
80
90
GD
P (
$ M
illio
ns)
MF
G E
mp
loym
ent (T
hs.)
MFG Employment & GDP: Akron MSA 1978-2014
Employment GDP
Source: Moody’s Economy.com

0
5
10
15
20
25
30
35
Emp
loym
ent
(Th
ou
san
ds)
Akron MSA Manufacturing Employment by Sub-Industry
Food Textiles Chemicals Metals Electronics Furniture
Source: Moody’s Economy.com

0.5%
6.3%
16.5%
21.6%
29.7%
21.4%
4.0%
0.0%
5.0%
10.0%
15.0%
20.0%
25.0%
30.0%
35.0%
14 - 18 19 - 24 25 - 34 35 - 44 45 - 54 55 - 64 65+
Employment Age Distribution, MFG vs ALL, Akron MSA
Manufacturing All Industries
Source: EMSI 2014.4

0.0%
5.0%
10.0%
15.0%
20.0%
25.0%
30.0%
35.0%
14 - 18 19 - 24 25 - 34 35 - 44 45 - 54 55 - 64 65+
Employment Age Distribution, Akron MSA
Manufacturing Health Care and Social Assistance
Source: EMSI 2014.4

14-18 19-24 25-34 35-44 45-54 55-64 65+
Summit 0.5% 5.8% 16.1% 21.5% 29.9% 22.0% 4.2%
NEO 18 0.5% 6.4% 16.1% 21.5% 29.7% 22.0% 3.8%
Ohio 0.6% 6.4% 16.8% 22.3% 29.7% 21.0% 3.2%
U.S. 0.6% 6.6% 18.4% 23.2% 28.8% 18.7% 3.7%
0.0%
5.0%
10.0%
15.0%
20.0%
25.0%
30.0%
35.0%
Manufacturing Employment by Age 2014 – Summit vs Region, Ohio, Nation
Retiring in next 20 years?
Retiring in next 10 years?
Source: EMSI 2014.4

14-18 19-24 25-34 35-44 45-54 55-64 65+
Summit 0.5% 5.8% 16.1% 21.5% 29.9% 22.0% 4.2%
Cuyahoga 0.4% 5.3% 14.9% 20.6% 30.5% 23.9% 4.4%
Lorain 0.3% 6.1% 14.4% 21.9% 29.9% 23.6% 3.7%
Stark 0.5% 8.2% 17.2% 21.1% 29.0% 21.0% 3.0%
0.0%
5.0%
10.0%
15.0%
20.0%
25.0%
30.0%
35.0%
County Comparison: Manufacturing Employment by Age
Source: EMSI 2014.4

Occupation Age 45 +
Tool and Die Makers 72.5%
Patternmakers, Metal and Plastic 67.1%
Lathe and Turning Machine Tool Setters, Operators, and Tenders, Metal and Plastic 62.6%
Tool Grinders, Filers, and Sharpeners 61.4%
Stationary Engineers and Boiler Operators 61.0%
Millwrights 60.6%
Machinists 60.5%
Industrial Machinery Mechanics 60.4%
Maintenance Workers, Machinery 60.1%
Electromechanical Equipment Assemblers 59.4%
Inspectors, Testers, Sorters, Samplers, and Weighers 58.1%
Heat Treating Equipment Setters, Operators, and Tenders, Metal and Plastic 57.4%
Electrical and Electronic Equipment Assemblers 57.3%
Dental Laboratory Technicians 56.8%
Drilling and Boring Machine Tool Setters, Operators, and Tenders, Metal and Plastic 56.3%
Grinding, Lapping, Polishing, and Buffing Machine Tool Setters, Operators, and Tenders, Metal and Plastic 55.8%
Engine and Other Machine Assemblers 55.1%
Chemical Plant and System Operators 55.1%
Chemical Equipment Operators and Tenders 54.8%
Multiple Machine Tool Setters, Operators, and Tenders, Metal and Plastic 53.8%
Petroleum Pump System Operators, Refinery Operators, and Gaugers 53.8%
Rolling Machine Setters, Operators, and Tenders, Metal and Plastic 53.4%
Molding, Coremaking, and Casting Machine Setters, Operators, and Tenders, Metal and Plastic 53.2%
Cutting, Punching, and Press Machine Setters, Operators, and Tenders, Metal and Plastic 53.1%
Electrical and Electronics Repairers, Commercial and Industrial Equipment 52.0%
Structural Metal Fabricators and Fitters 51.6%
Milling and Planing Machine Setters, Operators, and Tenders, Metal and Plastic 50.7%
Metal, Chemical & Repair Occupations with more than Half of Workforce over 45
Source: EMSI 2014.4

0.0%
5.0%
10.0%
15.0%
20.0%
25.0%
30.0%
35.0%
14-18 19-24 25-34 35-44 45-54 55-64 64+
Industrial Machinery Installation, Repair, and MaintenanceAge Breakdown Comparison
Industrial Machinery Mechanics All Manufacturing All Occupations
Source: EMSI 2014.4

94%
77%
0.40
0.50
0.60
0.70
0.80
0.90
1.00
1.10
2001 2002 2003 2004 2005 2006 2007 2008 2009 2010 2011 2012 2013 2014 2015
Industrial Machinery Installation, Repair, and Maintenance Workers Employment since 2001
Industrial Machinery Installation, Repair, and Maintenance Workers All Production, Maintenance & Repair
Source: EMSI 2014.4
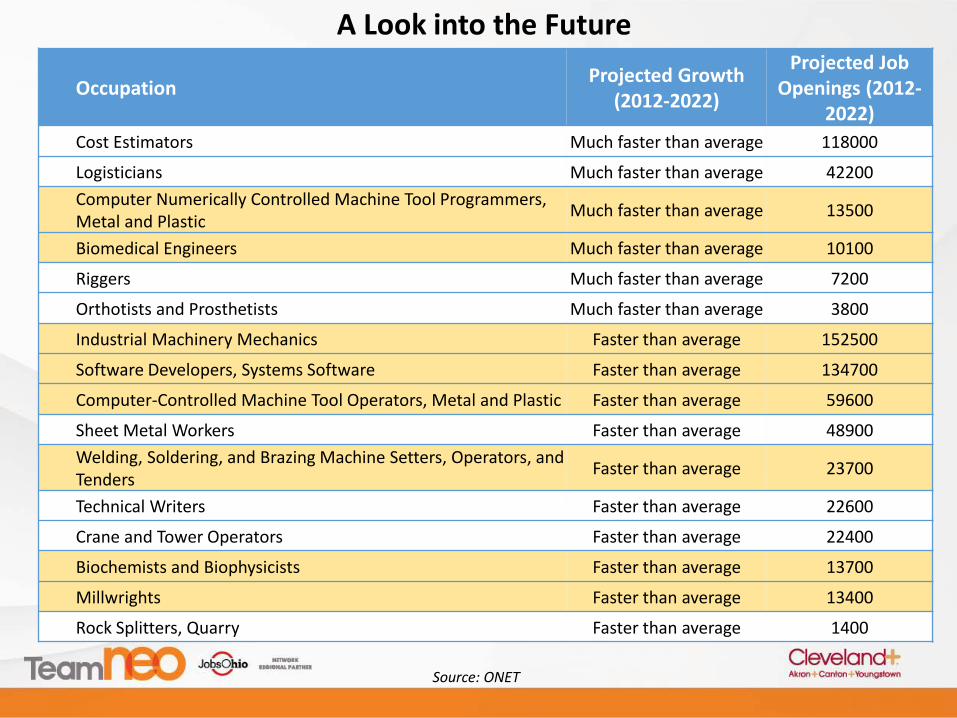
OccupationProjected Growth
(2012-2022)
Projected Job Openings (2012-
2022)
Cost Estimators Much faster than average 118000
Logisticians Much faster than average 42200
Computer Numerically Controlled Machine Tool Programmers, Metal and Plastic
Much faster than average 13500
Biomedical Engineers Much faster than average 10100
Riggers Much faster than average 7200
Orthotists and Prosthetists Much faster than average 3800
Industrial Machinery Mechanics Faster than average 152500
Software Developers, Systems Software Faster than average 134700
Computer-Controlled Machine Tool Operators, Metal and Plastic Faster than average 59600
Sheet Metal Workers Faster than average 48900
Welding, Soldering, and Brazing Machine Setters, Operators, and Tenders
Faster than average 23700
Technical Writers Faster than average 22600
Crane and Tower Operators Faster than average 22400
Biochemists and Biophysicists Faster than average 13700
Millwrights Faster than average 13400
Rock Splitters, Quarry Faster than average 1400
A Look into the Future
Source: ONET

Training & Education: Accuracy of Data Reporting?
716 705
324
192
131
468
410
312290
258
389
5192
72 6122 33 18 18 29 13
47
0
100
200
300
400
500
600
700
800
2003 2004 2005 2006 2007 2008 2009 2010 2011 2012 2013
Total Northeast Ohio Completions
Precision Production Heavy/Industrial Equipment Maintenance Technologies
Source: EMSI 2014.4

Talent Gap? Interest Gap? Wage Mismatch?
Is the Skills Gap Real?• Wall Street Journal, January 2015
There are some jobs now in manufacturing. Kids just aren’t interested in taking them.• Washington Post, May 2014
Manufacturing Growth Threatened by Lack of Interest from Millennial-Age Workers• Design News, February 2015

Thanks!
Sylvio Mecone
Research Manager
Team NEO
(216) 363-5430