sun trust banks 1q 2005 10-q
TRANSCRIPT
ˆ1RGPMSXLJF7DB3G)Š1RGPMSXLJF7DB3G
86547 TX 1SUNTRUST BANKS, INC.10-Q
05-May-2005 13:02 ESTHTMRVA
RR Donnelley ProFile TOR shinv0dc 1*IFV 0C
TORFBU-MWS-CX018.8
Page 1 of 1
SECURITIES AND EXCHANGE COMMISSION Washington, D.C. 20549
FORM 10-Q
Quarterly Report Pursuant to Section 13 or 15(d) of the Securities Exchange Act of 1934
For the Quarterly Period Ended March 31, 2005
Commission File Number 1-8918
SUNTRUST BANKS, INC. (Exact name of registrant as specified in its charter)
(404) 588-7711
(Registrant’s telephone number, including area code) Indicate by check mark whether the registrant (1) has filed all reports required to be filed by section 13 or 15(d) of the Securities Exchange Act of 1934 during the preceding 12 months (or for such shorter period that the registrant was required to file such reports), and (2) has been subject to such filing requirements for the past 90 days.
Yes ⌧ No � Indicate by check mark whether the registrant is an accelerated filer (as defined by Rule 12b-2 of the Act.)
Yes ⌧ No � At April 30, 2005, 361,470,964 shares of the Registrant’s Common Stock, $1.00 par value, were outstanding.
Georgia 58-1575035(State or other jurisdiction
of incorporation or organization) (I.R.S. Employer
Identification No.)
303 Peachtree Street, N.E., Atlanta, Georgia 30308(Address of principal executive offices) (Zip Code)

ˆ1RGPMSXLKJF06VG(Š1RGPMSXLKJF06VG
86547 TX 2SUNTRUST BANKS, INC.10-Q
05-May-2005 19:59 ESTHTMRVA
RR Donnelley ProFile TOR maluv0dcSTART PAGE
2*ESS 0C
CHWFBU-MWS-CX068.8.12
Page 1 of 1
TABLE OF CONTENTS
PART I - FINANCIAL INFORMATION
The following unaudited financial statements have been prepared in accordance with the instructions to Form 10-Q and Rule 10-01 of Regulation S-X, and accordingly do not include all of the information and footnotes required by generally accepted accounting principles for complete financial statements. However, in the opinion of management, all adjustments (consisting only of normal recurring accruals) considered necessary to comply with Regulation S-X have been included. Operating results for the three months ended March 31, 2005 are not necessarily indicative of the results that may be expected for the full year 2005.
EXPLANATORY NOTE In November 2004, the Company restated its 2004 first and second quarters’ Forms 10-Q. The restated financial statements were included in the March 31, 2004 and June 30, 2004 Forms 10-Q/A and in the 2004 Annual Report on Form 10-K. The restatement pertained to a misstatement of the Company’s Allowance for Loan and Lease Losses (“ALLL”) as a result of errors and internal control deficiencies.
2
Page
PART I FINANCIAL INFORMATION
Item 1. Financial Statements (Unaudited)
Consolidated Statements of Income 3
Consolidated Balance Sheets 4
Consolidated Statements of Cash Flows 5
Consolidated Statements of Shareholders’ Equity 6
Notes to Consolidated Financial Statements 7-19
Item 2. Management’s Discussion and Analysis of Financial Condition and Results of Operations 20-50
Item 3. Quantitative and Qualitative Disclosures About Market Risk 51
Item 4. Controls and Procedures 51-52
PART II OTHER INFORMATION
Item 1. Legal Proceedings 52
Item 2. Unregistered Sales of Equity Securities and Use of Proceeds 52
Item 3. Defaults Upon Senior Securities 53
Item 4. Submission of Matters to a Vote of Security Holders 53
Item 5. Other Information 53
Item 6. Exhibits 53
SIGNATURES 53

ˆ1RGPMSXLJF9SMJGZŠ1RGPMSXLJF9SMJG
86547 TX 3SUNTRUST BANKS, INC.10-Q
05-May-2005 13:03 ESTHTMRVA
RR Donnelley ProFile TOR shinv0dcSTART PAGE
1*IFV 0C
TORFBU-MWS-CX018.8
Page 1 of 2
Consolidated Statements of Income
Three Months EndedMarch 31
(In thousands except share data) (Unaudited)
2005
2004
Interest Income
Interest and fees on loans $1,309,138 $881,001Interest on loans held for sale 86,142 67,128Interest and dividends on securities available for sale
Taxable interest 262,445 195,791Tax-exempt interest 8,725 4,123Dividends1 25,856 17,137
Interest on funds sold and securities purchased under agreements to resell 9,683 3,332Other interest 14,033 5,352
Total interest income 1,716,022 1,173,864
Interest Expense
Interest on deposits 322,477 160,662Interest on funds purchased and securities sold under agreements to repurchase 56,190 19,776Interest on other short-term borrowings 16,947 11,023Interest on long-term debt 208,848 130,755
Total interest expense 604,462 322,216
Net Interest Income 1,111,560 851,648Provision for loan losses 10,556 53,837
Net interest income after provision for loan losses 1,101,004 797,811
Noninterest Income
Service charges on deposit accounts 184,103 163,218Trust and investment management income 164,515 136,218Retail investment services 55,143 45,738Other charges and fees 111,375 92,747Investment banking income 50,007 44,813Trading account profits and commissions 44,046 29,390Card fees 48,156 31,694Net gain on sale of RCM assets 19,874 — Other noninterest income 82,254 46,341Securities (losses) gains (5,659) 4,927
Total noninterest income 753,814 595,086
Noninterest Expense
Employee compensation 516,504 400,293Employee benefits 118,289 106,503Net occupancy expense 75,851 61,859Outside processing and software 82,848 65,626Equipment expense 52,882 45,085Marketing and customer development 31,629 30,219Amortization of intangible assets 31,217 15,640Merger expense 25,738 — Other noninterest expense 198,948 164,523
Total noninterest expense 1,133,906 889,748
Income before provision for income taxes 720,912 503,149Provision for income taxes 228,618 141,314

ˆ1RGPMSXLJF9SMJGZŠ1RGPMSXLJF9SMJG
86547 TX 3SUNTRUST BANKS, INC.10-Q
05-May-2005 13:03 ESTHTMRVA
RR Donnelley ProFile TOR shinv0dcSTART PAGE
1*IFV 0C
TORFBU-MWS-CX018.8
Page 2 of 2
See notes to consolidated financial statements
3
Net Income $492,294 $361,835
Average common shares - diluted (thousands) 363,138 283,523Average common shares - basic (thousands) 358,253 279,523Net income per average common share - diluted $1.36 $1.28Net income per average common share - basic 1.37 1.291 Includes dividends on common stock of The Coca-Cola Company 13,515 12,067

ˆ1RGPMSXLJFCHKBG!Š1RGPMSXLJFCHKBG
86547 TX 4SUNTRUST BANKS, INC.10-Q
05-May-2005 13:03 ESTHTMRVA
RR Donnelley ProFile TOR shinv0dc 1*IFV 0C
TORFBU-MWS-CX018.8
Page 1 of 1
Consolidated Balance Sheets
See notes to consolidated financial statements
4
(Dollars in thousands) (Unaudited)
March 31 2005
December 312004
Assets
Cash and due from banks $4,178,424 $3,876,741 Interest-bearing deposits in other banks 17,456 15,929 Funds sold and securities purchased under agreements to resell 1,764,554 1,596,269 Trading assets 2,516,512 2,183,645 Securities available for sale1 29,374,017 28,941,080 Loans held for sale 6,955,538 6,580,223 Loans 104,760,859 101,426,172 Allowance for loan and lease losses (1,023,746) (1,050,024)
Net loans 103,737,113 100,376,148
Premises and equipment 1,857,681 1,860,415 Goodwill 6,861,721 6,806,013 Other intangible assets 1,073,154 1,061,451 Customers’ acceptance liability 21,823 12,105 Other assets 6,452,961 5,559,765
Total assets $164,810,954 $158,869,784
Liabilities and Shareholders’ Equity
Noninterest-bearing consumer and commercial deposits $24,448,291 $24,878,314 Interest-bearing consumer and commercial deposits 68,587,192 67,231,381
Total consumer and commercial deposits 93,035,483 92,109,695 Brokered deposits 8,183,776 6,100,911 Foreign deposits 6,315,625 5,150,645
Total deposits 107,534,884 103,361,251 Funds purchased and securities sold under agreements to repurchase 10,113,705 9,342,831 Other short-term borrowings 2,167,383 2,062,549 Acceptances outstanding 21,823 12,105 Trading liabilities 1,051,095 1,098,563 Long-term debt 22,498,447 22,127,166 Other liabilities 5,319,358 4,878,420
Total liabilities 148,706,695 142,882,885
Preferred stock, no par value; 50,000,000 shares authorized; none issued — — Common stock, $1.00 par value 370,578 370,578 Additional paid in capital 6,754,301 6,749,219 Retained earnings 8,412,574 8,118,710 Treasury stock, at cost, and other (523,790) (528,558)Accumulated other comprehensive income 1,090,596 1,276,950
Total shareholders’ equity 16,104,259 15,986,899
Total liabilities and shareholders’ equity $164,810,954 $158,869,784
Common shares outstanding 361,176,868 360,840,710 Common shares authorized 750,000,000 750,000,000 Treasury shares of common stock 9,401,530 9,737,688 1 Includes net unrealized gains on securities available for sale $1,710,792 $2,010,165

ˆ1RGPMSXLKJHWSJGyŠ1RGPMSXLKJHWSJG
86547 TX 5SUNTRUST BANKS, INC.10-Q
05-May-2005 20:01 ESTHTMRVA
RR Donnelley ProFile TOR maluv0dcSTART PAGE
2*ESS 0C
CHWFBU-MWS-CX068.8.12
Page 1 of 2
Consolidated Statements of Cash Flow
Three Months EndedMarch 31
(Dollars in thousands) (Unaudited)
2005
2004
Cash Flows from Operating Activities:
Net income $492,294 $361,835 Adjustments to reconcile net income to net cash (used in) provided by operating activities:
Net gain on sale of RCM assets (19,874) — Depreciation, amortization and accretion 180,334 161,940 Origination of mortgage servicing rights (68,640) (49,192)Provisions for loan losses and foreclosed property 11,530 54,007 Amortization of compensation element of restricted stock 3,011 1,817 Stock option compensation 6,232 4,235 Securities losses (gains) 5,659 (4,927)Net (gain) loss on sale of assets (669) 198 Originated loans held for sale, net (8,191,224) (6,530,403)Sales of loans held for sale 7,815,908 6,230,345 Net increase in other assets (1,044,282) (650,456)Net increase in other liabilities 374,725 693,719
Net cash (used in) provided by operating activities (434,996) 273,118
Cash Flows from Investing Activities:
Proceeds from maturities, calls and repayments of securities available for sale 1,164,013 1,111,729 Proceeds from sales of securities available for sale 1,515,016 2,202,626 Purchases of securities available for sale (3,433,416) (4,101,289)Loan originations net of principal collected (3,680,178) (1,257,528)Proceeds from sale of loans 31,048 70,015 Capital expenditures (49,350) (72,188)Proceeds from the sale of other assets 7,740 7,640 Other investing activities 551 873
Net cash used in investing activities (4,444,576) (2,038,122)
Cash Flows from Financing Activities:
Net increase (decrease) in consumer and commercial deposits 929,547 (474,935)Net increase in foreign and brokered deposits 3,247,845 155,744 Net increase in funds purchased and other short-term borrowings 875,708 228,399 Proceeds from the issuance of long-term debt 500,000 1,499,822 Repayment of long-term debt (4,072) (147,784)Proceeds from the exercise of stock options 46,108 14,214 Proceeds from stock issuance 25,766 17,998 Acquisition of treasury stock (71,405) (14,064)Dividends paid (198,430) (140,959)
Net cash provided by financing activities 5,351,067 1,138,435
Net increase (decrease) in cash and cash equivalents 471,495 (626,569)Cash and cash equivalents at beginning of year 5,488,939 5,321,374 Cash and cash equivalents at end of period $5,960,434 $4,694,805
Supplemental Disclosure
Interest paid $549,084 $307,662 Income taxes paid 32,764 3,511 Income taxes refunded 610 14 Non-cash impact of the deconsolidation of Three Pillars — (2,563,031)

ˆ1RGPMSXLKJHWSJGyŠ1RGPMSXLKJHWSJG
86547 TX 5SUNTRUST BANKS, INC.10-Q
05-May-2005 20:01 ESTHTMRVA
RR Donnelley ProFile TOR maluv0dcSTART PAGE
2*ESS 0C
CHWFBU-MWS-CX068.8.12
Page 2 of 2
See notes to consolidated financial statements
5

ˆ1RGPMSXLN1==7NGTŠ1RGPMSXLN1==7NG
86547 TX 6SUNTRUST BANKS, INC.10-Q
06-May-2005 15:00 ESTHTMRVA
RR Donnelley ProFile TOR dhayk0dc 2*ESS 0C
CHWFBU-MWS-CX068.8.12
Page 1 of 1
Consolidated Statements of Shareholders’ Equity
(Dollars and shares in thousands) (Unaudited)
CommonShares
Outstanding
Common Stock
Additional Paid in Capital
Retained Earnings
Treasury Stock and
Other*
Accumulated Other
ComprehensiveIncome
Total
Balance, January 1, 2004 281,923 $294,163 $1,288,311 $7,149,118 $(664,518) $1,664,092 $9,731,166 Net income — — — 361,835 — — 361,835 Other comprehensive income:
Change in unrealized gains (losses) on derivatives, net of taxes — — — — — 6,715 6,715
Change in unrealized gains (losses) on securities, net of taxes — — — — — 111,101 111,101
Change in accumulated other comprehensive income related to retirement plans — — — — — (248) (248)
Total comprehensive income 479,403 Cash dividends declared, $0.50 per share — — — (140,959) — — (140,959)Exercise of stock options and stock
compensation expense 302 — 2,382 — 16,067 — 18,449 Acquisition of treasury stock (200) — — — (14,064) — (14,064)Performance stock activity 55 — (876) — 876 — — Amortization of compensation element of
performance stock — — — — 1,817 — 1,817 Issuance of stock for employee benefit plans 252 — 3,915 — 14,083 — 17,998
Balance, March 31, 2004 282,332 $294,163 $1,293,732 $7,369,994 $(645,739) $1,781,660 $10,093,810
Balance, January 1, 2005 360,840 $370,578 $6,749,219 $8,118,710 $(528,558) $1,276,950 $15,986,899 Net income — — — 492,294 — — 492,294 Other comprehensive income:
Change in unrealized gains (losses) on derivatives, net of taxes — — — — — 8,962 8,962
Change in unrealized gains (losses) on securities, net of taxes — — — — — (194,376) (194,376)
Change in accumulated other comprehensive income related to retirement plans — — — — — (940) (940)
Total comprehensive income 305,940 Cash dividends declared, $0.55 per share — — — (198,430) — — (198,430)Exercise of stock options and stock
compensation expense 922 — 2,119 — 50,221 — 52,340 Acquisition of treasury stock (995) — — — (71,405) — (71,405)Performance stock activity 44 — (2,821) — 2,821 — — Amortization of compensation element of
performance stock — — — — 3,011 — 3,011 Issuance of stock for employee benefit plans 366 — 5,646 — 20,120 — 25,766 Other activity — — 138 — — — 138
Balance, March 31, 2005 361,177 $370,578 $6,754,301 $8,412,574 $(523,790) $1,090,596 $16,104,259
See notes to consolidated financial statements
6
* Balance at March 31, 2005 includes $490,612 for treasury stock and $33,178 for compensation element of restricted stock. Balance at March 31, 2004 includes $618,086 for treasury stock and $27,653 for compensation element of restricted stock.
ˆ1RGPMSXLMLDVBVG2Š1RGPMSXLMLDVBVG
86547 TX 7SUNTRUST BANKS, INC.10-Q
06-May-2005 10:32 ESTHTMRVA
RR Donnelley ProFile TOR amana0dc 4*ESS 0C
CHWFBU-MWS-CX058.8.12
Page 1 of 1
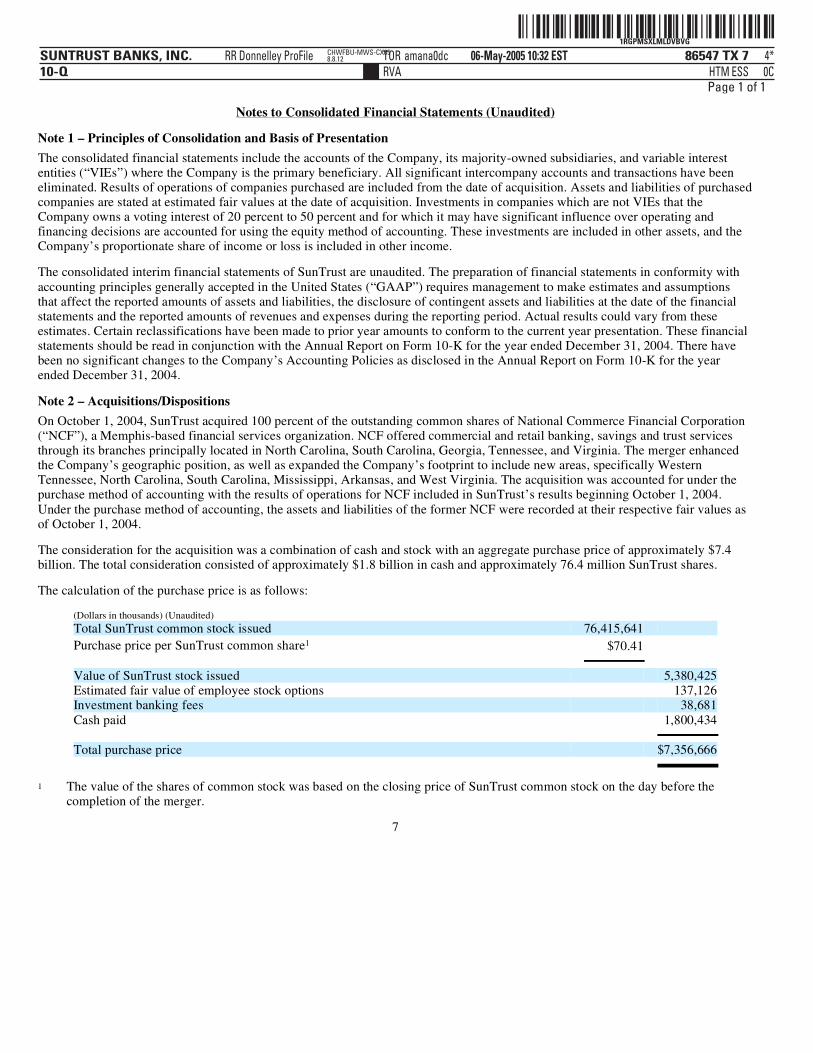
Notes to Consolidated Financial Statements (Unaudited) Note 1 – Principles of Consolidation and Basis of Presentation The consolidated financial statements include the accounts of the Company, its majority-owned subsidiaries, and variable interest entities (“VIEs”) where the Company is the primary beneficiary. All significant intercompany accounts and transactions have been eliminated. Results of operations of companies purchased are included from the date of acquisition. Assets and liabilities of purchased companies are stated at estimated fair values at the date of acquisition. Investments in companies which are not VIEs that the Company owns a voting interest of 20 percent to 50 percent and for which it may have significant influence over operating and financing decisions are accounted for using the equity method of accounting. These investments are included in other assets, and the Company’s proportionate share of income or loss is included in other income. The consolidated interim financial statements of SunTrust are unaudited. The preparation of financial statements in conformity with accounting principles generally accepted in the United States (“GAAP”) requires management to make estimates and assumptions that affect the reported amounts of assets and liabilities, the disclosure of contingent assets and liabilities at the date of the financial statements and the reported amounts of revenues and expenses during the reporting period. Actual results could vary from these estimates. Certain reclassifications have been made to prior year amounts to conform to the current year presentation. These financial statements should be read in conjunction with the Annual Report on Form 10-K for the year ended December 31, 2004. There have been no significant changes to the Company’s Accounting Policies as disclosed in the Annual Report on Form 10-K for the year ended December 31, 2004. Note 2 – Acquisitions/Dispositions On October 1, 2004, SunTrust acquired 100 percent of the outstanding common shares of National Commerce Financial Corporation (“NCF”), a Memphis-based financial services organization. NCF offered commercial and retail banking, savings and trust services through its branches principally located in North Carolina, South Carolina, Georgia, Tennessee, and Virginia. The merger enhanced the Company’s geographic position, as well as expanded the Company’s footprint to include new areas, specifically Western Tennessee, North Carolina, South Carolina, Mississippi, Arkansas, and West Virginia. The acquisition was accounted for under the purchase method of accounting with the results of operations for NCF included in SunTrust’s results beginning October 1, 2004. Under the purchase method of accounting, the assets and liabilities of the former NCF were recorded at their respective fair values as of October 1, 2004. The consideration for the acquisition was a combination of cash and stock with an aggregate purchase price of approximately $7.4 billion. The total consideration consisted of approximately $1.8 billion in cash and approximately 76.4 million SunTrust shares. The calculation of the purchase price is as follows:
(Dollars in thousands) (Unaudited)
Total SunTrust common stock issued 76,415,641
Purchase price per SunTrust common share1 $70.41
Value of SunTrust stock issued 5,380,425Estimated fair value of employee stock options 137,126Investment banking fees 38,681Cash paid 1,800,434
Total purchase price $7,356,666
7
1 The value of the shares of common stock was based on the closing price of SunTrust common stock on the day before the completion of the merger.

ˆ1RGPMSXLMLHHT6G|Š1RGPMSXLMLHHT6G
86547 TX 8SUNTRUST BANKS, INC.10-Q
06-May-2005 10:34 ESTHTMRVA
RR Donnelley ProFile TOR amana0dcSTART PAGE
3*ESS 0C
CHWFBU-MWS-CX058.8.12
Page 1 of 1
Notes to Consolidated Financial Statements (Unaudited)
The Company incurred $25.7 million in merger expenses in the first quarter of 2005 which represent incremental costs to integrate NCF’s operations. The following condensed income statement discloses the pro forma results of the Company as though the NCF acquisition had occurred at the beginning of the period presented:
Three months ended March 31, 2004 (Unaudited)
SunTrust
Banks, Inc.1
National Commerce
Financial2
Pro Forma
Adjustments3
Pro Forma Combined
(In thousands except per share data)
Interest and dividend income $1,173,864 $260,527 ($4,372) $1,430,019
Interest expense 322,216 69,456 17,715 409,387
Net interest income 851,648 191,071 (22,087) 1,020,632Provision for loan losses 53,837 12,088 — 65,925 Net interest income after provision for loan losses 797,811 178,983 (22,087) 954,707Noninterest income 595,086 119,938 — 715,024Noninterest expense 889,748 163,726 2,790 1,056,264
Income from continuing operations before provision for income taxes 503,149 135,195 (24,877) 613,467Provision for income taxes 141,314 44,951 (9,453) 176,812
Income from continuing operations $361,835 $90,244 ($15,424) $436,655
Average shares: Diluted 283,523 78,364 361,887Basic 279,523 76,416 355,939
Income from continuing operations per average common share:
Diluted $1.28 $1.21Basic 1.29 1.23
1 Represents the reported results of SunTrust Banks, Inc. for the three months ended March 31, 2004.
2 Represents the reported results of National Commerce Financial for the three months ended March 31, 2004.
On March 31, 2005, SunTrust sold substantially all of the factoring assets of its division, Receivables Capital Management (“RCM”), to CIT Group, Inc. The sale of approximately $238 million in net assets resulted in a gain of $30.0 million. This gain was partially offset by $10.1 million of expenses primarily related to the severance of RCM employees and the write-off of obsolete RCM financial systems. The net gain of $19.9 million was recorded in the Consolidated Statements of Income as a component of noninterest income. On January 27, 2005, SunTrust purchased the remaining 20% minority interest of Lighthouse Partners, LLC (“LHP”), a non-registered limited investment partnership established to provide alternative investment strategies for customers. The transaction resulted in $39.8 million of goodwill and $11.1 million of other intangibles, which were not deductible for tax purposes.
8
3 Pro forma adjustments include the following items: amortization of core deposit and other intangibles of $16.4 million, net of NCF’s historical amortization of $13.6 million, amortization of loan purchase accounting adjustment of $5.0 million, accretion of securities purchase accounting adjustment of $0.6 million, amortization of deposit purchase accounting adjustment of $1.8 million, and accretion of short-term and long-term borrowings purchase accounting adjustments of $1.9 million. Additionally, interest expense includes $17.7 million for funding costs as though the funding for the cash component of the transaction occurred January 1, 2004.
ˆ1RGPMSXLKJZNT7G=Š1RGPMSXLKJZNT7G
86547 TX 9SUNTRUST BANKS, INC.10-Q
05-May-2005 20:11 ESTHTMRVA
RR Donnelley ProFile TOR maluv0dc 2*ESS 0C
CHWFBU-MWS-CX068.8.12
Page 1 of 1
Notes to Consolidated Financial Statements (Unaudited) On May 28, 2004, SunTrust completed the acquisition of substantially all of the assets of Seix Investment Advisors, Inc. The Company acquired approximately $17 billion in assets under management. The Company paid $190 million in cash, resulting in $84 million of goodwill and $99 million of other intangible assets, all of which are deductible for tax purposes. Additional payments may be made in 2007 and 2009, contingent on performance. The additional payments are currently estimated to total approximately $66.6 million. Note 3 – Accounting Developments Accounting Policies Adopted In December 2003, the American Institute of Certified Public Accountants (“AICPA”) issued Statement of Position (“SOP”) 03-3, “Accounting for Loans or Certain Debt Securities Acquired in a Transfer.” The SOP addresses the accounting for differences between contractual cash flows and cash flows expected to be collected from an investor’s initial investment in loans or debt securities acquired in a transfer if those differences relate to a deterioration of credit quality. The SOP also prohibits companies from “carrying over” or creating a valuation allowance in the initial accounting for loans acquired that meet the scope criteria of the SOP. The SOP was effective for loans acquired in fiscal years beginning after December 15, 2004. The adoption of this SOP in the first quarter of 2005 did not impact the Company’s financial position or results of operations. Recently Issued and Pending Accounting Pronouncements In March 2004, the EITF reached a consensus on EITF Issue No. 03-1, “The Meaning of Other-Than-Temporary Impairment and Its Application to Certain Investments.” The Issue provides guidance for evaluating whether several types of investments, including debt securities classified as held-to-maturity and available-for-sale under SFAS 115, “Accounting for Certain Investments in Debt and Equity Securities,” are other-than-temporarily impaired and requires certain disclosures. The Issue was effective for other-than-temporary impairment evaluations made in reporting periods beginning after June 15, 2004. However, in September 2004, the evaluation and accounting guidance contained in paragraphs 10 to 20 of this Issue was delayed by FSP EITF Issue 03-1-1, “Effective Date of Paragraphs 10–20 of EITF Issue No. 03-1, ‘The Meaning of Other-Than-Temporary Impairment and Its Application to Certain Investments.’” The delay of the effective date for paragraphs 10–20 will be superseded concurrent with the final issuance of proposed FSP EITF Issue 03-1-a, “Implementation Guidance for the Application of Paragraph 16 of EITF Issue No. 03-1. FSP EITF Issue 03-1-a provides implementation guidance for debt securities that are impaired solely because of interest rate and/or sector spread increases and analyzed for other-than-temporary impairment under paragraph 16 of Issue 03-1. The adoption of the effective provisions of this EITF did not have a material impact on the Company’s financial position or results of operations. The Company is in the process of assessing the impact the delayed provisions will have on its financial position and results of operations, when adopted. In December 2004, the FASB issued a revision of SFAS No. 123 (“SFAS No. 123(R)”), “Accounting for Stock-Based Compensation.” The revised Statement clarifies and expands SFAS No. 123’s guidance in several areas, including measuring fair value, classifying an award as equity or as a liability, and attributing compensation cost to reporting periods. The revised statement supercedes Accounting Practice Bulletin (“APB”) Opinion No. 25, “Accounting for Stock Issued to Employees,” and its related implementation guidance. Under the provisions of SFAS 123(R), the alternative to use Opinion 25’s intrinsic value method of accounting that was provided in Statement No. 123, as originally issued, is eliminated, and entities are required to measure liabilities incurred to employees in share-based payment transactions at fair value.
9
ˆ1RGPMSXLJF7HCSG#Š1RGPMSXLJF7HCSG
86547 TX 10SUNTRUST BANKS, INC.10-Q
05-May-2005 13:02 ESTHTMRVA
RR Donnelley ProFile TOR shinv0dc 1*IFV 0C
TORFBU-MWS-CX018.8
Page 1 of 1
Notes to Consolidated Financial Statements (Unaudited) Effective January 1, 2002, the Company adopted the fair-value recognition provision of SFAS No. 123, prospectively, and began expensing the cost of stock options. The Company has quantified the effect on net income and earnings per share if the fair-value based method had been applied on a retrospective basis in Note 5 to the Consolidated Financial Statements. In March 2005, the SEC released Staff Accounting Bulletin (“SAB”) No. 107, which addresses the application of SFAS No. 123(R). This SAB is intended to assist issuers with their initial implementation of SFAS No. 123(R) by providing interpretive guidance related to share-based compensation regarding the interaction between SFAS No. 123(R) and certain Securities and Exchange Commission rules and regulations. It does not change or amend the provisions of SFAS No. 123(R) or these SEC rules and regulations. SAB No. 107 also delayed the effective date of SFAS No. 123(R) for public companies to annual, rather than interim, periods beginning after June 15, 2005. The adoption of SFAS No. 123(R), as interpreted by SAB No. 107, is not expected to have a material impact on the Company’s financial position or results of operations. In December 2004, the FASB issued SFAS No. 153, “Exchanges of Nonmonetary Assets – an amendment of APB Opinion No. 29.” SFAS No. 153 addresses the measurement of nonmonetary exchanges and eliminates the exception from fair value measurement for nonmonetary exchanges of similar productive assets in APB No. 29, “Accounting for Nonmonetary Transactions,” and replaces it with an exception for exchanges that do not have commercial substance. This Statement specifies that a nonmonetary exchange has commercial substance if the future cash flows of the entity are expected to change significantly as a result of the exchange. This Statement is effective for nonmonetary asset exchanges occurring in fiscal periods beginning after June 15, 2005. The Company does not expect the adoption of SFAS 153 to have a material impact on the Company’s financial position or results of operations. In March 2005, the EITF reached tentative conclusions on EITF Issue No. 04-5, “Determining Whether a General Partner, or the General Partners as a Group, Controls a Limited Partnership or Similar Entity When the Limited Partners Have Certain Rights.” This EITF applies to all limited partnerships and similar entities and states that the general partner, or group of general partners, is presumed to have control over the limited partnership regardless of the percentage of ownership. Additionally, this Issue states that a limited partner’s kick-out rights are considered substantive if they can be exercised by a simple majority of the limited partner’s voting interests and that rights that allow a partner to block an acquisition or disposition of assets, occurring in the normal course of business, are participating rights. These tentative conclusions have prompted the EITF to ask the FASB to make revisions to EITF Issue No. 96-16, “Investor’s Accounting for an Investee When the Investor Has a Majority of the Voting Interest but the Minority Shareholder or Shareholders Have Certain Approval or Veto Rights.” The Company is currently in the process of evaluating the impact that EITF Issue No. 04-5 and the revisions to EITF Issue No. 96-16 would have on the Company’s financial position or results of operations, if finalized. In March 2005, the FASB affirmed a decision related to the application and clarification of SFAS No. 13, “Accounting for Leases.” FASB decided that a change in the timing of the realization of tax benefits on a leveraged lease will require recalculation of that lease. Additionally, the classification of a leveraged lease will be required to be reassessed if an important assumption related to the lease was revised and resulted in recalculation. These decisions are related to accounting issues that have arisen recently as companies reach settlements with the Internal Revenue Service (“IRS”) on certain types of leveraged lease transactions. The FASB expects to issue an Exposure Draft on these topics during the second quarter of 2005 with an effective date for fiscal years ending after December 15, 2005. SunTrust is currently in the process of evaluating the
10

ˆ1RGPMSXLN1C5ZLGEŠ1RGPMSXLN1C5ZLG
86547 TX 11SUNTRUST BANKS, INC.10-Q
06-May-2005 14:50 ESTHTMRVA
RR Donnelley ProFile TOR panda0dc 4*ESS 0C
TORFBU-MWS-CX018.8.12
Page 1 of 1
Notes to Consolidated Financial Statements (Unaudited) – continued impact that this proposed guidance would have on the Company’s financial position or results of operations, if finalized. Note 4 – Intangible Assets Under the provisions of SFAS No. 142, “Goodwill and Other Intangible Assets,” the Company completed its 2004 annual review of goodwill and determined there was no impairment. The Company will review goodwill on an annual basis for impairment and as events occur or circumstances change that would more likely than not reduce fair value of a reporting unit below its carrying amount. The changes in the carrying amount of goodwill by reportable segment for the three months ended March 31, 2004 and 2005 are as follows:
The changes in the carrying amounts of other intangible assets for the three months ended March 31, 2004 and 2005 are as follows:
11
(Dollars in thousands) (Unaudited)
Retail
Commercial
Corporate andInvestment
Banking
Mortgage
Wealth and Investment
Management
Corporate/ Other
Total
Balance, January 1, 2004 $736,514 $123,276 $94,852 $53,663 $69,333 $— $1,077,638Purchase price adjustments 439 184 — 1,379 — — 2,002
Balance, March 31, 2004 $736,953 $123,460 $94,852 $55,042 $69,333 $— $1,079,640
Balance, January 1, 20051 $4,875,347 $1,267,452 $148,362 $243,808 $260,905 $10,139 $6,806,013NCF purchase price adjustments 15,920 (2,662) (705) (283) (571) (141) 11,558Purchase of LHP minority shares — — — — 39,801 — 39,801Sun America contingent consideration — — — 4,349 — — 4,349
Balance, March 31, 2005 $4,891,267 $1,264,790 $147,657 $247,874 $300,135 $9,998 $6,861,721
1 Beginning balances include the allocation of NCF goodwill as follows: Retail - $4,143.4 million, Commercial - $1,144.0 million, CIB - $53.5 million, Mortgage - $187.6 million, Wealth and Investment Management - $94.1 million, and Corporate/Other - $10.1 million
Core Deposit
Intangible
Mortgage Servicing
Rights
Other
Total
(Dollars in thousands) (Unaudited)
Balance, January 1, 2004 $165,028 $449,293 $25,298 $639,619 Amortization (14,402) (46,140) (1,239) (61,781)Servicing rights originated — 49,192 — 49,192 Other — — 1,193 1,193
Balance, March 31, 2004 $150,626 $452,345 $25,252 $628,223
Balance, January 1, 2005 $424,143 $482,392 $154,916 $1,061,451 Amortization (26,411) (36,839) (4,806) (68,056)Servicing rights originated — 68,640 — 68,640 LHP client relationship and
noncompete agreements — — 11,119 11,119
Balance, March 31, 2005 $397,732 $514,193 $161,229 $1,073,154
ˆ1RGPMSXLN22YV=G>Š1RGPMSXLN22YV=G
86547 TX 12SUNTRUST BANKS, INC.10-Q
06-May-2005 15:02 ESTHTMRVA
RR Donnelley ProFile TOR panda0dc 3*ESS 0C
TORFBU-MWS-CX018.8.12
Page 1 of 1
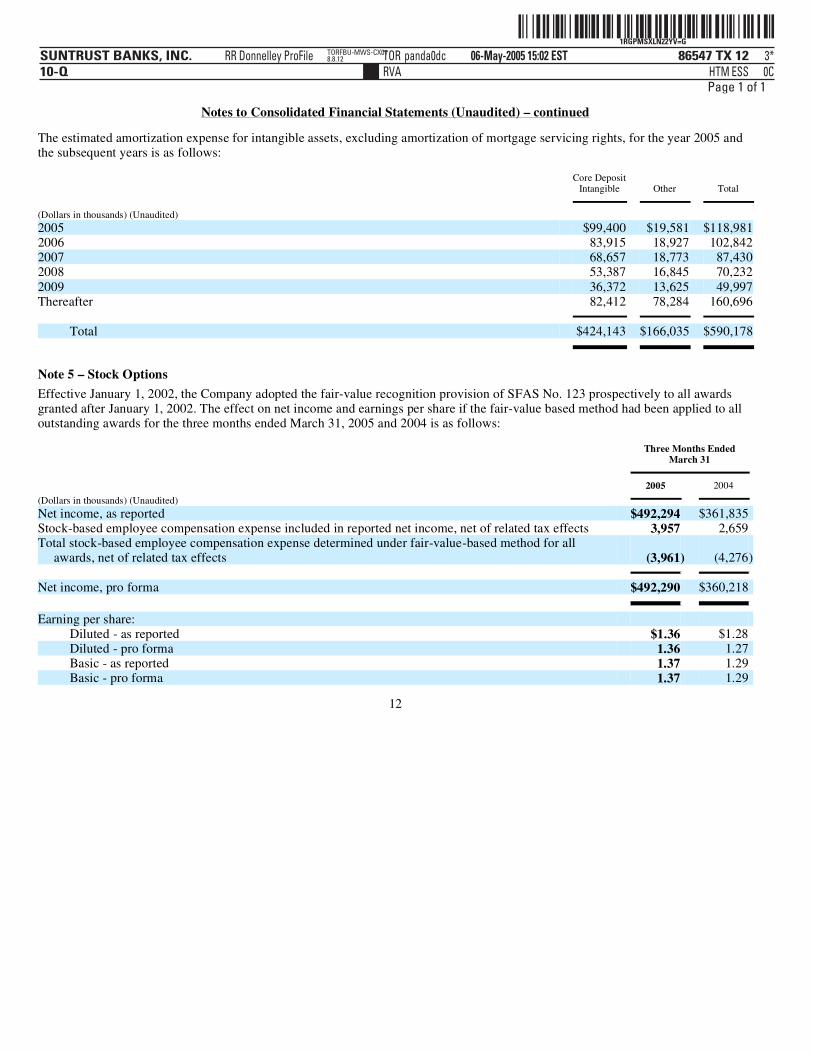
Notes to Consolidated Financial Statements (Unaudited) – continued The estimated amortization expense for intangible assets, excluding amortization of mortgage servicing rights, for the year 2005 and the subsequent years is as follows:
Note 5 – Stock Options
Core DepositIntangible
Other
Total
(Dollars in thousands) (Unaudited)
2005 $99,400 $19,581 $118,9812006 83,915 18,927 102,8422007 68,657 18,773 87,4302008 53,387 16,845 70,2322009 36,372 13,625 49,997Thereafter 82,412 78,284 160,696
Total $424,143 $166,035 $590,178
Effective January 1, 2002, the Company adopted the fair-value recognition provision of SFAS No. 123 prospectively to all awards granted after January 1, 2002. The effect on net income and earnings per share if the fair-value based method had been applied to all outstanding awards for the three months ended March 31, 2005 and 2004 is as follows:
12
Three Months Ended March 31
(Dollars in thousands) (Unaudited)
2005
2004
Net income, as reported $492,294 $361,835 Stock-based employee compensation expense included in reported net income, net of related tax effects 3,957 2,659 Total stock-based employee compensation expense determined under fair-value-based method for all
awards, net of related tax effects (3,961) (4,276) Net income, pro forma $492,290 $360,218
Earning per share:
Diluted - as reported $1.36 $1.28 Diluted - pro forma 1.36 1.27 Basic - as reported 1.37 1.29 Basic - pro forma 1.37 1.29

ˆ1RGPMSXLMLSKQKG|Š1RGPMSXLMLSKQKG
86547 TX 13SUNTRUST BANKS, INC.10-Q
06-May-2005 10:38 ESTHTMRVA
RR Donnelley ProFile TOR amana0dc 3*ESS 0C
CHWFBU-MWS-CX058.8.12
Page 1 of 1
Notes to Consolidated Financial Statements (Unaudited) – continued Note 6 – Comprehensive Income Comprehensive income for the three months ended March 31, 2005 and 2004 is calculated as follows:
13
Three Months Ended March 31
(Dollars in thousands) (Unaudited)
2005
2004
Change in unrealized gain/loss on available for sale securities, net, recognized in other comprehensive income:
Before income tax $(299,373) $170,925 Income tax 104,997 (59,824)
Net of income tax $(194,376) $111,101
Amounts reported in net income:
(Loss) gain on sale of securities $(5,659) $4,927 Net amortization (9,850) (17,976)
Reclassification adjustment (15,509) (13,049)Income tax 5,893 4,567
Reclassification adjustment, net of tax $(9,616) $(8,482)
Change in unrealized gain/loss gain on available for sale securities arising during period, net of tax $(203,992) $102,619 Reclassification adjustment, net of tax 9,616 8,482
Net unrealized loss on available for sale securities recognized in other comprehensive income $(194,376) $111,101
Change in unrealized gain/loss on derivative financial instruments, net recognized in other comprehensive income:
Before income tax $14,455 $10,331 Income tax (5,493) (3,616)
Net of income tax $8,962 $6,715
Change in accumulated other comprehensive income related to retirement plans: $(940) $(248)
Total unrealized (losses)/gains recognized in other comprehensive income $(186,354) $117,568 Net income 492,294 361,835
Total comprehensive income $305,940 $479,403
The components of accumulated other comprehensive income at March 31 were as follows:
(Dollars in thousands) (Unaudited)
March 31 2005
March 31 2004
Unrealized gain on available for sale securities $1,109,624 $1,810,444 Unrealized gain (loss) on derivative financial instruments 2,367 (10,540)Accumulated other comprehensive income related to retirement plans (21,395) (18,244)
Total accumulated other comprehensive income $1,090,596 $1,781,660

ˆ1RGPMSXLJF7WLDGzŠ1RGPMSXLJF7WLDG
86547 TX 14SUNTRUST BANKS, INC.10-Q
05-May-2005 13:02 ESTHTMRVA
RR Donnelley ProFile TOR shinv0dc 1*IFV 0C
TORFBU-MWS-CX018.8
Page 1 of 1
Notes to Consolidated Financial Statements (Unaudited) – continued Note 7 – Earnings Per Share Reconciliation Net income is the same in the calculation of basic and diluted earnings per share (“EPS”). Equivalent shares of 9.2 million and 6.0 million related to stock options for the periods ended March 31, 2005 and 2004, respectively, were excluded in the computation of diluted EPS because they would have been antidilutive. A reconciliation of the difference between average basic common shares outstanding and average diluted common shares outstanding for the three months ended March 31, 2005 and 2004 is included in the following table:
Note 8 – Business Segment Reporting
(In thousands, except per share data) (Unaudited)
Three Months Ended March 31
2005
2004
Diluted
Net income $492,294 $361,835
Average common shares outstanding 358,253 279,523Effect of dilutive securities:
Stock options 3,108 2,218Performance restricted stock 1,777 1,782
Average diluted common shares 363,138 283,523
Earnings per common share - diluted $1.36 $1.28
Basic
Net income $492,294 $361,835
Average common shares 358,253 279,523
Earnings per common share - basic $1.37 $1.29
The Company continues to augment its internal management reporting system. Financial results for each segment currently include assets, liabilities, matched maturity funds transfer priced net interest income, provision expense based on net charge-offs, direct noninterest income, direct noninterest expense, and certain support cost allocations. Future enhancements to the line items reported for each business segment are expected to include fully allocated expenses, provision for income taxes, and attributed economic capital. The implementation of these additional allocations within the business segment disclosures is expected to materially affect the net income disclosed for each segment with no impact on consolidated amounts. Whenever significant changes to management reporting methodologies take place, the impact of these changes is quantified and prior period information is reclassified. The Company will reflect these reclassified changes immediately in the current period and in year to date historical comparisons, and will provide updated historical quarterly and annual schedules in the Annual Report on Form 10-K.
14

ˆ1RGPMSXLKJ=F6HGpŠ1RGPMSXLKJ=F6HG
86547 TX 15SUNTRUST BANKS, INC.10-Q
05-May-2005 20:11 ESTHTMRVA
RR Donnelley ProFile TOR dhayk0dc 2*ESS 0C
TORFBU-MWS-CX058.8.12
Page 1 of 2
Notes to Consolidated Financial Statements (Unaudited) – continued The tables below disclose selected financial information for SunTrust’s reportable segments for the three months ended March 31, 2005 and 2004.
Three Months Ended March 31, 2005
(Dollars in thousands) (Unaudited)
Retail
Commercial
Corporate & Investment
Banking
Mortgage
Wealth & Investment
Management
Corporate/ Other
Reconciling Items
Consolidated
Average total assets $31,663,964 $31,151,290 $19,601,013 $28,872,228 $8,180,929 $39,426,827 $2,316,885 $161,213,136Average total
liabilities 62,398,182 12,607,288 6,364,067 1,338,579 9,202,647 49,343,162 3,841,555 145,095,480Average total equity — — — — — 16,119,430 (1,774) 16,117,656
Net interest income 572,228 217,064 57,341 127,606 76,973 (39,605) 99,953 1,111,560Fully taxable-
equivalent adjustment (FTE) 15 8,989 4,838 — 3 3,822 (1) 17,666
Net interest income (FTE)1 572,243 226,053 62,179 127,606 76,976 (35,783) 99,952 1,129,226
Provision for loan losses2 29,561 (574) (754) 887 292 1,188 (20,044) 10,556
Net interest income after provision for loan losses 542,682 226,627 62,933 126,719 76,684 (36,971) 119,996 1,118,670
Noninterest income 241,340 80,973 177,260 44,828 232,297 (10,222) (12,662) 753,814Noninterest expense 352,453 97,906 88,707 102,770 208,295 296,428 (12,653) 1,133,906
Total contribution before taxes 431,569 209,694 151,486 68,777 100,686 (343,621) 119,987 738,578
Provision for income taxes3 — — — — — — 246,284 246,284
Net income $431,569 $209,694 $151,486 $68,777 $100,686 $(343,621) $(126,297) $492,294
Three Months Ended March 31, 2004
(Dollars in thousands) (Unaudited)
Retail
Commercial
Corporate & Investment
Banking
Mortgage
Wealth & Investment
Management
Corporate/ Other
ReconcilingItems
Consolidated
Average total assets $24,029,133 $22,543,423 $19,901,068 $21,348,185 $5,633,817 $28,731,430 $1,666,691 $123,853,747Average total liabilities 48,157,023 9,482,489 7,447,269 1,297,069 6,682,536 38,450,416 2,496,663 114,013,465Average total equity — — — — — 9,840,282 — 9,840,282
Net interest income 420,194 151,367 61,851 118,223 52,484 (10,713) 58,242 851,648Fully taxable-
equivalent adjustment (FTE) 18 7,248 3,678 — 3 1,308 1 12,256
Net interest income (FTE)1 420,212 158,615 65,529 118,223 52,487 (9,405) 58,243 863,904
Provision for loan losses2 38,140 7,489 9,301 2,437 638 784 (4,952) 53,837
Net interest income after provision for

ˆ1RGPMSXLKJ=F6HGpŠ1RGPMSXLKJ=F6HG
86547 TX 15SUNTRUST BANKS, INC.10-Q
05-May-2005 20:11 ESTHTMRVA
RR Donnelley ProFile TOR dhayk0dc 2*ESS 0C
TORFBU-MWS-CX058.8.12
Page 2 of 2
loan losses 382,072 151,126 56,228 115,786 51,849 (10,189) 63,195 810,067Noninterest income 189,603 80,337 133,837 20,240 190,139 (9,397) (9,673) 595,086Noninterest expense 266,790 78,873 75,733 71,319 160,044 246,667 (9,678) 889,748
Total contribution before taxes 304,885 152,590 114,332 64,707 81,944 (266,253) 63,200 515,405
Provision for income taxes3 — — — — — — 153,570 153,570
Net income $304,885 $152,590 $114,332 $64,707 $81,944 $(266,253) $(90,370) $361,835
1 Net interest income is fully taxable equivalent and is presented on a matched maturity funds transfer price basis for the lines of business.
2 Provision for loan losses represents net charge-offs for the lines of business.
15
3 Includes regular income tax provision and taxable-equivalent income adjustment reversal.

ˆ1RGPMSXLMLVGRPGYŠ1RGPMSXLMLVGRPG
86547 TX 16SUNTRUST BANKS, INC.10-Q
06-May-2005 10:40 ESTHTMRVA
RR Donnelley ProFile TOR amana0dc 3*ESS 0C
CHWFBU-MWS-CX058.8.12
Page 1 of 1
Notes to Consolidated Financial Statements (Unaudited) – continued Note 9 – Employee Benefits In the first quarter of 2004, SunTrust contributed $30 million to its noncontributory qualified retirement plan (“Retirement Benefits” plan) related to the 2003 plan year. SunTrust does not anticipate making such contributions in 2005. The expected long-term rate of return on plan assets is 8.5% for 2005. Anticipated employer contributions/benefit payments for 2005 remain at $26 million for the Supplemental Retirement Benefits plan, due to the retirement of several key executives. For the three months ended March 31, 2005, actual contributions/benefit payments totaled $8.5 million. The Medicare Prescription Drug, Improvement and Modernization Act of 2003 (the “Act”) was signed into law on December 8, 2003. The Act introduces a prescription drug benefit under Medicare Part D as well as a federal subsidy to sponsors of retiree health care benefit plans that provide a benefit that is at least actuarially equivalent to Medicare Part D. The Company determined that its postretirement health care plans’ prescription drug benefits are actuarially equivalent to Medicare Part D benefits. Effective July 1, 2004, the Company adopted FSP 106-2, which provides guidance on how companies should account for the impact of the Act. The effect of the Act was measured as of January 1, 2004 and resulted in a $9.7 million reduction in the accumulated postretirement benefit obligation (“APBO”) as well as a $1.6 million reduction in the net periodic postretirement benefit cost, which was recognized in the Company’s financial statements for the year ended December 31, 2004.
16
(Dollars in thousands)(Unaudited)
Three months ended March 31, 2005
RetirementBenefits
SupplementalRetirement
Benefits
Other Postretirement
Benefits
Service cost $16,500 $575 $775 Interest cost 23,675 1,500 2,425 Expected return on plan assets (39,100) — (2,225)Amortization of prior service cost (125) 550 — Recognized net actuarial loss 8,900 1,325 1,550 Amortization of initial transition obligation — — 575 Participant information adjustment (14,600) — — Partial settlement — 3,140 — Net periodic benefit cost $(4,750) $7,090 $3,100
Three months ended March 31, 2004
(Dollars in thousands)(Unaudited)
RetirementBenefits
SupplementalRetirement
Benefits
Other Postretirement
Benefits
Service cost $12,844 $426 $716 Interest cost 20,869 1,279 2,701 Expected return on plan assets (33,484) — (2,188)Amortization of prior service cost (124) 486 — Recognized net actuarial loss 9,899 1,109 1,863 Amortization of initial transition obligation — — 583
Net periodic benefit cost $10,004 $3,300 $3,675
ˆ1RGPMSXLJF8BVPGLŠ1RGPMSXLJF8BVPG
86547 TX 17SUNTRUST BANKS, INC.10-Q
05-May-2005 13:02 ESTHTMRVA
RR Donnelley ProFile TOR shinv0dc 1*IFV 0C
TORFBU-MWS-CX018.8
Page 1 of 1
Notes to Consolidated Financial Statements (Unaudited) – continued Note 10 – Variable Interest Entities and Off-Balance Sheet Arrangements SunTrust assists in providing liquidity to select corporate customers by directing them to a multi-seller commercial paper conduit, Three Pillars Funding LLC (“Three Pillars”). Three Pillars provides financing for direct purchases of financial assets originated and serviced by SunTrust’s corporate clients. Three Pillars finances this activity by issuing A-1/P-1 rated commercial paper. The result is a favorable funding arrangement for these SunTrust clients. In January 2003, the FASB issued FIN 46, “Consolidation of Variable Interest Entities,” which addressed the criteria for the consolidation of off-balance sheet entities similar to Three Pillars. Under the provisions of FIN 46, SunTrust consolidated Three Pillars as of July 1, 2003. In December 2003, the FASB issued a revision to FIN 46 (“FIN 46(R)”) which replaced the Interpretation issued in January 2003. FIN 46(R) is effective for reporting periods ending after March 15, 2004. As of March 31, 2004, the Company adopted all the provisions of FIN 46(R). On March 1, 2004, Three Pillars was restructured through the issuance of a subordinated note to a third party. Under the terms of the subordinated note, the holder of the note will absorb the majority of Three Pillars’ expected losses. The subordinated note investor therefore is Three Pillars’ primary beneficiary, and thus the Company is not required to consolidate Three Pillars. Due to the issuance of the subordinated note, the Company deconsolidated Three Pillars effective March 1, 2004. As of March 31, 2005 and December 31, 2004, Three Pillars had assets and liabilities not included on the Consolidated Balance Sheets of approximately $3.6 billion and $3.4 billion, respectively, consisting of primarily secured loans, marketable asset-backed securities, and short-term commercial paper liabilities. Activities related to the Three Pillars relationship generated fee revenue for the Company of approximately $5.5 million, and $4.9 million for the quarters ended March 31, 2005 and 2004, respectively. These activities include: client referrals and investment recommendations to Three Pillars; the issuing of a letter of credit, which provides partial credit protection to the commercial paper holders; and providing a majority of the temporary liquidity arrangements that would provide funding to Three Pillars in the event it can no longer issue commercial paper or in certain other circumstances. As of March 31, 2005, off-balance sheet liquidity commitments and other credit enhancements made by the Company to Three Pillars, which represent the Company’s maximum exposure to potential loss, totaled $6.1 billion and $572.9 million, respectively, compared to $5.9 billion and $548.7 million, respectively, as of December 31, 2004. The Company manages the credit risk associated with these commitments by subjecting them to the Company’s normal credit approval and monitoring processes. As part of its community reinvestment initiatives, the Company invests in multi-family Affordable Housing properties throughout its footprint as a limited and/or general partner. The Company receives Affordable Housing federal and state tax credits for these limited partner investments. Partnership assets of approximately $891.6 million and $884.2 million in partnerships where SunTrust is only a limited partner were not included in the Consolidated Balance Sheets at March 31, 2005 and December 31, 2004, respectively. The Company’s maximum exposure to loss for these partnerships at March 31, 2005 was $208.9 million, consisting of the limited partnership investments plus unfunded commitments.
17

ˆ1RGPMSXLJF8JY=G0Š1RGPMSXLJF8JY=G
86547 TX 18SUNTRUST BANKS, INC.10-Q
05-May-2005 13:02 ESTHTMRVA
RR Donnelley ProFile TOR shinv0dc 1*IFV 0C
TORFBU-MWS-CX018.8
Page 1 of 1
Notes to Consolidated Financial Statements (Unaudited) – continued SunTrust is the managing general partner of a number of non-registered investment limited partnerships which have been established to provide alternative investment strategies for its customers. In reviewing the partnerships for consolidation, SunTrust determined that these were voting interest entities and accordingly considered the consolidation guidance contained in SOP 78-9, “Accounting for Investments in Real Estate Ventures.” Under the terms of SunTrust’s non-registered investment limited partnerships, the limited partnerships have certain rights, such as those specifically indicated in SOP 78-9 (including the right to remove the general partner, or “kick-out rights”). As such, SunTrust, as the general partner, is precluded from consolidating the limited partnerships under the provisions of SOP 78-9. Note 11 - Guarantees The Company has undertaken certain guarantee obligations in the ordinary course of business. In following the provisions of FASB Interpretation No. 45, “Guarantor’s Accounting and Disclosure Requirements for Guarantees” (“FIN 45”), the Company must consider guarantees that have any of the following four characteristics (i) contracts that contingently require the guarantor to make payments to a guaranteed party based on changes in an underlying factor that is related to an asset, a liability, or an equity security of the guaranteed party; (ii) contracts that contingently require the guarantor to make payments to a guaranteed party based on another entity’s failure to perform under an obligating agreement; (iii) indemnification agreements that contingently require the indemnifying party to make payments to an indemnified party based on changes in an underlying factor that is related to an asset, a liability, or an equity security of the indemnified party; and (iv) indirect guarantees of the indebtedness of others. The issuance of a guarantee imposes an obligation for the Company to stand ready to perform, and should certain triggering events occur, it also imposes an obligation to make future payments. Payments may be in the form of cash, financial instruments, other assets, shares of stock, or provisions of the Company’s services. The following is a discussion of the guarantees that the Company has issued as of March 31, 2005, which have characteristics as specified by FIN 45. Letters of Credit Letters of credit are conditional commitments issued by the Company generally to guarantee the performance of a customer to a third party in borrowing arrangements, such as commercial paper, bond financing and similar transactions. The credit risk involved in issuing letters of credit is essentially the same as that involved in extending loan facilities to customers and may be reduced by selling participations to third parties. The Company issues letters of credit that are classified as financial standby, performance standby or commercial letters of credit. Commercial letters of credit are specifically excluded from the disclosure and recognition requirements of FIN 45. As of March 31, 2005 and December 31, 2004, the maximum potential amount of the Company’s obligation was $10.9 billion and $11.0 billion, respectively, for financial and performance standby letters of credit. The Company has recorded $108.3 million in other liabilities for unearned fees related to these letters of credit as of March 31, 2005. The Company’s outstanding letters of credit generally have a term of less than one year. If a letter of credit is drawn upon, the Company may seek recourse through the customer’s underlying line of credit. If the customer’s line of credit is also in default, the Company may take possession of the collateral securing the line of credit. Contingent Consideration The Company has contingent payment obligations related to certain business combination transactions. Payments are calculated using certain post-acquisition performance criteria. As of March 31, 2005, the
18
ˆ1RGPMSXLKPXZQMGdŠ1RGPMSXLKPXZQMG
86547 TX 19SUNTRUST BANKS, INC.10-Q
05-May-2005 21:59 ESTHTMRVA
RR Donnelley ProFile TOR desaj0dc 3*ESS 0C
CHWFBU-MWS-CX058.8.12
Page 1 of 1
Notes to Consolidated Financial Statements (Unaudited) – continued potential liability associated with these arrangements was approximately $162.1 million. As contingent consideration in a business combination is not subject to the recognition and measurement provisions of FIN 45, the Company currently has no amounts recorded for these potential liabilities as of March 31, 2005. If required, these contingent payments would be payable within the next five years. Other In the normal course of business, the Company enters into indemnification agreements and provides standard representations and warranties in connection with numerous transactions. These transactions include those arising from underwriting agreements, merger and acquisition agreements, loan sales, contractual commitments, and various other business transactions or arrangements. The extent of the Company’s obligations under these indemnification agreements depends upon the occurrence of future events; therefore, the Company’s potential future liability under these arrangements is not determinable. Third party investors hold Series B Preferred Stock in STB Real Estate Holdings (Atlanta), Inc. (“STBREH”), a subsidiary of SunTrust. The contract between STBREH and the third party investors contains an automatic exchange clause which, under certain circumstances, requires the Series B preferred shares to be automatically exchanged for guaranteed preferred beneficial interest in debentures of the Company. The guaranteed preferred beneficial interest in debentures are guaranteed to have a liquidation value equal to the sum of the issue price, $350 million, and an approximate yield of 8.5% per annum subject to reduction for any cash or property dividends paid to date. As of March 31, 2005 and December 31, 2004, $461.0 and $451.0 million was accrued in other liabilities for the principal and interest, respectively. This exchange agreement remains in effect as long as any shares of Series B Preferred Stock are owned by the third party investors, not to exceed 30 years. SunTrust Securities, Inc. (“STS”) and SunTrust Capital Markets, Inc. (“STCM”), broker-dealer affiliates of SunTrust, use a common third party clearing broker to clear and execute their customers’ securities transactions and to hold customer accounts. Under their respective agreements, STS and STCM agree to indemnify the clearing broker for losses that result from a customer’s failure to fulfill its contractual obligations. As the clearing broker’s rights to charge STS and STCM have no maximum amount, the Company believes that the maximum potential obligation cannot be estimated. However, to mitigate exposure, the affiliate may seek recourse from the customer through cash or securities held in the defaulting customers’ account. For the quarter ended March 31, 2005, SunTrust experienced minimal net losses as a result of the indemnity. The clearing agreements for STS and STCM expire in July 2005 and in December 2005, respectively. The Company has guarantees associated with credit default swaps, an agreement in which the buyer of protection pays a premium to the seller of the credit default swap for protection against an event of default. Events constituting default under such agreements that would result in the Company making a guaranteed payment to a counterparty may include (i) default of the referenced asset; (ii) bankruptcy of the customer; or (iii) restructuring or reorganization by the customer. The notional amount outstanding as of March 31, 2005 and December 31, 2004 is $768.0 million and $757.0 million, respectively. As of March 31, 2005, the notional amounts expire as follows: $50.0 million in 2005, $108.0 million in 2006, $50.0 million in 2007, $185.0 million in 2008, $154.0 million in 2009, $162.0 million in 2010, and $59.0 million in 2015. In the event of default under the contract, the Company would make a cash payment to the holder of credit protection and would take delivery of the referenced asset from which the Company may recover a portion of the credit loss. In addition, there are certain purchased credit default swap contracts that mitigate a portion of the Company’s exposure on written contracts. Such contracts are not included in this disclosure since they represent benefits to, rather than obligations of, the Company.
19

ˆ1RGPMSXLJF8V2ZG[Š1RGPMSXLJF8V2ZG
86547 TX 20SUNTRUST BANKS, INC.10-Q
05-May-2005 13:02 ESTHTMRVA
RR Donnelley ProFile TOR shinv0dc 1*IFV 0C
TORFBU-MWS-CX018.8
Page 1 of 1
Item 2. MANAGEMENT’S DISCUSSION AND ANALYSIS OF FINANCIAL CONDITION AND RESULTS OF OPERATIONS
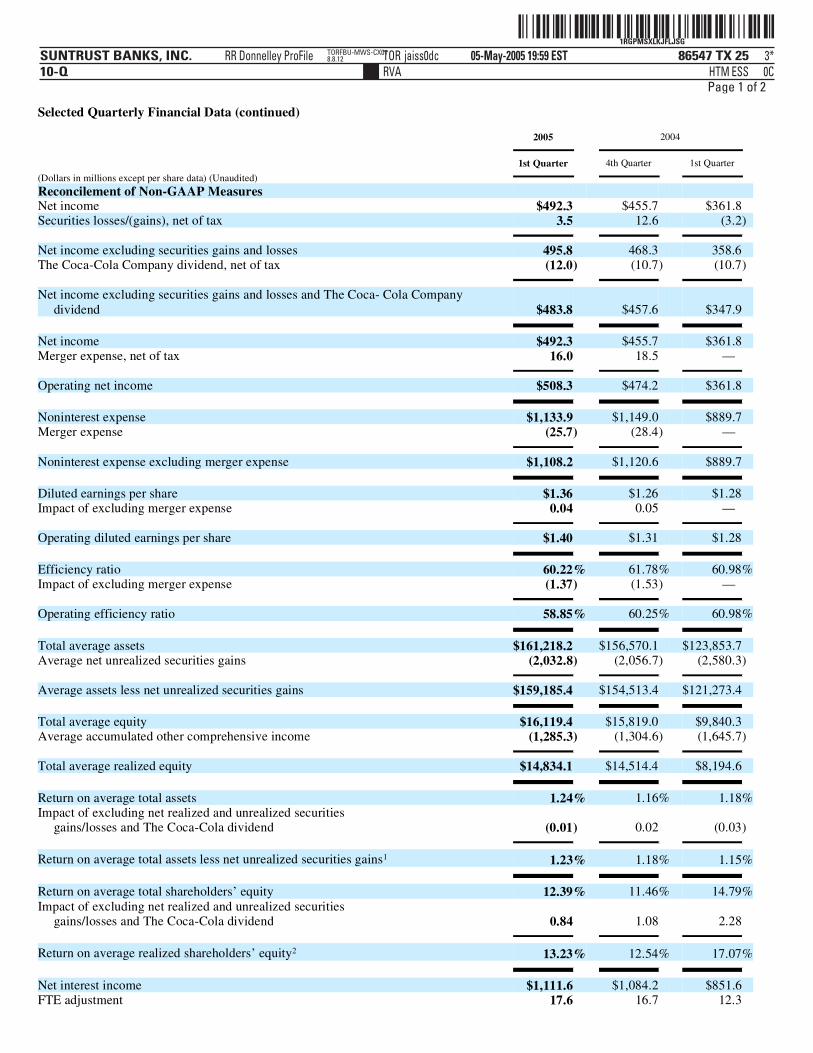
OVERVIEW SunTrust Banks, Inc. (“SunTrust” or the “Company”), one of the nation’s largest commercial banking organizations, is a financial holding company with its headquarters in Atlanta, Georgia. SunTrust’s principal banking subsidiaries, SunTrust Bank and National Bank of Commerce (“NBC”), offer a full line of financial services for consumers and businesses through their branches located primarily in Florida, Georgia, Maryland, Tennessee, North Carolina, South Carolina, Virginia and the District of Columbia. Within its geographic footprint, the Company operates under five business segments. These business segments are: Retail, Commercial, Corporate and Investment Banking (“CIB”), Wealth and Investment Management, and Mortgage. In addition to traditional deposit, credit and trust and investment services offered by SunTrust Bank and NBC, other SunTrust subsidiaries provide mortgage banking, credit-related insurance, asset management, securities brokerage and capital markets services. SunTrust has 1,693 full-service branches, including supermarket branches, and continues to leverage technology to provide customers the convenience of banking on the Internet, through 2,804 automated teller machines and via twenty-four hour telebanking. The following analysis of the financial performance of SunTrust for the first quarter of 2005 should be read in conjunction with the financial statements, notes and other information contained in this document and the 2004 Annual Report on Form 10-K. Certain reclassifications may be made to prior year financial statements and related information to conform them to the 2005 presentation. In Management’s Discussion, net interest income, net interest margin and the efficiency ratio are presented on a fully taxable-equivalent (“FTE”) basis and the ratios are presented on an annualized basis. The FTE basis adjusts for the tax-favored status of income from certain loans and investments. The Company believes this measure to be the preferred industry measurement of net interest income and provides relevant comparison between taxable and non-taxable amounts. The Company also presents operating diluted earnings per share and an operating efficiency ratio that exclude merger charges related to the NCF acquisition. The Company believes the exclusion of the merger charges, which represent incremental costs to integrate NCF’s operations, is more reflective of normalized operations. Additionally, the Company presents a return on average realized shareholders’ equity, as well as a return on average total shareholders’ equity (“ROE”). The Company also presents a return on average assets less net unrealized securities gains and a return on average total assets (“ROA”). The return on average realized shareholders’ equity and return on average assets less net unrealized securities gains exclude realized securities gains and losses, The Coca-Cola dividend, and net unrealized securities gains. Due to its ownership of approximately 48 million shares of common stock of The Coca-Cola Company, resulting in an unrealized net gain of $2.0 billion as of March 31, 2005, the Company believes ROA and ROE excluding these impacts from the Company’s securities portfolio is the more comparative performance measure when being evaluated against other companies. The information provided herein may contain estimates of future operating results for SunTrust. These estimates constitute forward-looking statements (within the meaning of the Private Securities Litigation Reform Act of 1995) which involve significant risks and uncertainties. The forward looking statements are intended to be subject to the safe harbor protection provided by Section 27A of the Securities Act of 1933 and Section 21E of the Securities Exchange Act of 1934. Forward-looking statements include statements preceded by, followed by or that include the words “intends,” “believes,” “expects,” “anticipates,” “plans,” “estimates,” or similar expressions or future conditional verbs such as “will,” “should,” “would,” and “could.” Actual results could differ materially from those contained in or implied by such statements for a variety of reasons including, but not limited to: changes in interest rates, changes in accounting principles,
20
ˆ1RGPMSXLKK5XR3GrŠ1RGPMSXLKK5XR3G
86547 TX 21SUNTRUST BANKS, INC.10-Q
05-May-2005 20:14 ESTHTMRVA
RR Donnelley ProFile TOR dhayk0dc 2*ESS 0C
TORFBU-MWS-CX058.8.12
Page 1 of 1
policies, or guidelines, significant changes in the economic scenario, significant changes in legislation or regulatory requirements, changes in business conditions or the banking competitive environment, significant changes in securities markets, and litigation risks. SunTrust does not undertake to update forward-looking statements to reflect circumstances or events that occur after the date the forward-looking statements are made. CRITICAL ACCOUNTING POLICIES The Company’s accounting policies are integral to understanding Management’s Discussion of results of operations and financial condition. Accounting policies are described in detail in Note 1 to the Consolidated Financial Statements included in the Annual Report on Form 10-K for the year ended December 31, 2004. Management has identified certain accounting policies as being critical because they require management’s judgment to ascertain the valuations of assets, liabilities, commitments and contingencies. A variety of factors could affect the ultimate value that is obtained either when earning income, recognizing an expense, recovering an asset or reducing a liability. The Company has established detailed policies and control procedures that are intended to provide a reasonable assurance that these critical accounting estimates are well controlled and applied consistently from period to period. In addition, the policies and procedures are intended to provide a reasonable assurance that the process for changing methodologies occurs in an appropriate manner. The following is a description of the Company’s current accounting policies that are considered to involve significant management valuation judgments. Allowance for Loan and Lease Losses (“ALLL”) The ALLL represents the Allowance for Loan and Lease Losses Committee’s (“ALLL Committee”) estimate of probable losses inherent in the existing loan portfolio. The ALLL is increased by the provision for loan losses charged to expense and reduced by loans charged off, net of recoveries. The ALLL is determined based on management’s assessment of reviews and evaluations of larger loans that meet the Company’s definition of impairment and the size and current risk characteristics of pools of homogeneous loans, i.e., loans having similar risk characteristics, within the portfolio. In the fourth quarter of 2004, the Company identified a material weakness in internal control over financial reporting related to establishing the ALLL. The Controls and Procedures section on pages 51 through 52 provides further discussion surrounding this material weakness in internal control over financial reporting. Impaired loans include loans classified as nonaccrual, except for smaller balance homogeneous loans, where it is probable that SunTrust will be unable to collect the scheduled payments of principal and interest according to the contractual terms of the loan agreement. When a loan is deemed impaired, the amount of allowance required is measured by a careful analysis of the most probable source of repayment, including the present value of the loan’s expected future cash flow, the fair value of the underlying collateral less costs of disposition, or the loan’s estimated market value. In these measurements, management uses assumptions and methodologies that are relevant to estimating the level of impaired and unrealized, but inherent, losses in the portfolio. To the extent that the data supporting such assumptions and methodologies are continuously evolving, management’s judgment and experience play a key role in enhancing the ALLL process over time. The ALLL Committee estimates probable losses inherent in pools of loans that have similar risk characteristics by an evaluation of several factors: historical loss experience, current internal risk ratings based on the Company’s internal risk rating system, internal portfolio trends such as increasing or decreasing levels of delinquencies and concentrations, and external influences such as changes in economic or industry conditions. The Company’s financial results are substantially influenced by the Company’s process for determining an appropriate level for its ALLL. This process involves management’s analysis of complex internal and
21

ˆ1RGPMSXLKKBD4ZGFŠ1RGPMSXLKKBD4ZG
86547 TX 22SUNTRUST BANKS, INC.10-Q
05-May-2005 20:16 ESTHTMRVA
RR Donnelley ProFile TOR dhayk0dc 2*ESS 0C
TORFBU-MWS-CX058.8.12
Page 1 of 1
external variables, and it requires that management exercise subjective judgment to estimate an appropriate allowance level. As a result of the uncertainty associated with this subjectivity, the Company cannot assure the precision of the amount reserved, should it experience sizeable loan or lease losses in any particular period. For example, changes in the financial condition of individual borrowers, economic conditions, historical loss experience, or the condition of various markets in which collateral may be sold could require the Company to significantly decrease or increase the level of the ALLL and the associated provision for loan losses. Such an adjustment could materially benefit or adversely affect net income. For additional discussion of the allowance for loan and lease losses, see pages 30 through 31. Estimates of Fair Value Fair value is defined as the amount at which a financial instrument could be exchanged in a transaction between willing, unrelated parties in a normal business transaction. The estimation of fair value is significant to a number of SunTrust’s assets and liabilities, including loans held for sale, investment securities, mortgage servicing rights (“MSRs”), other real estate owned (“OREO”), other repossessed assets, retirement and post retirement benefit obligations, as well as assets and liabilities associated with derivative financial instruments. These are all recorded at either fair value or at the lower of cost or fair value. Fair value is based on quoted market prices for the same instrument or for similar instruments adjusted for any differences in terms. If market prices are not available, then fair value is estimated using modeling techniques such as discounted cash flow analyses. In instances where required by accounting principles generally accepted in the United States, the Company uses discount rates in its determination of the fair value of certain assets and liabilities such as retirement and postretirement benefit obligations and mortgage servicing rights. The fair values of mortgage servicing rights are based on discounted cash flow analyses utilizing dealer consensus prepayment speeds and market discount rates. A change in the discount rate could increase or decrease the values of those assets and liabilities. Discount rates used are those considered to be commensurate with the risks involved. Fair values for investment securities and most derivative financial instruments are based on quoted market prices. If quoted market prices are not available, fair values are based on the quoted prices of similar instruments. The fair values of loans held for sale are based on anticipated liquidation values. The fair values of OREO and other repossessed assets are typically determined based on appraisals by third parties, less estimated selling costs. Changes in the assumptions used to value these assets and liabilities, such as prepayment speeds or market interest rates, could result in an increase or decrease in fair value and could result in either a beneficial or adverse impact on the financial results. Estimates of fair value are also required in performing an impairment analysis of goodwill. The Company reviews goodwill for impairment on an annual basis, or more often if events or circumstances indicate the carrying value may not be recoverable. An impairment would be indicated if the carrying value of goodwill of a reporting unit exceeds the fair value of a reporting unit. In determining the fair value of SunTrust’s reporting units, management uses discounted cash flow models which require assumptions about the Company’s revenue growth rate and the cost of equity. ACCOUNTING POLICIES ADOPTED For the three months ended March 31, 2005, the Company adopted the provisions of SOP 03-3, “Accounting for Loans or Certain Debt Securities Acquired in a Transfer.” The provisions of this pronouncement and the related impact to the Company are discussed in the Accounting Policies Adopted section of Note 3 to the Consolidated Financial Statements on page 9. Additionally, recently issued and pending accounting pronouncements are discussed beginning on page 9.
22

ˆ1RGPMSXLJF937YG*Š1RGPMSXLJF937YG
86547 TX 23SUNTRUST BANKS, INC.10-Q
05-May-2005 13:02 ESTHTMRVA
RR Donnelley ProFile TOR shinv0dc 1*IFV 0C
TORFBU-MWS-CX018.8
Page 1 of 1
EARNINGS OVERVIEW SunTrust reported earnings of $492.3 million for the first quarter of 2005, an increase of $130.5 million, or 36.1%, compared to the same period of the prior year. Approximately $82.8 million of the increase was related to the acquisition of NCF. Reported diluted earnings per share were $1.36 and $1.28 for the three months ended March 31, 2005 and 2004, respectively. Operating diluted earnings per share, which excluded $16.0 million of after-tax merger charges, was $1.40 for the first quarter of 2005. Included in the net income and operating income per diluted share for the first quarter of 2005 was a net gain on the sale of factoring assets from RCM. The net gain on a pre-tax basis was $19.9 million and on an after-tax basis was $12.3 million, and it accounted for a $0.03 increase in net income and operating net income per diluted share in the first quarter of 2005. Net interest income increased $265.3 million, or 30.7%, from the first quarter of 2004. Approximately $202.0 million of the increase was related to the acquisition of NCF. Also positively impacting net interest income were higher earning assets and the impact of higher interest rates. Average earning assets increased $29.8 billion, or 26.9%, from the first quarter of 2004. The NCF acquisition contributed approximately $21.4 billion of the increase. Provision for loan losses was $10.6 million in the first quarter of 2005, a decrease of $43.3 million, or 80.4%, from the first quarter of 2004. The decline was primarily attributed to an improvement in credit quality in both the consumer and commercial loan portfolios as well as the sale of RCM assets. Total noninterest income was $753.8 million for the first quarter of 2005, an increase of $158.7 million, or 26.7%, from the same period of the prior year. Approximately $84.3 million of the increase was attributable to NCF. Included in noninterest income for the first quarter of 2005 was the $19.9 million net gain on the sale of RCM factoring assets. Improvements in investment banking and trading income, trust and investment management income and other charges and fees also contributed to the increase. Also positively impacting noninterest income was a $35.9 million, or 77.5%, increase in other noninterest income, of which approximately $17.7 million was related to NCF. The remaining increase was primarily due to $23.1 million increase in combined mortgage production and servicing income. Realized security gains declined $10.6 million compared to the first quarter of 2004. Total noninterest expense was $1,133.9 million for the first quarter of 2005, an increase of $244.2 million, or 27.4%, from the same period of the prior year. Approximately $149.2 million of the increase was attributable to NCF, including $25.7 million of merger expenses for operations and systems integration. Personnel expenses in the first quarter of 2005 increased $128.0 million, or 25.3%, from the prior year period. Approximately $70.6 million of the increase was due to the acquisition of NCF. The remaining increase was primarily attributed to a higher historical SunTrust headcount, normal merit increases and increased incentive based payments. The acquisition of NCF was the primary driver of increases in outside processing and software, net occupancy expense, amortization of intangible assets, and other noninterest expense.
23

ˆ1RGPMSXLN21=BFGŠ1RGPMSXLN21=BFG
86547 TX 24SUNTRUST BANKS, INC.10-Q
06-May-2005 15:01 ESTHTMRVA
RR Donnelley ProFile TOR panda0dcSTART PAGE
3*ESS 0C
TORFBU-MWS-CX018.8.12
Page 1 of 1
24
Selected Quarterly Financial Data Table 1
2005
2004
(Dollars in millions except per share data) (Unaudited)
1st Quarter
4th Quarter
1st Quarter
Summary of Operations
Interest and dividend income $1,716.0 $1,604.3 $1,173.8 Interest expense 604.4 520.1 322.2
Net interest income 1,111.6 1,084.2 851.6 Provision for loan losses 10.6 37.1 53.8 Net interest income after provision for loan losses 1,101.0 1,047.1 797.8 Noninterest income 753.8 759.0 595.1 Noninterest expense 1,133.9 1,149.0 889.7
Income before provision for income taxes 720.9 657.1 503.2 Provision for income taxes 228.6 201.4 141.4
Net income $492.3 $455.7 $361.8
Net interest income-FTE $1,129.2 $1,100.9 $863.9 Total revenue 1,883.0 1,859.9 1,459.0
Per Common Share
Diluted $1.36 $1.26 $1.28 Basic 1.37 1.27 1.29
Dividends declared 0.55 0.50 0.50 Book value 44.59 44.30 35.75 Market price:
High 74.18 74.38 76.65 Low 69.00 67.03 68.04 Close 72.07 73.88 69.71
Selected Average Balances
Total assets $161,218.2 $156,570.1 $123,853.7 Earning assets 140,852.8 136,450.4 111,038.2 Loans 103,215.8 100,137.5 79,904.9 Consumer and commercial deposits 90,967.8 90,601.5 70,361.0 Brokered and foreign deposits 13,424.4 10,670.5 10,000.6 Shareholders’ equity 16,119.4 15,819.0 9,840.3 Common shares - diluted (thousands) 363,138 362,661 283,523 Common shares - basic (thousands) 358,253 357,524 279,523
Financial Ratios (Annualized)
Return on average total assets 1.24 % 1.16% 1.18 %Return on average assets less net unrealized securities gains 1.23 1.18 1.15 Return on average total shareholders’ equity 12.39 11.46 14.79 Return on average realized shareholders’ equity 13.23 12.54 17.07 Net interest margin 3.25 3.21 3.13 Efficiency ratio 60.22 61.78 60.98
ˆ1RGPMSXLKJFLJSGOŠ1RGPMSXLKJFLJSG
86547 TX 25SUNTRUST BANKS, INC.10-Q
05-May-2005 19:59 ESTHTMRVA
RR Donnelley ProFile TOR jaiss0dc 3*ESS 0C
TORFBU-MWS-CX018.8.12
Page 1 of 2
Selected Quarterly Financial Data (continued)
2005
2004
(Dollars in millions except per share data) (Unaudited)
1st Quarter
4th Quarter
1st Quarter
Reconcilement of Non-GAAP Measures
Net income $492.3 $455.7 $361.8 Securities losses/(gains), net of tax 3.5 12.6 (3.2)
Net income excluding securities gains and losses 495.8 468.3 358.6 The Coca-Cola Company dividend, net of tax (12.0) (10.7) (10.7) Net income excluding securities gains and losses and The Coca- Cola Company
dividend $483.8 $457.6 $347.9
Net income $492.3 $455.7 $361.8 Merger expense, net of tax 16.0 18.5 —
Operating net income $508.3 $474.2 $361.8
Noninterest expense $1,133.9 $1,149.0 $889.7 Merger expense (25.7) (28.4) —
Noninterest expense excluding merger expense $1,108.2 $1,120.6 $889.7
Diluted earnings per share $1.36 $1.26 $1.28 Impact of excluding merger expense 0.04 0.05 —
Operating diluted earnings per share $1.40 $1.31 $1.28
Efficiency ratio 60.22 % 61.78% 60.98 %Impact of excluding merger expense (1.37) (1.53) — Operating efficiency ratio 58.85 % 60.25% 60.98 %
Total average assets $161,218.2 $156,570.1 $123,853.7 Average net unrealized securities gains (2,032.8) (2,056.7) (2,580.3)
Average assets less net unrealized securities gains $159,185.4 $154,513.4 $121,273.4
Total average equity $16,119.4 $15,819.0 $9,840.3 Average accumulated other comprehensive income (1,285.3) (1,304.6) (1,645.7) Total average realized equity $14,834.1 $14,514.4 $8,194.6
Return on average total assets 1.24 % 1.16% 1.18 %Impact of excluding net realized and unrealized securities
gains/losses and The Coca-Cola dividend (0.01) 0.02 (0.03)
Return on average total assets less net unrealized securities gains1 1.23 % 1.18% 1.15 % Return on average total shareholders’ equity 12.39 % 11.46% 14.79 %Impact of excluding net realized and unrealized securities
gains/losses and The Coca-Cola dividend 0.84 1.08 2.28
Return on average realized shareholders’ equity2 13.23 % 12.54% 17.07 %
Net interest income $1,111.6 $1,084.2 $851.6 FTE adjustment 17.6 16.7 12.3

ˆ1RGPMSXLKJFLJSGOŠ1RGPMSXLKJFLJSG
86547 TX 25SUNTRUST BANKS, INC.10-Q
05-May-2005 19:59 ESTHTMRVA
RR Donnelley ProFile TOR jaiss0dc 3*ESS 0C
TORFBU-MWS-CX018.8.12
Page 2 of 2
Net interest income - FTE 1,129.2 1,100.9 863.9 Noninterest income 753.8 759.0 595.1 Total revenue 1,883.0 1,859.9 1,459.0 Securities losses/(gains) 5.7 19.4 (4.9)
Total revenue excluding securities gains and losses $1,888.7 $1,879.3 $1,454.1
1 Computed by dividing annualized net income, excluding tax effected securities gains and losses, by average assets less net unrealized gains on securities.
25
2 Computed by dividing annualized net income, excluding tax effected securities gains and losses, by average realized shareholder’s equity.
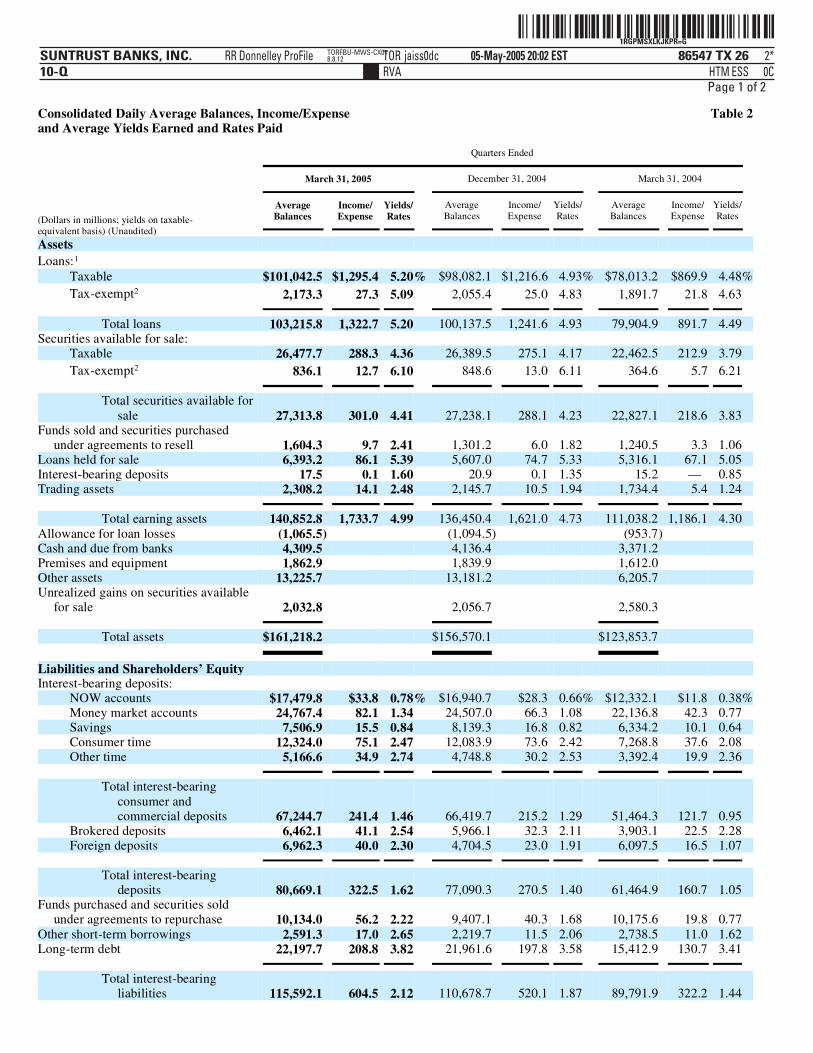
ˆ1RGPMSXLKJKPR=GQŠ1RGPMSXLKJKPR=G
86547 TX 26SUNTRUST BANKS, INC.10-Q
05-May-2005 20:02 ESTHTMRVA
RR Donnelley ProFile TOR jaiss0dc 2*ESS 0C
TORFBU-MWS-CX018.8.12
Page 1 of 2
and Average Yields Earned and Rates Paid
Consolidated Daily Average Balances, Income/Expense Table 2
Quarters Ended
March 31, 2005
December 31, 2004
March 31, 2004
(Dollars in millions; yields on taxable- equivalent basis) (Unaudited)
Average Balances
Income/ Expense
Yields/Rates
Average Balances
Income/Expense
Yields/Rates
Average Balances
Income/ Expense
Yields/Rates
Assets
Loans:1 Taxable $101,042.5 $1,295.4 5.20% $98,082.1 $1,216.6 4.93% $78,013.2 $869.9 4.48%Tax-exempt2 2,173.3 27.3 5.09 2,055.4 25.0 4.83 1,891.7 21.8 4.63
Total loans 103,215.8 1,322.7 5.20 100,137.5 1,241.6 4.93 79,904.9 891.7 4.49 Securities available for sale:
Taxable 26,477.7 288.3 4.36 26,389.5 275.1 4.17 22,462.5 212.9 3.79 Tax-exempt2 836.1 12.7 6.10 848.6 13.0 6.11 364.6 5.7 6.21
Total securities available for
sale 27,313.8 301.0 4.41 27,238.1 288.1 4.23 22,827.1 218.6 3.83 Funds sold and securities purchased
under agreements to resell 1,604.3 9.7 2.41 1,301.2 6.0 1.82 1,240.5 3.3 1.06 Loans held for sale 6,393.2 86.1 5.39 5,607.0 74.7 5.33 5,316.1 67.1 5.05 Interest-bearing deposits 17.5 0.1 1.60 20.9 0.1 1.35 15.2 — 0.85 Trading assets 2,308.2 14.1 2.48 2,145.7 10.5 1.94 1,734.4 5.4 1.24
Total earning assets 140,852.8 1,733.7 4.99 136,450.4 1,621.0 4.73 111,038.2 1,186.1 4.30 Allowance for loan losses (1,065.5) (1,094.5) (953.7)
Cash and due from banks 4,309.5 4,136.4 3,371.2
Premises and equipment 1,862.9 1,839.9 1,612.0
Other assets 13,225.7 13,181.2 6,205.7
Unrealized gains on securities available for sale 2,032.8 2,056.7 2,580.3
Total assets $161,218.2 $156,570.1 $123,853.7
Liabilities and Shareholders’ Equity
Interest-bearing deposits:
NOW accounts $17,479.8 $33.8 0.78% $16,940.7 $28.3 0.66% $12,332.1 $11.8 0.38%Money market accounts 24,767.4 82.1 1.34 24,507.0 66.3 1.08 22,136.8 42.3 0.77 Savings 7,506.9 15.5 0.84 8,139.3 16.8 0.82 6,334.2 10.1 0.64 Consumer time 12,324.0 75.1 2.47 12,083.9 73.6 2.42 7,268.8 37.6 2.08 Other time 5,166.6 34.9 2.74 4,748.8 30.2 2.53 3,392.4 19.9 2.36
Total interest-bearing
consumer and commercial deposits 67,244.7 241.4 1.46 66,419.7 215.2 1.29 51,464.3 121.7 0.95
Brokered deposits 6,462.1 41.1 2.54 5,966.1 32.3 2.11 3,903.1 22.5 2.28 Foreign deposits 6,962.3 40.0 2.30 4,704.5 23.0 1.91 6,097.5 16.5 1.07
Total interest-bearing deposits 80,669.1 322.5 1.62 77,090.3 270.5 1.40 61,464.9 160.7 1.05
Funds purchased and securities sold under agreements to repurchase 10,134.0 56.2 2.22 9,407.1 40.3 1.68 10,175.6 19.8 0.77
Other short-term borrowings 2,591.3 17.0 2.65 2,219.7 11.5 2.06 2,738.5 11.0 1.62 Long-term debt 22,197.7 208.8 3.82 21,961.6 197.8 3.58 15,412.9 130.7 3.41
Total interest-bearing liabilities 115,592.1 604.5 2.12 110,678.7 520.1 1.87 89,791.9 322.2 1.44

ˆ1RGPMSXLKJKPR=GQŠ1RGPMSXLKJKPR=G
86547 TX 26SUNTRUST BANKS, INC.10-Q
05-May-2005 20:02 ESTHTMRVA
RR Donnelley ProFile TOR jaiss0dc 2*ESS 0C
TORFBU-MWS-CX018.8.12
Page 2 of 2
Noninterest-bearing deposits 23,723.1 24,181.7 18,896.7
Other liabilities 5,783.6 5,890.7 5,324.8
Shareholders’ equity 16,119.4 15,819.0 9,840.3
Total liabilities and shareholders’ equity $161,218.2 $156,570.1 $123,853.7
Interest rate spread 2.87% 2.86% 2.86%
Net Interest Income3 $1,129.2 $1,100.9 $863.9
Net Interest Margin 3.25% 3.21% 3.13%
1 Interest income includes loan fees of $29.5 million, $36.0 million, and $27.8 million in the quarters ended March 31, 2005, December 31, 2004 and March 31, 2004, respectively. Nonaccrual loans are included in average balances and income on such loans, if recognized, is recorded on a cash basis.
2 Interest income includes the effects of taxable-equivalent adjustments using a federal income tax rate of 35% and, where applicable, state income taxes to increase tax-exempt interest income to a taxable-equivalent basis. The net taxable-equivalent adjustment amounts included in the above table aggregated $17.7 million, $16.7 million, and $12.3 million in the quarters ended March 31, 2005, December 31, 2004 and March 31, 2004, respectively.
26
3 Derivative instruments used to help balance the Company’s interest-sensitivity position increased net interest income $37.6 million, $40.5 million, and $32.4 million in the quarters ended March 31, 2005, December 31, 2004 and March 31, 2004, respectively.

ˆ1RGPMSXLJF9HGKGdŠ1RGPMSXLJF9HGKG
86547 TX 27SUNTRUST BANKS, INC.10-Q
05-May-2005 13:02 ESTHTMRVA
RR Donnelley ProFile TOR shinv0dc 1*IFV 0C
TORFBU-MWS-CX018.8
Page 1 of 1
CONSOLIDATED FINANCIAL PERFORMANCE Net Interest Income/Margin Net interest income was $1,129.2 million for the first quarter of 2005, an increase of $265.3 million or 30.7%, from the first quarter of 2004. The NCF merger accounted for approximately $202.0 million, or 76.1%, of this increase. Net interest income also benefited from higher earning assets and the impact of higher rates. The net interest margin increased 12 basis points from 3.13% in the first quarter of 2004 to 3.25% in the first quarter of 2005. The merger contributed approximately 10 basis points to the net interest margin improvement. In addition to the merger, the Company consolidated Three Pillars, a multi-seller commercial paper conduit, to comply with FIN 46 in July 2003, and deconsolidated Three Pillars on March 1, 2004. The deconsolidation accounted for four basis points of the net interest margin improvement compared to 2004. The earning asset yield for the first quarter of 2005 increased 69 basis points from the first quarter of 2004. Loan yield increased 71 basis points and securities available for sale yield increased 58 basis points from the prior year. In the first quarter of 2005, the total interest-bearing liability costs increased 68 basis points from the first quarter of 2004. As the increase in earning asset yield was largely offset by a corresponding increase in interest-bearing liability costs, the quarter-over-quarter improvement was primarily attributable to the NCF acquisition and the deconsolidation of Three Pillars noted above. The remaining change in the margin was negatively affected by a number of other factors. The Company’s balance sheet is positioned to benefit from rising rates and a steeper yield curve. While short-term interest rates have risen for much of the last year, the yield curve has flattened considerably. Incremental asset growth has therefore come on at higher yields, but at tighter spreads to Fed Funds. Average earning assets were up 26.9% and average interest-bearing liabilities increased 28.7% for the first quarter of 2005 versus the first quarter of 2004. Average loans increased $23.3 billion, or 29.2%, securities available for sale increased $4.5 billion, or 19.7%, and loans held for sale increased $1.1 billion, or 20.3%, in the first quarter of 2005 compared to the first quarter of 2004. The acquisition of NCF contributed $14.8 billion of the increase in total loans and $6.2 billion of the increase in securities available for sale. The Company continued to take steps to obtain alternative lower cost funding sources, such as developing initiatives to grow customer deposits. Campaigns to attract customer deposits were implemented in 2004. The Company believes that deposit growth has also benefited from the volatility in the financial markets. Average NOW accounts increased 41.7%, savings increased 18.5%, and demand deposits increased 25.5% in the first quarter of 2005 versus the first quarter of 2004. The NCF merger contributed approximately 60% of the increase in the lower cost funding for the year. Interest income that the Company was unable to recognize on nonperforming loans had a negative one basis point impact in 2005. There was no impact for the first quarter of 2004. Table 2 contains more detailed information concerning average balances, yields and rates paid. Noninterest Income Noninterest income increased $158.7 million, or 26.7%, from the first quarter of 2004. Approximately $84.3 million of the increase was attributable to NCF. Also included in the first quarter of 2005, was the net gain on the sale of RCM factoring assets, which totaled $19.9 million. Other factors positively impacting noninterest income were increases in investment banking and trading income and trust and investment management income. Trust and investment management income increased $28.3 million, or 20.8%, for the first quarter of 2005 compared to the first quarter of 2004. Assets under management increased $28.5 billion, or 28.4%, from the
27

ˆ1RGPMSXLKPYY75G+Š1RGPMSXLKPYY75G
86547 TX 28SUNTRUST BANKS, INC.10-Q
05-May-2005 22:01 ESTHTMRVA
RR Donnelley ProFile TOR desaj0dc 3*ESS 0C
CHWFBU-MWS-CX058.8.12
Page 1 of 1
first quarter of 2004, to approximately $128.9 billion. The acquisitions of NCF and substantially all of the assets of Seix Investment Advisors, Inc. contributed approximately $2.4 billion and $16.9 billion, respectively, of the increase in assets under management. The remaining increase was due to net new business and equity markets increasing slightly, the effect of which was somewhat offset by a decrease in the bond market caused by higher interest rates. SunTrust’s total assets under advisement were approximately $228.9 billion, which included $128.9 billion in assets under management, $26.1 billion in non-managed corporate trust assets, $45.8 billion in non-managed trust assets, and $28.1 billion in retail brokerage assets. Service charges on deposit accounts increased $20.9 million, or 12.8%, from the first quarter of 2004; however approximately $30.0 million of the overall increase was due to the addition of NCF. On a historical SunTrust basis, services charges on deposit accounts decreased $9.1 million due to the rise in interest rates, which reduced account analysis fees, as well as a decline in non-sufficient funds fees. Retail investment income increased $9.4 million, or 20.6%, for the first quarter of 2005 compared to the first quarter of 2004, as the wealth management segment maintained sales momentum in new business. Other charges and fees increased $18.6 million, or 20.1%, from the first quarter of 2004 to the first quarter of 2005, primarily due to NCF. Card fees increased $16.5 million, or 51.9%, from the first quarter of 2004 due to increases in commercial credit card interchange volume as well as the addition of NCF. Combined trading account profits and commissions and investment banking income, SunTrust’s capital markets revenue sources, increased $19.9 million, or 26.8%, compared to the same period of the prior year. The NCF acquisition contributed approximately $8.7 million of the increase. The remainder of the increase was primarily due to growth in the equity capital markets business, which was driven by merger and acquisition fees and advisory fees. Other noninterest income increased $35.9 million, or 77.5%, from the first quarter of 2004. Approximately $17.7 million of the increase was due to NCF. Combined mortgage production and servicing income increased $23.1 million compared to the first quarter of 2004. Mortgage servicing related income increased $13.4 million primarily due to a decline in amortization of mortgage servicing rights related to a decline in mortgage prepayments. Mortgage production income increased $9.7 million compared to the first quarter of 2004 due to increased sales in the secondary market and an increase in production volume compared to the first quarter of 2004. The Company incurred net securities losses during first quarter of 2005 of $5.7 million compared to net securities gains of $4.9 million in first quarter 2004.
28
Noninterest Income Table 3
Three Months Ended March 31
% Change
(Dollars in millions) (Unaudited)
2005
2004
Service charges on deposit accounts $184.1 $163.2 12.8 Trust and investment management income 164.5 136.2 20.8 Retail investment services 55.1 45.7 20.6 Other charges and fees 111.4 92.7 20.1 Investment banking income 50.0 44.8 11.6 Trading account profits and commissions 44.0 29.4 49.9 Card fees 48.2 31.7 51.9 Securities (losses)/gains (5.7) 4.9 (214.9)Net gain on sale of RCM assets 19.9 — 100.0 Other noninterest income 82.3 46.5 77.5
Total noninterest income $753.8 $595.1 26.7
ˆ1RGPMSXLKJNRD=G;Š1RGPMSXLKJNRD=G
86547 TX 29SUNTRUST BANKS, INC.10-Q
05-May-2005 20:04 ESTHTMRVA
RR Donnelley ProFile TOR jaiss0dc 2*ESS 0C
TORFBU-MWS-CX018.8.12
Page 1 of 1
Noninterest Expense Noninterest expense increased $244.2 million, or 27.4%, compared to 2004. Approximately, $149.2 million of the increase was attributed to the acquisition of NCF including $25.7 million of merger related expenses for operations and systems integration. Compared to 2004, total personnel expense increased $128.0 million, or 25.3%, of which approximately $70.6 million was due to the acquisition of NCF. The remainder of the increase was primarily due to increased historical SunTrust headcount, normal merit increases and increased incentive costs. Headcount increased from 27,802 as of March 31, 2004, to 33,139 at March 31, 2005, and included approximately 4,257 due to the acquisition of NCF. The increase in incentives was primarily due to an increase in commission and performance based incentives related to the acquisition of NCF and strong business volumes across all lines of business. Net occupancy expense increased $14.0 million, or 22.6%, compared to March 31, 2004, primarily due to the NCF acquisition. Noninterest expense was further impacted by a $17.2 million, or 26.2%, increase in outside processing and software expense primarily due to higher processing fees and higher software amortization and maintenance expense. The increase in outside processing and software expense included approximately $6.9 million related to the NCF acquisition. Amortization of intangible assets increased $15.6 million, or 99.6%, compared to the three months ended March 31, 2004. The increase was primarily attributable to the acquisition of NCF and related amortization of core deposit intangibles. Total amortization of NCF core deposit intangibles in the first quarter of 2005 amounted to $14.8 million. Other noninterest expense increased $14.0 million, or 18.9%, compared to the three months ended March 31, 2004 and was primarily driven by the acquisition of NCF. The efficiency ratio decreased to 60.22% as of March 31, 2005 compared to 60.98% as of March 31, 2004. On an operating basis, which excludes merger expenses, the efficiency ratio was 58.85% as of March 31, 2005.
29
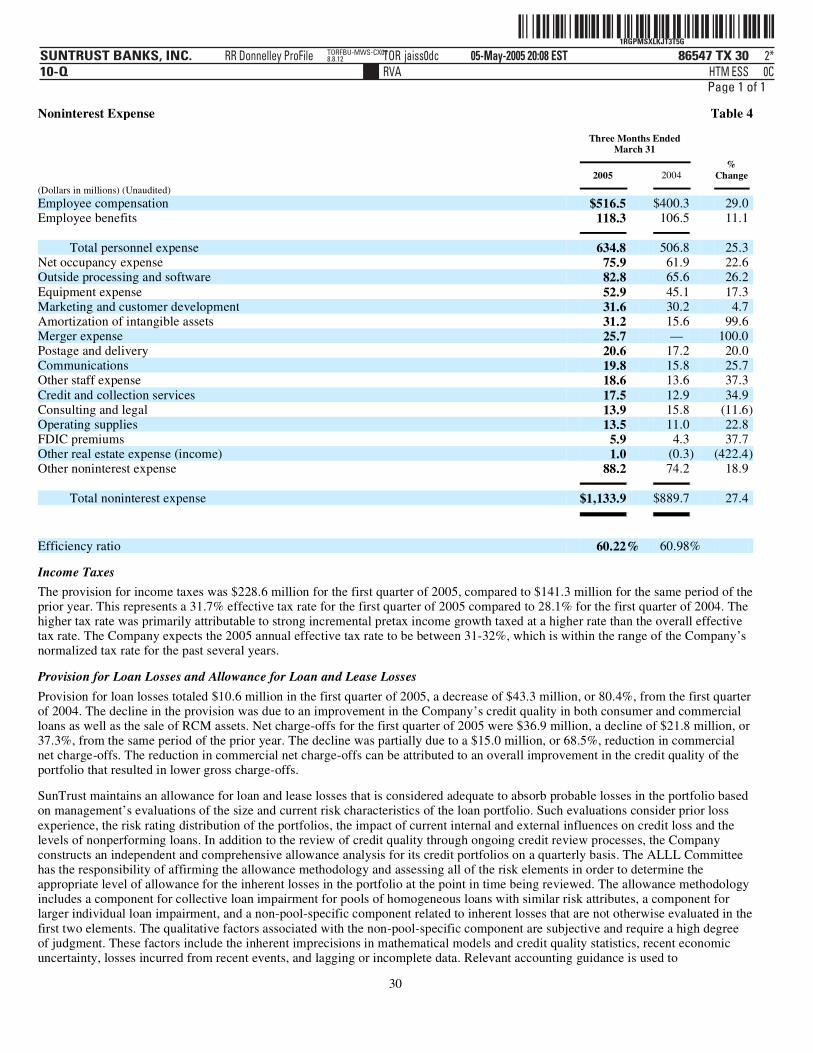
ˆ1RGPMSXLKJT3T5G7Š1RGPMSXLKJT3T5G
86547 TX 30SUNTRUST BANKS, INC.10-Q
05-May-2005 20:08 ESTHTMRVA
RR Donnelley ProFile TOR jaiss0dc 2*ESS 0C
TORFBU-MWS-CX018.8.12
Page 1 of 1
Income Taxes
Noninterest Expense Table 4
Three Months Ended March 31
%Change
(Dollars in millions) (Unaudited)
2005
2004
Employee compensation $516.5 $400.3 29.0 Employee benefits 118.3 106.5 11.1
Total personnel expense 634.8 506.8 25.3 Net occupancy expense 75.9 61.9 22.6 Outside processing and software 82.8 65.6 26.2 Equipment expense 52.9 45.1 17.3 Marketing and customer development 31.6 30.2 4.7 Amortization of intangible assets 31.2 15.6 99.6 Merger expense 25.7 — 100.0 Postage and delivery 20.6 17.2 20.0 Communications 19.8 15.8 25.7 Other staff expense 18.6 13.6 37.3 Credit and collection services 17.5 12.9 34.9 Consulting and legal 13.9 15.8 (11.6)Operating supplies 13.5 11.0 22.8 FDIC premiums 5.9 4.3 37.7 Other real estate expense (income) 1.0 (0.3) (422.4)Other noninterest expense 88.2 74.2 18.9
Total noninterest expense $1,133.9 $889.7 27.4
Efficiency ratio 60.22% 60.98%
The provision for income taxes was $228.6 million for the first quarter of 2005, compared to $141.3 million for the same period of the prior year. This represents a 31.7% effective tax rate for the first quarter of 2005 compared to 28.1% for the first quarter of 2004. The higher tax rate was primarily attributable to strong incremental pretax income growth taxed at a higher rate than the overall effective tax rate. The Company expects the 2005 annual effective tax rate to be between 31-32%, which is within the range of the Company’s normalized tax rate for the past several years. Provision for Loan Losses and Allowance for Loan and Lease Losses Provision for loan losses totaled $10.6 million in the first quarter of 2005, a decrease of $43.3 million, or 80.4%, from the first quarter of 2004. The decline in the provision was due to an improvement in the Company’s credit quality in both consumer and commercial loans as well as the sale of RCM assets. Net charge-offs for the first quarter of 2005 were $36.9 million, a decline of $21.8 million, or 37.3%, from the same period of the prior year. The decline was partially due to a $15.0 million, or 68.5%, reduction in commercial net charge-offs. The reduction in commercial net charge-offs can be attributed to an overall improvement in the credit quality of the portfolio that resulted in lower gross charge-offs. SunTrust maintains an allowance for loan and lease losses that is considered adequate to absorb probable losses in the portfolio based on management’s evaluations of the size and current risk characteristics of the loan portfolio. Such evaluations consider prior loss experience, the risk rating distribution of the portfolios, the impact of current internal and external influences on credit loss and the levels of nonperforming loans. In addition to the review of credit quality through ongoing credit review processes, the Company constructs an independent and comprehensive allowance analysis for its credit portfolios on a quarterly basis. The ALLL Committee has the responsibility of affirming the allowance methodology and assessing all of the risk elements in order to determine the appropriate level of allowance for the inherent losses in the portfolio at the point in time being reviewed. The allowance methodology includes a component for collective loan impairment for pools of homogeneous loans with similar risk attributes, a component for larger individual loan impairment, and a non-pool-specific component related to inherent losses that are not otherwise evaluated in the first two elements. The qualitative factors associated with the non-pool-specific component are subjective and require a high degree of judgment. These factors include the inherent imprecisions in mathematical models and credit quality statistics, recent economic uncertainty, losses incurred from recent events, and lagging or incomplete data. Relevant accounting guidance is used to
30

ˆ1RGPMSXLJF9ZQVGUŠ1RGPMSXLJF9ZQVG
86547 TX 31SUNTRUST BANKS, INC.10-Q
05-May-2005 13:03 ESTHTMRVA
RR Donnelley ProFile TOR shinv0dc 1*IFV 0C
TORFBU-MWS-CX018.8
Page 1 of 1
identify and analyze the loan pools and larger individual loans for impairment. Numerous loss factors are used to analyze the loan pools including current and historical credit quality results, credit risk ratings, industry or obligor concentrations, and external economic factors. At March 31, 2005, SunTrust’s allowance for loan and lease losses totaled $1,023.7 million, or 0.98% of total loans, compared to $1,050.0 million, or 1.04% of total loans at December 31, 2004. The allowance as a percentage of total nonperforming loans increased from 281.3% at December 31, 2004 to 286.7% at March 31, 2005.
31
Summary of Loan Loss Experience Table 5
(Dollars in millions) (Unaudited)
Three Months Ended March 31
%Change
2005
2004
Allowance for Loan and Lease Losses
Balance - beginning of period $1,050.0 $941.9 11.5 Provision for loan losses 10.6 53.8 (80.3)Charge-offs
Commercial (16.6) (33.5) (50.3)Real estate:
Construction (0.8) (0.7) 14.3 Residential mortgages (8.5) (10.6) (19.8)Other (0.8) (1.5) (46.7)
Consumer loans (38.4) (38.5) (0.3)
Total charge-offs (65.1) (84.8) (23.2)
Recoveries
Commercial 9.7 11.6 (16.2)Real estate:
Construction 0.2 — 100.0 Residential mortgages 2.0 1.9 5.3 Other 0.3 0.2 50.0
Consumer loans 16.0 12.4 29.0
Total recoveries 28.2 26.1 8.2
Net charge-offs (36.9) (58.7) (37.3)
Balance - end of period $1,023.7 $937.0 9.3
Average loans $103,215.8 $79,904.9 29.2 Quarter-end loans outstanding 104,760.9 79,212.8 32.3 Ratios:
Net charge-offs to average loans (annualized) 0.14 % 0.30 %
Provision to average loans (annualized) 0.04 0.27
Recoveries to total charge-offs 43.3 30.8
Allowance to quarter-end loans 0.98 1.18
Allowance to nonperforming loans 286.7 309.7

ˆ1RGPMSXLKJVKL0GXŠ1RGPMSXLKJVKL0G
86547 TX 32SUNTRUST BANKS, INC.10-Q
05-May-2005 20:08 ESTHTMRVA
RR Donnelley ProFile TOR jaiss0dc 2*ESS 0C
TORFBU-MWS-CX018.8.12
Page 1 of 1
Nonperforming Assets Nonperforming assets totaled $392.3 million at March 31, 2005, a decrease of $18.4 million, or 4.5%, from December 31, 2004. The decrease was attributable to a $16.2 million, or 4.3%, decline in nonperforming loans and resulted in a decline in the ratio of nonperforming assets to total loans plus OREO and other repossessed assets to 0.37% at March 31, 2005 from 0.40% at December 31, 2004. Nonperforming loans at March 31, 2005 included $337.1 million of nonaccrual loans and $20.0 million of restructured loans, the latter of which represents a select group of consumer workout loans. Interest income on nonaccrual loans, if recognized, is recorded using the cash basis method of accounting. During the first quarters of 2005 and 2004, this amounted to $2.8 million and $6.0 million, respectively. For the first quarters of 2005 and 2004, interest income of $7.0 million and $5.5 million, respectively, would have been recorded if all such loans had been accruing interest according to their original contract terms. Accruing loans past due ninety days or more decreased $31.7 million from December 31, 2004 to $182.6 million as of March 31, 2005. The decrease was primarily related to lower levels of residential and consumer past due loans.
32

ˆ1RGPMSXLKJW=BWG&Š1RGPMSXLKJW=BWG
86547 TX 33SUNTRUST BANKS, INC.10-Q
05-May-2005 20:09 ESTHTMRVA
RR Donnelley ProFile TOR jaiss0dc 2*ESS 0C
TORFBU-MWS-CX018.8.12
Page 1 of 1
Loans
Nonperforming Assets Table 6
(Dollars in millions) (Unaudited)
March 31
2005
December 31
2004
%
Change
Nonperforming Assets
Nonaccrual loans: Commercial $116.4 $130.9 (11.1)Real Estate:
Construction 36.8 32.8 12.0 Residential mortgages 112.2 104.5 7.4 Other 45.2 36.7 23.2
Consumer loans 26.5 49.3 (46.2)
Total nonaccrual loans 337.1 354.2 (4.9)Restructured loans 20.0 19.1 5.4
Total nonperforming loans 357.1 373.3 (4.3)
Other real estate owned (OREO) 27.5 28.6 (3.7)Other repossessed assets 7.7 8.8 (12.4)
Total nonperforming assets $392.3 $410.7 (4.5)
Ratios:
Nonperforming loans to total loans 0.34% 0.37%
Nonperforming assets to total loans plus OREO and other repossessed assets 0.37 0.40
Accruing Loans Past Due
90 Days or More $182.6 $214.3
Total loans at March 31, 2005, were $104.8 billion, an increase of $3.3 billion, or 3.3 %, from December 31, 2004. Commercial loans increased $1.4 billion, or 4.5%, compared to December 31, 2004 due to growth in large corporate loans and a continued growth in the small to mid-sized commercial segments. Residential mortgages increased $1.0 billion, or 4.1%, compared to December 31, 2004. This increase was due to rising interest rates, thus causing an improvement in adjustable rate mortgage production, which the Company tends to retain in its portfolio. Consumer loans declined $31.1 million, or 0.2%, compared to December 31, 2004. Driving the decline was a decrease in the indirect portfolio due to increased competition for volume and tightening spreads. This decline was partially offset by growth in the direct portfolio, specifically growth in student lending. Additionally impacting loan growth was a $0.6 billion, or 7.5%, increase in construction loans compared to December 31, 2004.
33

ˆ1RGPMSXLKK6L2QGXŠ1RGPMSXLKK6L2QG
86547 TX 34SUNTRUST BANKS, INC.10-Q
05-May-2005 20:15 ESTHTMRVA
RR Donnelley ProFile TOR jaiss0dc 2*ESS 0C
TORFBU-MWS-CX018.8.12
Page 1 of 1
Securities Available for Sale
Loan Portfolio by Types of Loans Table 7
March 31
2005 December 31
2004 %
Change
(Dollars in millions) (Unaudited)
Commercial $33,262.0 $31,823.8 4.5 Real estate:
Home equity 11,974.6 11,519.2 4.0 Construction 8,430.1 7,845.4 7.5 Residential mortgages 25,554.9 24,553.5 4.1 Other 11,957.6 12,083.8 (1.0)
Credit card 187.6 175.3 7.0 Consumer loans 13,394.1 13,425.2 (0.2)
Total loans $104,760.9 $101,426.2 3.3
The investment portfolio is managed as part of the overall asset and liability management process to optimize income and market performance over an entire interest rate cycle while mitigating risk. The Company managed the portfolio in the first quarter of 2005 with the goal of continuing to improve yield while gradually increasing duration as rates increase. The average yield for the first quarter of 2005 improved to 4.41% compared with 4.23% the previous quarter and 3.83% for the same quarter a year ago. The estimated average life was 3.7 years at March 31, 2005, unchanged from December 31, 2004. The portfolio’s average duration was 3.1 at March 31, 2005, a slight increase from a 3.0 duration as of December 31, 2004. Duration is a measure of the estimated price sensitivity of a bond portfolio to an immediate change in interest rates. A duration of 3.1 suggests an expected price change of 3.1% for a one percent change in interest rates, without considering any embedded call or prepayment options. The portfolio size was $27.7 billion on an amortized cost basis at March 31, 2005 compared to $26.9 billion at December 31, 2004 as the Company took advantage of higher interest rates to increase the size of the portfolio. Consistent with the objectives of the Asset/Liability Management Committee (“ALCO”), net securities losses of $5.7 million were realized in the first quarter of 2005 to improve future income, primarily from selling shorter duration mortgage-backed securities with lower yields and reinvesting in longer duration, non-callable agency securities with higher yields. Our current mix of securities as of March 31, 2005 is shown in Table 8 compared with December 31, 2004. The carrying value of the investment portfolio, all of which is classified as securities available for sale, reflected $1.7 billion in net unrealized gains at March 31, 2005, including a $2.0 billion unrealized gain on the Company’s investment in common stock of The Coca-Cola Company. The market value of this common stock investment increased $7.4 million, while the net change in market value on the remainder of the portfolio decreased $306.7 million compared to December 31, 2004. These changes in market value did not affect the net income of SunTrust, but were included in other comprehensive income. The Company reviews all of its securities with unrealized losses for impairment at least quarterly. The Company has determined that none of these securities were other-than-temporarily impaired as of March 31, 2005.
34

ˆ1RGPMSXLMLW=L5GÁŠ1RGPMSXLMLW=L5G
86547 TX 35SUNTRUST BANKS, INC.10-Q
06-May-2005 10:41 ESTHTMRVA
RR Donnelley ProFile TOR amana0dc 3*ESS 0C
CHWFBU-MWS-CX058.8.12
Page 1 of 1
Securities Available for Sale Table 8
At March 31, 2005
At December 31, 2004
(Dollars in millions) (Unaudited)
Amortized Cost
Fair Value
Amortized Cost
Fair Value
U.S. Treasury and other U.S. government agencies and corporations $2,915.2 $2,865.4 $2,543.9 $2,538.1States and political subdivisions 857.3 871.7 841.6 865.6Asset-backed securities 2,521.0 2,488.2 2,590.0 2,578.5Mortgage-backed securities 18,794.7 18,547.1 18,367.0 18,325.3Corporate bonds 1,621.3 1,608.4 1,667.1 1,679.3Common stock of The Coca-Cola Company 0.1 2,011.3 0.1 2,003.9Other securities1 953.6 981.9 921.2 950.3
Total securities available for sale $27,663.2 $29,374.0 $26,930.9 $28,941.0
BUSINESS SEGMENTS
1 Includes $520.5 million and $523.6 million at March 31, 2005 and December 31, 2004, respectively, of Federal Home Loan Bank stock stated at par value.
Beginning in January 2001, the Company implemented significant changes to its internal management reporting system to begin to measure and manage certain business activities by line of business. For more financial details on business segment disclosures, please see Note 8 – Business Segment Reporting in the Notes to the unaudited Consolidated Financial Statements. The lines of business which are the Company’s segments, are defined as follows: Retail The Retail line of business includes loans, deposits, and other fee-based services for consumers and business clients with less than $5 million in sales. Retail serves clients through an extensive network of traditional and in-store branches, ATMs, the internet (suntrust.com) and the telephone (1-800-SUNTRUST). In addition to serving the retail market, the Retail line of business serves as an entry point for other lines of business. When client needs change and expand, Retail refers clients to SunTrust’s Wealth and Investment Management, Mortgage, and Commercial lines of business. Commercial The Commercial line of business provides enterprises with a full array of financial products and services including traditional commercial lending, treasury management, financial risk management, and corporate bankcard. The primary client segments served by this line of business include “Commercial” ($5 million to $50 million in annual revenue), “Middle Market” ($50 million to $250 million in annual revenue), “Commercial Real Estate” (entities that specialize in commercial real estate activities), and “Government/Not-for-Profit” entities. Also included in this segment are specialty groups that operate both inside and outside of the SunTrust footprint, such as Affordable Housing (tax-related investments in community developments) and Premium Assignment Corporation (insurance premium financing). Corporate & Investment Banking CIB is comprised of the following businesses: corporate banking, investment banking, capital markets, commercial leasing, and merchant banking. The corporate banking strategy is focused on companies with sales in excess of $250 million and is organized along industry specialty and geographic lines, providing
35

ˆ1RGPMSXLJFBR42G†Š1RGPMSXLJFBR42G
86547 TX 36SUNTRUST BANKS, INC.10-Q
05-May-2005 13:03 ESTHTMRVA
RR Donnelley ProFile TOR shinv0dc 1*IFV 0C
TORFBU-MWS-CX018.8
Page 1 of 1
along with credit, a full array of traditional banking services, capital markets capabilities, and investment banking. The investment banking strategy is focused on small- and mid-cap growth companies and is organized along industry specialty lines. Its services include raising public and private equity and providing merger and acquisition advisory services. The debt and equity capital markets businesses support both corporate banking and investment banking relationships, as well as the smaller commercial clients and wealthy individuals. Commercial leasing provides equipment leasing and financing to various entities. Mortgage The Mortgage line of business offers residential mortgage products nationally through its retail, broker and correspondent channels. These products are either sold in the secondary market primarily with servicing rights retained or held as whole loans in the Company’s residential loan portfolio. The line of business services loans for its own residential mortgage portfolio as well as for others. Additionally, the line of business generates revenue through its tax service subsidiary (ValuTree Real Estate Services, LLC) and its captive reinsurance subsidiary (Cherokee Insurance Company). Wealth & Investment Management Wealth and Investment Management, the segment formerly known as Private Client Services, provides a full array of wealth management products and professional services to both individual and institutional clients. Wealth and Investment Management’s primary segments include brokerage, individual wealth management, and institutional investment management and administration. SunTrust Securities, Inc. operates across the Company’s footprint and offers discount/online and full service brokerage services to individual clients. Alexander Key offers full service brokerage services to affluent and wealthy clients who generally do not have a pre-existing relationship with the Company. Alexander Key is currently located in Atlanta, GA, Nashville, TN, Washington DC, Jacksonville, FL, Orlando, FL, and Richmond, VA. Wealth and Investment Management also offers professional investment management and trust services to individual clients seeking active management of their financial resources. In addition, the Private Banking unit within SunTrust was consolidated into Wealth and Investment Management in the first quarter of 2005, which enables the group to offer a full array of loan and deposit products to clients. The ultra high net worth segment is serviced by Asset Management Advisors (“AMA”). AMA provides “family office” services to ultra high net worth clients. Acting in this capacity, AMA investment professionals utilize sophisticated financial products and wealth management tools to provide a holistic approach to multi-generational wealth management. AMA is currently located in Atlanta, GA, Orlando, FL, West Palm Beach, FL, Miami, FL, St. Petersburg, FL, Washington DC, Charlotte, NC, and Greenwich, CT. Institutional investment management and administration is comprised of Trusco Capital Management, Inc. (“Trusco”), retirement services, endowment and foundation services, and corporate trust. Trusco is a registered investment advisor that acts as the investment manager for Wealth and Investment Management’s clients and the STI Classic Funds. Trusco includes Seix Investment Advisors (“Seix”), which was acquired in the second quarter of 2004, and Zevenbergen Capital Investments, LLC (“ZCI”), which was consolidated in the fourth quarter of 2004 in connection with the Company acquiring a majority ownership interest in ZCI. Retirement Services provides administration and custody services for defined benefit and defined contribution plans as well as administration services for non-qualified plans. Endowment and foundation services provides administration and custody services to non-profit organizations, including government agencies, colleges and universities, community charities and foundations, and hospitals. Corporate trust targets issuers of tax-exempt and corporate debt, and asset-based securities, as well as corporations and attorneys requiring escrow and custodial services.
36

ˆ1RGPMSXLMLJ86GGoŠ1RGPMSXLMLJ86GG
86547 TX 37SUNTRUST BANKS, INC.10-Q
06-May-2005 10:34 ESTHTMRVA
RR Donnelley ProFile TOR dsach0dc 3*ESS 0C
TORFBU-MWS-CX018.8.12
Page 1 of 1
Corporate/Other Corporate/Other (“Other”) includes the investment securities portfolio, long-term debt, capital, derivative instruments, short-term liquidity and funding activities, balance sheet risk management, office premises, income tax provision, certain support activities not currently allocated to the aforementioned lines of business and the incremental costs to integrate NCF’s operations (merger expenses). The major components of Corporate/Other include Enterprise Information Services, which is the primary data processing and operations group; the Corporate Real Estate group, which manages the Company’s facilities; Marketing, which handles advertising, product management and customer information functions; Bankcard, which handles credit card issuance and merchant discount relationships; SunTrust Online, which handles customer phone inquiries and phone sales and manages the Internet banking function; Human Resources, which includes the recruiting, training and employee benefit administration functions; Finance, which includes accounting, budgeting, planning, tax and treasury. Other functions included in Corporate/ Other are operational risk management, credit risk management, credit review, audit, legal and compliance, branch operations, corporate strategies development, procurement, merger integration, and the executive management group. Finally Corporate/Other also includes specialty businesses, including Transplatinum, which handles Fleet One fuel cards, and USI Alliance Corporation, which provides services for safety, security and crime prevention to senior housing facilities. Reconciling Items Reconciling Items includes all adjustments necessary to reconcile management accounting methodologies to GAAP consolidated earnings. The most significant items relate to matched-maturity funds transfer pricing, provision for loan losses versus net charge-off allocations, float reconciliation, deposit reserve reconciliation, and intercompany eliminations. The following table for SunTrust’s reportable segments compares total income/(loss) before taxes for the three months ended March 31, 2005 to the same period last year:
37
Total Income Before Taxes Table 9
Three Months Ended
(Dollars in thousands) (Unaudited)
March 31, 2005
March 31, 2004
Retail $431,569 $304,885 Commercial 209,694 152,590 Corporate & Investment Banking 151,486 114,332 Mortgage 68,777 64,707 Wealth & Investment Management 100,686 81,944 Corporate/Other (343,621) (266,253)Reconciling Items 119,987 63,200
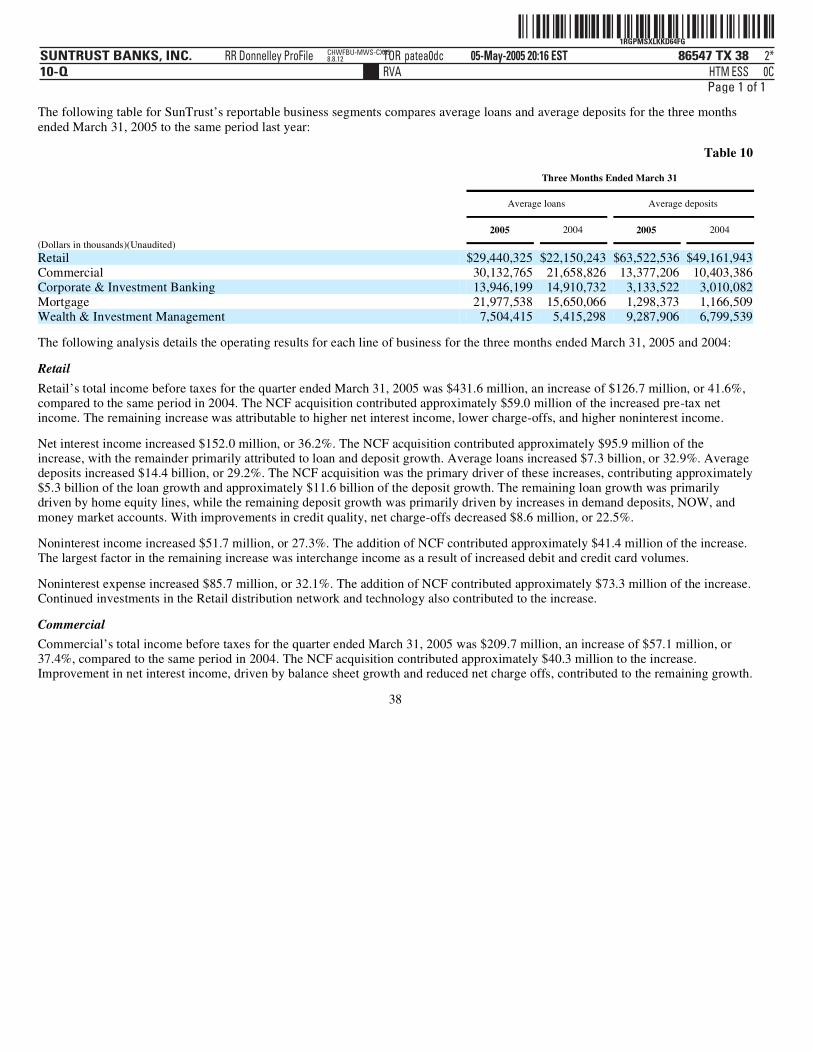
ˆ1RGPMSXLKKD64FG8Š1RGPMSXLKKD64FG
86547 TX 38SUNTRUST BANKS, INC.10-Q
05-May-2005 20:16 ESTHTMRVA
RR Donnelley ProFile TOR patea0dc 2*ESS 0C
CHWFBU-MWS-CX058.8.12
Page 1 of 1
The following table for SunTrust’s reportable business segments compares average loans and average deposits for the three months ended March 31, 2005 to the same period last year:
Table 10
The following analysis details the operating results for each line of business for the three months ended March 31, 2005 and 2004: Retail
Three Months Ended March 31
Average loans
Average deposits
(Dollars in thousands)(Unaudited)
2005
2004
2005
2004
Retail $29,440,325 $22,150,243 $63,522,536 $49,161,943Commercial 30,132,765 21,658,826 13,377,206 10,403,386Corporate & Investment Banking 13,946,199 14,910,732 3,133,522 3,010,082Mortgage 21,977,538 15,650,066 1,298,373 1,166,509Wealth & Investment Management 7,504,415 5,415,298 9,287,906 6,799,539
Retail’s total income before taxes for the quarter ended March 31, 2005 was $431.6 million, an increase of $126.7 million, or 41.6%, compared to the same period in 2004. The NCF acquisition contributed approximately $59.0 million of the increased pre-tax net income. The remaining increase was attributable to higher net interest income, lower charge-offs, and higher noninterest income. Net interest income increased $152.0 million, or 36.2%. The NCF acquisition contributed approximately $95.9 million of the increase, with the remainder primarily attributed to loan and deposit growth. Average loans increased $7.3 billion, or 32.9%. Average deposits increased $14.4 billion, or 29.2%. The NCF acquisition was the primary driver of these increases, contributing approximately $5.3 billion of the loan growth and approximately $11.6 billion of the deposit growth. The remaining loan growth was primarily driven by home equity lines, while the remaining deposit growth was primarily driven by increases in demand deposits, NOW, and money market accounts. With improvements in credit quality, net charge-offs decreased $8.6 million, or 22.5%. Noninterest income increased $51.7 million, or 27.3%. The addition of NCF contributed approximately $41.4 million of the increase. The largest factor in the remaining increase was interchange income as a result of increased debit and credit card volumes. Noninterest expense increased $85.7 million, or 32.1%. The addition of NCF contributed approximately $73.3 million of the increase. Continued investments in the Retail distribution network and technology also contributed to the increase. Commercial Commercial’s total income before taxes for the quarter ended March 31, 2005 was $209.7 million, an increase of $57.1 million, or 37.4%, compared to the same period in 2004. The NCF acquisition contributed approximately $40.3 million to the increase. Improvement in net interest income, driven by balance sheet growth and reduced net charge offs, contributed to the remaining growth.
38

ˆ1RGPMSXLKKJHGZG)Š1RGPMSXLKKJHGZG
86547 TX 39SUNTRUST BANKS, INC.10-Q
05-May-2005 20:18 ESTHTMRVA
RR Donnelley ProFile TOR desaj0dc 2*ESS 0C
CHWFBU-MWS-CX058.8.12
Page 1 of 1
Net interest income increased $67.4 million, or 42.5%. NCF contributed approximately $47.1 million of this increase. Average loans increased $8.5 billion, or 39.1%, and average deposits increased $3.0 billion, or 28.6%. The NCF acquisition accounted for approximately $6.5 billion of the loan growth and $1.4 billion of the deposit growth. The remaining loan growth was driven by stronger demand for commercial real estate, auto dealer floor plan loans and other commercial loans. The remaining growth in deposits was attributed to increased client liquidity. Net charge-offs decreased $8.1 million, or 107.7%, due to net recoveries in the first quarter of 2005. Noninterest income increased $0.6 million, or 0.8%. NCF accounted for approximately $2.1 million of the increase. Affordable Housing contributed an additional $4.2 million to the increase, driven by higher tax credits from incremental properties and investments. Partially offsetting these increases, service charges on deposits decreased $4.6 million, or 17.9%, driven by rising interest rates and higher deposit balances. Noninterest expense increased $19.0 million, or 24.1%. The NCF acquisition contributed approximately $8.5 million of the increase. An additional $7.0 million of the increase was attributable to increased Affordable Housing activities, including $4.3 million of property improvement expenses incurred during the first quarter of 2005. Corporate & Investment Banking Corporate and Investment Banking’s total income before taxes for the quarter ended March 31, 2005 was $151.5 million, an increase of $37.2 million, or 32.5%, compared to the same period in 2004. The increase was primarily attributable to an increase in noninterest income of $43.4 million, or 32.4%, coupled with an improvement of $10.1 million, or 108.1%, in net charge-offs. These improvements were offset by an increase in noninterest expense of $13.0 million, or 17.1%. Included in total income before taxes was an approximate $2.5 million impact from the addition of NCF’s fixed income sales and trading business. Net interest income decreased $3.4 million, or 5.1%. To comply with FASB Interpretation No. 46, Three Pillars Funding Corp., a multi-seller commercial paper conduit was consolidated for two months of the first quarter of 2004, and contributed $2.0 million of net interest income to the first quarter of 2004. Average loans increased $632.9 million, or 4.8%, and average deposits decreased $118.3 million or 3.6% from the fourth quarter of 2004 to the first quarter of 2005. The loan growth was driven primarily by stronger corporate demand. The decline in average deposits was due to rising rates, primarily on the savings and money market accounts. Noninterest income increased $43.4 million, or 32.4%. Included in noninterest income was a net gain of $19.9 million on the sale of factoring assets, RCM, to CIT Group, Inc. Also included in noninterest income was an approximate $8.7 million impact from the addition of NCF’s fixed income sales and trading business. The remainder of the increase was due to an increase in merger and acquisition and advisory activity. Noninterest expense increased $13.0 million, or 17.1%. Included in noninterest expense was an approximate $7.3 million impact from the addition of NCF’s fixed income sales and trading business. The remainder of the increase was due primarily to an increase in personnel expense of $5.9 million, or 12.1%. The increase in personnel expense was driven by increased incentive compensation associated with increased fee income. Mortgage Mortgage’s total income before taxes for the quarter ended March 31, 2005 was $68.8 million, an increase of $4.1 million, or 6.3%, compared to the same period in 2004. Lower servicing amortization, higher residential portfolio earnings, and higher service fees have helped mitigate production margin compression given the rising interest rate environment.
39

ˆ1RGPMSXLMLM3S4G\Š1RGPMSXLMLM3S4G
86547 TX 40SUNTRUST BANKS, INC.10-Q
06-May-2005 10:36 ESTHTMRVA
RR Donnelley ProFile TOR dsach0dc 3*ESS 0C
TORFBU-MWS-CX018.8.12
Page 1 of 1
Net interest income increased $9.4 million, or 7.9%. Average loans increased $6.3 billion, or 40.4%, due to continued demand for portfolio products and the addition of NCF loans. The higher loan balances contributed $15.0 million of the increase in net interest income. Loans held for sale were up $1.2 billion, or 27.3%. However, due to compressed spreads, income from loans held for sale were down $6.7 million, or 13.6%. Average collected deposits were up $10.6 million due to higher payoffs and increased escrow balances. The higher balances, combined with a higher credit for funds, contributed $1.3 million to the increase in net interest income. Net charge-offs decreased $1.6 million, or 63.6%. Noninterest income increased $24.6 million, or 121.5%, due to both higher servicing and production income. Servicing income was up $13.4 million due to slower prepayments resulting in lower mortgage servicing rights amortization. Additionally, the servicing portfolio grew to $83.6 billion at March 31, 2005, a 19.5% increase over March 31, 2004, which contributed to the higher servicing income. Production income increased $9.7 million, or 95.2% compared to the first quarter of 2004, due to increased sales in the secondary market and an increase in production volume, partially due to the NCF acquisition. Loan production of $8.7 billion was up 34.1% over last year. Noninterest expense increased $31.5 million, or 44.1%. The addition of NCF expense in 2005 and other volume-related expenses were the primary drivers of the higher expense. Wealth & Investment Management Wealth and Investment Management’s total income before taxes for the quarter ended March 31, 2005 was $100.7 million, an increase of $18.7 million, or 22.9%, compared to the same period in 2004. NCF and Seix contributed approximately $11.1 million and $4.8 million of the increase, respectively. The remainder of the growth was primarily driven by increases in net interest income and trust income, which were partially offset by increases in staff expense, outside processing, and amortization of intangibles. Net interest income increased $24.5 million, or 46.7%. The acquisition of NCF contributed approximately $10.5 million of the increase. Average loans increased $2.1 billion, or 38.6%, including approximately $1.3 billion attributable to NCF. Average deposits increased $2.5 billion, or 36.6%, including approximately $0.7 billion attributable to NCF. Net charge-offs decreased $0.3 million, or 54.2%. Noninterest income increased $42.2 million, or 22.2%, which included approximately $21.6 million from NCF and $12.9 million from Seix. Contributing to the total increase, assets under management increased $28.5 billion, or 28.4%, to approximately $128.9 billion. NCF and Seix contributed approximately $2.4 billion and $16.9 billion, respectively, of the increase in assets under management. The remaining increase was due to net new business and equity markets increasing slightly, the effect of which was somewhat offset by a decrease in the bond market caused by higher interest rates. Assets under management include individually managed assets, the STI Classic Funds, institutional assets managed by Trusco Capital Management, and participant-directed retirement accounts. SunTrust’s total assets under advisement were approximately $228.9 billion, which included $128.9 billion in assets under management, $26.1 billion in non-managed corporate trust assets, $45.8 billion in non-managed trust assets, and $28.1 billion in retail brokerage assets. Noninterest expense increased $48.3 million, or 30.1%. This included approximately $20.7 million from NCF and $8.1 million from Seix. Total staff expense increased $31.1 million, or 28.0%, including $10.3 million from NCF and $6.6 million from Seix. This increase was primarily due to sales staff additions and incentive expense. Outside processing increased $2.5 million, or 32.1%, primarily due to increased system and processing costs. Amortization of intangibles increased $2.9 million and included $0.8 million from NCF. The remainder of the increase was attributable to Seix.
40

ˆ1RGPMSXLKQ14=HGÇŠ1RGPMSXLKQ14=HG
86547 TX 41SUNTRUST BANKS, INC.10-Q
05-May-2005 22:07 ESTHTMRVA
RR Donnelley ProFile TOR desaj0dc 3*ESS 0C
CHWFBU-MWS-CX058.8.12
Page 1 of 1
Corporate/Other Corporate/Other’s loss before taxes for the quarter ended March 31, 2005 was $343.6 million, an increase in loss of $77.4 million, or 29.1%, compared to the first quarter of 2004. Net interest income decreased $26.4 million, or 280.5%. The decline was primarily due to the acquisition of NCF and the funds transfer pricing charge associated with these acquired intangibles. These NCF related factors contributed to a $51.4 million decrease and were partially offset by an increase in net interest income of $26.7 million from the investment portfolio. Average assets increased $10.7 billion, or 37.2%. Average liabilities increased $10.9 billion, or 28.3%. The increase in assets was mainly due to the acquisition of NCF. NCF added approximately $12.6 billion of investment portfolio and other assets, which was partially offset by a $2.1 billion reduction in the historical SunTrust investment portfolio. This reduction included a $556.0 million decline in the market value of securities. The increase in liabilities was primarily due to the addition of approximately $4.6 billion in NCF liabilities, and increases in historical SunTrust long-term debt of $4.1 billion and brokered and foreign deposits of $2.1 billion. Net charge-offs increased $0.4 million, or 51.5%. Noninterest income decreased $0.8 million, or 8.8%. The main driver was security losses of $7.2 million in the first quarter of 2005 versus security gains of $5.1 million in the same period in 2004. This was partially offset by additional income of approximately $12.6 million due to the acquisition of NCF and the inclusion of certain specialty businesses in Corporate/Other. Noninterest expense increased $49.8 million, or 20.2%. The major drivers of this increase were the acquisition of NCF, which added approximately $64.9 million of noninterest expense, and merger related expenses of $25.7 million. These increases were partially offset by a $29.4 million increase in expense allocations to the various lines of business, a $9.4 million decrease in other expenses, and a $3.2 million decrease in advertising expenses. MARKET RISK MANAGEMENT Market risk refers to potential losses arising from changes in interest rates, foreign exchange rates, equity prices, commodity prices, and other relevant market rates or prices. Interest rate risk, defined as the exposure of net interest income and Economic Value of Equity (“EVE”) to adverse movements in interest rates, is SunTrust’s primary market risk, and mainly arises from the structure of the balance sheet (non-trading activities). SunTrust is also exposed to market risk in its trading activities, mortgage servicing rights, mortgage warehouse and pipeline, and equity holdings of The Coca-Cola Company common stock. ALCO meets regularly and is responsible for reviewing the interest-rate sensitivity position of the Company and establishing policies to monitor and limit exposure to interest rate risk. The policies established by ALCO are reviewed and approved by the Company’s Board of Directors. Market Risk from Non-trading Activities The primary goal of interest rate risk management is to control exposure to interest rate risk, both within policy limits approved by ALCO and the Board, and within narrower guidelines established by ALCO. These limits and guidelines reflect SunTrust’s tolerance for interest rate risk over both short-term and long-term horizons. The major sources of the Company’s non-trading interest rate risk are timing differences in the maturity and repricing characteristics of assets and liabilities, changes in relationships between rate indices (basis risk),
41

ˆ1RGPMSXLMLP9Z7G|Š1RGPMSXLMLP9Z7G
86547 TX 42SUNTRUST BANKS, INC.10-Q
06-May-2005 10:37 ESTHTMRVA
RR Donnelley ProFile TOR dsach0dc 4*ESS 0C
TORFBU-MWS-CX018.8.12
Page 1 of 1
changes in the shape of the yield curve, and the potential exercise of explicit or embedded options. SunTrust measures these risks and their impact by identifying and quantifying exposures through the use of sophisticated simulation and valuation models, as well as duration gap analysis. One of the primary methods that SunTrust uses to quantify and manage interest rate risk is simulation analysis, which is used to model net interest income from assets, liabilities, and derivative positions over a specified time period under various interest rate scenarios and balance sheet structures. This analysis measures the sensitivity of net interest income over a relatively short time horizon (two years). Key assumptions in the simulation analysis (and in the valuation analysis discussed later in this section) relate to the behavior of interest rates and spreads (frequency of changes in the fed funds rate, changes in the slope of the yield curve as short rates move, and the responsiveness of indeterminate maturity deposit rates), changes in product balances and the behavior of loan and deposit customers in different rate environments. Material assumptions include the repricing characteristics and balance fluctuations of indeterminate, or non-contractual maturity, deposits. As the future path of interest rates cannot be known in advance, management uses simulation analysis to project net interest income under various interest rate scenarios including expected, or “most likely,” as well as deliberately extreme and perhaps unlikely scenarios. The analyses may include rapid and gradual ramping of interest rates, rate shocks, spread narrowing and widening, and yield curve twists. Each analysis incorporates what management believes to be the most appropriate assumptions about customer behavior in an interest rate scenario. Additionally, in some analyses, assumptions are deliberately changed to test the Company’s exposure to a specified event or set of events. Specific strategies are also analyzed to determine their impact on net interest income levels and sensitivities. The following table reflects the estimated sensitivity of net interest income to changes in interest rates. The sensitivity is measured as a percentage change in net interest income due to gradual changes in interest rates (25 basis points per quarter) compared to forecasted net interest income under stable rates for the next twelve months. Estimated changes set forth below are dependent on material assumptions such as those previously discussed. Estimated Changes in Net Interest Income
As indicated, a gradual decrease in interest rates would increase net interest income. A gradual increase would also enhance net interest income. Thus, the Company’s interest rate sensitivity position is near neutral. While simulations of more rapid changes in interest rates indicate more significant fluctuations in net interest income, the Company is still within the policy limits. SunTrust also performs valuation analysis, which is used for discerning levels of risk present in the balance sheet and derivative positions that might not be taken into account in the net interest income simulation analysis. Whereas net interest income simulation highlights exposures over a relatively short time horizon, valuation analysis incorporates all cash flows over the estimated remaining life of all balance sheet and derivative positions. The valuation of the balance sheet, at a point in time, is defined as the discounted present value of asset cash flows and derivative cash flows minus the discounted value of liability cash flows, the net of which is referred to as the EVE. The sensitivity of EVE to changes in the level of interest
42
Estimated % Change in Net Interest Income Over 12 Months
Rate Change (Basis Points)
Mar. 31, 2005
Dec. 31, 2004
+100 b.p. 0.4% 0.3%-100 b.p. 0.4% (0.1%)

ˆ1RGPMSXLKJKWW9GGŠ1RGPMSXLKJKWW9G
86547 TX 43SUNTRUST BANKS, INC.10-Q
05-May-2005 20:02 ESTHTMRVA
RR Donnelley ProFile TOR patea0dc 2*ESS 0C
CHWFBU-MWS-CX058.8.12
Page 1 of 1
rates is a measure of the longer-term repricing risk and options risk embedded in the balance sheet. In contrast to the net interest income simulation, which assumes interest rates will change over a period of time (ramp), EVE uses instantaneous changes in rates (shock). EVE values only the current balance sheet and does not incorporate the growth assumptions that are used in the net interest income simulation model. As with the net interest income simulation model, assumptions about the timing and variability of balance sheet cash flows are critical in the EVE analysis. Particularly important are the assumptions driving prepayments, the expected changes in balances and pricing of the indeterminate maturity deposit portfolios.
While an instantaneous and severe shift in interest rates is used in this analysis to provide an estimate of exposure under an extremely adverse scenario, management believes that a gradual shift in interest rates would have a much more modest impact. Since EVE measures the discounted present value of cash flows over the estimated lives of instruments, the change in EVE does not directly correlate to the degree that earnings would be impacted over a shorter time horizon (i.e., the current fiscal year). Further, EVE does not take into account factors such as future balance sheet growth, changes in product mix, changes in yield curve relationships, and changing product spreads that could mitigate the adverse impact of changes in interest rates. The net interest income simulation and valuation analyses do not necessarily include certain actions that management may undertake to manage this risk in response to anticipated changes in interest rates. Trading Activities
Rate Shock (Basis Points)
Estimated % Changes in EVE
Mar. 31, 2005
Dec. 31, 2004
+100 b.p. (3.8)% (3.1)%-100 b.p. 1.4% 0.6%
Most of the Company’s trading activities are designed to support secondary trading with clients. Product offerings to clients include debt securities, including loans traded in the secondary market, equity securities, derivatives, foreign exchange contracts, and similar financial instruments. Other trading activities include participating in underwritings and acting as a market maker in certain equity securities. Typically, the Company maintains a securities inventory to facilitate customer transactions. However, in certain businesses, such as derivatives, it is more common to execute customer transactions with simultaneous risk-managing transactions with dealers. Also in the normal course of business, the Company assumes a degree of market risk in arbitrage, delta hedging, and other strategies, subject to specified limits. The Company has developed policies and procedures to manage market risk associated with trading, capital markets and foreign exchange activities using a value-at-risk (“VaR”) approach that combines interest rate risk, equity risk, foreign exchange risk, spread risk, and volatility risk. For trading portfolios, VaR measures the maximum fair value the Company could lose on a trading position, given a specified confidence level and time horizon. VaR limits and exposures are monitored daily for each significant trading portfolio. The Company’s VaR calculation measures the potential losses in fair value using a 99% confidence level. This equates to 2.33 standard deviations from the mean under a normal distribution. This means that, on average, daily profits and losses are expected to exceed VaR one out of every 100 overnight trading days. The VaR methodology includes holding periods for each position based upon an assessment of relative trading market liquidity. For the Foreign Exchange, Equity Desk, Structured Trades and Derivatives desks, the Company estimates VaR by applying the Monte Carlo simulation platform as designed by RiskMetrics™, and for the estimate of the Fixed Income VaR, the Company uses Bloomberg™ analytics. The Company uses internally developed methodologies to estimate VaR for the Credit Derivatives and Loan Trading Desks.
43
ˆ1RGPMSXLJFD1W8G]Š1RGPMSXLJFD1W8G
86547 TX 44SUNTRUST BANKS, INC.10-Q
05-May-2005 13:03 ESTHTMRVA
RR Donnelley ProFile TOR shinv0dc 1*IFV 0C
TORFBU-MWS-CX018.8
Page 1 of 1
The estimated combined period end undiversified VaR was $3.7 million at March 31, 2005 and $3.5 million at December 31, 2004. Trading assets net of trading liabilities were $1.5 billion at March 31, 2005 and $1.1 billion at December 31, 2004. Other Market Risk Other sources of market risk include the risk associated with holding residential mortgage loans prior to selling them into the secondary mortgage market, commitments to customers to make mortgage loans that will be sold to the secondary mortgage market, and the Company’s investment in Mortgage Servicing Rights (“MSRs”). The Company manages the risks associated with the residential mortgage loans classified as held for sale (“the warehouse”) and its interest rate lock commitments (“IRLCs”) on residential loans intended for sale. The warehouse and IRLCs consist primarily of fixed- and adjustable-rate single family residential real estate loans. The risk associated with the warehouse and IRLCs is the potential change in interest rates between the time the customer locks in the rate on the anticipated loan and the time the loan is sold in the secondary mortgage market. The Company manages interest rate risk predominately with forward sale agreements, where the changes in value of the forward sale agreements substantially offset the changes in value of the warehouse and the IRLCs. Interest rate risk on the warehouse is managed via forward sale agreements in a designated fair value hedging relationship, under SFAS No. 133. IRLCs on residential mortgage loans intended for sale are classified as free standing derivative financial instruments in accordance with SFAS No. 149 and are not designated as SFAS No. 133 hedge accounting relationships. The value of the MSRs asset is dependent upon the assumed prepayment speed of the mortgage servicing portfolio. MSRs are the discounted present value of future net cash flows that are expected to be received from the mortgage servicing portfolio. Future expected net cash flows from servicing a loan in the mortgage servicing portfolio would not be realized if the loan pays off earlier than anticipated. Accordingly, prepayment risk subjects the MSRs to impairment risk. The Company does not specifically hedge the MSRs asset for the potential impairment risk; however, it does rely on the natural counter-cyclicality of production activities to mitigate impairment risk. The Company is also subject to risk from changes in equity prices that arise from owning The Coca-Cola Company common stock. SunTrust owns 48,266,496 shares of common stock of The Coca-Cola Company, which had a carrying value of $2.0 billion at March 31, 2005. A 10% decrease in share price of The Coca-Cola Company common stock at March 31, 2005 would result in a decrease, net of deferred taxes, of approximately $131 million in accumulated other comprehensive income. Liquidity Risk Liquidity risk is the risk of being unable to meet obligations as they come due at a reasonable funding cost. SunTrust manages this risk by structuring its balance sheet prudently and by maintaining borrowing resources to fund potential cash needs. The Company assesses liquidity needs in the form of increases in assets, maturing obligations, or deposit withdrawals, considering both operations in the normal course of business and in times of unusual events. In addition, the Company considers the off-balance sheet arrangements and commitments it has entered into, which could also affect the Company’s liquidity position. The ALCO of the Company measures this risk, sets policies, and reviews adherence to those policies. The Company’s sources of funds include a large, stable deposit base, secured advances from the Federal Home Loan Bank (“FHLB”) and access to the capital markets. The Company structures its balance sheet so that illiquid assets, such as loans, are funded through customer deposits, long-term debt, other liabilities and capital. Customer based core deposits, the Company’s largest and most cost-effective source of funding, accounted for 65.3% of the funding base on average for the first quarter of 2005, compared to 64.7% for the
44

ˆ1RGPMSXLJFDG1XGiŠ1RGPMSXLJFDG1XG
86547 TX 45SUNTRUST BANKS, INC.10-Q
05-May-2005 13:03 ESTHTMRVA
RR Donnelley ProFile TOR shinv0dc 1*IFV 0C
TORFBU-MWS-CX018.8
Page 1 of 1
same period of 2004 and 67.2% for the fourth quarter of 2004. The increase compared to the first quarter of 2004 was due to the acquisition of NCF. Average customer deposits increased $20.6 billion compared to the first quarter of 2004. Approximately $13.9 billion of the increase was attributable to the acquisition of NCF. The decline compared to the fourth quarter of 2004 was due to loan growth of $3.1 billion compared to core deposit growth of $366.4 million. The historical SunTrust deposit growth reflects successful marketing campaigns, continued growth from customer activity, and the relative appeal of alternative investments. Increases in rates, improved economic activity and confidence in the financial markets may lead to disintermediation of deposits, which may need to be replaced with higher cost borrowings in the future. Total net wholesale funding, including short-term unsecured borrowings, secured wholesale borrowings and long-term debt, totaled $47.9 billion at March 31, 2005, compared to $35.7 billion at March 31, 2004 and $43.6 billion at December 31, 2004. The increase year over year reflects the wholesale funding required to fund earning asset growth not supported by deposit growth, long-term debt of NCF of $2.8 billion and the funding of the $1.8 billion payment included in the purchase price for NCF. The increase in net wholesale funding of $4.3 billion compared to December 31, 2004 was due to the funding requirements for loan growth exceeding core deposit growth. Net short-term unsecured borrowings, including wholesale domestic and foreign deposits and fed funds, totaled $20.0 billion, $12.8 billion, and $16.5 billion at March 31, 2005, March 31, 2004 and December 31, 2004, respectively. Of the $7.2 billion increase from March 31, 2004, approximately $1 billion was due to the increase in loans held for sale, and $3.3 billion was due to the acquisition of NCF. The remainder was due to loan growth in the first quarter of 2005. The Company maintains access to a diversified base of wholesale funding sources. These sources include fed funds purchased, securities sold under agreements to repurchase, negotiable certificates of deposit, offshore deposits, FHLB advances, Global Bank Note issuance and commercial paper issuance. As of March 31, 2005, SunTrust Bank had $13.8 billion remaining under its Global Bank Note program. This capacity reflects $500 million and $350 million of subordinated debt issued during the first quarter of 2005 and the fourth quarter of 2004, respectively. The Global Bank Note program was established to expand funding and capital sources to include both domestic and international investors. Liquidity is also available through unpledged securities in the investment portfolio and capacity to securitize loans, including single-family mortgage loans. The Company’s credit ratings are important to its access to unsecured wholesale borrowings. Significant changes in these ratings could change the cost and availability of these sources. The Company manages reliance on short term unsecured borrowings as well as total wholesale funding through policies established and reviewed by ALCO. The Company has a contingency funding plan that stresses the liquidity needs that may arise from certain events such as agency rating downgrades, rapid loan growth, or significant deposit runoff. The plan also provides for continual monitoring of net borrowed funds dependence and available sources of liquidity. Management believes the Company has the funding capacity to meet the liquidity needs arising from potential events. Liquidity for SunTrust Banks, Inc. - Parent Company only (“Parent Company”) is measured comparing sources of liquidity in unpledged securities and short-term investments relative to its short-term debt. As of March 31, 2005, the Parent Company had $781 million in such sources compared to short-term debt of $549 million. The Parent Company also has $1.5 billion of availability remaining on its current shelf registration statement for the issuance of debt. As detailed in Table 11, the Company had $79.6 billion in total commitments to extend credit at March 31, 2005 that were not recorded on the Company’s balance sheet. Commitments to extend credit are arrangements to lend to a customer who has complied with predetermined contractual obligations. The
45
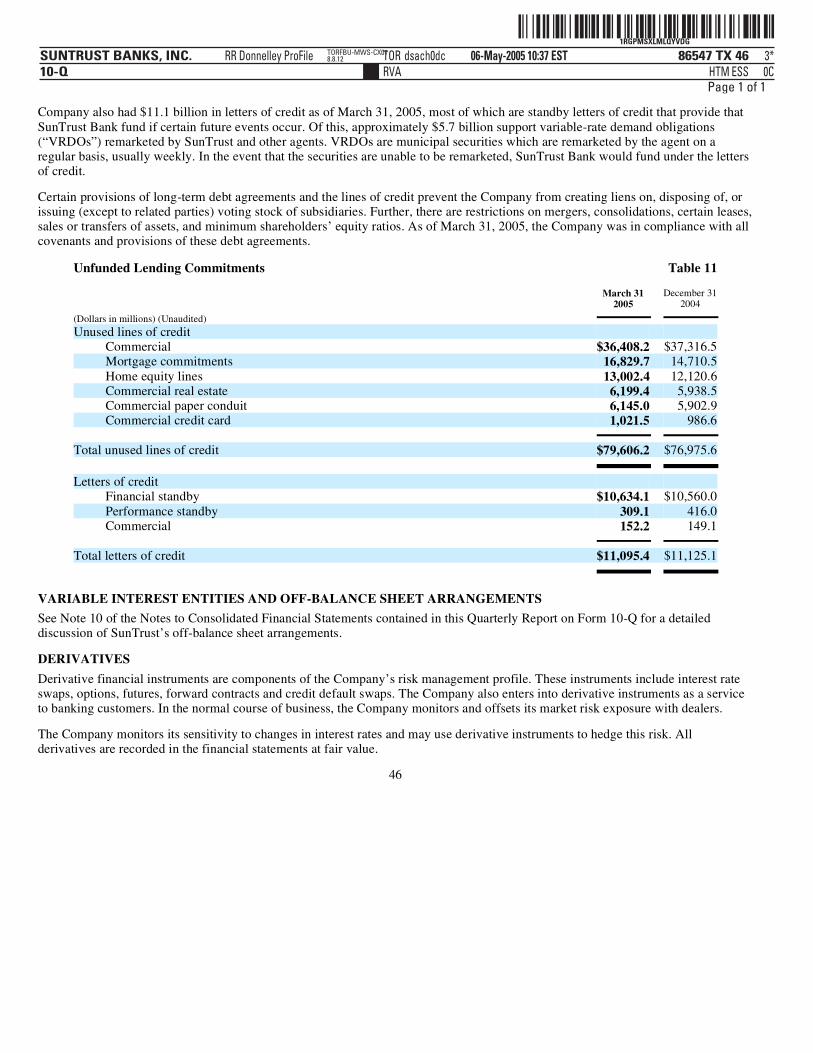
ˆ1RGPMSXLMLQYVDG†Š1RGPMSXLMLQYVDG
86547 TX 46SUNTRUST BANKS, INC.10-Q
06-May-2005 10:37 ESTHTMRVA
RR Donnelley ProFile TOR dsach0dc 3*ESS 0C
TORFBU-MWS-CX018.8.12
Page 1 of 1
Company also had $11.1 billion in letters of credit as of March 31, 2005, most of which are standby letters of credit that provide that SunTrust Bank fund if certain future events occur. Of this, approximately $5.7 billion support variable-rate demand obligations (“VRDOs”) remarketed by SunTrust and other agents. VRDOs are municipal securities which are remarketed by the agent on a regular basis, usually weekly. In the event that the securities are unable to be remarketed, SunTrust Bank would fund under the letters of credit. Certain provisions of long-term debt agreements and the lines of credit prevent the Company from creating liens on, disposing of, or issuing (except to related parties) voting stock of subsidiaries. Further, there are restrictions on mergers, consolidations, certain leases, sales or transfers of assets, and minimum shareholders’ equity ratios. As of March 31, 2005, the Company was in compliance with all covenants and provisions of these debt agreements.
VARIABLE INTEREST ENTITIES AND OFF-BALANCE SHEET ARRANGEMENTS
Unfunded Lending Commitments Table 11
March 31
2005 December 31
2004 (Dollars in millions) (Unaudited)
Unused lines of credit
Commercial $36,408.2 $37,316.5Mortgage commitments 16,829.7 14,710.5Home equity lines 13,002.4 12,120.6Commercial real estate 6,199.4 5,938.5Commercial paper conduit 6,145.0 5,902.9Commercial credit card 1,021.5 986.6
Total unused lines of credit $79,606.2 $76,975.6 Letters of credit
Financial standby $10,634.1 $10,560.0Performance standby 309.1 416.0Commercial 152.2 149.1
Total letters of credit $11,095.4 $11,125.1
See Note 10 of the Notes to Consolidated Financial Statements contained in this Quarterly Report on Form 10-Q for a detailed discussion of SunTrust’s off-balance sheet arrangements. DERIVATIVES Derivative financial instruments are components of the Company’s risk management profile. These instruments include interest rate swaps, options, futures, forward contracts and credit default swaps. The Company also enters into derivative instruments as a service to banking customers. In the normal course of business, the Company monitors and offsets its market risk exposure with dealers. The Company monitors its sensitivity to changes in interest rates and may use derivative instruments to hedge this risk. All derivatives are recorded in the financial statements at fair value.
46

ˆ1RGPMSXLMLS8KLG&Š1RGPMSXLMLS8KLG
86547 TX 47SUNTRUST BANKS, INC.10-Q
06-May-2005 10:38 ESTHTMRVA
RR Donnelley ProFile TOR dsach0dc 3*ESS 0C
TORFBU-MWS-CX018.8.12
Page 1 of 1
Derivative hedging instrument activities are as follows:
Derivative Hedging Instruments Table 12
Notional Values1
(Dollars in millions)(Unaudited)
Asset Hedges
Liability Hedges
Total
Balance, January 1, 2004 $25 $9,474 $9,499 Additions 21 781 802 Maturities — (6) (6)
Balance, March 31, 2004 $46 $10,249 $10,295
Balance, January 1, 2005 $3,870 $13,482 $17,352 Additions — 2,173 2,173 Amortization (4) — (4)
Balance, March 31, 2005 $3,866 $15,655 $19,521
47
1 Excludes the hedging activity for the Company’s mortgage loans in warehouse. At March 31, 2005 and 2004, mortgage notional amounts totaled $4.7 billion and $3.8 billion, respectively.

ˆ1RGPMSXLMLTTD2G!Š1RGPMSXLMLTTD2G
86547 TX 48SUNTRUST BANKS, INC.10-Q
06-May-2005 10:39 ESTHTMRVA
RR Donnelley ProFile TOR dsach0dc 4*ESS 0C
TORFBU-MWS-CX018.8.12
Page 1 of 2
The following table shows the derivative instruments entered into by the Company as an end-user:
Risk Management Derivative Financial Instruments 1 Table 13
As of March 31, 2005
(Dollars in millions)(Unaudited)
NotionalAmount
Gross Unrealized
Gains7
Gross Unrealized
Losses7
Equity 9
Average Maturity
in Yrs
Asset Hedges
Cash flow hedges
Interest rate swaps 2 $3,800 $— $(49) $(32) 2.15Fair value hedges:
Interest rate swaps 3 66 1 — — 2.43Forward contracts 4 4,661 62 — — 0.07
Total asset hedges $8,527 $63 $(49) $(32) 1.02
Liability Hedges
Cash flow hedges
Interest rate swaps 5 $6,115 $71 $— $46 2.03Fair value hedges
Interest rate swaps 6 9,540 26 (191) — 6.54
Total liability hedges $15,655 $97 $(191) $46 4.78
Terminated/Dedesignated Liability Hedges
Cash flow hedges
Interest rate swaps8 $(12) 2.33
Total terminated/dedesignated hedges $(12) 2.33
1 Includes only derivative financial instruments which are currently, or previously designated as, qualifying hedges under SFAS No. 149. All of the Company’s other derivative instruments are classified as trading. All interest rate swaps have resets of three months or less, and are the pay and receive rates in effect at March 31, 2005.
2 Represents interest rate swaps designated as cash flow hedges of commercial loans.
3 Represents interest rate swaps designated as fair value hedges of fixed rate loans and repurchase agreements.
4 Forward contracts are designated as fair value hedges of closed mortgage loans, including both fixed and floating, which are held for sale. Certain other forward contracts which are effective for risk management purposes, but which are not in designated hedging relationships under SFAS No. 149, are not incorporated in this table.
5 Represents interest rate swaps designated as cash flow hedges of floating rate certificates of deposit, Global Bank Notes, FHLB Advances and other variable rate debt.
6 Represents interest rate swaps designated as fair value hedges of trust preferred securities, subordinated notes, FHLB Advances, certificate and term deposits and other fixed rate debt.
7 Represents the fair value of derivative financial instruments less accrued interest receivable or payable.
8 Represents interest rate swaps that have been terminated and/or dedesignated as derivatives that qualify for hedge accounting. The interest rate swaps were designated as cash flow hedges of floating rate debt and tax exempt bonds. The $12.2 million of net losses, net of taxes recorded in accumulated other comprehensive income will be reclassified into earnings as interest expense over the life of the respective hedged items.
9 At March 31, 2005, the net unrealized gain on derivatives included in accumulated other comprehensive income, which is a component of stockholders’ equity, was $2.4 million, net of tax, that represents the effective portion of the net gains and losses on derivatives under qualifying cash flow hedging relationships. Gains or losses on hedges of interest rate risk will be classified into interest income or expense as a yield adjustment of the hedged item in the same period that the hedged cash flows impact earnings. As of March 31, 2005, $9.4 million of net gains, net of taxes recorded in accumulated other comprehensive income, are expected to be reclassified as interest expense or interest income during the next twelve months.

ˆ1RGPMSXLMLTTD2G!Š1RGPMSXLMLTTD2G
86547 TX 48SUNTRUST BANKS, INC.10-Q
06-May-2005 10:39 ESTHTMRVA
RR Donnelley ProFile TOR dsach0dc 4*ESS 0C
TORFBU-MWS-CX018.8.12
Page 2 of 2
48

ˆ1RGPMSXLMLWJ9XGÅŠ1RGPMSXLMLWJ9XG
86547 TX 49SUNTRUST BANKS, INC.10-Q
06-May-2005 10:40 ESTHTMRVA
RR Donnelley ProFile TOR dsach0dc 6*ESS 0C
TORFBU-MWS-CX018.8.12
Page 1 of 2
As of December 31, 20041
(Dollars in millions) (Unaudited)
Notional Amount
Gross UnrealizedGains
Gross Unrealized
Losses7
Equity9
Average Maturityin Years
Asset Hedges Cash flow hedges
Interest rate swaps2 $3,800 $1 $(20) $(13) 2.39Fair value hedges:
Interest rate swaps3 70 1 — — 2.88Forward contracts4 5,024 11 — — 0.06
Total asset hedges $8,894 $13 $(20) $(13) 1.09
Liability Hedges
Cash flow hedges
Interest rate swaps5 $6,015 43 $(13) $20 2.27Fair value hedges
Interest rate swaps6 7,467 67 (106) — 8.26
Total liability hedges $13,482 $110 $(119) $20 5.58
Terminated/Dedesignated Liability Hedges
Cash flow hedges
Interest rate swaps8 $— $— $— $(14) 2.58
Total terminated/dedesignated hedges $— $— $— $(14) 2.58
1 Includes only derivative financial instruments which are currently, or were previously designated as, qualifying hedges under SFAS No. 149. All of the Company’s other derivative instruments are classified as trading. All interest rate swaps have resets of three months or less, and are the pay and receive rates in effect at December 31, 2004.
2 Represents interest rate swaps designated as cash flow hedges of commercial loans.
3 Represents interest rate swaps designated as fair value hedges of fixed-rate loans and reverse purchase agreements.
4 Forward contracts are designated as fair value hedges of closed mortgage loans, including both fixed and floating, which are held for sale. Certain other forward contracts which are effective for risk management purposes, but which are not in designated hedging relationships under SFAS No. 149, are not incorporated in this table.
5 Represents interest rate swaps designated as cash flow hedges of floating rate certificates of deposit, Global Bank Notes, FHLB Advances and other variable rate debt.
6 Represents interest rate swaps designated as fair value hedges of trust preferred securities, subordinated notes, FHLB Advances and other fixed rate debt.
7 Represents the fair value of derivative financial instruments less accrued interest receivable or payable.
8 Represents interest rate swaps that have been terminated or dedesignated as hedges under the provisions of SFAS No. 149. The $13.8 million of net losses, net of taxes recorded in accumulated other comprehensive income will be reclassified into earnings as a component of interest expense over the life of the originally hedged period, with the latest period being 2011.
CAPITAL RESOURCES
9 At December 31, 2004, the net unrealized gain on derivatives included in accumulated other comprehensive income, which is a component of stockholders’ equity, was $6.6 million, net of tax, that represents the effective portion of the net gains and losses on derivatives that qualify as cashflow hedges. This includes an unrealized gain of $7.2 million on active hedges offset by a $13.8 million loss on terminated/designated hedges. Gains or losses on hedges of interest rate risk will be classified into interest income or expense as a yield adjustment of the hedged item in the same period that the hedged cash flows impact earnings. As of December 31, 2004, $12.1 million of net gains, net of taxes recorded in accumulated other comprehensive income, are expected to be reclassified as interest expense or interest income during the next twelve months.
SunTrust’s primary regulator, the Federal Reserve, measures capital adequacy within a framework that makes capital requirements sensitive to the risk profiles of individual banking companies. The guidelines weight assets and off balance sheet risk exposures (risk

ˆ1RGPMSXLMLWJ9XGÅŠ1RGPMSXLMLWJ9XG
86547 TX 49SUNTRUST BANKS, INC.10-Q
06-May-2005 10:40 ESTHTMRVA
RR Donnelley ProFile TOR dsach0dc 6*ESS 0C
TORFBU-MWS-CX018.8.12
Page 2 of 2
weighted assets) according to predefined classifications, creating a base from which to compare capital levels. Tier 1 Capital primarily includes realized equity and qualified preferred instruments, less purchase accounting intangibles such as goodwill and core deposit intangibles. Total Capital consists of Tier 1 Capital and Tier 2 Capital, which includes qualifying portions of subordinated debt, allowance for loan loss up to a maximum of 1.25% of risk weighted assets, and 45% of the unrealized gain on equity securities.
49

ˆ1RGPMSXLN1G7MLGGŠ1RGPMSXLN1G7MLG
86547 TX 50SUNTRUST BANKS, INC.10-Q
06-May-2005 14:52 ESTHTMRVA
RR Donnelley ProFile TOR panda0dc 4*ESS 0C
TORFBU-MWS-CX018.8.12
Page 1 of 1
The Company and subsidiary banks are subject to a minimum Tier 1 Risk-Based Capital and Total Capital ratios of 4% and 8%, respectively, of risk weighted assets. To be considered “well capitalized” ratios of 6% and 10%, respectively, are needed. Additionally, the Company and the Banks are subject to Tier 1 Leverage ratio requirements, which measures Tier 1 Capital against average assets for the quarter. The minimum and well-capitalized ratios are 3% and 5%, respectively. As of March 31, 2005, SunTrust Banks, Inc. had Tier 1, Total Capital, and Tier 1 Leverage ratios of 7.07%, 10.44% and 6.61%, respectively. SunTrust is committed to remaining well capitalized. In 2004, the Company issued approximately 76.4 million shares of SunTrust common stock with an aggregate value of approximately $5.4 billion for the purchase of NCF. The remaining $1.8 billion of the purchase price was funded with cash generated by a combination of $800 million of wholesale CDs issued in May of 2004 and $1 billion of senior debt issued in August of 2004. In 2002, the Company raised $350 million of regulatory capital through the sale of preferred shares issued by a real estate investment trust subsidiary. This amount is reflected in other liabilities and totaled $461.0 million and $451.0 million, including accrued interest, as of March 31, 2005 and December 31, 2004, respectively. SunTrust manages capital through dividends and share repurchases authorized by the Company’s Board of Directors. Management assesses capital needs based on expected growth and the current economic climate. In the first quarter of 2005, the Company repurchased 995,000 shares for $71.4 million compared to 200,000 shares for $14.1 million repurchased in the first quarter of 2004. As of March 31, 2005, the Company was authorized to purchase up to an additional 5.0 million shares under current Board authorization.
50
Capital Ratios Table 14
March 31
2005
December 31
2004 (Dollars in millions) (Unaudited)
Tier 1 capital $ 10,035.2 $ 9,783.7 Total capital 14,812.7 14,152.6 Risk-weighted assets 141,858.4 136,642.8 Risk-based ratios:
Tier 1 capital 7.07 % 7.16 %Total capital 10.44 10.36
Tier 1 leverage ratio 6.61 6.64 Total average shareholders’ equity to average assets (year-to-date) 10.00 % 8.58 %Total shareholder’s equity to assets 9.77 10.06

ˆ1RGPMSXLJFF9JTG}Š1RGPMSXLJFF9JTG
86547 TX 51SUNTRUST BANKS, INC.10-Q
05-May-2005 13:03 ESTHTMRVA
RR Donnelley ProFile TOR shinv0dc 1*IFV 0C
TORFBU-MWS-CX018.8
Page 1 of 1
Item 3. QUANTITATIVE AND QUALITATIVE DISCLOSURES ABOUT MARKET RISK
Refer to Management’s Discussion and Analysis of Financial Condition and Results of Operations for a discussion of market risk on pages 41-44.
Item 4. CONTROLS AND PROCEDURES
Evaluation of disclosure controls and procedures
The Company conducted an evaluation, with the participation of its Chief Executive Officer and Chief Financial Officer, of the effectiveness of the Company’s disclosure controls and procedures as of March 31, 2005. The Company’s disclosure controls and procedures are designed to ensure that information required to be disclosed by the Company in the reports that it files or submits under the Exchange Act is recorded, processed, summarized and reported on a timely basis.
Based upon that evaluation, the Chief Executive Officer and Chief Financial Officer concluded that, for the reasons set forth below, the Company’s disclosure controls and procedures were not effective as of March 31, 2005 to give reasonable assurance in alerting them in a timely fashion to material information relating to SunTrust that is required to be included in the reports that the Company files under the Exchange Act. In addition, the Company believes that a controls system, no matter how well designed and operated, cannot provide absolute assurance that the objectives of the controls system are met and no evaluation of controls can provide absolute assurance that all control issues and instances of fraud, if any, within a company have been detected.
Changes in internal control over financial reporting
As discussed in the Explanatory Note contained in Part I, Item 1 of this report, the Company restated its previously issued financial results for the quarterly periods ended March 31, 2004 and June 30, 2004. These restatements were related to errors in the calculation of the Company’s Allowance for Loan and Lease Losses during these periods. As described in Management’s Report on Internal Control over Financial Reporting contained in the Company’s Annual Report on Form 10-K for the year ended December 31, 2004, as of the end of the period covered by that report, the Company had a material weakness in internal control over financial reporting relating to the calculation of the ALLL. As of the end of the period covered by this report, the Company has not eliminated the material weakness in the Company’s internal control over financial reporting relating to the ALLL, although the Company has taken the following remedial actions:
• The Company’s ALLL Committee has been reconstituted and ALLL governance and oversight has been elevated to include executive management. ALLL staff resources have been increased and enhanced.
• The ALLL Policy and Procedure Manuals have been rewritten and enhanced.
• The Company has enhanced the ALLL framework and improved the internal controls around the ALLL process by developing, documenting and testing additional financial reporting controls. Internal controls surrounding the documentation, validation and testing of systems and models relating to the ALLL process have been strengthened, but continue to be augmented.
At this time the Company is not able to predict with certainty when the material weakness will be eliminated.
51

ˆ1RGPMSXLKQ3NBKG9Š1RGPMSXLKQ3NBKG
86547 TX 52SUNTRUST BANKS, INC.10-Q
05-May-2005 22:09 ESTHTMRVA
RR Donnelley ProFile TOR dhayk0dc 3*ESS 0C
TORFBU-MWS-CX058.8.12
Page 1 of 1
Since the date of the acquisition of NCF on October 1, 2004, the Company has been incorporating the businesses of NCF into the Company’s existing controls and procedures. Effective April 22, 2005, National Bank of Commerce merged with and into SunTrust Bank, and in connection with such merger substantially all of the systems of NBC were converted to SunTrust Bank’s systems. The conversion of the NBC systems to SunTrust Bank’s systems represents the most significant aspect of the transition of NCF’s businesses to the Company’s controls and procedures.
Other than the changes identified above, there have been no changes to the Company’s internal control over financial reporting that occurred since the beginning of the Company’s first quarter of 2005 that have materially affected, or are reasonably likely to materially affect, the Company’s internal control over financial reporting.
PART II - OTHER INFORMATION
ITEM 1. LEGAL PROCEEDINGS
On January 11, 2005, the Securities and Exchange Commission issued a formal order of investigation. The SEC staff has issued subpoenas seeking documents and testimony related to the Company’s ALLL and related matters. The Company is cooperating, and intends to cooperate with the SEC regarding this matter. In addition, the Company and its subsidiaries are parties to numerous claims and lawsuits arising in the course of their normal business activities, some of which involve claims for substantial amounts. Although the ultimate outcome of these suits cannot be ascertained at this time, it is the opinion of management that none of these matters, when resolved, will have a material effect on the Company’s consolidated results of operations or financial position.
ITEM 2. UNREGISTERED SALES OF EQUITY SECURITIES AND USE OF PROCEEDS
Issuer Purchases of Equity Securities in 2005:
Total number ofshares
purchased1
Average price paid per share
Number of shares purchased as part ofpublicly announced plans or programs
Maximum numberof shares that may yet be purchased
under the plans or
programs2
January 1-31 485,000 $71.31 485,000 5,542,796February 1-28 365,000 72.18 365,000 5,177,796March 1-31 145,000 72.25 145,000 5,032,796
Total 995,000 $71.77 995,000
1 In addition to these repurchases, pursuant to SunTrust’s employee stock option plans, participants may exercise SunTrust stock options by surrendering shares of SunTrust common stock the participants already own as payment of the option exercise price. Shares so surrendered by participants in SunTrust’s employee stock option plans are repurchased pursuant to the terms of the applicable stock option plan and not pursuant to publicly announced share repurchase programs. For the quarter ended March 31, 2005, the following shares of SunTrust common stock were surrendered by participants in SunTrust’s employee stock option plans: January 2005 - 20,857 shares at an average price per share of $70.75; February 2005 - 15,206 shares at an average price per share of $72.56; March 2005 - 10,071 shares at an average price per share of $72.84.
52
2 On November 12, 2002, the Board of Directors authorized the purchase of 10 million shares of SunTrust common stock in addition to 2,796 shares which were remaining from a June 13, 2001 authorization. There is no expiration date for this authorization. The Company has not determined to terminate the program and no programs expired during the period covered by the table.

ˆ1RGPMSXLJFFLPSGlŠ1RGPMSXLJFFLPSG
86547 TX 53SUNTRUST BANKS, INC.10-Q
05-May-2005 13:03 ESTHTMRVA
RR Donnelley ProFile TOR shinv0dc 1*IFV 0C
TORFBU-MWS-CX018.8
Page 1 of 1
ITEM 3. DEFAULTS UPON SENIOR SECURITIES
None
ITEM 4. SUBMISSION OF MATTERS TO A VOTE OF SECURITY HOLDERS
None
ITEM 5. OTHER INFORMATION
On February 8, 2005, the Company set compensation for certain of its executive officers. The Company filed a Current Report on Form 8-K with respect to such action on March 14, 2005.
ITEM 6. EXHIBITS
• Exhibit 10.1 – Fourth Amendment to the SunTrust Banks, Inc. Supplemental Executive Retirement Plan, dated February 10, 2005, incorporated by reference to the Company’s Current Report on Form 8-K filed on February 11, 2005.
• Exhibit 10.2 – Description of compensation payable to certain executive officers of the Company, incorporated by reference to the Company’s Current Report on Form 8-K filed March 14, 2005.
• Exhibit 31.1 – Certification of Chairman of the Board and CEO, pursuant to 18 U.S.C. Section 1350, as adopted pursuant to Section 302 of the Sarbanes-Oxley Act of 2002.
• Exhibit 31.2 – Certification of Chief Financial Officer pursuant to 18 U.S.C. Section 1350, as adopted pursuant to Section 302 of the Sarbanes-Oxley Act of 2002.
• Exhibit 32.1 – Certification of Chairman of the Board and CEO, pursuant to 18 U.S.C. Section 1350, as adopted pursuant to Section 906 of the Sarbanes-Oxley Act of 2002.
SIGNATURES
Pursuant to the requirements of the Securities Exchange Act of 1934, the Registrant has duly caused this report to be signed on its behalf by the undersigned thereunto duly authorized this 6th day of May, 2005.
53
• Exhibit 32.2 – Certification of Chief Financial Officer pursuant to 18 U.S.C. Section 1350, as adopted pursuant to Section
906 of the Sarbanes-Oxley Act of 2002.
SunTrust Banks, Inc.(Registrant)
/S/ Thomas E. PantherThomas E. Panther
Senior Vice President and Controller (Chief Accounting Officer)

ˆ1RGPMSXLJF67Q7G}Š1RGPMSXLJF67Q7G
86547 EX31_1 1SUNTRUST BANKS, INC.10-Q
05-May-2005 13:02 ESTHTMRVA
RR Donnelley ProFile TOR shinv0dc 1*IFV 0C
TORFBU-MWS-CX018.8
Page 1 of 1
EXHIBIT 31.1
CERTIFICATION PURSUANT TO SECTION 302 OF THE SARBANES-OXLEY ACT OF 2002
SEC RELEASE NO. 33-8124 I, L. Phillip Humann, Chairman of the Board and Chief Executive Officer of the Company, certify that: (1) I have reviewed this quarterly report on Form 10-Q of SunTrust Banks, Inc.;
(2) Based on my knowledge, this report does not contain any untrue statement of a material fact or omit to state a material fact
necessary to make the statements made, in light of the circumstances under which such statements were made, not misleading with respect to the period covered by this report;
(3) Based on my knowledge, the financial statements, and other financial information included in this report, fairly present in
all material respects the financial condition, results of operations and cash flows of the registrant as of, and for, the periods presented in this report;
(4) The registrant’s other certifying officers and I are responsible for establishing and maintaining disclosure controls and
procedures (as defined in Exchange Act Rules 13a-15(e) and 15d-15(e)) and internal control over financial reporting (as defined in Exchange Act Rules 13a-15(f) and 15d-15(f)) for the registrant and have:
(a) Designed such disclosure controls and procedures, or caused such disclosure controls and procedures to be designed under our supervision, to ensure that material information relating to the registrant, including its consolidated subsidiaries, is made known to us by others within those entities, particularly during the period in which this report is being prepared;
(b) Designed such internal control over financial reporting, or caused such internal control over financial reporting to be designed under our supervision, to provide reasonable assurance regarding the reliability of financial reporting and the preparation of financial statements for external purposes in accordance with generally accepted accounting principles;
(c) Evaluated the effectiveness of the registrant’s disclosure controls and procedures and presented in this report our
conclusions about the effectiveness of the disclosure controls and procedures, as of the end of the period covered by this report based on such evaluation; and
(d) Disclosed in this report any change in the registrant’s internal control over financial reporting that occurred during the registrant’s most recent fiscal quarter (the registrant’s fourth fiscal quarter in the case of an annual report) that has materially affected, or is reasonably likely to materially affect, the registrant’s internal control over financial reporting; and

ˆ1RGPMSXLKK0GSQGRŠ1RGPMSXLKK0GSQG
86547 EX31_1 2SUNTRUST BANKS, INC.10-Q
05-May-2005 20:12 ESTHTMRVA
RR Donnelley ProFile TOR desaj0dc 2*ESS 0C
CHWFBU-MWS-CX058.8.12
Page 1 of 1
(5) The registrant’s other certifying officers and I have disclosed, based on our most recent evaluation of internal control over
financial reporting, to the registrant’s auditors and the audit committee of the registrant’s board of directors (or persons performing the equivalent functions):
(a) All significant deficiencies and material weaknesses in the design or operation of internal control over financial
reporting which are reasonably likely to adversely affect the registrant’s ability to record, process, summarize and report financial information; and
Date: May 6, 2005
(b) Any fraud, whether or not material, that involves management or other employees who have a significant role in the
registrant’s internal control over financial reporting.
/s/ L. Phillip Humann L. Phillip Humann Chairman of the Board and Chief Executive Officer
ˆ1RGPMSXLJF6JW6GlŠ1RGPMSXLJF6JW6G
86547 EX31_2 1SUNTRUST BANKS, INC.10-Q
05-May-2005 13:02 ESTHTMRVA
RR Donnelley ProFile TOR shinv0dc 1*IFV 0C
TORFBU-MWS-CX018.8
Page 1 of 1
EXHIBIT 31.2
CERTIFICATION PURSUANT TO SECTION 302 OF THE SARBANES-OXLEY ACT OF 2002
SEC RELEASE NO. 33-8124
I, Mark A. Chancy, Corporate Executive Vice President and Chief Financial Officer of the Company, certify that: (1) I have reviewed this quarterly report on Form 10-Q of SunTrust Banks, Inc.;
(2) Based on my knowledge, this report does not contain any untrue statement of a material fact or omit to state a material fact
necessary to make the statements made, in light of the circumstances under which such statements were made, not misleading with respect to the period covered by this report;
(3) Based on my knowledge, the financial statements, and other financial information included in this report, fairly present in
all material respects the financial condition, results of operations and cash flows of the registrant as of, and for, the periods presented in this report;
(4) The registrant’s other certifying officers and I are responsible for establishing and maintaining disclosure controls and
procedures (as defined in Exchange Act Rules 13a-15(e) and 15d-15(e)) and internal control over financial reporting (as defined in Exchange Act Rules 13a-15(f) and 15d-15(f)) for the registrant and have:
(a) Designed such disclosure controls and procedures, or caused such disclosure controls and procedures to be designed under our supervision, to ensure that material information relating to the registrant, including its consolidated subsidiaries, is made known to us by others within those entities, particularly during the period in which this report is being prepared;
(b) Designed such internal control over financial reporting, or caused such internal control over financial reporting to be designed under our supervision, to provide reasonable assurance regarding the reliability of financial reporting and the preparation of financial statements for external purposes in accordance with generally accepted accounting principles;
(c) Evaluated the effectiveness of the registrant’s disclosure controls and procedures and presented in this report our
conclusions about the effectiveness of the disclosure controls and procedures, as of the end of the period covered by this report based on such evaluation; and
(d) Disclosed in this report any change in the registrant’s internal control over financial reporting that occurred during the registrant’s most recent fiscal quarter (the registrant’s fourth fiscal quarter in the case of an annual report) that has materially affected, or is reasonably likely to materially affect, the registrant’s internal control over financial reporting; and

ˆ1RGPMSXLKK1THXGeŠ1RGPMSXLKK1THXG
86547 EX31_2 2SUNTRUST BANKS, INC.10-Q
05-May-2005 20:13 ESTHTMRVA
RR Donnelley ProFile TOR desaj0dc 2*ESS 0C
CHWFBU-MWS-CX058.8.12
Page 1 of 1
(5) The registrant’s other certifying officers and I have disclosed, based on our most recent evaluation of internal control over
financial reporting, to the registrant’s auditors and the audit committee of the registrant’s board of directors (or persons performing the equivalent functions):
(a) All significant deficiencies and material weaknesses in the design or operation of internal control over financial
reporting which are reasonably likely to adversely affect the registrant’s ability to record, process, summarize and report financial information; and
Date: May 6, 2005
(b) Any fraud, whether or not material, that involves management or other employees who have a significant role in the
registrant’s internal control over financial reporting.
/s/ Mark A. Chancy Mark A. Chancy Corporate Executive Vice President and Chief Financial Officer

ˆ1RGPMSXLKK4CXMGWŠ1RGPMSXLKK4CXMG
86547 EX32_1 1SUNTRUST BANKS, INC.10-Q
05-May-2005 20:14 ESTHTMRVA
RR Donnelley ProFile TOR patea0dc 2*ESS 0C
CHWFBU-MWS-CX058.8.12
Page 1 of 1
EXHIBIT 32.1
CERTIFICATION PURSUANT TO 18 U.S.C. SECTION 1350,
AS ADOPTED PURSUANT TO SECTION 906 OF THE SARBANES-OXLEY ACT OF 2002
In connection with the Quarterly Report on Form 10-Q of SunTrust Banks, Inc. (the “Company”) for the quarter ended March
31, 2005, as filed with the Securities and Exchange Commission on the date hereof (the “Report”), I, L. Phillip Humann, Chairman of the Board and Chief Executive Officer of the Company, certify, pursuant to 18 U.S.C. Section 1350, as adopted pursuant to Section 906 of the Sarbanes-Oxley Act of 2002, that:
(1) The Report fully complies with the requirements of Section 13(a) or 15(d) of the Securities Exchange Act of 1934 (15 U.S.C. 78m or 78o(d)); and
Date: May 6, 2005
(2) The information contained in the Report fairly presents, in all material respects, the financial condition and results of operations of the Company.
/s/ L. Phillip Humann L. Phillip Humann Chairman of the Board and Chief Executive Officer
ˆ1RGPMSXLKK6S60GGŠ1RGPMSXLKK6S60G
86547 EX32_2 1SUNTRUST BANKS, INC.10-Q
05-May-2005 20:15 ESTHTMRVA
RR Donnelley ProFile TOR desaj0dc 2*ESS 0C
CHWFBU-MWS-CX058.8.12
Page 1 of 1
EXHIBIT 32.2
CERTIFICATION PURSUANT TO 18 U.S.C. SECTION 1350,
AS ADOPTED PURSUANT TO SECTION 906 OF THE SARBANES-OXLEY ACT OF 2002
In connection with the Quarterly Report on Form 10-Q of SunTrust Banks, Inc. (the “Company”) for the quarter ended March
31, 2005 as filed with the Securities and Exchange Commission on the date hereof (the “Report”), I, Mark A. Chancy, Corporate Executive Vice President and Chief Financial Officer of the Company, certify, pursuant to 18 U.S.C. Section 1350, as adopted pursuant to Section 906 of the Sarbanes-Oxley Act of 2002, that:
(1) The Report fully complies with the requirements of Section 13(a) or 15(d) of the Securities Exchange Act of 1934 (15 U.S.C. 78m or 78o(d)); and
Date: May 6, 2005
(2) The information contained in the Report fairly presents, in all material respects, the financial condition and results of operations of the Company.
/s/ Mark A. Chancy Mark A. Chancy Corporate Executive Vice President and Chief
Financial Officer