sunedison technical analysis charts
TRANSCRIPT
December 21, 2015
SUNE: SunEdison technical analysis charts
On Friday, compared to Thursday, price action opened lower (6.19, vs Thursday's
close of 6.25), saw a lower high (6.64, vs Thursday's high of 6.88) but higher low
(6.08, vs Thursday's low of 5.90); and closed higher (6.51, vs Thursday's close of
6.25). The day's range was 56 ticks.
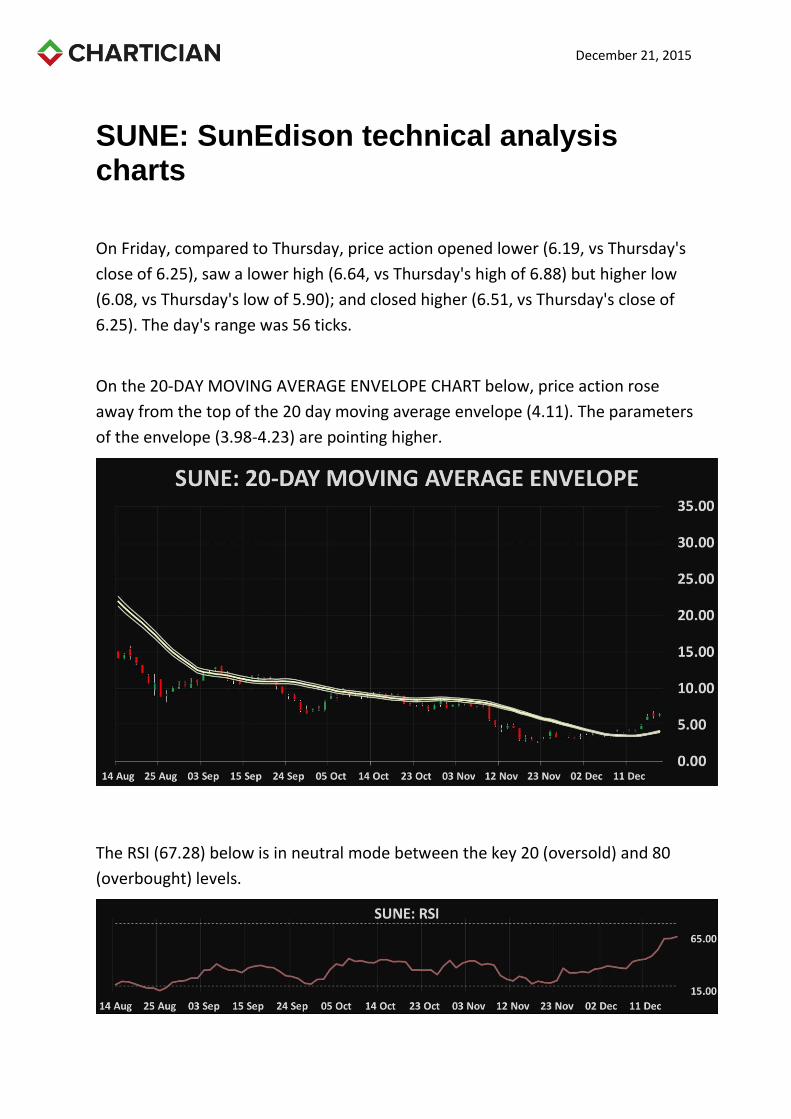
On the 20-DAY MOVING AVERAGE ENVELOPE CHART below, price action rose
away from the top of the 20 day moving average envelope (4.11). The parameters
of the envelope (3.98-4.23) are pointing higher.
The RSI (67.28) below is in neutral mode between the key 20 (oversold) and 80
(overbought) levels.
December 21, 2015
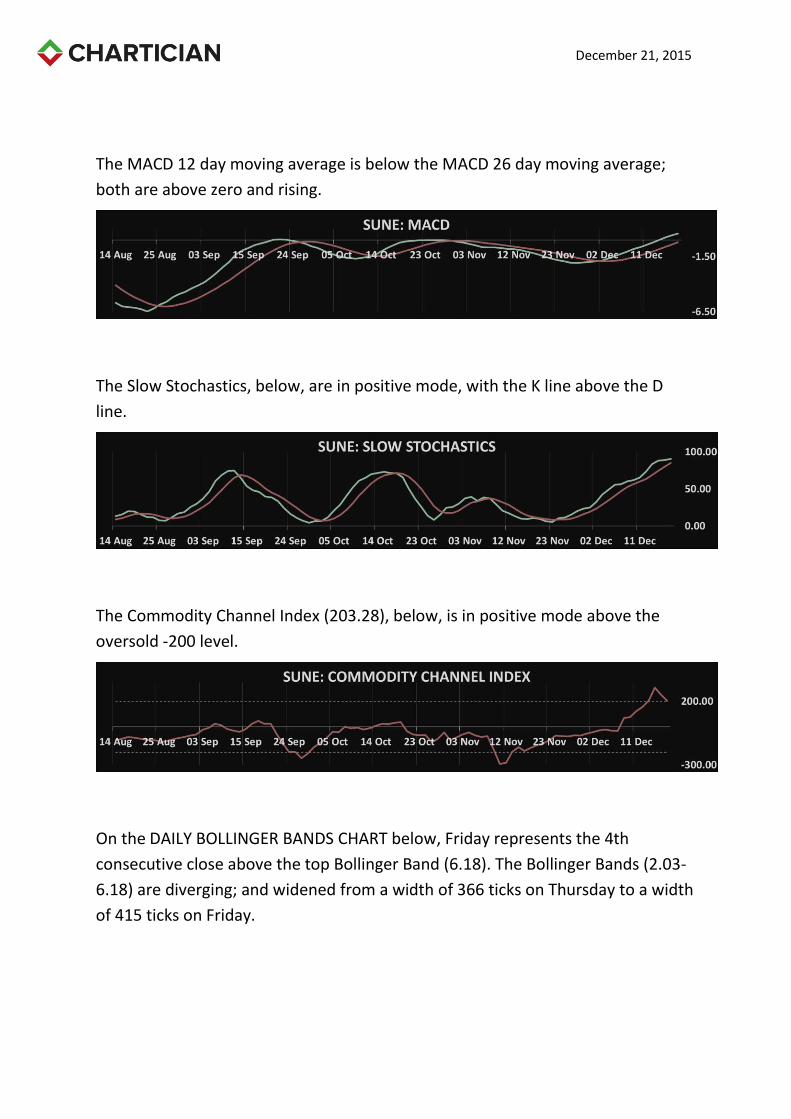
The MACD 12 day moving average is below the MACD 26 day moving average;
both are above zero and rising.
The Slow Stochastics, below, are in positive mode, with the K line above the D
line.
The Commodity Channel Index (203.28), below, is in positive mode above the
oversold -200 level.
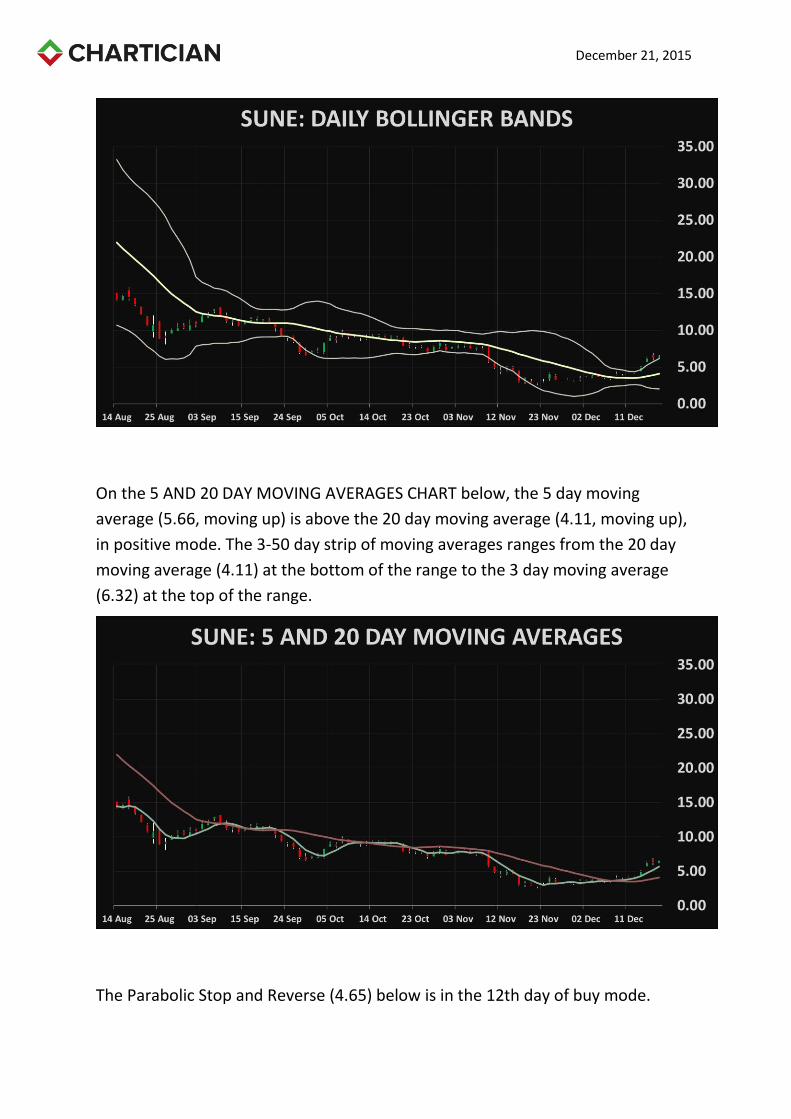
On the DAILY BOLLINGER BANDS CHART below, Friday represents the 4th
consecutive close above the top Bollinger Band (6.18). The Bollinger Bands (2.03-
6.18) are diverging; and widened from a width of 366 ticks on Thursday to a width
of 415 ticks on Friday.
December 21, 2015
On the 5 AND 20 DAY MOVING AVERAGES CHART below, the 5 day moving
average (5.66, moving up) is above the 20 day moving average (4.11, moving up),
in positive mode. The 3-50 day strip of moving averages ranges from the 20 day
moving average (4.11) at the bottom of the range to the 3 day moving average
(6.32) at the top of the range.
The Parabolic Stop and Reverse (4.65) below is in the 12th day of buy mode.
December 21, 2015
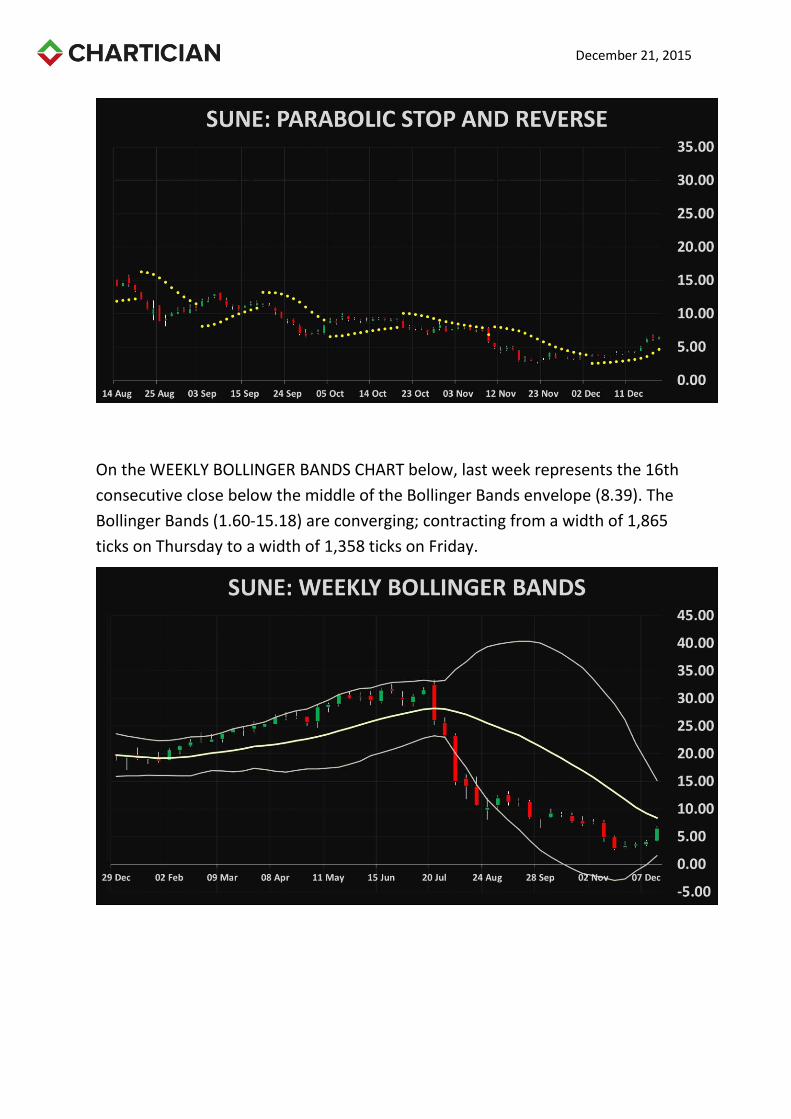
On the WEEKLY BOLLINGER BANDS CHART below, last week represents the 16th
consecutive close below the middle of the Bollinger Bands envelope (8.39). The
Bollinger Bands (1.60-15.18) are converging; contracting from a width of 1,865
ticks on Thursday to a width of 1,358 ticks on Friday.