superftatd records cent obaiehe · superftatd records cent site:... putting technology to work ne...
TRANSCRIPT

OBaieHeSuperftatd Records CentSITE:
. . . Putting Technology TO Work New England District
Contract No. DACW33-01-D-0004^M Delivery Order No! 01•IP^_« February 2002
Task 22C Post-Third Party ValidatedWater Chemistry Data Report
MANORPROJECT
SITE HUMANHEALTH AH) BASELINE

Section 1 PCB Aroclor and Chlorinated
Pesticide Results
QA/QC Narrative Water and QC Results

QA/QC Narrative
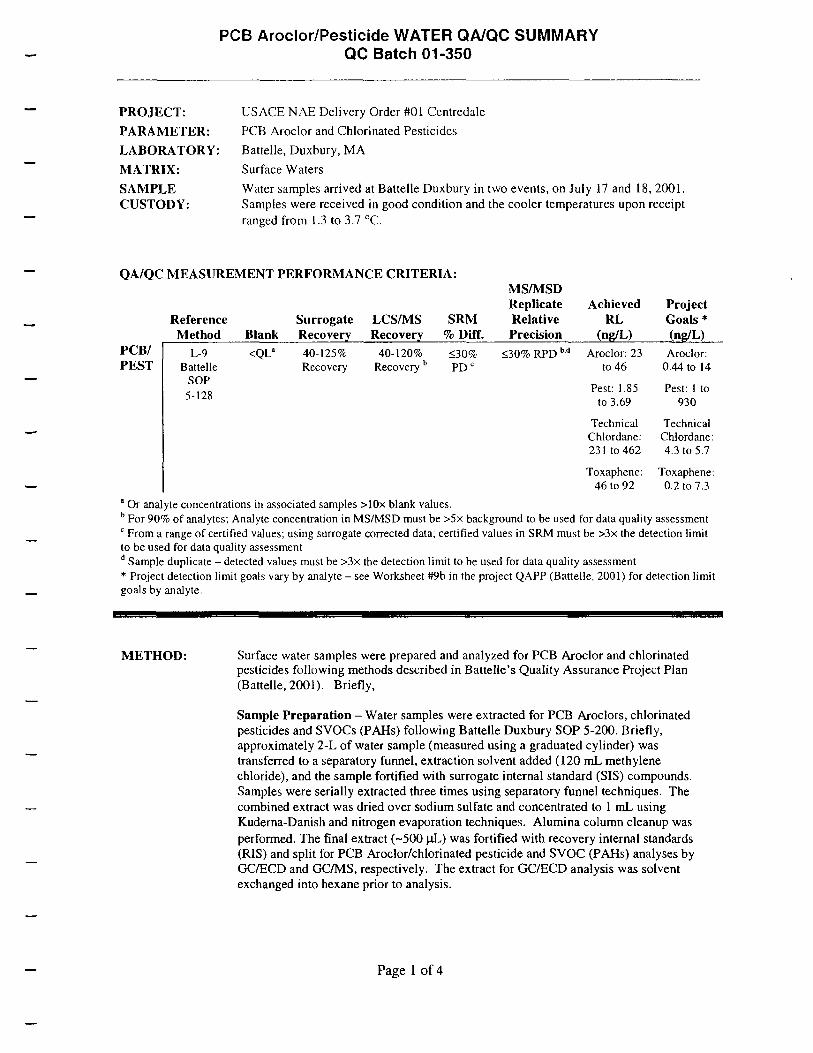
PCB Aroclor/Pesticide WATER QA/QC SUMMARY QC Batch 01-350
PROJECT: USAGE NAE Delivery Order #01 Centredale
PARAMETER: PCB Aroclor and Chlorinated Pesticides
LABORATORY: Battelle, Duxbury, MA
MATRIX: Surface Waters
SAMPLE Water samples arrived at Battelle Duxbury in two events, on July 17 and 18, 2001. CUSTODY: Samples were received in good condition and the cooler temperatures upon receipt
ranged from 1 3 to 3 7 °C.
QA/QC MEASUREMENT PERFORMANCE CRITERIA: MS/MSD Replicate Achieved Project
Reference Surrogate LCS/MS SRM Relative RL Goals* Method Blank Recovery Recovery % Diff. Precision (ng/L) (ng/L)
PCB/ L-9 <QLa 40-125% 40-120% <30% <30% RPDM Aroclor 23 Aroclor PEST Battelle Recovery Recovery b PD c to 46 044 to 14
SOP 5-128
Pest 1 85 to 3 69
Pest 1 to 930
Technical Technical Chlordane Chlordane 23 1 to 462 4 3 to 5 7
Toxaphene Toxaphene 46 to 92 0 2 to 7 3
a Or analyte concentrations in associated samples >10x blank values b For 90% of analytes, Analyte concentration in MS/MSD must be >5x background to be used for data quality assessment 0 From a range of certified values, using surrogate corrected data, certified values in SRM must be >3x the detection limit to be used for data quality assessment d Sample duplicate - detected values must be >3x the detection limit to be used for data quality assessment * Project detection limit goals vary by analyte - see Worksheet #9b in the project QAPP (Battelle, 2001) for detection limit goals by analyte
METHOD: Surface water samples were prepared and analyzed for PCB Aroclor and chlorinated pesticides following methods described in Battelle's Quality Assurance Project Plan (Battelle, 2001). Briefly,
Sample Preparation - Water samples were extracted for PCB Aroclors, chlorinated pesticides and SVOCs (PAHs) following Battelle Duxbury SOP 5-200. Briefly, approximately 2-L of water sample (measured using a graduated cylinder) was transferred to a separatory funnel, extraction solvent added (120 mL methylene chloride), and the sample fortified with surrogate internal standard (SIS) compounds Samples were serially extracted three times using separatory funnel techniques. The combined extract was dried over sodium sulfate and concentrated to 1 mL using Kuderna-Damsh and nitrogen evaporation techniques. Alumina column cleanup was performed. The final extract (-500 )JL) was fortified with recovery internal standards (RIS) and split for PCB Aroclor/chlorinated pesticide and SVOC (PAHs) analyses by GC/ECD and GC/MS, respectively. The extract for GC/ECD analysis was solvent exchanged into hexane prior to analysis.
Page 1 of 4
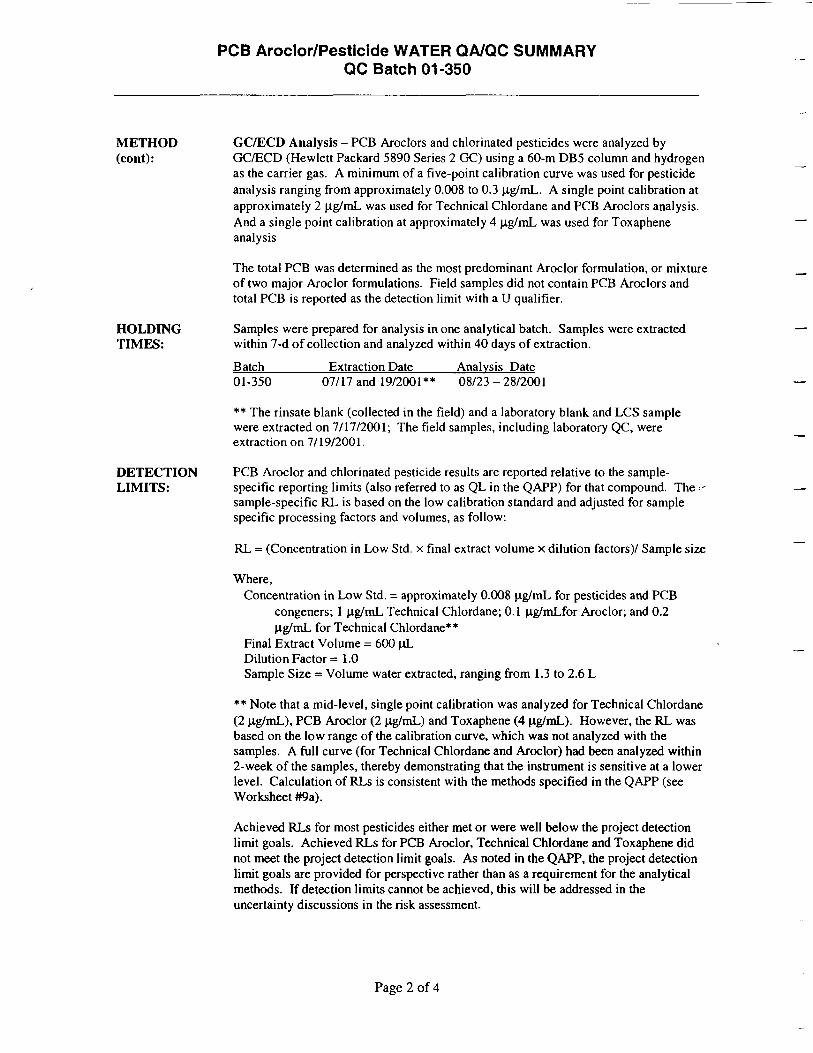
PCB Aroclor/Pesticide WATER QA/QC SUMMARY QC Batch 01-350
METHOD (cent):
HOLDING TIMES:
DETECTION LIMITS:
GC/ECD Analysis - PCB Aroclors and chlorinated pesticides were analyzed by GC/ECD (Hewlett Packard 5890 Series 2 GC) using a 60-m DBS column and hydrogen as the carrier gas. A minimum of a five-point calibration curve was used for pesticide analysis ranging from approximately 0.008 to 0.3 H-g/mL. A single point calibration at approximately 2 ng/mL was used for Technical Chlordane and PCB Aroclors analysis. And a single point calibration at approximately 4 |xg/mL was used for Toxaphene analysis
The total PCB was determined as the most predominant Aroclor formulation, or mixture of two major Aroclor formulations. Field samples did not contain PCB Aroclors and total PCB is reported as the detection limit with a U qualifier.
Samples were prepared for analysis in one analytical batch. Samples were extracted within 7-d of collection and analyzed within 40 days of extraction.
Batch Extraction Date Analysis Date 01-350 07/17 and 19/2001** 08/23 - 28/2001
** The rinsate blank (collected in the field) and a laboratory blank and LCS sample were extracted on 7/17/2001; The field samples, including laboratory QC, were extraction on 7/19/2001.
PCB Aroclor and chlorinated pesticide results are reported relative to the sample-specific reporting limits (also referred to as QL in the QAPP) for that compound. The sample-specific RL is based on the low calibration standard and adjusted for sample specific processing factors and volumes, as follow:
RL = (Concentration in Low Std. x final extract volume x dilution factors)/ Sample size
Where, Concentration in Low Std. = approximately 0.008 ng/mL for pesticides and PCB
congeners; 1 jig/mL Technical Chlordane; 0.1 jxg/mLfor Aroclor; and 0.2 H.g/mL for Technical Chlordane**
Final Extract Volume = 600 ^L Dilution Factor = 1.0 Sample Size = Volume water extracted, ranging from 1.3 to 2.6 L
** Note that a mid-level, single point calibration was analyzed for Technical Chlordane (2 fig/mL), PCB Aroclor (2 ug/mL) and Toxaphene (4 (xg/mL). However, the RL was based on the low range of the calibration curve, which was not analyzed with the samples. A full curve (for Technical Chlordane and Aroclor) had been analyzed within 2-week of the samples, thereby demonstrating that the instrument is sensitive at a lower level. Calculation of RLs is consistent with the methods specified in the QAPP (see Worksheet #9a).
Achieved RLs for most pesticides either met or were well below the project detection limit goals. Achieved RLs for PCB Aroclor, Technical Chlordane and Toxaphene did not meet the project detection limit goals. As noted in the QAPP, the project detection limit goals are provided for perspective rather than as a requirement for the analytical methods. If detection limits cannot be achieved, this will be addressed in the uncertainty discussions in the risk assessment.
Page 2 of 4

PCB Aroclor/Pesticide WATER QA/QC SUMMARY QC Batch 01-350
BLANKS:
LABORATORY CONTROL SAMPLE
MATRIX SPIKES:
SURROGATES:
Two laboratory procedural blanks (PB) were prepared with the analytical batch, one on July 17, 2001 and the other on July 19, 2001 The PB prepared on July 18, 2001 was prepared with the nnsate blank sample, the PB prepared on July 19, 2001 was prepared with the field samples Blanks were analyzed to ensure that the sample extraction and analysis methods were free of contamination
01-350 - PCB Aroclors and chlorinated pesticides were undetected in the laboratory blanks
Three laboratory control samples (LCS) were prepared with the analytical batch Two LCS samples were fortified with PCB congeners and chlorinated pesticides The other LCS was fortified with PCB Aroclor 1016 and 1260 The percent recoveries of PCB Aroclor and chlorinated pesticides were calculated to measure data quality in terms of accuracy
01-350 - PCB Aroclor and chlorinated pesticides were recovered within the control limits specified in QAPP
Recoveries ranged from
Pesticides PCB Aroclor ZC90LCS#1 56 89% not spiked ZC88LCS#2 not spiked 64 89% ZC62LCS#1 51-99% not spiked
One matrix spike (MS)/matnx spike duplicate (MSD) sample set was prepared with the batch to measure data quality in terms of accuracy and precision The MS and MSD however, were not fortified with representative compounds and as a result recovery and precision data are not available
Corrective Action - Recovery data from the LCS samples were acceptable, demonstrating that the analytical method is in control A PE sample, received from EPA Region 1, was also prepared with the batch and analyzed for PCB Aroclor and chlorinated pesticides These results will be evaluated by EPA Region 1 to assess data quality
Four PCB surrogate compounds were added to each sample prior to extraction, including PCBs 14, 34, 104, and 112 Recovery data for PCBs 34 and 112 were calculated to measure data quality in terms of accuracy (extraction efficiency) Recovery data for the other two PCB surrogate compounds are not reported, as these are used as alternative surrogates in cases of interferences
01-350 - PCB surrogates were recovered within the control limits specified in the QAPP
Page 3 of 4

PCB Aroclor/Pesticide WATER QA/QC SUMMARY QC Batch 01-350
REPLICATES: A laboratory duplicate was prepared with the batch. The RPD between laboratory replicate analyses for PCB Aroclor and chlorinated pesticides was calculated to measure data quality in terms of precision.
01-350 PCB Aroclors and chlorinated pesticides were undetected in the sample replicates; and as a result the RPD between samples is reported as NA (not applicable).
A sample duplicate was also collected in the field (sample WRL-DU-071701-A). PCB Aroclor and chlorinated pesticides were either undetected or detected at levels less than the RL in the field sample replicates. As a result the RPD between field sample replicates was not calculated.
SRM: There is no available SRM for PCB Aroclor and chlorinated pesticides in water. Battelle received a PE sample (PR582, Battelle ID W5430) from EPA Region 1 to prepare with the surface water samples. Results from this sample will be evaluated by EPA.
REFERENCES: Battelle 2001. Centredale Manor Restoration Project Superfund Site Baseline Risk Assessment, Initial Project Planning and Support. Tasks 19-22 QAPP prepared under contract to USAGE NAE. Delivery Order #59. May 23, 2001. 509pp +apps.
Page 4 of 4

Water and QC Results

o o
. Q.
) O
I OI W
.'p' I
CO
I '
O I 3i T
oc g
u
•E i
o
-Q
!
ili
1 UJ
!;
'1im
8N I

;88
;88
88
18
8

<
z
i O
<fl co
;gi
g.
ii i C
: E ii
O
Q.
<fi c
i
u.
wco

o> 8


I
u.
ITO«
=;Q


<
=> n z
'a. ck i > ^>
i ^»
a s
Oto
01 Q
O
IS ! CO
li
I a
a:
>-o o
O
O
i O O
cc
a. C
O3
cp to
CO

1C p
=! o
:$?
'99
11 I
ill

111
<=>
a) o>
O
> O
> a
a ii a
a is.a
•&> 'a "a a
III
CO
§
S a.
!g
I
i
; 2
ii
: oc
II
m S
a
a 5
^
S
Q. a. 0
.0.0
.0.0
.0.0
.0.0
.0.0
.0.0
.

13
3 8
.S
81•5
.0.0.0.0.0.0.0.0.0. Q
. 0. Q
. Q. 0
. O. O
. I


en oc


UJ
0.
s
(OW
9
!5l

LU
fe
WO
T
I


ES 0.
s
> < z
i i
I
> 8 b i
18 18i W
I N
N
I
I N

D
g
0 cc#
0.
i O
otn
m
;o
i
O
fe 9:
' m
UJ
a.
I (£
:S
;i i f
§
?
a =
UJ
§ 2 2
__ tn S
o
o o
im
^
55
<
z

19
88

Section 2 PAH Results
QA/QC Narrative Water and QC Results

QA/QC Narrative
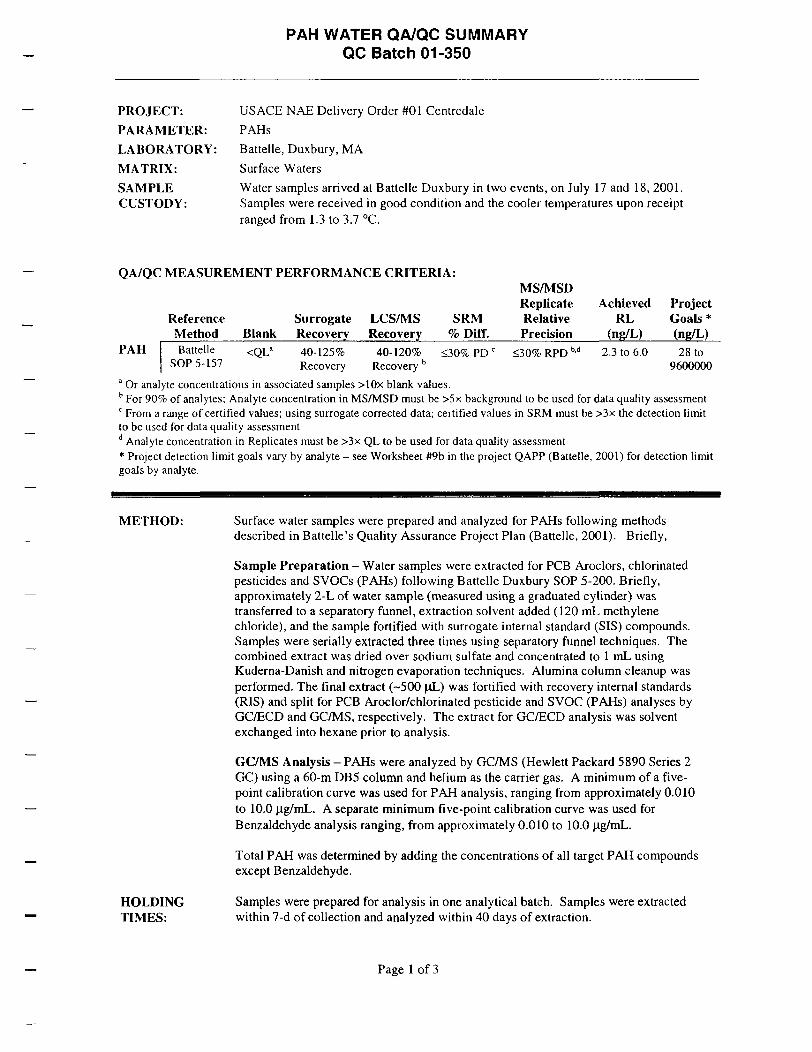
PAH WATER QA/QC SUMMARY QC Batch 01-350
PROJECT: USAGE NAE Delivery Order #01 Centredale
PARAMETER: PAHs
LABORATORY: Battelle, Duxbury, MA
MATRIX: Surface Waters
SAMPLE Water samples arrived at Battelle Duxbury in two events, on July 17 and 18, 2001 CUSTODY: Samples were received in good condition and the cooler temperatures upon receipt
ranged from 1 3 to 3 7 °C
QA/QC MEASUREMENT PERFORMANCE CRITERIA: MS/MSD Replicate Achieved Project
Reference Surrogate LCS/MS SRM Relative RL Goals* Method Blank Recovery Recovery % Diff. Precision (ng/L) (ng/L)
PAH Battelle <QL" 40 125% 40-120% <30% PD c <30%RPDb d 2 3 to 6 0 28 to SOPS 157 Recovery Recovery b 9600000
a Or analyte concentrations in associated samples >10x blank values b For 90% of analytes Analyte concentration in MS/MSD must be >5x background to be used for• i data quality assessment c From a range of certified values using surrogate corrected data certified values in SRM must be : : >3x the detection limit to be used for data quality assessment d Analyte concentration in Replicates must be >3x QL to be used for data quality assessment * Project detection limit goals vary by analyte - see Worksheet #9b in the project QAPP (Battelle 2001) for detection limit goals by analyte
METHOD: Surface water samples were prepared and analyzed for PAHs following methods described in Battelle's Quality Assurance Project Plan (Battelle, 2001) Briefly,
Sample Preparation - Water samples were extracted for PCB Aroclors, chlorinated pesticides and SVOCs (PAHs) following Battelle Duxbury SOP 5-200 Briefly, approximately 2-L of water sample (measured using a graduated cylinder) was transferred to a separatory funnel, extraction solvent added (120 mL methylene chloride), and the sample fortified with surrogate internal standard (SIS) compounds Samples were serially extracted three times using separatory funnel techniques The combined extract was dried over sodium sulfate and concentrated to 1 mL using Kuderna-Damsh and nitrogen evaporation techniques Alumina column cleanup was performed The final extract (-500 (oL) was fortified with recovery internal standards (RIS) and split for PCB Aroclor/chlormated pesticide and SVOC (PAHs) analyses by GC/ECD and GC/MS, respectively The extract for GC/ECD analysis was solvent exchanged into hexane prior to analysis
GC/MS Analysis - PAHs were analyzed by GC/MS (Hewlett Packard 5890 Series 2 GC) using a 60 m DBS column and helium as the carrier gas A minimum of a five-point calibration curve was used for PAH analysis, ranging from approximately 0 010 to 10 0 u,g/mL A separate minimum five-point calibration curve was used for Benzaldehyde analysis ranging, from approximately 0 010 to 10 0 ug/mL
Total PAH was determined by adding the concentrations of all target PAH compounds except Benzaldehyde
HOLDING Samples were prepared for analysis in one analytical batch Samples were extracted TIMES: within 7-d of collection and analyzed within 40 days of extraction
Page 1 of 3

PAH WATER QA/QC SUMMARY QC Batch 01-350
HOLDING TIMES (Cont.):
DETECTIONLIMITS:
BLANKS:
LABORATORY CONTROL SAMPLE
MATRIX SPIKES:
Batch Extraction Date Analysis Date 01-350 07/17 and 19/2001** 08/08 - 14/2001
** The rinsate blank (collected in the field) and a laboratory blank and LCS sample were extracted on 7/17/2001; The field samples, including laboratory QC, were extraction on 7/19/2001.
PAHs and Benzaldehyde results are reported relative to the sample-specific reporting limits (also referred to as QL in the QAPP) for that compound. The sample-specific RL
is based on the low calibration standard and adjusted for sample specific processing factors and volumes, as follow:
RL = (Concentration in Low Std. x final extract volume x dilution factors)/ Sample size
Where, Concentration in Low Std.= 0.010 |Ug/mL for PAHs and Benzaldehyde Final Extract Volume = 600 \iL Dilution Factor = 1.0 Sample Size = Volume water extracted, ranging from 1.3 to 2.6 L
Achieved RLs for all PAHs were well below the project detection limit goals.
Two laboratory procedural blanks (PB) were prepared with the analytical batch, one on July 17, 2001 and the other on July 19, 2001. The PB prepared on July 18, 2001 was prepared with the rinsate blank sample; the PB prepared on July 19, 2001 was prepared with the field samples. Blanks were analyzed to ensure that the sample extraction and analysis methods were free of contamination.
01-350 - Several PAHs were detected in each PB. Of those detected, only Naphthalene is detected at levels higher than the reporting limit of 3.00 ng/L.
Corrective Action - Naphthalene levels in the PBs are <3X the reporting limit. Field sample Naphthalene data are "B" qualified whenever sample concentrations are <10X the Naphthalene level in the associated PB.
Three laboratory control samples (LCS) were prepared with the analytical batch. One was for GC/ECD analysis only (ZC88LCS#2). One LCS sample (ZC62LCS#1) was fortified with PAHs. The final LCS (ZC90LCS#1) was fortified with PAHs and Benzaldehyde. The percent recoveries of PAHs and Benzaldehyde were calculated to measure data quality in terms of accuracy.
01-350 -PAHs and Benzaldehyde were recovered within the control limits specified in QAPP.
Recoveries ranged from:
PAHs Benzaldehvde ZC62LCS#1 68 -102% not spiked ZC90LCS#1 64 80% 81%
One matrix spike (MS)/matrix spike duplicate (MSD) sample set was prepared with the batch to measure data quality in terms of accuracy and precision. The MS and MSD however, were not fortified with representative compounds and as a result recovery and precision data are not available.
Page 2 of 3

PAH WATER QA/QC SUMMARY QC Batch 01-350
MATRIX SPIKES (Cont.):
SURROGATES:
REPLICATES:
SRM:
REFERENCES:
Corrective Action - Recovery data from the LCS samples were acceptable, demonstrating that the analytical method is in control A PE sample (W5426), received from EPA Region 1, was also prepared with the batch and analyzed for PAHs and Benzaldehyde These results will be evaluated by EPA Region 1 to assess data quality
Three PAH surrogate compounds were added to each sample prior to extraction, including Naphthalene-d8, Phenanthrene-dlO, and Chrysene-dl2 Recovery data were calculated to measure data quality in terms of accuracy (extraction efficiency)
01-350 - PAH surrogates were recovered within the control limits specified in the QAPP
A laboratory duplicate was prepared with the batch The RPDs between laboratory replicate analyses for PAHs and Benzaldehyde were calculated to measure data quality in terms of precision
01-350 - RPDs ranged from 0 1 to 50 5%, with three RPDs >30% Most concentrations were below sample specific RLs, and the three RPDs >30% (Dibenzofuran at 36 8%, Naphthalene at 43 8%, and Phenanthrene at 50 5%) were all for compounds that were detected at levels less than 3X the sample specific RLs
A sample duplicate was also collected in the field (sample WRL-DU-071701-A) As it is unclear which sample it is the duplicate of, field duplicate data cannot be provided at this time
There is no available SRM for PAHs and Benzaldehyde in water Battelle received a PE sample (0005723, Battelle ID W5426) from EPA Region 1 to prepare with the surface water samples EPA will evaluate results from this sample
Battelle 2001 Centredale Manor Restoration Project Superfund Site Baseline Risk Assessment, Initial Project Planning and Support Tasks 19-22 QAPP prepared under contract to USAGE NAE Delivery Order #59 May 23, 2001 509pp + apps
Page 3 of 3

Water and QC Results

oo
Q
88
8o
8o
88
88
88
88
88
88
88
8
88
88
88
88
88
88
88
88
88
8 D
8in
d|
D13
D
Z
) D
D
DCO
DD
DD
DD
DD
D
DCD
=
CO
ECOVERY ECOVERY ECOVERY
ECOVER'l ECOVER'l ECOVER'l ECOVER'l ECOVER'l ECOVER> ECOVER'l ECOVER'l ECOVER'l ECOVER'l ECOVEm ECOVER'l ECOVER'l ECOVERY
tr tr LU
UJ
0 0
O
O
LL LL
LL LL
LL aLL
LL 11
LL CL
LL LL
>?
>P>
>>
>>
?>
C
c
cC
c
3?
C
C
C"
c-r
a? ^0
S« z
a
a
aa
a
CB
O
> o
O
D. a
C
D a
aa
CT
o
O)
en O
) a
OJ a
Ol B,
&CD
C
T0>
nnsEiu gvi
CD o
oo
N
O
CO
in
C
O
OJ
in
CO
CO
en C
O
OJ
CO
O
N
. 0
O
0
O
Oo
o
O
a 8
88
88
88
88
a8
8
88
g
8 8
88
88
88
88
8
CO
88
o(0
3
01
CO
hi
zSi
01 8
8
O>
in en m
in in
in in
in in
in
in
in
in in
in
in
in m
tn in
in
min
in in
in
in
in m
in in
in in
in in
m
min
in
in
m
in m
in in
in
in in
in in
in
in
in in
in
in
in
in
in
in
m
in
in tn
in
in
mtn
in
m
in m
in
in
in m
in m
mm
Ul in
in
min
in
in
m
in in
m
mm
in
in in
mm
in
inin
in
in
in
in
en 8
0
8S
S8
QD
SD
O
DD
0O
00
OQ
Q
aa
Q
0D
QD
0Q
QD
Q3
QO
OS
aD
OQ
0 Q
P
2n
CO CO
mm
22
22
22
2£
CO CQ
CO CO
CO CO
CO CO
CO CD
mm
CO CO m
CO CD
CO mCO
CO CO
CD CD
SCO
CO CO
CO CD
CO CD
CO 2CO
CO CO
CD 2CO 2
m2
22
CD CO
CO
SSV1O ozCO
o
56-55-3
207-08-9
CO
CO CO
CO to to CO
CO CO
CO CO
CO CO
CO CO
CO CO
CO CO
CO to CO
COCO to
CO to
CO CO
CO CO
o O
oO
OO
oO
Oo
OO
OO
OO
oO
OO
OO
OO
OO
OO
oO
OO
OO
oo
oO
oO
OO
Oo
Oo
OO
OO
OO
Oo
OO
O
1i
i
100-52-7
132-64-9 206-44-0 86-73-7
CD
53-70-3
ani
Dlbenzoturan 1 32-64-9
o>
92-52-4
Benzo[b]fluoranthene 205-99-2
129-00-0
Fluorene 86-73-7 lndeno[1,2 3-c,d]pyrene 1 93-39-5
j?
NTI Iv
120-12-7 100-52-7
207-08-9
205-99-2
129-00-0
CM
Benzolklfluoranthene 207-08-9
Benzo[b]fluoranthene 205-99-2
CM
Chrysene 218-01-9
50-32-8
Fluoranthene 206-44-0
lndeno[1 ,2,3-c,d]pyr9ne 193-39-5
50-32-8
53703
92-52-4
CO
208-96-8
83-32-9
92-52-4
Acenaphthene 83-32-9
op
9-L 0-99
a co 6
CD
O
•V
in
CO
O
J
Si
o> C
O
S
M
zz
Zz
Zz Z
z
<7) in
CM
Benzo[a]anthracene 56-55-3
CM
O)
Benzo[a]anthracene 56-55-3 Benzo[a]pyrene 50-32-8
CN
O
J
1Dibenz[a,h]anthracene
1
o o
O
o
oo
o0
oO
Oo
oO
o
oo
oo
o
O
0 0
8
88
8
88
88
88
ag
88
88
88
88
88
S8
88
88
8
8
8
S
CO
C
O
CO
C
O
CO
C
O
CO
C
O
CO
C
O
CO
CO
C
O
c-} C
O
CO
C
O
CO
S
CO-£
s8
CO
C
O
CO
2-Methylnaphthalene
B9nzo[k]lluoranthene
175
Dibenz(a.h]anthracene
2- Methyl naphthalene
1CO
Benzolbjfluoranthene
•51
2-Methylnaphihalene
Acenaphthylene
1I
1 8
8
8§
Benzo[a]anthracene
CD
Naphthalene-dS
.3?
IBenzo[k]fluoranthene
Phenanthrene
PARAMETER
c
Anthracene
Chrys9H9-d12
a
CD
.a.
5°
d
Chn/sene
S
ffi
0) o
i
TJ
Acenaphthylene
ffi
1
Banzaldehyde
1l1
CD
1
Naphthalene 1
CO .c
Naphthalene-d8 Total PAHs
Dibenz[a,h]anthracene 53-70 3
CL
Phenanthrene-d10
1
nj 0
CO
oCO
LL Z
CC C
O
cc D
.
§ffi a
_c
IcEL
D.
O
ffi CM
Benzaldehyde
CD
s7
Anthracene
i
1
ai "o
r: Q
. I1CD
CD
ob
CO 0
oo
u0i JJ
o O
0o
oO
bO
OO
Oo
oO
oO
OO
OO
Oo
OO
oO
00
oo
00
o0
00
00
00
C
D 0
00
00
0o
00
oo
O O
0 0
11
08/08/0
i 1| s |1s iS
1
I
1S1
Ii1 SiS siS s i1i1 i
1i1ii1
o
0/80/80
1I
1ii1 i1
1 11
i i
1 111
o
1§
11
O
£ u
Pe
pp
e
sp
ppp
pP
pp
pp
pp
?s
p9
eS
59
S> ppp
ppp
9pp
99
9 pp
9pe
9P
pP
9P
p9
9p
sPp
s9
9
rK
o
RR
gg
g
gg
0g
gg
0g
£g
0
0
0
o
oo
0
oo
o O
oo
og §
£g
f-. o o
IL
o
oo
o
o
0
o0
0o
o0
o
o
oo
oo
go
o
oS
oo
JJ
Q.
2CO zz
zz
zz
zz
zz
zz
zz
zz
zz
zZ
z
z
z
Zz
Zz
zz
ZZ
ZZ
Zz
zz
zz
zz
zZ
zz
ZZ
zZ
zZ
ZZ
Z
UJ
X z
zz
zz
zz
zz
zz
zz
zz
zz
zz Z
Z
zz
P BLANK
I
51
mm
ffimm
mS
mm
mm
cc cc
CG cc cc CC
cc CO
CQ CD
cc CO
iCC CO
CO CO
CO
n n
nn
y:
3 BLANK BLANK 3
P BLANK
BLANK
1
CO CO
CD CO
S
Rn
5 15
m CD
P
m
P BLANK
P.BLANK P BLANK
P.BLANK
I!
CO
P_BLANK
CO to CO
COCO
(1 (1 <i (1
en CO COt) o
0
ss
ss C/5
CO co to
IBORATORY 1
_aa
ZC87PB
ZC87PB
Q
oo
oQ
oQ
o
o
O
oO
o
O
oQ
QD
Q
DQ
oQ
oD
OD
oQ
Qo
Qo
Q
o
Q O
P
Ht-e 1—
P
t~ ^~ Pg
pp
p i—
p
1
cc ffi m
mm
CO m
ffimm
mm
CO CO mI
2iffi2
21
2mi
1li2iHi
2 < CO
CO mCO
CO CO
CO mCO
CO mffi
CO
CO ffi2
2 CO 2I1, 2 CO m
ffi
II
ZC62LCS* ZC62LCS* ZC62LCS*
ZC62LCS*
aS
35 a
ZC62LCS*
ZC62LCS*
ffffi m
mm
CD m
mm
mm
m
ZC62LCS*
CO mm
CO CO
CO ffi CO
CO CO
CO mQ.
§§
U
u
U
u
CO C£
(D (0
t£
(D
(D
<og
§ O
8 S8
S
S sH
tsl S9§
2C87PB
ZC87PB
ZC87PB
ZC87PB ZC87PB
ZC87PB ZC87PB ZC87PB
CO CO
ZC87PB
CO
1N
N
ZC87PB ZC87PB ZC87PB
CO m
mft o
1o
0
ZC62LCS#
S
ua. <
</) z
Zz
zz
Zz
zz
zz
zz
Zz
zZ
ZZ
Zz
zz
zsZI
zZ
z
Z
z
2 z
Zz
ZZ
2z
zz
5
c

88
88
8
88
88
88
8
88
88
88
88
88
8
88
8
88
88
ss
88
8
88
88
88
1
88
8
88
8
8
ffl
££
££
££
£(D
C
D O
Q ID
££
££
£

--
00
CM
C
M
CM
cj CM
CM
CM
"J
C
M
CMC
J
CN
l 1
3
CM
CM
CTl
CM
"•J
O
J
CM
o
C
D
CD
C
D
CD
CD
C
D
CD
CD
CD S
C
D
CD
CD
ID
C
D
CD
C
D
CD
| C
D
CD
!£
)
z ,
& 1 _
o
CD
cc a: DC or orD
C cc
ccDC cc
cc DC cc cc
or cc or
or cc cc cc
DC
cc cc tr DC oc
uU
J LU
u
jj LU
LU
EJJ LU
UJ £
ffiLU 5
UJ U
J U
J U
J LU
5UJ
LJJ LU
SUJ LU
U
J U
J LU
LU
UJ LU
z
%RECO\ %RECO\ %RECO\ %RECO\ %RECO\ %RECO\ %RECO\ %RECO\ %RECO\ %RECO\ %RECO\ %RECO\ %RECO\ %RECO\ \O03U%
%RECO\ ooJJ
%RECO\ %RECO\
ECOVERY ECOVERY ECOVERY 1
OOJJ
#
%RECO\ %RECO\ %RECO\ \OO3U%
%RECO\ %RECO\ %RECO\ %RECO\ %RECO\ %RECO\ %RECO\ %RECO\
0OIN
CL LL
CJ)
01 U
)u>
0>
O
>
O)
U)
O)
O)
Ul
CW
0.
£
CC
CC
c?
c? c
c? c
C
clc
C
c
c
ss c
c
BATD5
BATD5
^
DD
D
x>
D
£> en C
M
OO
C
T)
CD
C
O
CD
C
O
CT
) C
D r-
CO
-J S
5
Ss S
8
3S
SC
O
Sg
S
OO
C
T)
8
CO
CO
C
D
CD
C
T)
CO
C
D
Tj
o-
o0
2
CM
C
M
en
CO in
O
'ta-
"M
O
—
O
uDC
-
iin
in in
in in
in in
in in
in in
in in
in in
in in
in in
min
in m
in in
in in
min
min
min
in
in
in
in
in
in
in
in in
in
m
in in
LO
in
in m
min
in in
min
en in
lf> in
m
i
BATD5
BATD5
£i
BATD5
BATD5
BATD5
8S
8
BATD5
in
BATD5BATD5BATD5BATD5
inui
DQ
Q Q
Q
OO
Q Q
Q
DQ
O
Q Q
Q
Q
O
QO
QO
Q Q
O Q
Q Q
Q
ul
min
in
U
J
in
m in
LO
S
S8
S
88
n
S U
)
U)
&
Q
D
2 '&
§ <
<2
<
<
<<
2
m2
CD
CD CD
CD CD
CO CD
CD CD
CD CD
CD CD
CD 2CO
s CD m
m m
to
CD CD m
CD CO
CD CD
CD CO
03 CD
CD 207-08-9
to to
to co
co to co cn
CO
to CO
to
CO CO
CO CO
C/)
CO CO
CO CO
CO
CO
CO
CO CO
CO CO
CO CO
CO CO
CO CO
to
CO (O
CO CO
CO CO
CO o
O O
oO
oO
Oo
oO
o O
o O
o O
Oo
O O
OO
O O
O O
Oo
OO
O O
o O
O O
O0 O
Oo
O O
O O
O O
Oo
O O
O O
O O
Oo
oo
O O
1
i
i
56-55-3
83-32-9
86-73-7
i1
CO
129-00-0
Fluoranlhene 206-44-0
193-39-5
208-96-8
92-62-4
120-12-7
205-99-2
206-44-0
ro(a]pyrene 50-32-8 205-99-2
83-32-9
193-39-5
J?
86-73-7 C
T>
CO
i
56-55-3 50-32-8
1
op
85-01-8
CD
92-52-4
CD
Acenaphthene 83-32-9
207-08-9
CM
C
T)
Dibenzofuran 132-64-9
Acenaphthylene 208-96-8
O
53-70-3
92-52-4
en op
CO
C
M
CM
C
M
0
o
•3. 9in
t\j oi
CDO
CM O
O
in
C\J
z
ZZ
z
CO
o>
OO
z
z
indenoM .2,3-c dlpyrene 193-39-5
2C
T)
CM
C
T)
CM
C
O
CT
) 05
Total PAHs
Acenaphthene
Anthracene
Benzo[b]fluoranthene
Dibenz(a,h]anthracene
Naphthalene
Total PAHs
i
II
iI
1
oo
oo
oO
oo
o
oo
00
o
8
s §
sg
S S
in
m
in in
in m
S
in s
in S
S s
s m
S S
SS
88
% S %
§§
cfl §
Sg
g«
g§
ss1
§s
§ §§1
CO
g§
§§
§ §
CO
C
O m
C
O
CO
ro
nro
(D
ro n
en C
O
CO
C
O
CO
C
O
CO
C
O
CO
C
O
8C/)
00
0o
00
00
00
00
00
00
00
00
00
00
00
00
00
00
0o
0o
o0
00
0o
o 0
O
o0
0o
o0
0o
o o
o O
oo o
o
o[k](luoranthene
Dibenz(a.h]anthracene
Naphthalene-d8
lndeno[1 ,2,3-c,d]pyr9n9 Naphthalene
,
Benzofg, h.Opery lene
o
Benzo[a)anthrac9n9
'olblfluoranthene
V
2-Methylnaphthalene
0)
o
1
C
-0[g,h,i]perylene
a»
1
cPhenanthrene-d10
Phenanthrene-d10
^D
0)
Naphthalene-d8
X)
a
(O
1
1)
j
Benz aldehyde
PARAMETER
-C
C
CD
1M
V
Chrysene-d12
Acenaphthene
Phenanthrene
1
Sg0)
c\i ct>
.c
Q.
(0
o
c
a
_c c
CO
I1
Fluorene
.E
(0 C
D
a.
2
0>
ro
|
fe 1
3. s s S
CJJ
CO o
t5
"o"
Fluorene
CO
ra o
s
Chrysene-d12
D_
1 11CM
0)
1I
10)
11
e-
Naphthalene
0>
E
£1 o
o.
O
Q.
£Z
CD
CM
CD
JJ
gJJ
1
08/08/0
1 u
§§ Q
o
Oo
oo
o
P
9
9s
99
99
ss
?
g
99
e9
9 9
or
iIii
1iii
§1ii11iiiii1iisi
S cB
O
) en
CT) ii
CT
) § cB
Si
CT
)iii
CT
) CT
l CT
lCT
JCT>
en O
l C
D
X
ft N.
sUJ
go
og
g&
Oo
og
go g
O&
&g
SS
O&
O£
sO
&gg
& S
o go
o15 o
BO
o5
£o
O&
oS
O
15 g15
g E5 S
Bg
og
g
O
UJ
r—
G
O
oO
O
CL
§§i
§i
§§
§§i
§§
§§
§§
§ i§
§§
S§
§ 2s
r--f-
h-r-
r-. I
z z
zz
zz z
Z
zZ
zz Z
zz z
zz
zZ
zZ
z z
Z z
z z
z z
zz
oo
OO
OO
oo
oo
oO
Oo
15 oO
o&
0S
oo
oo
oo
o
° 1s S 11is i
99
99
99
99
99
99
99
99
99
99
99
9
e
e
eS
9
s
9
e
e,9
e9 f\i C
M
0 e
iii
8 8 8i
8i
8 Si
S 8" i
8
8 S8i
88 ^§ s
S §
§ §
§§
g s §g
8s
8 ^ 8
§
^^
^
^
^^
^^
88
88 8
8s
88
88
8
i» C
O
CO C
O
CO to to
CO
CO CO
CO to
to to
CO to to
cc
cc
cc
c c
Cc
c c
C 3
33
33
3 3
33
33
3 3
33
DUPUCATE DUPLICATE DUPUCATE DUPLICATE r
£ gg o_
Q_
UJ
OO_ 3
D
Q
NORMAL NORMAL
DUPLICATE DUPUCATE
UJ
UJ
UJ
LU
UJ
UJ
DUPUCATE DUPLICATE
DUPLICATE
£g g
g
go
5 gg I g
Oo
1—
Q_D
DD
D
CO
Q.
Q_ a.
Q_ a_ [L
Q
_ Q_
CL Q
.
_J _l
5 5
or or O
O
z z
Q
.
QO
QO
QO
LABORATORY
(C
W5405DUF
W5405DUF
W5405DUF
D
D
Qo
oa
oo
ao
Q
Qa
Q0
DQ
0
OO
OO
Q
PP
i?
i-e
PP
P
<
a ai
a a aiis i1
aiimii1i1i <i isiii2 2 ii1
m CO m
CD m CD
m CD
CD m CO
CO CD
CO CO
CO 5, m00 m
m CO
CO CO
CO CO
CO co
m
i !i
SW-4003-0 W5405DUF
ZC90LCS*
ZC90LCS*
ZC62LCS*
W5405DUF
ZC62LCS*
ZC62LCS*
33
SW-4003-0 W5405DUF
2C62LCS*
ZC62LCS* ZC90LCS*
a §
ZC90LCS*
ZC90LCS*
a
ZC90LCS*
W5405DUF W5405DUF
ZC90LCS*
a I
ZC90LCS#
2C90LCS#
ZC90LCSK
s §
SW-4003-0 W5405DUF W54Q5DUF
SW-4003-0 W5405DUF
SW-4003-0 W5405DUF W5405DUF W5405DUF W5405DUF W5405DUF
S
ZC90LCS*
s
SW-4003-0 W5405DUF
35 35
0 o
o
0u
•D
D
D
o
5
W5405
N
SW-4003-0 W5405DUF
0
u
OO
uO
O
OO
OO
O
O
OO
Oo
oO
oO
Oo
66
i
or or or CC
or S
cc or
cc DC or ciCC
cior
or cc cc or
or cc cc cc
to z z
Z Z
z z
z z
z z
zZ
^z
ZZ
Z
zZ
ZZ
zz
zZ
1
Z z
zii
SW-4003-0 SW-4003-0
CO
SW-4003-0
SW-4003-0 SW-4003-0 SW-4003-0 SW-4003-0 SW-4003-0 SW-4003-0 SW-4003-0 SW-4003-0
SW-4003-0
0o
o
CD
oo
o o
co
ro
s t?C
O %
C
O
to to to
0
2 5
ii
88

i 3
33
F?
CO
CO
CT
88
88
8
88
818
8
18
8 ! 8 8 8 53
88
88
CJ
E
:i Si
«r

11
•& o>
a . o
go
, b
o "o> i
OD
C
T
_. A
a o
II
^i^i15\~S\'o "3
H|
N
N
N
fi I
-O
CD
gg
g
e e
e e
fefe
<, 3
DQ CD CD II
88
88
A
m

a Q
88
8
88
8
88
8
3
83
33
88
8
88

1818 i
CD
to
o
g g
n
,c 0
,0,
g
O,
j 0
.0.
J$$ii$
si o
in <n
1222
T '
ai
la;
DC U
t
u '•I J' i €
!
: e e!
Sfe
gg
> co < I
CM
(
ill
o o
O
O
s
s §
g
0)
ID
00
CD
i 6 6
<: a: o:(
Ia; <r
i S a> i

88
88
u.
z
i \ 8 8 S S
88
Si Si 8888888
888
88 88
8888
lz
RKg P!R
fS KR p!R
fS KK
ss;
§§! 88
§8
SS8SSSS8
ss

fit
*
111
SJS
A
uS
22 2
2 2
2 s
ils
o o
o 0
00
Sfe
§
II
II
Sfe
feS
£ S
~
PP
PP
P 2
22
CO
00
CO
99
99
9
99
99
9
8

I
8 a
Sffi
58
88
8
88
18
8 5
5
88
88
'99
9 9
99
99
99
99
9
99
99
99
9
99
9

Bo
a a
a a •=1 <i
a a
a'a
'S'S
, c
c c
c
C
in uS ) ir> in
I O O
I
tI
£
. •5."
II
Si
I
5 =
gg
! SS
|
fefe
3 3
CC (T
s
iii b
t
*
w cp «
cp

88883
SSSfeftfeS
SS8S
SS
33333
33

IO
if)
Illlllllll
Ill II
ui ub
o o
S
S
22
11! C
D
CD
C
D
o o
o
oo
o
oo o
o
fts
•5
S"
00
O E
ill
feS
ils
ss
fefe ii
96
9
99
9
9
99
9
99
9
9 9
g
g
fefe III
111 II
HI
- . <
-
o o
o o
o
o o
o
~gs
iiii (D
CD CD CC ffi
ffi CD
(D
22
99

1
o
>
g
833
88
S881
888
aa 888 888888
I <vi
*'
fff<
gg
9


Section 3 Metal (including Hardness) Results
QA/QC Narrative Water and QC Results

QA/QC Narrative

QA/QC SUMMARY
PROGRAM: Centredale, Batch 1
PARAMETER: Metals
LABORATORY: Battelle/Marine Sciences Laboratory, Sequim, Washington
MATRIX: Unfiltered and filtered freshwater
QA/QC DATA QUALITY OBJECTIVES
Reference Range of SRM Relative Quantitation Method Recovery Accuracy Precision Limit
Beryllium ICP/MS 70-130% ±25% ±30% 0.212 Aluminum ICP/MS 70-130% ±25% ±30% 40.0 Vanadium ICP/AES 70-130% ±25% ±30% 8.0 Chromium ICP/AES 70-130% ±25% ±30% 12.0 Manganese ICP/AES 70-130% ±25% ±30% 0.8 Iron ICP/AES 70-130% ±25% ±30% 14.0 Cobalt ICP/MS 70-130% ±25% ±30% 0.016 Nickel ICP/MS 70-130% ±25% ±30% 14.3 Copper ICP/MS 70-130% ±25% ±30% 3.24 Zinc ICP/MS 70-130% ±25% ±30% 4.80 Arsenic ICP/MS 70-130% ±25% ±30% 0.16 Selenium FIAS 70-130% ±25% ±30% 0.4 Molybdenum ICP/MS 70-130% ±25% ±30% 14.4 Silver ICP/MS 70-130% ±25% ±30% 2.68 Cadmium ICP/MS 70-130% ±25% ±30% 0.06 Antimony ICP/MS 70-130% ±25% ±30% 0.04 Barium ICP/MS 70-1 30% ±25% ±30% 0.288 Thallium ICP/MS 70-1 30% ±25% ±30% 0.016 Lead ICP/MS 70-130% ±25% ±30% 0.020 Mercury CVAF 70-130% ±25% ±30% 0.0008
METHOD Twenty (20) samples were analyzed: fourteen (14) metals, beryllium (Be), aluminum (Al), cobalt (Co), nickel (Ni), copper, (Cu), zinc (Zn), arsenic (As), molybdenum (Mo), silver (Ag), cadmium (Cd), antimony (Sb), barium (Ba), thallium (Tl) and lead (Pb) by inductively coupled plasma mass spectroscopy (ICP/MS) following EPA Method 1638-M; four (4) metals, vanadium (V), chromium (Cr), manganese (Mn), and iron (Fe), by ICP/AES following SW6010B-M/L-44, one (1) metal, selenium (Se) by flow- injection atomic spectroscopy (FIAS) following a modification of SW846 Methods 7062 and 7742, and mercury (Hg) by cold vapor atomic fluorescence (CVAF) following EPA Method 1631c.
Selenium was analyzed by FIAS instead of ICP/MS or ICP/AES as it is more sensitive for this metal and allowed us to achieve the detection limit required.

QA/QC SUMMARY/METALS - Centredale (continued) To prepare water samples for analysis, half of each was filtered and both the total and dissolved fractions were acidified upon arrival at Battelle. Samples analyzed by FIAS were pre-treated prior to analysis using hydrochloric acid for Se. Pre-treatment is necessary to obtain the oxidation state of each metal that will provide the greatest sensitivity by this method. Samples analyzed for Hg by CVAF were pre-treated with bromine chloride and stannous chloride to oxidize and convert all Hg compounds to volatile Hg which is subsequently trapped onto a gold-coated sand trap.
HOLDING TIMES Eight (8) samples were received on 7/17/2001 and were logged into Battelle's sample tracking system. Sixteen (16) samples were received on 7/18/01 and logged into Battelle's sample tracking system. Samples labeled RAB-SW-5004-01, -MS and -MSD were combined into one clean 1000 ml Teflon Bottle. Samples labeled RAB-SW-5004-01, -MS, -MSD with the MSD were combined into one clean 1000 ml Teflon Bottle. Samples were immediately filtered and acidified. All samples were digested and analyzed within the six month holding time for metals and the 28-day holding time for Hg. The following list summarizes all analysis dates:
Task Date Performed Hg 8/2-3/2001 ICP-MS Fe/Pd 8/15/2001 ICP-MS direct 8/15/2001 FIAS-Se 8/15/2001 ICP/AES 8/13/01
DETECTION LIMITS The quantitation limit was met for all metals. The MDL was determined by multiplying the standard deviation of the results for a minimum of 7 replicate low level spikes by the Student's t value at the 99th percentile and the quantitation limit was calculate as 4 x MDL.
METHOD BLANKS A minimum of one method blank for each fraction was analyzed with this batch of samples. Results were less than the MDL for all metals, except TRM Co, dissolved and TRM Sb, and dissolved Pb where the blank was at least half that found in the samples.
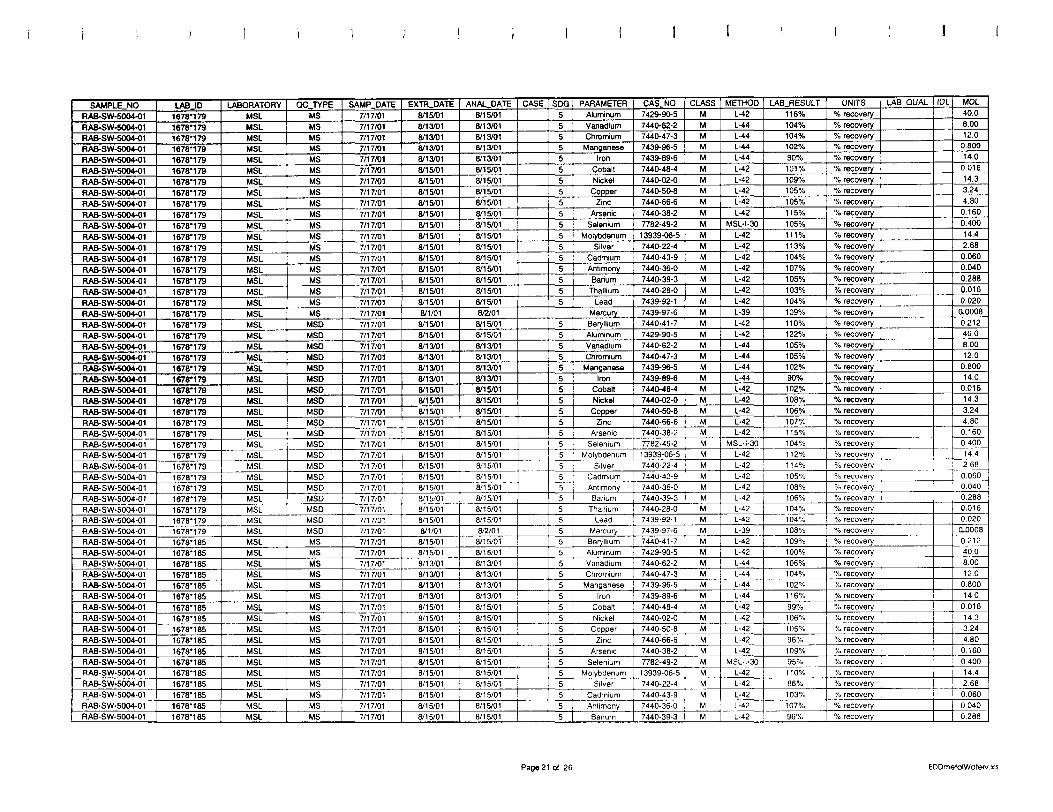
MATRIX SPIKES Two samples were spiked in duplicate with all metals. Recoveries were within the QC limits of 70-130% for all metals, except one for Fe where the spiking level was inappropriate to the native sample concentration. This value was flagged. Replicate precision for the MS/MSD was within the criteria of ±30% for all metals.
REPLICATES Two samples were analyzed in duplicate. Precision for duplicate analysis is reported by calculating the relative percent difference (RPD) between the replicate results. RPD values were within the QC limits of ±30% for all metals, except Sb. All other QC for Sb were within the criteria, and the replicate results were near the detection limit. Therefore, no corrective
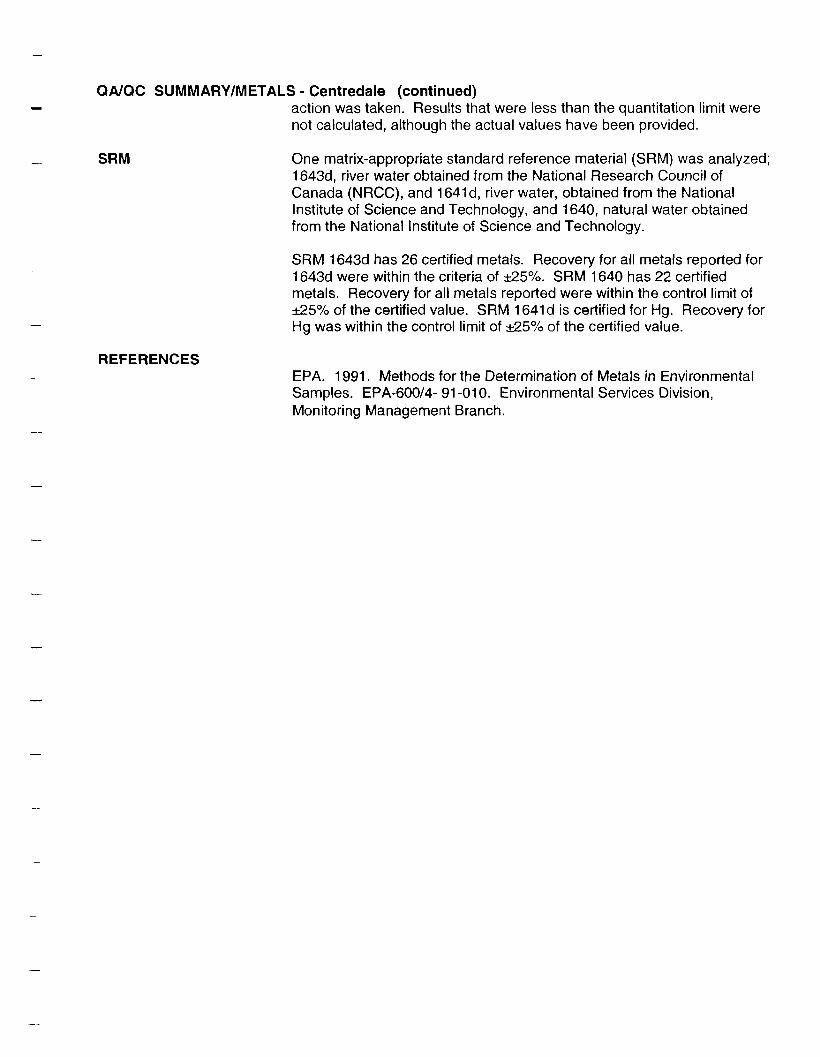
QA/QC SUMMARY/METALS- Centredale (continued) action was taken. Results that were less than the quantitation limit were not calculated, although the actual values have been provided.
SRM One matrix-appropriate standard reference material (SRM) was analyzed; 1643d, river water obtained from the National Research Council of Canada (NRCC), and 1641d, river water, obtained from the National Institute of Science and Technology, and 1640, natural water obtained from the National Institute of Science and Technology.
SRM 1643d has 26 certified metals. Recovery for all metals reported for 1643d were within the criteria of ±25%. SRM 1640 has 22 certified metals. Recovery for all metals reported were within the control limit of ±25% of the certified value. SRM 1641 d is certified for Hg. Recovery for Hg was within the control limit of ±25% of the certified value.
REFERENCES EPA. 1991. Methods for the Determination of Metals in Environmental Samples. EPA-600/4- 91-010. Environmental Services Division, Monitoring Management Branch.

Water and QC Results

a cb o>
tit
o
E
iiii tp
i t (0
i i?
i6
( 6
: cr QC
: 5
I

ss 3
33

g stft
"S
o,
It
2 0.'
%<
fc
1 uIli
5


<
o Ittlllf
l 111
A i
&Ai
%
I
,1
n£
s >
S« B < fC
t 8 s;|
ii 6
ii
I CO
ii ;2

SS
SS
SS

l33^ttfttttl?3SS
33
3 S
lim
it
•£\e
ga
44

s< o
'

o> ck It
0)0
, It!!!! tt

5i.

g a S
till!
111
1
i
OQ
C
D
CD
C
D

I
z

= ^
= S
I •!<
SE
imi
:??
A:I*
ft
>,32
\%\
cc o
i o
: z
CO I
s :
: 5 '•
> Di <n <
i o
gg
I! cc

i C
O i
ii

TO
TO
OT
TO
1
18
!
iT

tO i

si

S
•5
S3
lill

E- fr
i
^ = =1 =
"cb ~a> t
||1
2S
S3
1 J
S!
S:
!§*6
J. a\
3
I fr
E
11
o
o
g
m
Q.
8g S
o
f si
i: z
i
CO
u. tr
e-l

Si i
a>
i
8 a: o
O
0.
5 I
g o
e-e-
t-e-e-t
£0
o
5? S
8
-,i
|o
I:
o3
62
i
«
CO I
CO
03 £Q
3
!3 3
S §

to
I

I
88
g o
£• £•
ill
u <n
5
9
1
3
g
o
-E
i 3
' <
2in
i
IS: <
IB
IB
£ S

18:
i o
' ;l
;l

o.
cj
ob
a B
s
sla

8 •5

Section 4 SVOCs (phenols and phthalates),
VOCs and BOD Results
QA/QC Narrative Water and QC Results

QA/QC Narrative

STL Baltimore ANALYTICAL NARRATIVE
Client: Bnttelle Duxbury Operations STL Baltimore Report: 200954 Site: Centrcdale Laboratory Project Manager: Tarn E. Martz Project number: Contrcdale Report Date: 4 October 2001
This report contains the results of the analysis of four water samples collected on 16 July 2001 in support of the referenced project.
SAMPLE RECEIPT
The samples and trip blank arrived with custody seals intact by Federal Express at STL Baltimore on 17 July 2001. Upon receipt, the samples and trip blank were inspected and compared with the chainof-custody records. The samples and trip blank were then logged into the laboratory computer system with assigned laboratory accession numbers and released for analysis.
Client Sample Designation ST Lab Number WRC-SW-4003-01 200954-1 WRC-SW-4004-1 200954-2 WRC-SW-4001-Ol 200954-3 WRC-SW-4002-Ol 200954-4
TRIP BLANK 200954-5
Following this narrative section are glossaries of data qualifiers (Table 1 ), codes associated with manual integration of chromatographic peaks (Table 2), and the original chain-of-custody records. Analytical results and quality control information are summarized in the appended data package which has been formatted to be consistent with the deliverable requirements of this project.
ANALYTICAL METHODS
The analytical methods used by the laboratory are referenced by the STL Baltimore Method SOP which is formatted as STL-M-XXXXX- Y, where XXXXX is the reference method and Y is the SOP revision number. For example, analyses performed using EPA S W846 Method 8260B are identified as STL-M-8260B-3 where 3 is the laboratory SOP revision number. General Chemistry methods which are a consolidation of several reference methods, e.g. STL-M-CN for cyanide determinations, also include the identification of the specific reference method used for the analyses.
QUALITY CONTROL
The following sections are ordered as the data appears in this report. They contain observations made during sample analysis, summarize the results of quality control measurements, and address the impact on data usability based upon project Data Quality Objectives. For each fractional analysis the narrative includes:
O/oool

STL Baltimore ANALYTICAL NARRATIVE
Client: Battelle Duxbnry Opernttoiii STL Baltimore Report: 200954 Site: Centerdftle Laboratory Project Manager: Tarn E. Martz Project number G487002-22B1 Report Date: 4 October 2001
• Sample chronology: This section summarizes the sample history by fraction including the sample preparation method and date, analytical method, and analysis date. Anything unusual about the samples, digestatcs, or extracts is identified. Holding time compliance is evaluated in this section.
• Laboratory method performance: All quality control criteria for method performance must be met for all target aualytes for data to be reported. These criteria generally apply to instrument tune, calibration, method blanks, and Laboratory Control Samples (LCS). In some instances where method criteria fail, useable data can be obtained and arc reported with client approval. The narrative will then include a thorough discussion of the impact on data quality.
• Sample performance: Quality control field samples are analyzed to determine any measurement bias due to the sample matrix based on evaluation of matrix spikes (MS), matrix spike duplicates (MSD), and laboratory duplicates (D). If acceptance criteria are not met, matrix interferences are confirmed either by reanatysis or by inspection of the LCS results to verify mat laboratory method performance is in control. Data are reported with appropriate qualifiers or discussion.
VOLATILES by GC/MS - WATER (STL200954-01 to STL200954-05)
Sample Chronology: Five samples and associated quality control were analyzed on 24 and 25 July 2001 for the client specified list of analytes following the procedures specified in STL-M-5030B1/STL-M-8260B-4. All holding times were met.
The batch MS/MSD's, analyzed on 24 and 25 July 2001, were performed on other client's sample. The results for these QC analyses have not been included in this report.
Laboratory Method Performance: All laboratory method performance criteria were met for the reported samples with the following exceptions:
The batch LCS, V01GLCSE12, had the recoveries of tetrachloroetheoe (58%) and 1,2,3trichioropropane (65%) below the lower project QC limits of 67% and 83%.
The batch LCS, V01OLCSB13, had the recoveries of brombdichloromethanc (92%), tetrachloroethene (54%), 1,2,3-trichloropropane (59%) and 1,2-dichlorobenzene (91%) below the lower project QC limits of 94%, <57%, 83% aad 92% respectively.
DjOOQZ

STL Baltimore ANALYTICAL NARRATIVE
Client: Battetle Duxbury Operations STL Baltimore Report: 2009S4 Site; Centerdale Laboratory Project Manager: Tnrn E. Mnrtz Project number: G487002-22B1 Report Date: 4 October 2001
Sample Performance: All quality control criteria were met for the reported samples,
SEMIVOLATILES by GC/MS - WATER (STL200954: 1-4)
Sample Chronology: Four samples and associated quality control were extracted on 18 July 2001 following the procedures specified in STL-M-3540C-2. The resultant extracts were analyzed on 30 July 2001 for the project specific list of analytes following the procedures in STL-M-8270C2. All holding times were met.
The batch MS/MSD was performed on another client's sample. Results for those QC samples are not included in this report since they do apply to the samples in this report.
Laboratory Method Performance: All laboratory method performance criteria were met for the reported samples with the following exception:
The method blank had the recovery for the surrogate terphenyl-d!4 just above the upper QC limit of 101% at 103%. The recoveries for the other 5 surrogates were with QC limits. Data usability should not be impacted.
Sample Performance: All quality control criteria were met for the reported samples with the following exceptions:
Sample WRC-SW-4002-01 had the recovery for the surrogate 2-fluorobiphenyl just below the lower QC limit of 68% at 65%. The recoveries for the other 5 surrogates were with QC limits. Data usability should not be impacted.
CER TIFICA TION OF RESUL TS
] STL Baltimore certifies that the reported results relate only to those samples tested. All pages of this report we integral parts of the analytical data. Therefore, this report should be reproduced only in its entirety.
2. STL Baltimore has been accredited to be in compliance with these standards and the reported test results meet all the requirements of the National Environmental Laboratory Accreditation Conference (NELAC) standards, NELAP Primary Accrediting Authority laboratory IDs, #10692 (NYDOH) and #E87032 (FLDOH)
3. Release of the data contained in this report has been authorized by the Laboratory Project

STL Baltimore ANALYTICAL NARRATIVE
Client: Battelle Duxbury Operation* STL Baltimore Report: 200954 Site: Centerdale Laboratory Project Manager: Tarn E. Martz Project number: G487002-22B1 Report Date: 4 October 2001
Manager as verified by the following signature.
4 October 2001 Tara E. Martz.^aboratory/^roject Manager

STL Baltimore ANALYTICAL NARRATIVE
Client: Battelle Duxbury Operations STL Baltimore Report: 200959 Site: Ceatredale Laboratory Project Manager: Tara E. Martz Project number: Centredale Report Date: 12 September 2001
This report contains the remits of the analysis of one soil and six water samples collected on 16 and 17 July 2001 in support of the referenced project.
SAMPLE RECEIPT
The samples arrived with custody seals absent by Federal Express at STL Baltimore on 18 July 2001. Upon receipt, the samples were inspected and compared with the chain-of-custody records. The samples were then logged into the laboratory computer system with assigned laboratory accession numbers and released for analysts.
Client Sample Designation ST T-flfr Number RWR-SW-5001-01 200959-1 RWR-SW-5002-01 200959-2 RAB-SW-5004-01 200959-3 WRL-SW-4004-01 200959-4
WRL-DU-070701-A(DUP) 200959-5 WRL-SW-4005-01 200959-6
LPX-SD-071601-A(DUP) 200959-7 TRIP BLANK 200959-8
Following this narrative section are glossaries of data qualifiers (Table 1), codes associated with manual integration of chromatographic peaks (Table 2), and the original chain-of-custody records. Analytical results and quality control information are summarized in the appended data package which has been formatted to be consistent with the deliverable requirements of this project.
ANALYTICAL AfETHODS
The analytical methods used by the laboratory are referenced by the STL Baltimore Method SOP which is formatted as STL-M-XXXXX-Y, where XXXXX is the reference method and Y is the SOP revision number. For example, analyses performed using EPA SW846 Method 8260B are identified as STL-M-8260B-3 where 3 is the laboratory SOP revision number. General Chemistry methods which are a consolidation of several reference methods, e.g. STL-M-CN for cyanide determinations, also include the identification of the specific reference method used for the analyses,
QUALITY CONTROL
The following sections are ordered as the data appears in this report. They contain observations made during sample analysis, summarize the results of quality control measurements, and address the
010001

STL Baltimore ANALYTICAL NARRATIVE
Client: BatteUe Duxburr Operations STL Baltimore Report: 200959 Site: Centerdale Laboratory Project Manager: Tara E. Marte Project number: G487002-22B1 Report Date: 12 September 2001
impact on data usability based upon project Data Quality Objectives. For each fractional analysis the narrative include*:
« Sample chronology: This section summarizes the sample history by fraction including the sample preparation method and date, analytical method, and anah/gis date. Anything unusual about the samples, digestates, or extracts is identified. Holding time compliance is evaluated in this section.
• Laboratory method performance: All quality control criteria for method performance must be met for all target anah/tes for data to be reported. These criteria generally apply to inauuroent tune, calibration, method blanks, and Uiboratofy Omtrol Samples (LCS). In some instances where method catena fail, useable data can be obtained and are reported with client approval. The narrative will then include a thorough discussion of the impact on data quality.
• Sample performance: Quality control field samples are analyzed to determine any measurement bias due to the sample matrix based on evaluation of matrix spikes (MS), matrix spike duplicates (MSD), and laboratory duplicates (D). If acceptance criteria are not met, matrix interferences are confirmed either by reanatysis or by inspection of the LCS results to verity that laboratory method performance is in control. Data are reported with appropriate qualifiers or discussion
VOLATILES by GC/MS - WATER (STL200959-01 to STL200954-06 and STL200959-OB)
Sample Chronology: Seven samples and associated quality control were analyzed on 27 July 2001 for the client specified list of analytes following the procedures specified in STL-M-5030B-1/STL-M8260B-4, All holding times were met.
Laboratory Method Performance: All laboratory method performance criteria were met for the reported samples with the following exceptions:
The batch LCS, V01GLCSE15, had numerous recoveries outside of the project specified QC limits
Sample Performance: All quality control criteria were met for the reported samples whh the following exceptions:
The batch MS/MSD, performed on sample RAB-SW-5004-01, had numerous recoveries outside of the project specified QC limits.
010002

STL Baltimore ANALYTICAL NARRATIVE
Client: Battelle Duxbury Operations STL Baltimore Report: 200959 Site: Ccoterdale Laboratory Project Manager: Tara E. Martz Project number. G4*7001-22B1 Report Pate: 12 September 2001 ^
SEMTVOLATILES by GC/MS - SEDIMENT (STL200959: 7)
Sample Chronology: One sample and associated quality control were extracted on 26 Jury 2001 following the procedures specified in STL-M-3540C-2. The resultant extracts were analyzed on 09 August 2001 for the project specific list of analytes following the procedures in STL-M8270C-2. All holding times were met.
Laboratory Method Performance: All laboratory method performance criteria were met for the reported sample.
Sample Performance: All quality control criteria were met for the reported sample.
SEMTVOLATELES by GC/MS - WATER (STL200959: 1-6)
Sample Chronology: Six samples and associated quality control were extracted on 20 July 2001 following the procedures specified in STL-M-3520C-0. The resultant extracts were analyzed on 26-27 and 30 July 2001 for the project specific Hst of analytes following the procedures in STLM-8270C-2. All holding times were met.
Laboratory Method Performance: All laboratory method performance criteria were met for the reported samples with the following exceptions:
The batch LCS had the recovery for the control analyte, pentachlorophenol (23%), below the lower laboratory QC limit of 68%. This LCS also had no recovery of 2,4-dinhrophenol. However, the recoveries for these analytes in the batch MS and MSD, performed on sample RAB-SW-5004-01 were within QC limits.
Sample Performance: All quality control criteria were met for the reported samples with the following exceptions:
The MSD performed on sample RAB-SW-5004-01 had the recoveries for the surrogate, terphenyl-dl4 (105%) and the control analyte, di-n-octyl-phthalate (124%) just above the upper QC limits of 101% and 121%, respectively.
CERTIFICATION OF RESULTS
I . STL Baltimore certifies that the reported results relate only to those samples tested. All pages of this report are integral parts of the analytical data. Therefore, this report should be
010003

STL Baltimore ANALYTICAL NARRATIVE
CHeut: BatteJle Pwxbury Operations STL Baltimore Report: 200959 Site: Centerdftle Laboratory Project Manager Tar* E. Mart* Project number. G4S7001-22B1 Report Date: ll September IQOt
reproduced only in hg entirety,
2. STLBalthnoreliasbeenaccredhedtobemcompUairo ten results meet all the requirements of the National Environmental Laboratory Accreditation Conference (NELAC) standards. NELAP Primary Accrediting Authority laboratory IDs, #10692 (NYDOH) and 0B87032 (FLDOH)
3. Release of the data contained in this report has been authorized by the Laboratory Project Manager as verified by the following signature.
12 September 2001 Tara E. Martz, Laboratory Project Manager
010004

STL Baltimore ANALYTICAL NARRATIVE
Client: Battelle Duxbury Operations STL Baltimore Report: 200964 Site: Centredale Laboratory Project Manager: Tara E. Martz Project number: Centredale Report Date: 30 August 2001
This report contains the results of the analysis of two soil and two water samples collected on 16 July 2001 in support of the referenced project.
SAMPLE RECEIPT
The samples arrived with custody seals absent by Federal Express at STL Baltimore on 19 July 2001. Upon receipt, the samples were inspected and compared with the chain-of-custody records. The samples were then logged into the laboratory computer system with assigned laboratory accession numbers and released for analysis.
Client Sample Designation ST Lab Number WS427-o85W ^, 2009641 W5428- 6oMt\W*ti*r-\ 200964-2 W5429- tcCSVtf*. 200964-3 W5431" P*3*£ 200964-4 WoAer VOO £
Following this narrative section are glossaries of data qualifiers (Table 1), codes associated with manual integration of chromatographic peaks (Table 2), and the original chain-of-custody records. Analytical results and quality control information are summarized in the appended data package which has been formatted to be consistent with the deliverable requirements of this project.
ANALYTICAL METHODS
The analytical methods used by the laboratory are referenced by the STL Baltimore Method SOP which is formatted aa STL-M-XXXXX-Y, where XXXXX is the reference method and Y is the SOP revision number. For example, analyses performed using EPA SW846 Method 8260B are identified as STL-M-8260B-3 where 3 is the laboratory SOP revision number. General Chemistry methods which are a consolidation of several reference methods, e.g. STL-M-CN for cyanide determinations, also include the identification of the specific reference method used for the analyses.
QUALITY CONTROL
The following sections are ordered as the data appears in this report. They contain observations made during sample analysis, summarize the results of quality control measurements, and address the impact on data usability based upon project Data Quality Objectives. For each fractional analysis the narrative includes:
f*\\

STL Baltimore ANALYTICAL NARRATIVE
Client: Battelle Duxbury Operations STL Baltimore Report: 200905* Site: Centerdate Laboratory Project Manager: Tara E. Marti Project nurober: G487002-22B1 Report Date: 30 August 2001
• Sample chronology: This section summarizes the sample history by fraction Including the sample preparation method and date, analytical method, and analysis date. Anything unusual about the samples, digestates, or extracts is identified. Holding time compliance is evaluated in this section.
• Laboratory method performance: All quality control criteria for method performance must be met for all target analyies for data to be reported. These criteria generally apply to instrument tune, calibration, method blanks, and Laboratory Control Samples (LCS). In some instances where method criteria foil, useable data can be obtained and are reported with client approval. The narrative will then include a thorough discussion of the impact on data quality.
• Sample performance: Quality control field samples are analyzed to determine any measurement bias due to the sample matrix based on evaluation of matrix spikes (MS), matrix spike duplicates (MSD), and laboratory duplicates (D). If acceptance criteria are not met, matrix interferences are confirmed either by reanalysis or by inspection of the LCS results to verify that laboratory method performance is in control. Data are reported with appropriate qualifiers or discussion.
VOLATELES by GC/MS - WATER (STL200964-04)
Sample Chronology: One sample and associated quality control were analyzed on 30 July 2001 for the client specified list of analytes following the procedures specified in STL-M-5030B-1/STL-M8260B-4. All holding times were met.
The batch MS/MSD, analyzed on 30 July 2001, was performed on other client's sample. The results for these QC analyses have not been included in this report.
Laboratory Method Performance: All laboratory method performance criteria were met for the reported samples with the following exceptions:
The batch LCS, V01GLCSE16, had numerous recoveries outside of the project specified QC limits.
Sample Performance: All quality control criteria were met for the reported samples.
SEMIVOLATILES by GC/MS - WATER (STL200964: 2,3)
Sample Chronology: Two samples and associated quality control were extracted on 26 July 2001 following the procedures specified in STL-M-3540C-2. The resultant extracts were analyzed on
010002

STL Baltimore ANALYTICAL NARRATIVE
Client: Battelle Duxbury Operations STL Baltimore Report: 200905" Site: Centerdale Laboratory Project Manager: Tara E. Martz Project number: G487002-22B1 Report Date: 30 August 2001
09,12 August 2001 for the project specific list of analytes following the procedures in STL-M8270C-2. All holding times were met.
The samples were re-analyzed at 2X dilutions to bring the extract concentrations of the target an&ryte, phenol, within the instrument calibration range.
The batch MS/MSD was performed on another client's sample.
Laboratory Method Performance: All laboratory method performance criteria were met for the reported samples.
Sample Performance: All quality control criteria were met for the reported samples.
SEMIVOLATILES by GOMS - WATER (STL200964: 1)
Sample Chronology: One sample and associated quality control were extracted on 20 July 2001 following the procedures specified in STL-M-3520C-0, The resultant extracts were analyzed on 26-27 July 2001 for the project specific list of analytes following the procedures in STL-M8270C-2. All holding times were met.
The batch MS/MSD was performed on another Batelle/Centredale sample, RAB-SW-5004-01. All data associated with these QC analyses were included in this report.
Laboratory Method Performance: All laboratory method performance criteria were met for the reported samples with the following exceptions:
The batch LCS had the recovery for the control analyte, pentachlorophenol (23%), below the lower laboratory QC limit of 68%. This LCS also had no recovery of 2,4-dinitrophenol. However, the recoveries for these analytes in the batch MS and MSD, were within QC limits.
Sample Performance: All quality control criteria were met for the reported sample.
CERTIFICATION OF RESULTS
1. STL Baltimore certifies that the reported results relate only to those samples tested. All pages of this report are integral parts of the analytical data. Therefore, this report should be reproduced only in its entirety.
010003
STL Baltimore ANALYTICAL NARRATIVE
Client: Battelle Duxbury Operations STL Baltimore Report: 200905 V«fW Site Centerdale Laboratory Project Manager: Tara E. Martz Project number: G487002-22B1 Report Date: 30 August 2001
2. STL Baltimore has been accredited to be in compliance with these standards and the repotted test results meet all the requirements of the National Environmental Laboratory Accreditation Conference (NELAC) standards. NELAP Primary Accrediting Authority laboratory IDs, #10692 (NYDOH) and #E87032 (FLDOH)
3. Release of the data contained in this report has been authorized by the Laboratory Project Manager as verified by the following signature.
30 August 2001 Tara E. Martz. Laboraory Project Manager
010004

STL Baltimore ANALYTICAL NARRATIVE
Client: Battelle Duxbury Operation! STL Baltimore Report: 200940 She: Centredale Laboratory Project Manager: Tara £. Martz Project number: Centredale Report Date: 9 August 2001
This report contains the results of the analysis of one water sample collected on 10 July 2001 in support of the referenced project.
SAMPLE RECEIPT
The sample arrived with custody seals absent by Federal Express at STL Baltimore on 13 July 2001 . Upon receipt, the sample was inspected and compared with the chain-of-custody records. The sample was then logged into the laboratory computer system with assigned laboratory accession numbers and released for analysis.
Client Sample Dgilyn jflqp ST Uifflfr ^JJHH RB-071001 200940-1
Following this narrative section are glossaries of data qualifiers (Table 1), codes associated with manual integration of chromatographic peaks (Table 2), and the original chain-of-custody records. Analytical results and quality control information are summarized in the appended data package which has been formatted to be consistent with the deliverable requirements of this project.
ANALYTICAL METHODS
The analytical methods used by the laboratory are referenced by the STL Baltimore Method SOP which is formatted as STL-M-XXXXX-Y, where XXXXX is the reference method and Y is the SOP revision number. For example, analyses performed using EPA SW846 Method 8260B are identified as STL-M-8260B-3 where 3 is the laboratory SOP revision number. General Chemistry methods which are a consolidation of several reference methods, e.g. STL-M-CN for cyanide determinations, also include the identification of the specific reference method used for the analyses.
QUALITY CONTROL
The following sections are ordered as the data appears in this report. They contain observations made during sample analysis, summarize the results of quality control measurements, and address the impact on data usability based upon project Data Quality Objectives. For each fractional analysis the narrative includes:
• Sample chronology: This section summarizes the sample history by fraction including the sample preparation method and date, analytical method, and analysis date. Anything unusual about the samples, digcstates, or extracts is identified. Holding time compliance is evaluated in this section.
010001

STL Baltimore ANALYTICAL NARRATIVE
Client: Battellc Duxbury Operations STL Baltimore Report: 200940 Site: Centerdafe Laboratory Project Manager Tam E. Martz Project number: G487002-22B1 Report Date: 9 August 2001
• Laboratory method performance: AD quality control criteria for method performance mutt be met for all target analytes for data to be reported. These criteria generally apply to instnnnettt tune, calibration, method blanks, and Laboratory Control Samples (LCS). Intone instances where method criteria ftfl, useable data can be obtained and are reported with client approval. The narrative wiD then include a thorough discussion tf the impact on data quality.
• Sample performance: Quality control field samples are analyzed to determine any measurement bias due to the sample matrix based on evaluation of matrix spikes (MS), matrix spike duplicates (MSD), and laboratory duplicates (D). If acceptance criteria are not met, matrix interferences are confirmed either by reanalysis or by inspection of the LCS results to verify that laboratory method performance is in control Data are repotted with appropriate qualifiers or discussion.
SEMTVOLATTLES by GC/MS - WATER (STL200940: 1)
Sample Chronology: One sample and associated quality control were extracted on 16 July 2001 following the procedures specified in STL-M-3520OO. The resultant extracts were analyzed on 23 July 2001 for the project specific list of analytes following the procedures in STL-M-8270C-2. All holding times were met.
Due to insufficient sample volume, duplicate LCSs were extracted and analyzed with the samples in order to provide batch precision and accurate data.
Laboratory Method Performance: All laboratory method performance criteria were met for the reported samples with the following exception:
The batch LCS, LCS duplicate and method blank had the surrogate recoveries for 2fluoroWphenyl just below the lower QC limit of 68% at 57%, 60% and 61%, respectively. The method blank also had the surrogates 2,4,6-tribromophenol (62%) and terphenyl-d 14(67%), below the lower QC limits of 65% and 68%, respectively.
Sample Performance: All quality control criteria were met for the reported samples with the following exceptions:
Sample RB-071001 had the surrogates 2-fluorobiphenyi (60%) and nitrobenze-d5 (58%) below the lower QC limits of 68% and 59%, respectively.
010002

STL Baltimore ANALYTICAL NARRATIVE
Client: BatteUe Duxbury Operations STL Baltimore Report: 200940 Site: Centerdale Laboratory Project Manager: Tara E. Martz Project number: G487001-22B1 Report Date: 9 August 2001
CERTIFICATION OF RESULTS
1. STL Baltimore certifies that the reported results relate only to those samples tested. All pages of this report are integral parts of the analytical data. Therefore, this report should be reproduced only in its entirety
2. STL Baltimore has been accredited to be in compliance with these standards and the reported test results meet all the requirements of the National Environmental Laboratory Accreditation Conference (NELAC) standards. NELAP Primary Accrediting Authority laboratory IDs, #10692 (NYDOH) and #E87032 (FLDOH)
3. Release of the data contained in this report has been authorized by the Laboratory Project Manager as verified by the following signature.
9 August 2001 E. Martz, Laboratory Project Manager
010003

STL Baltimore ANALYTICAL NARRATIVE
CHent: BatteUe Duxbury Operations STL Baltimore Report: 200972 Site: Centerdale Laboratory Project Manager: Tara E. Martz Project number: Ceaterdale Report Date: 28 Augast 2001
This report contains the results of the analysis of one water sample collected on 19 July 2001 in support of the referenced project.
SAMPLE RECEIPT
The sample arrived with custody seals absent by Federal Express at STL Baltimore on 24 Jury 2001. Upon receipt, the sample was inspected and compared with the chain-of-custody records. The sample was received in a cooler with ice packs, but the temperature was still 6 degrees. The sample was then logged into the laboratory computer system with assigned laboratory accession numbers and released for analysis.
Client Sample Designation ST Lab Number RB-0718-01-A 200972-1
Following this narrative section are glossaries of data qualifiers (Tables 1), codes associated with manual integration of chromatograpbic peaks (Table 2), and the original chain-of-custody records. Analytical results and quality control information are summarized in the appended data package which has been formatted to be consistent with the deliverable requirements of this project.
ANALYTICAL METHODS
The analytical methods used by the laboratory are referenced by the STL Baltimore Method SOP which is formatted as STL-M-XXXXX-Y, where XXXXX is the reference method and Y is the SOP revision number. For example, analyses performed using EPA SW846 Method 8260B are identified as STL-M-8260B-3 where 3 is the laboratory SOP revision number. General Chemistry methods which are a consolidation of several reference methods, e.g. STL-M-CN for cyanide determinations, also include the identification of the specific reference method used for the analyses.
QUALITY CONTROL
The following sections are ordered as the data appears in this report. They contain observations made during sample analysis, summarize the results of quality control measurements, and address the impact on data usability based upon project Data Quality Objectives. For each fractional analysis the narrative includes:
• Sample chronology: This section summarizes the sample history by fraction including the sample preparation method and date, analytical method, and analysis date. Anything unusual about the samples, digestates, or extracts is identified. Holding time compliance is evaluated
oiooox

STL Baltimore ANALYTICAL NARRATIVE
^Client: Battelle Duibury Operation* STL Baltimore Report. 1009*5' *ifi i /A/d I She: Centerdale Laboratory Project Manager. Tarm E. Murtz Project number: G487002-22BI Report Date: 28 August 2001
in this section.
• Laboratory method performance: AU quality control criteria for method performance must be met for all target analytes for data to be reported. These criteria generally apply to instrument tune, calibration, method blanks, and Laboratory Control Samples (LCS). In some instances where method criteria ftil, useable data can be obtained and are reported with client approval. The narrative will then include a thorough discussion of the impact on data quality.
• Sample performance: Quality control field samples are analyzed to determine any measurement bias due to the sample matrix based on evaluation of matrix spikes (MS), matrix spike duplicates (MSD), and laboratory duplicates (D). If acceptance criteria are not met, matrix interferences are confirmed either by reanatysis or by inspection of the LCS results to verify that laboratory method performance is in control. Data are reported with appropriate qualifiers or discussion.
SEMIVOLATILES by GC/MS - WATER (STL200973: 1)
Sample Chronology: One sample and associated quality control were extracted on 25 July 2001 following the procedures specified in STL-M-3520C-0. The resultant extracts were analyzed on IS August 2001 for the client specific list following the procedures specified in STL-M-8270C-2. All holding times were met.
Due to insufficient sample volume, duplicate LCSs were extracted and analyzed with the samples in order to provide batch precision and accuracy data.
Laboratory Method Performance: AU laboratory method performance criteria were met for the reported sample with the following exception:
The method blank (MB3747) had the recovery for surrogate 2,4,6-tribromophenol (52%), slightly below the lower laboratory QC limit of 63%. The LCS limits were all within QC limits.
The LCS duplicate had four low surrogate recoveries and four low control analyte recoveries. These low recoveries appear to be isolated to the LCS duplicate since the LCS limits were within laboratory QC limits and all surrogate recoveries for the sample were also within QC limits.
Sample Performance: All quality control criteria were met for the reported sample.
010002

STL Baltimore ANALYTICAL NARRATIVE
?»• Client: Battelle Duxbury Operations STL Baltimore Report: 200909* She: Centerdale Laboratory Project Manager Tara E. Mart* Project number: G487002-22B1 Report Date: 29 August 2001
CERTIFICA TION OF RESULTS
1. STL Baltimore certifies that the reported results relate only to those samples tested. All pages of this report are integral parts of the analytical data. Therefore, this report should be reproduced only in its entirety.
2. STL Baltimore has been accredited to be in compliance with these standards and the reported test results meet all the requirements of the National Environmental Laboratory Accreditation Conference (NELAC) standards. NELAP Primary Accrediting Authority laboratory IDs, #10692 (NYDOH) and #E87032 (FLDOH)
3. Release of the data contained in this report has been authorized by the Laboratory Project Manager as verified by the following signature.
28 August 2001 Tara E. Martz, LaboratOrProject Manager
010003

Water and QC Results

illl
-: 3
S3
fe 5
88
Of
cy 1mJ5
iSI
t
1 HI
<
a! a!
ii
gg
3
99
9
99
h
-t-h
-l-l-H
t-l
ioin
inn
intn
ino
) u> u) uj (a in tn in
<o <n <o 5
99
9
99
55'
ss
ss
55
5 5
5
3

ll 11
111
3388j
3338888 33388838 38
bL
5J
5g
£S $ 52£
5

III
^a 53
DO
8888 8888888
00
I O O O
3K
§§§
n nnn
§§§§
55
§ c i
§.
ilzz
zz
z|z
iil
mmmnimmmm
999 999999 999 (o(
oc owy>o
)
SS
3Sss
3 3SS

3333
33
888888888888888888
> >
5555
sii J
sf
55I5

fit! !S
S
ass 8 s s! 8!s i s is
OS
8
8
i E
(N
4
00
If
f) V
) V
) V
)
I
U
2
a a §§§
zzzz
m a
oq m m
m
m m m m
999993 99
999
199
10 io
ojin
liol
tn in tn CO(/)(0(/>CO<OCO(/>
' > « «
999999-9-999 999
9999999999
555
55
sss 555 55
5555

33
33
in i n
8! •5
88
88
88
88
88
8
8
88
8
88
8
8
88
8
99
9
99
ss
S
5 S
5ils s
i

33
to <o ss
5 5
555
88888888
ft §s
sss
(LOO
i§§
< <3
4444
4444
000
iii ii
zzz
9999
99
99999
999
www
99
999
999
9999^99999999
9*? 99999
Z
2
55
555
55

33
33333
ill1111
11 11
111
11111
111 1111
5ss8888888S8S8383888
,88
8883
883383888 333383833
§ -E 5
i li.
E
9999 995
999
5SSS

3
O 3
38
(8! 88! 8
!8!8
!8!S
55
5
5 5
5
S
5S
O O
O O
O O
Is Is .
ifII
I|SJ|
If Si 3
ill
ssss
OC
!
55
5
t:
ii
9 9
9
ItolS
W
CO 03
C
OW
W
$9
9
99
99
99
99
9
99
99
99
9 9
9
99
99
99
99
9 9
9 9
99
99
9
55
99

- -
33
o <D
<D tf)
11
888888888888888888888888888888
99
9?9999
99
S55
UUl

X
I

33
3
88
SS
S
o.
81 •5
8S
8S
Q8
J88
3
99
?
?3


35
88
$
88
33
%
S 3
3
85
§8
8
$S
3
EE
Et
EE
EE
?E
SiSiSiSiSiSiSiSiSiSiSiSiSiSlSiSiSiSiSiSiSiSiSi Si Si Si Si Si Si S! Si Si Si Si S! Si Si Si Si Si Si SiSiSiSiSiSiSSiK
iSiSiSiSiSJSlSiSiSiSi?!!
S§
^«
MP
^«
^P
QQQ

a a a a bi a b.'a. "b
88
88
88
3
33
2 5
5
5
5 5
5
3 5
2 5
55
55
5 5
05
00
IillII
D»a S
i
ft
III
m m
9
99
99
99
9!
Fa> H u> u> tn u> in in
w Si ra So
88
8
88
88
88
88
8
88
" m m
sis

ll


a
83
33
33
38
33
38
83
33
83
33
33
83
33333
38838388333
5
I 3115555.155§§ mm


88
Si •6 8
ssss

SI 3

1111 888
0.0.0.0.0.0.0.0. EE2
£22

limit mini
III Illllllll
383
3333333333
33333aa
33
333 ||S
33 3333 ~
2 2 11
zi
if II
? li
II
oooogo
sees
pppgppoPooop p p po
ess9S99
oogpp
o o
o o
o p
esessssses
UO
UU
UU
mc
qm
mm
mm
cq
co
eg oj tg m o
<g <g g
P P
F F
P
88
88
88
8
99
9
99
99
99
i
52

33
33
33
1111111
111 Ell
11
11
111
11 IE
I I
9999999999
9999999 999999
999999

88
I1 a.
Ill III II
18 S3 S3
ssss
333233333351
333113333
33
3
x II > 11
11 i
go 00 ooggoo
00000000000000
gggggSSS sss
ggggg
sss
ss
see
sses
3355
33
< 3
22 SS
sssssss ZZ22
zz zz
zzzzzzzzz
a, ,3,3,3
•3999939
9°
99
99999999 999
99
§§§§§
u S255 :
"
~CO (O
( O U
I ii ft o
2! 5SS5
EE
99

33
33
333
S83S
s •5
Ill11
1111
11 11
66111
11 111 66
9999 99999999999
99
99
99
999
"""1!

Ill S
8!S
S!
13
33
8
33
33
3
33
33
(O
tD
3S
S3
SS
3
33
33
3
3
88
88
m
c 7
II
00
00
0
pg
pp
p
gp
gp
gg
pg
-,,3
33
-3,
i i
2 2
23
i
2! E
59
E5
zz
zz
Mlz
lzz
33
3 3
33
3 to
w w
t ot o«
w
19
9
iL
,8II
ii g|g
|o:
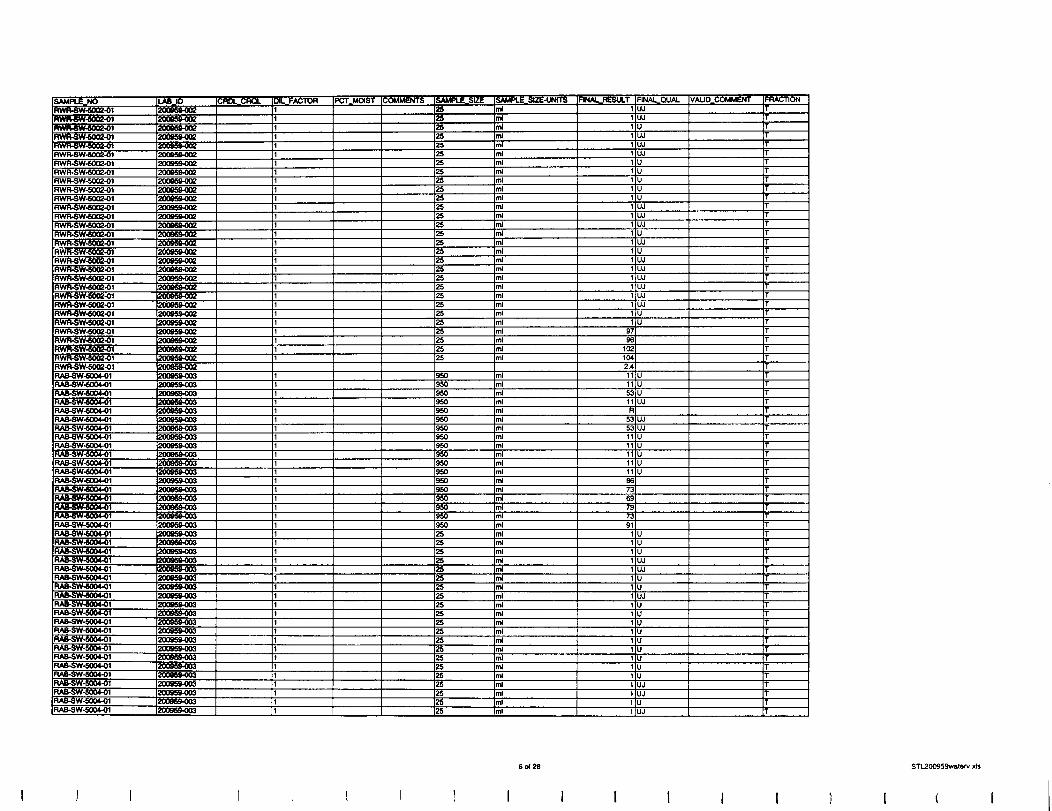
u
i33 33
333
1 111?
11 111111
11
11
11111 111111?
111111
ssasss
999
9999
99

Iff
til
II
8888
88
88
8
3 1
33
33
38J3
38! 3
33
SS
3S
!8I5
!5!3
33
33
33
8!
(3
33
3
33
33
33
33
33
33
33
3
33
33
33
3
3 3
33
3
38
8
III
05
5 8
88
8
iii
i!til
wi
sss"
ss
^3
1 <<
^3 3 a
5 L.
~ 3
S
S
zz
z
zz
zz
zz
3,i
99
9
99
ss 88
88
88
8
33
33
mss
I
2£
Jl
t
to tn in in ir i
D
£ 5 la!
ec c if c
c
it if c if if Cj
ff 1C (f C C
, S
lfli5S
5 I
I
99
99
39

33j 3333=3333 333
3333
33 33
11111111111 ElE11111111
ll11
EEE
IIEll Ell
E E E E I
SSQS as
m wi
CM CM
33

33SSS
8S3S8
333 33
333 3333
5333
33 3S3S33S
3333333333333 33333333
5
S5S5
II
ii
I
I
s
Ii 85
I
NO.
SS8
see
gopppopppp
ee
es
ee
se
es
s
9S
99
ii
sss z
zz
zz
2Z
£ J919 | S |31919 ] 3 9
99
iili
99
9
9
99
R
SS
III
ii
<au> a
a
* E
E_
_S
? 8
*ssls
gils
S
S
ill ss

33
Ill 11111111
111
E El 11 111
11
11 111
11 111 111
888 ass
ss ssassssss ssss sss ssssss
5 •?
.1
it sis
53

88
_lt J
,J_I.J,_l,_lt .
Jc J
|l
Illll
11111
111
111111111
83333
SS
I3SISS3SS33133S?
333
3333333
552
iii
££
ill! 1 If
ll If
f^
S".
II
opppp
ess see
pppppoo
. S5S
gggg
Sa
it S o! a!
222222222
E2222222222
u _
C S.
,3 oj g
n| D 03 eg
S2 g
a) W
) «W
0) W
a. a 0 . a . a a . tt; CL.
SiS
tS 5
5
50
55
53
55
52
5
55
f f f 5f
f f <
5<
5
55
5
S9
oo
o
oo
ooooc
oo
SfE 5
5 ill II
g15
15 IS5 II
5555555555

3
33 333
33333
111
1111 11111111
11
lie
? E E
111
IE-
111111
sss

II
fllltllllllt III! ft
II
II
88
33
3333133333333333
33
33 33
52555
888
$?
II
see
eesee
ooogg
gggeeee
popppgg
gppppppppop
pp
po
og
o
gs
gs
g
pp
pp
pp
ee
ee
ee
ee
SS
5 z
zz|z
zlz
lzlz
S
zz
zz
zz
99
~t(IfOf
SS
I !
__II
I
i5
25
5

33
2=3
33
IE
1111 11 111 11
11
111
11 111
11111
11111 11
aaaaasasasaa
asa aaaa
5 alp 555
55
5555

Illll III Illll
llflllllllllilllllllllll
1sssis
§8
! 8! 8! 8)
ss s
33
3
ss 3
33
ll
11
S-s O
rfO
sssssssassa II
gg
g
gg
se
e
se
e
se
es
ee
e
g s
sa
ee
e
ee
ee
ee
es
g
33
33
33
3
sss z
lzlz
lzz
zz
zz
zz
zz
zz z zz
zMMMMIMM zz
CD ID mm m
939
gs
I
III
S52
S22
[A (A
rrt
i Ei222E
iiii

333
33 333
333
IE 111111
ll 111
IE
11 111111
KS sss
a.a . a.o .a .=
ESE EE EE
EEEEE
SS
5 *- $15
II

£85
lltlllll
SS88 §8
S!S
--
--
_
33 3333
33 33 U)
3
33333332
33
55533
II
55 55
I II
I! ill
II "ST
I 38!
SfflSS
pggOO
5,8,6;
ooggg
opppp
ese
gggg a s
esae
I 888
zzzz zlzz
zz
ss^
' qo
mom
r£o
II

5
g
33, 333
$888
ssssssss SSSiSS
1 13
11111111111 111111
11 11
111 11111
11 11111e
EEE
ass 88.
aaas

8SS
8 8
88
! 8!8
S
S3
S5
J3
8888888888888
SiSS 3S
ii
33S__
33 3333 33333 33
55S5S
888
<? <? r
I!!
II! sss Sffi
ppppoo
ssssess
aaaa a
aaaaaaaaaasaa
gggesess
ii £
333333 33
9 okn
'tt<

883
11111111Ell1111
111
1111 iiiiiiiiii
11 El E
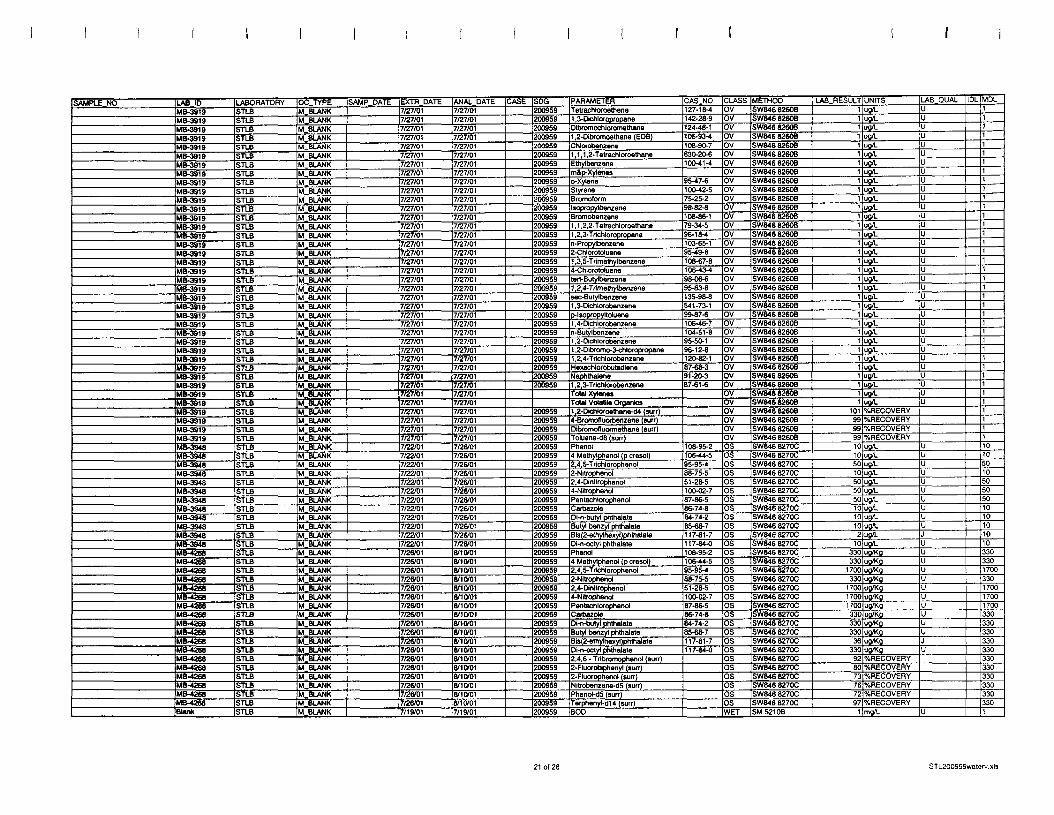
88
aaaa
111111 1111
11 a1111
11
88
88888
38 33
3 333
8333 388
338383833338(833 833883
9133323 3333
33332
3
332
533333
555
555
55555 53
oob
8888
88
S8888
05
r>S
>
i
llIt
1;I
11 sss
SSffi
55555
aaaasaaaaaaaaaaaaa
SS
ss
gg
ss
s
as as.s i as a as sia ass
S S
SS
5
33
33
33
33
3
si

;ss \StS',
o
Si
111111111111
El 1
11
11
ill
11
ill11111111111111
1111
jqSKSSSSSSSSSSSSQSSSSSS as
Si Si Si Si Si Si IS
S ^§
sss§3'i
iiii
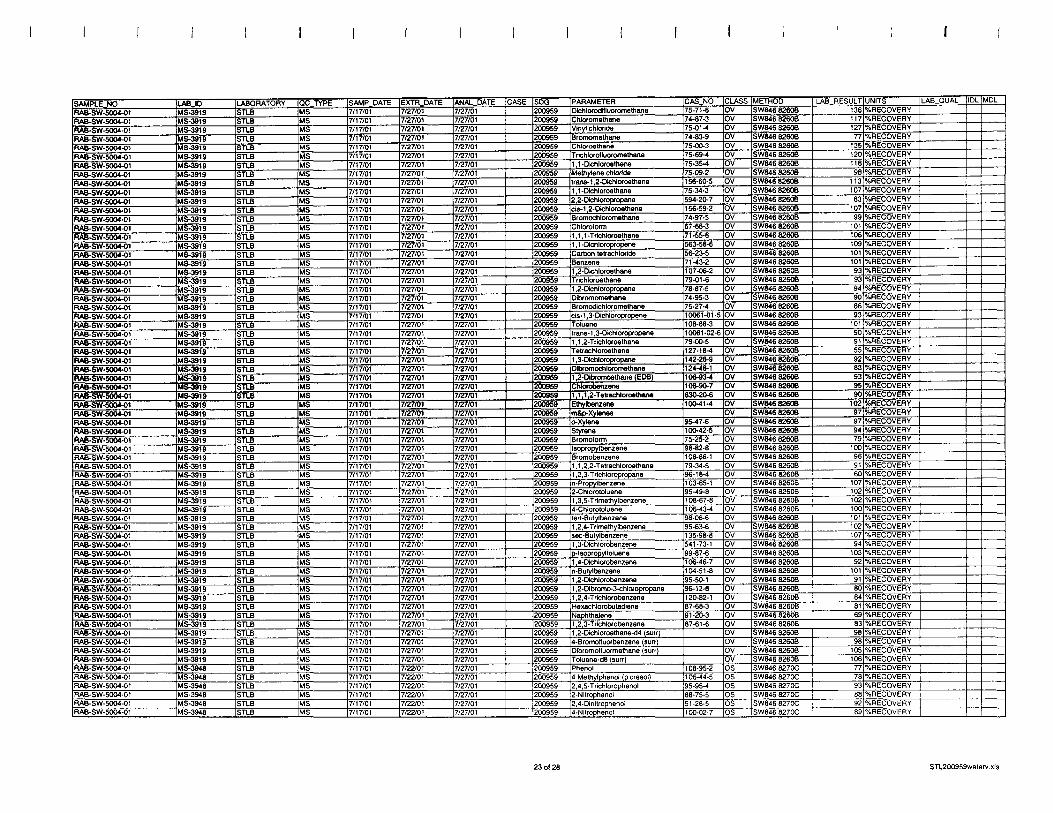

I .8
808
SSSS88
I 111111111IEEE E £ E
11 111
1111111
11111111111111
assssssssssssss888 888
assssss
sssssssssss
lill

SEE
SEES
8U8
838
S8SB
ass 333
ill
> > >
ooo
ll
2*2 II
•i si sss
pooppppppp
8S9
ggggggggess
.,, »»
39! 399
000
is
5S
rn m
I
Sto
£ £ £ ££

SSS
o 8
Sin?11
lit11111 E E E El E E
11
11
111
ElllEll11? El11
55
3 38338888
3333 33838 38333 33388838 338333838
5. ^

$ S
S! 33
33
3S

?S
S3
:S
8f
IS
E6
EE
El
IE
EE
illl
E E

13 o
iSS
S
S§
§
!I
i ^Is
£
SS
S
tefei tefe
iill
w M
co to to tr.
XX
0. OL
II

I .
J 8 5 § I c I


l> o
:8Si:
:s$
: n 8!i s S
i d> ob «b < 1
33
33
! 3
33
! 1
33
33
33
3
33
3


I SSi SIS
ll
88
88
8
88
8
88
8
88
881
88
!
RR
K«
«
33 3
33
33
3
3I3I3I3I3 3133
33
33
....::s

^ ^
'S
3
;CO
O
) <
SS
^
II
5m
m
m m a!
m mm
m m
m
mm
55 3 com
3
5
2 5
S
2
m m
1
3!
S
to w to
ifci
ill

I
Q
iE
H

gg
CO
tD
SS
3
33
88
!
23 5) & a s
m m
m m
m
m
m m
m
m

i 8
88
(C
o o
o
o <sa
<s o
88
88
8
8
I
111


33
88
;gg
ill111
111
ill
ill
11
ill
ill
ill
Ell
Elll
888888! 88!
888!

slsls

5 |
{
i
i 8S
0
J ID<n g 5! =
n ;
a OT
") 111
i
U
in ,
0
n
£r
u. 5
__ ^
i
5
siid
! J
i
1 (0


i 3

is o
o O
0
_l
O_j
<DOm DC
E
r r cc
>>
> >
O
D
oo
Ȥ o
Oo
o
cc cc 13
i? i?
# s«
\—
o
_i r*
8
DCO
UJ
cc CD METHOD
SW846 B270C
SW846 8270C SW846 8270C
SW846 8270C SW846 8270C
(0
CO
CO to
a) en §8 O
OO
O
iCO PARAMETER
2-Fluorobiphenyl (surr)
"E31
Phsnol-dB (surr)
1I a
Terphenyl-d14 (surr)
? i
ii
11
N
S
UJ
CO
<u<ll <
53
ii
8/15/01
1i
8/15/01
u<K £J
±<0i50.
Z
f:5
8'^
LABORATORY
STLB
9'1§
i iLi
4CO
7/25/01 1§
1CJ (y
ZZ
2 Z
4
4<
<i
ix a
m a
2 Z
22
aa
CD a
fc fe fcfc
MB-4334
MB-4334 i?

Sfc

Section 5 Nutrient Results
QA/QC Narrative Water and QC Results

QA/QC Narrative

NUTRIENT WATER QA/QC SUMMARY
PROJECT: PARAMETER: LABORATORY:
MATRIX: SAMPLE CUSTODY:
USAGE NAE Delivery Order #01 Centredale
Nutrients University of Maryland Center for Environmental Science, Chesapeake Biological Laboratory (CBL) Solomons, MD Water Water samples were received at CBL on July 17, 2001 and July 18, 2001 Water samples were filtered and subsampled into various containers upon receipt
QA/QC MEASUREMENT PERFORMANCE CRITERIA: SRM Replicate
Reference Surrogate LCS/MS % Relative Method Blank Recovery Recovery Diff. Precision
Nutrient L-62 <5 x Not 85-115% <10% RPDCBL MDL Applicable Recovery PD SOP
Achieved MDL NO2 0 0007mg N/L
NH4 0 003mg N/L
PO4 0 0007mg P/L
NO3 0 0007mg N/L
DOC 0 24mg/L
TOC Not available
TSS 2 4mg/L
TDPOOOlmgP/L
TON 0 02mg N/L
TPOOOlmgP/L
TN 0 02mg N/L
Project Goals
Not available
METHOD: With few exceptions, water samples were prepared and analyzed for nutrients (NO2, NH4, PO4, NO3, DOC, TOC, TSS, TOP, TON, TP, and TN) following methods described in Battelle's Quality Assurance Project Plan (Battelle, 2001, page 70 and 71 of 509) Deviations include
• Lab Qualifiers - The lab qualifier L was used with TSS results to indicate that the sample result reported was detected at a level less than the detection limit
• QC Samples - Some required QC samples were not prepared with the water samples For example, a matrix spike (MS) sample was required for all nutrient parameters except TSS However, an MS QC sample was only prepared for TDP and TON A non-project specific MS was prepared in the laboratory at the same time that the Centredale samples were prepared for analysis, and results from this non-project specific MS are reported with the data Specific cases where required QC samples were not prepared are discussed below
EDD Reporting—Information for the following EDD fields were obtained by phone conversation with CBL (10/17/01) EXTR_DATE, ANALJDATE, SDG, LAB_QUAL, SAMPLE_SIZE, and FRACTION
Page 1 of 3

NUTRIENT WATER QA/QC SUMMARY
HOLDING TIMES:
DETECTION LIMITS:
BLANKS:
MATRIX SPIKES:
REPLICATES:
Samples were filtered within 24-hr of collection and analyzed within 28 days of preparation.
Preparation Date Analysis Date 07/19/01 7/19 - 8/14/2001
Nutrient results are reported relative to the method detection limits for that compound. Achievable MDLs are limits that an individual laboratory can achieve when performing a specific analytical method. The MDL values are three times the standard deviation of seven replicates of low-level samples.
Project detection limit goals were not provided for nutrient parameters.
The method blank prepared with the analysis met QC criteria indicating the method is in control.
A project-specific matrix spike (MS) sample was prepared for TDP and TDN only. The percent recoveries were calculated to measure data quality in terms of accuracy. TDP and TDN were recovered within the control limits specified in QAPP.
Recoveries as following:
TDP TDN MS 99% 97%
A project-specific MS was not prepared for NO2, NH4, PO4, NO3, DOC, TOC, TP, or TN. However, two MS samples from another project were prepared in the laboratory within the same time frame of the Centredale samples. Recovery data for N02 and NH4 are available for these two MS samples, as follows:
NO2 NH4 MSI 94% 88% MS2 93% 84%
NO2 and NH4 were recovered within the control limits specified in QAPP, except NH4 in MS2 recovered just slightly lower than the limit (84% recovered vs. control limit of 85%).
Recovery data for PO4, NO3, DOC, TOC, TP and TN are not available.
A laboratory duplicate was prepared for NO2, NH4, PO4, NO3, DOC, TOC, TSS, TP, and TN. Replicate data for TDP and TDN are available from the non-spiked MS and MSD samples. The RPD between laboratory replicate analyses was calculated to measure data quality in terms of precision.
RPDs were within the control limits specified in QAPP, except RPDs of NH4 (13.3%), PO4 (10.2%) and TDP (15.4%) were just slightly over the limit.
RPDs ranged from:
Nutrient Duplicate 5.5 - 15.4%
Correction Action - RPD exceedences flagged on the final report.
Page 2 of 3

NUTRIENT WATER QA/QC SUMMARY
SRM:
REFERENCES:
A SPEX STANDARD was prepared with the TOP, TDN, and DOC analysis. The percent difference (PD) between detected concentrations and certified values was calculated to measure data quality in terms of accuracy.
PDs were within the control limits for all measured parameters in the SPEX standard and ranged from 0.0 - 8 0% PD.
A SPEX STANDARD was inadvertently not run with the Centredale samples for NO2, NH4, PO4, NO3, TOC, TP, or TN.
Correction Action - A SPEX standard processed within the same time frame from a different project measured for NO2+NO3, PO4 and NH4 were reported.
PDs ranged from 2.0- 4.0%
Battelle 2001. Centredale Manor Restoration Project Superfund Site Baseline Risk Assessment, Initial Project Planning and Support. Tasks 19-22 QAPP prepared under contract to USAGE NAE. Delivery Order #59. May 23, 2001. 509pp + apps.
Page 3 of 3

Water and QC Results

O) 01 a
.._
..
J J J
JJ
J.
a/a/a/a/a/a/a/a/a/a/a/a/ m
mm
mm
mm
ajm
J J
J
o z
J z
5
r
nc
mm
8
(O
<O


88
CD O
!£!S
*-^1
0
Iill til
'• £
Jo
VJ
W
V
V>
U
^
UJ
U
J
to JJ
D
CD
CD
CO
00
CD
CD ID
CD
CD
M
(fl(
PC
lf)
tPfP
fF>
rnf
!nfO
CQ
fQC
Offl[t)
mm
d be a

18
8
9
> CO
51
90
'9
9

88
CO o
f fg Illli
y u s!
sis g

m
o
:88 "li 188
!888
) «
• S
co i £'!

Section 6 Third Party Validation Report
Validator findings reported here may include results from non-water samples (e.g., sediment). Only validator findings
specific to water samples are applicable to this data report.

Section 1 Quality Assurance Review
A. Organic Data
The organic analyses of 11 sediment samples (including QC samples) and one aqueous blank sample were performed by Severn Trent Laboratories (STL) of St. Louis, Missouri. The samples were analyzed for semivolatile organic compounds (phenols and phthalates) by SW-846 Method 8270C. These analyses are specified on Table 1. The laboratory organized the samples into the two sample delivery groups (SDGs 200929 and 200940).
The findings in this report are based upon a US EPA Region I Tier II (Tier II) review of holding times, condition of samples upon laboratory receipt, blank analysis results, laboratory control sample (LCS) recoveries, matrix spike (MS)/matrix spike duplicate (MSD) recoveries and precision, surrogate recoveries, internal standard response, instrument sensitivity, analytical sequence, gas chromatography/mass spectroscopy (GC/MS) decafluorotriphenylphosphine (DFTPP) instrument performance checks, calibrations, overall system performance, and quantitation of positive results.
Overall, the organic data quality is satisfactory. The data reviewer has edited the laboratory-reported data and QC forms based on the deficiencies and comments listed in this QC review. Contractual and reporting requirements were met for this data set, with the exception of the items identified in the following sections of this QA review; it should be emphasized that these items do not necessarily impact data usability. Based upon a Tier II review of the data provided, the organic data qualifiers associated with the samples that underwent data validation are presented in the subsequent Organic Data Qualifiers section. These qualifiers should not be applied to any organic results that did not undergo data validation. Data usability issues represent an interpretation of the QC results obtained for the project samples. Quite often, data qualifications address issues relating to sample matrix problems. Similarly, the validation guidelines specify areas of the data that require qualification, yet the methods used for analysis do not require any corrective action by the laboratory. Accordingly, the data usability issues that follow should not necessarily be construed as an indication of laboratory performance.
Noncorrectable Deficiencies <D
In SDG 200929, high percent differences (%Ds^->20^b) were observed for 2,4-dinitrophenol and 4-nitrophenol in the initiaL£attr5ration verification (ICV) standard analyzed on 7/30/01 at 1645 on instrunieat^SA 1. According to the QAPP (Worksheet #21), the laboratory is requiredlo-p€f1orm corrective measures, such as recalibrating the instrument, if any %Difr-gfeater than 20%; the laboratory did not perform corrective measures. Data^Avetenot qualified due to this deficiency because project samples were not analyzetTm association with this ICV.

-page 2
2. In SDG 200929, a high %D (>20%) was observed for 4-nitrophenoH»-1he continuing calibration verification (CCV) performed on 7/31/01 at 142>-6n instrument SAL According to the QAPP (Worksheet #21), the laboratory is^cequired to perform corrective measures, such as recalibrating the instrument, i f^MyVoD is greater than 20%; the laboratory did not perform corrective measures^Tne impact on data usability due to the high %D is addressed in the subsequent Organic Data Qualifiers section.
3. In SDG 200929, high %D»^£>20%) were observed for 2,4-dinitrophenol and 4-nitrophenol in the CCV^penbrmed on 8/2/01 at 0233 on instrument SAL According to the QAPP (Worksh£ef#21), the laboratory is required to perform corrective measures, such as recalibrating the instrument, if any %D is greater than 20%; the laboratory did not perform corrective measures. Data were not qualified due to this deficiency because only there^tfTtforbis(2-ethylhexyl)phthalate in sample APB-SD-4010-0000-01 was associated
L this CCV.
4. In SDG 200940, a high %D (>20%) was observed for 2,4-dinitrophenol in the ICV performed on 7/18/01 at 2308 on instrument SC3. According to the QAPP (Worksheet #21), the laboratory is required to perform corrective measures, such as recalibrating the instrument, if any percent difference is greater than 20%; the laboratory did not perform corrective measures. Data were not qualified due to this deficiency because project samples were not analyzed in association with this ICV.
5. In SDG 200940, high %Ds (>20%) were observed for 2,4-dinitrophenol and 4-nitrophenol in the CCV performed on 7/23/01 at 1024 on instrument SC3. According to the QAPP (Worksheet #21), the laboratory is required to perform corrective measures, such as recalibrating the instrument, if any percent difference is greater than 20%; the laboratory did not perform corrective measures. The impact on data usability due to the high %Ds is addressed in the subsequent Organic Data Qualifiers section.
6. For the SDG 200940 preparation batch 3472, several surrogate compounds in the LCS/LCSD and the preparation blank analyses were recovered below the QC limits specified in the QAPP (Worksheet #24b). According to the QAPP (Worksheet #24a), the laboratory must reanalyze, reprepare, or qualify the data when surrogates are outside of QC limits. The laboratory should have re-prepped the QC samples and any associated samples based on the low surrogate recoveries. The data for sample RB-071001 exhibited one low surrogate recovery and, therefore, qualification of data was not warranted; it is possible that the low surrogate recovery in this sample was a systematic extraction problem or spike addition problem.
w:\battelle\duxbury rl dv\yl031544\fmal\reportl.doc
ENVIRONMENTAL STANDARDS

-page 3
Comments
1. According to the Chain-of-Custody Record and Job Sample Receipt Checklist Report (Checklist Report), the sample containers for SDG 200929 samples RAB^SD-5 008-000001 and GMP-SD-5007-0000-01 were received broken. In addjJiefC sample GMP-SD5007-0000-01 was received without a label and with anii«5orrect time of collection indicated on the bottle. The laboratory indicated on^the"Checklist Report that a Non-Conformance Recovery (NCR) was issued; however, the NCR was not provided in the package received for review. It was, therefefef assumed that the laboratory used sample from the damaged containers for analysts. The COC indicated that sample GWP-SD5007-0000-01 was transferred tpxanother sample jar. It was not apparent if multiple sample containers were provided for these samples or if the integrity of the samples was compromised as a resuji^or the broken sample jars. Data were not qualified due to this issue.
2. According to the Analytical Narrative and the Checklist Report, SDG 200940 sample RB-071001 was received at the laboratory without custody seals present on two sample bottles or on the shipping container. It was assumed by the Environmental Standards data reviewer that the shipping container was sealed prior to delivery and the integrity of the sample was not comprised during transport. Qualification of data was not warranted due to this issue.
3. The laboratory did not perform MS/MSD analyses in association with SDG 200940 sample RB-071001 due to insufficient sample volume. The laboratory did perform an LCS/LCSD analyses associated with this sample. There was no impact on data usability due to the absence of an MS/MSD associated with this sample because sample RB-071001 is an equipment rinsate blank sample.
4. The laboratory did not report internal standard retention times (RTs) or upper and lower limits for internal standard areas on the Internal Standard Response Summary forms (Form VIIIs) for any of the project sample or QC sample analyses. The Environmental Standards data reviewer was not able to evaluate the internal standard RTs for method compliance. The Environmental Standards data reviewer was able to evaluate the internal standard areas by calculating the upper and lower limits. SW-846 Method 8270C (Section 7.4.6) states that the RTs of the internal standards in the CCV must be within 30 seconds of those from the mid-level standard in the most recent initial calibration. Qualification of data was not warranted due to this issue.
5. The result for bis(2-ethylhexyl)phthalate in SDG 200929_^aH ltrAPB-SD-4"010-0000-01 was reported from a three-fold dilutionj|u£Je-a^ffigirievel of this compound in the original analysis.
w:\battelle\duxbury rl dv\yl031544\fmal\reportl.doc
ENVIRONMENTAL STANDARDS

-page 4
6. The percent relative standard deviation (%RSD) for relative response factors (RRFs) for 2,4-dinitrophenol, pentachlorophenol, phenol, carbazole, and/or di-n-butylphthalate in various initial calibrations associated with samples in SDGs 200929 and 900940 exceeded 15%. SW-846 Method 8270C (Section 7.3.7.1) requires the laboratory to re-calibrate the instrument if the %RSD for any compound exceeds 15% unless the overall mean %RSD for all compounds in the initial calibration is less than 15%. The laboratory should also generate a linear or non-linear calibration curve for the individual compounds that exceeded the %RSD criteria in the initial calibration. The data packages for SDGs 200929 and 900940 did not contain information to suggest that the laboratory generated linear or nonlinear calibration curves for 2,4-dinitrophenol, pentachlorophenol, phenol, carbazole, and di-n-butylphthalate. The qualification of project samples associated with the noncompliant %RSDs is addressed in the Organic Data Qualifiers section.
(J 7. The MS/MSD concentrations, spike amounts, and background concentrations presented on
the Quality Control Results form for SDG 200929 were not corrected^bfory weight, sample extract weight, or extraction field volume; consequentlyf'the Environmental Standards data reviewer could not recalculate several of theperCent recoveries (those with positive results reported in the background QC sarnple^'for the MS/MSD samples based solely on the information provided on the sujnaiary form. The Environmental Standards data reviewer was able to recalculateJhe^MS/MSD recoveries presented on the Quality Control Results form using information provided on the Sample Preparation Batch Worksheet and the percept^trioisture summary forms. Qualification of data was not warranted due to this isstie.
With respect to data usability, the principal areas of concern include a low LCS recovery, high continuing calibration %Ds, low internal standard area counts, high and low MS/MSD recoveries, high initial calibration %RSD, very low percent solids results, and quantitation of results below the project-required reporting limits. Based on the Tier II review of the data provided, the following organic data qualifiers are offered. The following data usability issues represent an interpretation of the QC results obtained for the project samples. Quite often, data qualifications address issues relating to sample matrix problems. Similarly, the data validation guidelines routinely specify areas of the data that require qualification, yet the methods used for analysis may not require corrective action by the laboratory. Accordingly, the following data usability issues should not be construed as an indication of laboratory performance.
G>
w:\battelle\duxbury rl dv\yl031544\final\reportl.doc
ENVIRONMENTAL STANDARDS
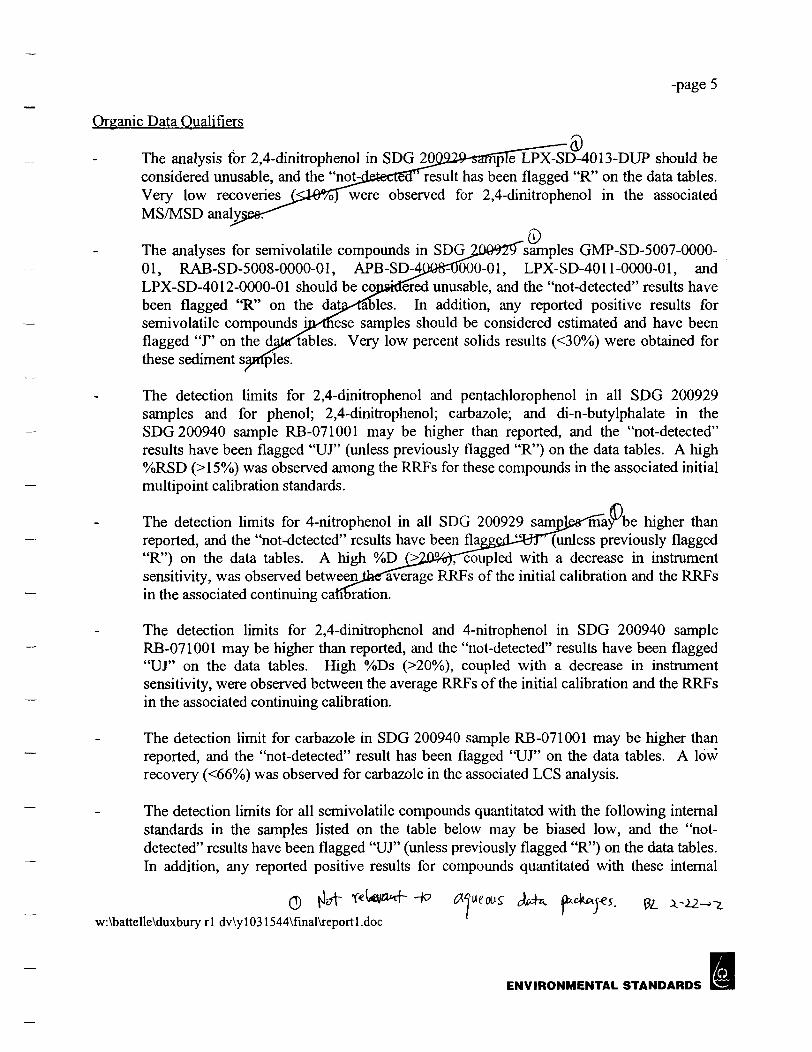
-page 5
Organic Data Qualifiers
•5)The analysis for 2,4-dinitrophenol in SDG2p^92^arnple LPX-SD-4013-DUP should be considered unusable, and the "not^letecte^result has been flagged "R" on the data tables. Very low recoveries J<3W7o)vsere observed for 2,4-dinitrophenol in the associated MS/MSD analyg
The analyses for semivolatile compounds in SDG2jOQ929~ samples GMP-SD-5007-000001, RAB-SD-5008-0000-01, APB-SD^Q08=05oO-01, LPX-SD-4011-0000-01, and LPX-SD-4012-0000-01 should be considered unusable, and the "not-detected" results have been flagged "R" on the data^taoles. In addition, any reported positive results for semivolatile compounds ijHnese samples should be considered estimated and have been flagged "J" on the djjla'tables. Very low percent solids results (<30%) were obtained for these sediment samples.
The detection limits for 2,4-dinitrophenol and pentachlorophenol in all SDG 200929 samples and for phenol; 2,4-dinitrophenol; carbazole; and di-n-butylphalate in the SDG 200940 sample RB-071001 may be higher than reported, and the "not-detected" results have been flagged "UJ" (unless previously flagged "R") on the data tables. A high %RSD (>15%) was observed among the RRFs for these compounds in the associated initial multipoint calibration standards.
The detection limits for 4-nitrophenol in all SDG 200929 sarml^maybe higher than reported, and the "not-detected" results have been flagged-^t^lunless previously flagged "R") on the data tables. A high %D^>20%)r^ou]pled with a decrease in instrument sensitivity, was observed betweejjJhcTaverage RRFs of the initial calibration and the RRFs in the associated continuing calibration.
The detection limits for 2,4-dinitrophenol and 4-nitrophenol in SDG 200940 sample RB-071001 may be higher than reported, and the "not-detected" results have been flagged "UJ" on the data tables. High %Ds (>20%), coupled with a decrease in instrument sensitivity, were observed between the average RRFs of the initial calibration and the RRFs in the associated continuing calibration.
The detection limit for carbazole in SDG 200940 sample RB-071001 may be higher than reported, and the "not-detected" result has been flagged "UJ" on the data tables. A low recovery (<66%) was observed for carbazole in the associated LCS analysis.
The detection limits for all semivolatile compounds quantitated with the following internal standards in the samples listed on the table below may be biased low, and the "notdetected" results have been flagged "UJ' (unless previously flagged "R") on the data tables. In addition, any reported positive results for compounds quantitated with these internal
HO <?
w:\battelle\duxburyrl dv\yl031544\final\reportl.doc
ENVIRONMENTAL STANDARDS

-page 6
standards should be considered estimated and have been flagged "J" on the data tables. Low area counts (<50% of the area of the internal standard in the associated continuing calibration standard) were observed for the associated internal standards in the semivolatile analyses of the following samples.
Samples With Biased Quantitation Limits ("UP7) Internal Standard(s) SPG and Estimated Positive Results ("J")
perylene-d,2 200929 APB-SD-4008-0000-01 and APB-SD-4009-0000-01
phenanthrene-d10,chrysene-d,2, and
perylene-d12
200929 APB-SD-4010-0000-01,LPX-SD-4012-0000-01, andLPX-SD-4013-DUP
chrysene-d12 andperylene-d12
200929 APB-SD-4010-0000-01 (3x Dilution), LPX-SD-4011-0000-01, and LPX-SD-4013-0000-01
The reported positive results for carbazole, butyl benzyl phthalate, and bis(2-ethylhexyl)phthalate in SDG 200929 sample LPX-SD-4013-DUP should be considered estimated and have been flagged "J" on the data tables. High recoveries were observed for these compounds in the associated MS/MSD analyses.
Based on the project-specific reporting requirements, all reported positive results with concentrations between the laboratory method detection limit and the project reporting limit should be considered estimated and have been flagged "J" on the data tables.
One field duplicate pair (SDG 200929 sample LPX-SD-4013-0000-01 and its field duplicate, sample LPX-SD-4013-DUP) was submitted to the laboratory with this data set. Acceptable precision and sample representativeness were demonstrated by all reported positive results in these field QC samples.
Complete support documentation for this organic QA review is presented in Section 3 of this report. The cover sheet for this section is a checklist of all QA procedures required by the methods and examined in this data review.
B. Inorganic and Wet Chemistry EData
The inorganicxarialyses of 13 soil samples and 23 sediment samples (including QC samples) were perforrnpEHSy Applied Marine Sciences, Inc. (AMS) of League City, Texas. The samples were analysed for total organic carbon (TOC) by SW-846 Method 9060 and for grain size by ASTM
w:\battelle\duxbury rl dv\yl031544\final\reportl.doc
ENVIRONMENTAL STANDARDS

-page 7
Method D422. These analyses are specified on Table 1. The laboratory organized the samples into one SDG (SDG 2001-03-09).
The findings in this report are based upon a Tier II review of sample holding times, condition>6f samples upon laboratory receipt, blank analysis results, laboratory duplicate precision, instruaient sensitivity, method detection limits (MDLs), calibrations, sample preparation, and the quanjiiation of positive results.
Overall, the inorganic data quality appears to be good The data reviewer has edited tKe laboratory-reported data and QC forms based on the deficiencies and comments listed in/mis QC review. Contractual and reporting requirements were met for this data set, with the exception of the items identified in the following sections of this QA review; it should be emphasizea that these items do not necessarily impact data usability. Based upon a Tier II review crflne data provided, the inorganic data qualifiers associated with the samples that underwent dafa validation are presented in the subsequent Inorganic and Wet Chemistry Data Qualifiers Sepfion. These qualifiers should not be applied to any inorganic results that did not undergo data/alidation. Data usability issues represent an interpretation of the QC results obtained for the/project samples. Quite often, data qualifications address issues relating to sample matrix jproblems. Similarly, the validation guidelines specify areas of the data that require qualification, yet the methods used for analysis do not require any corrective action by the laboratoryVAccordingly, the data usability issues that follow should not necessarily be construed as an indication of laboratory performance.
Correctable Deficiency
The laboratory incorrectly identified sample GMP-SD-5007-0000-01 as GMD-SD5007-0000-01" on the TOC £sult summary form.
Noncorrectable Deficiency
The samples received on 7/18/01 had a cooler temperature of 9°C. According to the QAPP (Worksheet #22a), the cooler temperature should be less than 6°C. The laboratory did not note the ej^vated temperature in the Case Narrative. Data were not qualified due to this deficienjz because the cooler temperature was less than 10°C.
w:\battelle\duxbury rl dv\yl031544\final\reportl.doc
ENVIRONMENTAL STANDARDS

-page 8
Comments •0?
1. The laboratory noted on the Sample Receipt Checklist form and in the Case^Narrative that the container for sample WRL-SD-4005-0000-01 was broken and the^-sample was possibly contaminated with cooler water. The laboratory contacted Ms. Detrdre Dahlen of Battelle who arranged to have the sample re-sent with the next shipmj
2. Sample LPX-SD-071601-A was received with the shipment of samples on 7/24/01 but was, not listed on the Chain-of-Custody Record. The totforatory contacted Ms. Deirdre Dahk of Battelle who instructed the laboratory to add the sample to the Chain-of-Custody Record and analyze the sample for Total Organic Carbon and Grain Size.
With respect to data usability, the principal areas of concern are high laboratory and field duplicate relative percent differences (RPDs). Based on a rigorous review of the data provided, the following inorganic and wet chemistry data qualifiers are offered. The followintf data usability issues represent an interpretation of the QC results obtained for the project samples. Quite often, data qualifications address issues relating to sample matrix problems. Sumlarly, the data validation guidelines routinely specify areas of the data that require qualificatiwi, yet the methods used for analysis may not require corrective action by the laboratory. Accordingly, the following data usability issues should not be construed as an indication of laboratory performance.
Inorganic and Wet Chemistry Data Qualifiers
The reported positive results for the followi grain size fractions in the samples listed below should be considered estimated and been flagged "J" on the data tables. High RPDs (>25%) were observed for these tions in the associated laboratory duplicate analyses.
Grain Size Fraction SPG / Samples With Estimated Positive Results ("J")
fine sand 2001-03-J09 GMP-SD-5002-0000-01, RWR-SD-5003-0000-01, RWR-SD-5004-0000-01, RAB-SD-5004-0000-01, CMS-SD-4003-0000-01,CMS-SD-4006-0000-01, CMS-SD-4007-0000-01, LPX-SD-4001 -0000-01, LPX-SD-4002-0000-01, LPX-SD-4004-0000-01,
CMS-FP-4005-0000-01,CMS-DU-072001, WRL-SD-4005-0000-01, and LPX-SD-071601-A
2001-03-09 CMS-FP-4005-0000-01, CMS-DU-072001, WRL-SD-4005-0000-01, and LPX-SD-071601-A
w:\battelle\duxbury rl dv\y 1031544\final\reportl .doc
ENVIRONMENTAL STANDARDS

-page 9
One field duplicate pair (SDG 2001-03-09 sample CMS-FP-4001-0000-01 and its field duplicate, sample CMS-DU-072001) was submitted to the laboratory with this daj, Acceptable precision and sample representativeness were demonstratedjjy-tftereported positive results in these field QC samples with the following exception. The reported positive results for the fine sand and clay grain size fraction^Hfthese samples should be considered estimated and have been flagged "J" on thexiata tables. High RPDs (>50%) were observed for these fractions in the associated fiera duplicate analyses.
Complete support documentation for this inefganic QA review is presented in Section 4 of this report. The cover sheet for this section jyachecklist of all QA procedures required by the methods and examined in this data review.
w:\battelle\duxbury rl dv\yl031544\final\reportl.doc
ENVIRONMENTAL STANDARDS

-page 10
C. Conclusions
Overall, the data quality is satisfactory. Based on this QA review, several organic results were qualified as unusable due to very low MS/MSD recoveries and very low percent solids results. In addition, several organic results were qualified as estimated due to a low LCS recovery, low internal standard area counts, high MS/MSD recoveries, calibration issues, and quantitation of positive results below the project-required reporting limits. A few inorganic results were qualified as estimated due to high laboratory and field duplicate RPDs. Overall, the data are acceptable for use, provided the data user understands the limitations and qualifications stated in this QA review. The Laboratory Case Narratives and Chain-of-Custody Records are presented in Sections 5 and 6, respectively.
Report prepared by: Report reviewed by:
Thomas H. Weinmann Kyle R. Clay Quality Assurance Chemist Senior Quality Assurance Chemist I/
Project Manger
Report reviewed and approved by:
David R. Blye, CEAC Quality Assurance Specialist/ Principal
ENVIRONMENTAL STANDARDS, INC. Date: 1140 Valley Forge Road P.O. Box 810 Valley Forge, PA 19482-0810
(610) 935-5577
w:\battelle\duxbury r 1 dv\y 1031544\final\report 1 .doc
ENVIRONMENTAL STANDARDS

Section 1 Quality Assurance Review
A. Organic Data
The organic analyses of 19 soil samples (including QC samples, two dilutions, and a reanalysis), one sediment sample, and 17 aqueous samples (including QC samples) were performed by Severn Trent Laboratories (STL) of Baltimore, Maryland. The samples were collectively analyzed for volatile organic compounds by SW-846 Method 8260B and for semivolatile organic compounds (phenols and phthalates) by SW-846 Method 8270C. These analyses are specified on Table 1. The laboratory organized the samples into five sample delivery groups (SDGs 200954, 200959, 200964, 200967, and 200972).
The findings in this report are based upon a rigorous review of holding times, condition of samples upon laboratory receipt, blank analysis results, laboratory control sample (LCS)/laboratory control sample duplicate (LCSD) recoveries and precision, matrix spike (MS)/matrix spike duplicate (MSD) recoveries and precision, surrogate recoveries, internal standard response, instrument sensitivity, field duplicate precision, analytical sequence, gas chromatography/mass spectroscopy (GC/MS) bromofiuorobenzene (BFB) and decafluorotriphenylphosphine (DFTPP) instrument performance checks, calibrations, overall system performance, and quantitation of positive results.
Overall, the organic data quality appears to be good. The data reviewer has edited the laboratory-reported data and QC forms based on the deficiencies and comments listed in this QC review. Contractual and reporting requirements were met for this data set, with the exception of the items identified in the following sections of this QA review; it should be emphasized that these items do not necessarily impact data usability. Based upon a Tier II review of the data provided, the organic data qualifiers associated with the samples that underwent data validation are presented in the subsequent Organic Data Qualifiers section. These qualifiers should not be applied to any organic results that did not undergo data validation. Data usability issues represent an interpretation of the QC results obtained for the project samples. Quite often, data qualifications address issues relating to sample matrix problems. Similarly, the validation guidelines specify areas of the data that require qualification, yet the methods used for analysis do not require any corrective action by the laboratory. Accordingly, the data usability issues that follow should not necessarily be construed as an indication of laboratory performance.
Noncorrectable Deficiencies
1. High percent differences (>20%) were observed for the semivolatile_j^nTp"6"unds in the initial and/or continuing calibration verifications (ICV/CCVs^JistecTbelow. According to the QAPP (Worksheet #21), the laboratory should reanatyzethe Check Standard Solution if any percent difference is greater than 20%-JEfetflaboratory did not reanalyze the below-listed Check Standard Solutions; the irppacTon data usability (if any) due to high percent difference is addressed in the suhstfq'uent Organic Data Qualifiers section.
Q
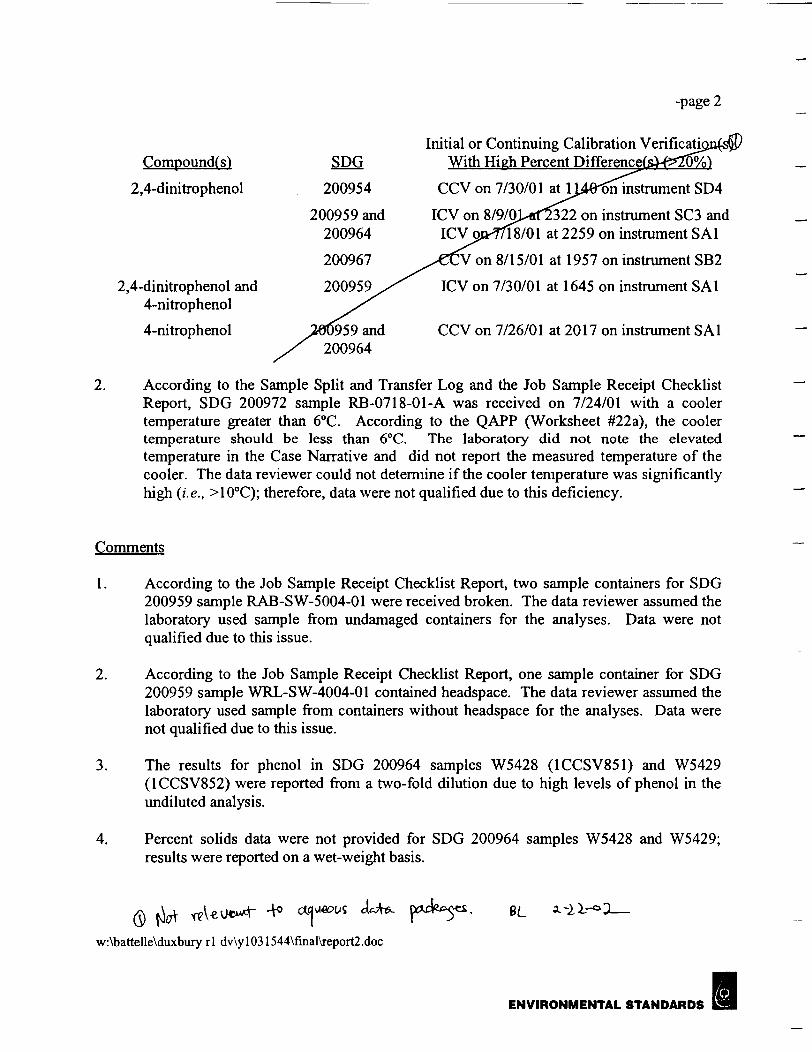
-page 2
Initial or Continuing Calibration VerificatioXs§P Compound(s) SPG With High Percent DifferencefeVft*20%)
2,4-dinitrophenol 200954 CCVon7/30/01 at i; instrument SD4
200959 and ICVon 8/9/0 322 on instrument SC3 and 200964 ICVa 18/01 at 2259 on instrument SA1
200967 on 8/15/01 at 1957 on instrument SB2
2,4-dinitrophenol and 200959 ICV on 7/30/01 at 1645 on instrument SA1 4-nitrophenol /
4-nitrophenol and CCV on 7/26/01 at 2017 on instrument SA1 200964
2. According to the Sample Split and Transfer Log and the Job Sample Receipt Checklist Report, SDG 200972 sample RB-0718-01-A was received on 7/24/01 with a cooler temperature greater than 6°C. According to the QAPP (Worksheet #22a), the cooler temperature should be less than 6°C. The laboratory did not note the elevated temperature in the Case Narrative and did not report the measured temperature of the cooler. The data reviewer could not determine if the cooler temperature was significantly high (i.e., >10°C); therefore, data were not qualified due to this deficiency.
Comments
1. According to the Job Sample Receipt Checklist Report, two sample containers for SDG 200959 sample RAB-SW-5004-01 were received broken. The data reviewer assumed the laboratory used sample from undamaged containers for the analyses. Data were not qualified due to this issue.
2. According to the Job Sample Receipt Checklist Report, one sample container for SDG 200959 sample WRL-SW-4004-01 contained headspace. The data reviewer assumed the laboratory used sample from containers without headspace for the analyses. Data were not qualified due to mis issue.
3. The results for phenol in SDG 200964 samples W5428 (1CCSV851) and W5429 (1CCSV852) were reported from a two-fold dilution due to high levels of phenol in the undiluted analysis.
4. Percent solids data were not provided for SDG 200964 samples W5428 and W5429; results were reported on a wet-weight basis.
w:\battelle\duxbury rl dv\yl031544\final\report2.doc
ENVIRONMENTAL STANDARDS

-page 3
5. In SDG 200967, sample CMS-DUP-072001jsias^reSnaiyzed due to low internal standard area counts; the reanalysis yielded^siimtSfresults.
6. In SDG 200972, the laboratory did not include a Method Blank Summary Form (Form IV) or Internal Standard Response Summary form (Form VIII) in the data package provided to Environmental Standards. Upon Environmental Standards' request, the laboratory stated that the forms "cannot be regenerated at this point" (see Project Correspondence [Section 6]). The data reviewer used the associated raw data to evaluate the method blank associations and internal standard responses.
7. In SDG 200954, the laboratory did not include the result for sample TRIP BLANK in the EDD provided to Environmental Standards. Upon Environmental Standards' request, the laboratory provided these data.
8. The laboratory did not report internal standard retention times (RTs) on the Internal Standard Response Summary forms (Form VIIIs) for any of the project sample or QC sample analyses. SW-846 Methods 8260B and 8270C (Sections 7.4.6) stipulate that the RTs of the internal standards in the CCV must be within 30 seconds of those from the mid-level standard in the most recent initial calibration. The data reviewer was not able to evaluate the internal standard RTs for method compliance.
9. According to the Analytical Narratives and Job Sample Receipt Checklist Reports, all samples in SDGs 200959, 200964, and 200972 were received at the laboratory without custody seals present on the sample bottles or on the shipping containers. The data reviewer assumed that the shipping containers were sealed prior to shipment and that the integrity of the samples was not compromised during transport. Qualification of data was not warranted due to this issue.
10. The percent relative standard deviation (%RSD) of the relative response factors (RRFs) exceeded 15% for bromomethane; chloroethane; bromoform; 1,1,2,2-tetrachloroethane; 1,2,3-trichloropropane; 1,3-dichlorobenzene; 1 ,4-dichlorobenzene; 1,2-dichlorobenzene; l,2-dibromo-3-chloropropane; 1,2,4-trichlorobenzene; hexachlorobutadiene; naphthalene; and 1,2,3-trichlorobenzene in the volatile organic initial calibration performed on 7/18/01 on instrument VE5 and associated with samples in SDGs 200954, 900959, and 200964. SW-846 Method 8260B (Sections 7.3.8.2 and 7.3.8.3) requires the laboratory to re-calibrate the instrument if the %RSD for any compound exceeds 15%, unless the overall mean %RSD for all compounds in the initial calibration is less than 15%. The laboratory should also generate a linear or non-linear calibration curve for the individual compounds that exceeded the %RSD criterion in the initial calibration. The data packages for SDGs 200954, 200959, and 200964 did not contain information to suggest that the laboratory had generated linear or non-linear calibration curves for these compounds. The qualification of project samples associated with the noncompliant %RSDs is addressed in the Organic Data Qualifiers section.
w:\battelle\duxbury rl dv\yl031544\final\report2.doc
ENVIRONMENTAL STANDARDS

-page 4
11. The %RSD of the RRFs exceeded 15% for phenol; 2,4-dinitrophenol; carbazole; di-n-butyl phthalate; butylbenzylphthalate; bis(2-ethylhexyl)phthalate; di-n-octyl phthalate; and/or pentachlorophenol in various semivolatile organic initial calibrations associated with samples in all SDGs. SW-846 Method 8270C (Section 7.3.7.1) requires the laboratory to re-calibrate the instrument if the %RSD for any compound exceeds 15%, unless the overall mean %RSD for all compounds in the initial calibration is less than 15%. The laboratory should also generate a linear or non-linear calibration curve for the individual compounds that exceeded the %RSD criteria in the initial calibration. The data packages did not contain information to suggest that the laboratory had generated linear or non-linear calibration curves for these compounds. The qualification of project samples associated with the noncompliant %RSDs is addressed in the Organic Data Qualifiers section.
With respect to data usability, the principal areas of concern include blank contamination, low MS/MSD and LCS recoveries, high initial calibration %RSDs, high continuing calibration percent differences, low surrogate recoveries, low internal standard area counts, and quantitation of results below the project-required reporting limit. Based on a Tier II review of the data provided, the following organic data qualifiers are offered. . .The following data usability issues represent an interpretation of the QC results obtained for the project samples. Quite often, data qualifications address issues relating to sample matrix problems. Similarly, the data validation guidelines routinely specify areas of the data that require qualification, yet the methods used for analysis may not require corrective action by the laboratory. Accordingly, the following data usability issues should not be construed as an indication of laboratory performance.
Organic Data Qualifiers
Due to the trace-level presence of bis(2-ethylhexyl)phthalate in the associated method blank, the reported positive results for bis(2-ethylhexyl)phthalate in SDG 200964 samples W5428 (1CCSV851) and W5429 (1CCSV852) should be considered "not-detected" and have been flagged "U" on the data tables. It should be noted that sample weights were taken into consideration when evaluating blank contamination.
The analysis for 2,4-dinitrophenol in SDG 200967 sample RWR-FP-5002-0000-01 should be considered unusable, and the "not-detected" result has been tables. A very low recovery (<10%) was observed for^^adinra*5Kenol in the associated MSD analysis.
The analyses for 2,4-dinitrophenol in the samples listed below should be considered unusable, and the "not-detected" results have been flagged "R" on the data tables. Very low recoveries (<10%) were observed for this compound in the associated LCS analyses.
w:\battelle\duxbury rl dv\yl031544\final\report2.doc
ENVIRONMENTAL STANDARDS

-page 5
Compound SPG Sampled With Unusable Analyses ("R")
2,4-dinitrophenol 200959 RWR-SW-5001-01, RWR-SW-5002-01, RAB-SW-5004-01, WRL-SW-4004-01,
WRL-DU-071701-A(DUP), and WRL-SW-4005-01
200964 W5427 (0026491)
The quantitation limits for the volatile compounds bromomethane; chloroethane; 1,2-dibromo-3-chloropropane; 1,1,2,2-tetrachloroethene; bromoform; 1,2,3-trichloropropane; 1,3-dichlorobenzene; 1,4-dichlorobenzene; 1,2-dichlorobenzene; 1,2,4-trichlorobenzene; naphthalene; hexachlorobutadiene; and 1,2,3-trichlorobenzene in all SDG 200954 and SDG 200959 samples and in SDG 200964 sample W5431 (PX326) may be higher than reported, and the "not-detected" results have been flagged "UJ" on the data tables. In addition, any reported positive results for these compounds in the samples cited above should be considered estimated and have been flagged "J" on the data tables. High %RSDs (>15%) were observed among the RRFs for the aforementioned compounds in the associated initial multipoint calibration standards.
The quantitation limits for the semivolatile compounds in the samples listed below may be higher than reported, and the "not-detected" results have been flagged "UJ" (unless previously flagged "R") on these data tables. In addition, any reported positive results for these semivolatile compounds in the samples listed below should be considered estimated and have been flagged "J" (unless previously flagged "U") on the data tables. High %RSDs (>15%) were observed among the RRFs for these compounds in the associated initial multipoint calibration standards.
Compound^
2,4-dinitrophenol
pentachlorophenol
SDG
200954
200959
200964
200972
200959
Sample(s) With Qualified Quantitation Limits ("UJ") or Estimated Positive Results CT")
All Samples
All Samples
All Samples
All Samples
WRL-SW-4004-01
w:\battelle\duxbury rl dv\yl031544\fmal\report2.doc
ENVIRONMENTAL STANDARDS

-page 6
Compoundfst SPGSample(s) With Qualified Quantitation Limits ("UJ")
or Estimated Positive Results m
carbazole and di-«-butylphthalate 200967 All Samples
phenol, carbazole,di-«-burylphthalate,
butylbenzylphthalate, bis(2-ethylhexyl)phthalate, and
di-n-octylphthalate
200959 200964
LPX-SD-071601-A(DUP) W5478 (1CCSV851) and W5429 (1CCSV852)
The quantitation limits for the following volatile compounds in the samples listed below may be higher than reported, and the "not-detected" results have been flagged "UJ" on the data tables. In addition, any reported positive results for these volatile compounds in the samples listed below should be considered estimated and have been flagged "J" on the data tables. High percent differences (>20%), coupled with decreases in instrument sensitivity, were observed for these compounds in the associated continuing calibration standards.
Sample(s) With Qualified Quantitation Limits ("UP') Compound(s) SPG or Estimated Positive Results ("J")
tetrachloroethene 200954 All samples
200959 All samples
200964 W5431
bromomethane 200954 All samples
200964 W5431 (PX326)
200959 All samples
methylene chloride and 200959 All samples hexachlorobutadiene
naphthalene 200964 W5431 (PX326)
The quantitation limits for the semivolatile compounds in the samples listed below may be higher than reported, and the "not-detected" results have been flagged "UJ" (unless previously flagged "R") on the data tables. In addition, any reported positive results for these compounds in the samples listed below should be considered estimated and have been flagged "J" on the data tables. High percent differences (>20%), coupled with decreases in instrument sensitivity, were observed for these compounds in the associated initial and/or continuing calibration standards.
w:\battelle\duxbury rl dv\yl031544\final\report2.doc
ENVIRONMENTAL STANDARDS

-page 7
Compound(s) SPGSample(s) With Qualified Quantitation Limits ("UJ")
or Estimated Positive Results m
2,4-dinitrophenol 200954 All samples
200959 LPX-SD-071601-A(DUP)
200964 All samples
200967 CMS-FP-4003-0000-01, LPX-FP-4007-0000-01, LPX-FP-4006-0000-01.RWR-FP-5002-0000-01,
LPX-FP-4004-0000-01, RWR-FP-5 004-0000-01, and CMS-FP-4001-0000-01
4-nitrophenol 200959 RWR-SW-5001-01, RWR-SW-5002-01, RAB-SW-5004-01, WRL-DU-071701-A(DUP), and
WRL-SW-4005-01
200964 W5427 (0026491)
2,4-dinitrophenol and 4-nitrophenol
200959 WRL-SW-4004-01
The quantitation limits for the volatile compounds SDG 200959 sample RAB-SW-5004-01 may be higher than reported, and the "not-detected" results have been flagged "UJ" on the data tables. Low recoveries (< acceptance limits) were observed for these compounds in the associated MS/MSD analyses.
Compounds
benzene; 1,2-dichloroethane; 1,2-dichloropropane; dibromomethane; bromodichloromethane; cw-l,3-dichloropropene; toluene; /ran.s-l,3-dichloropropene; 1,1,2-trichloroethane; tetrachloroethene;
1,3-dichloropropane; dibromochloromethane; 1,2-dibromomethane; chlorobenzene; 1,1,1,2-tetrachloroethane; m&p-xylenes; o-xylene; styrene; bromoform; bromobenzene;
1,1,2,2-tetrachloroethane; 1,2,3-trichloropropane; 1,3,5-trimethylbenzene; 1,2,4-trimethylbenzene; .sec-butylbenzene; l,3-dichlorobenzene;/MSOpropyltoluene; 1,4-dichlorobenzene; n-burylbenzene; 1,2-dichlorobenzene; l,2-dibromo-3-chloropropane; 1,2,4-trichlorobenzene; hexachlorobutadiene;
naphthalene; and 1,2,3-trichlorobenzene
The quantitation limits for the volatile compounds in the samples listed below may be higher than reported, and the "not-detected" results have been flagged "UJ" on the data tables. In addition, any reported positive results for these compounds in the samples listed below should be considered estimated and have been flagged "J" on the data tables. Low
w:\battelle\duxbury rl dv\yl031544\final\report2.doc
ENVIRONMENTAL STANDARDS

-page 8
recoveries (< acceptance limit) were observed for these compounds in the associated LCS analyses.
Compounds SPG
tetrachloroethene and1,2,3-trichloropropane
200954
bromodichloromethane and1,2-dichlorobenzene
200954
bromomethane; 1,2-dichloroethane;bromodichloromethane; tetrachloroethene;
1,3-dichloropropane; dibromochloromethane; 1,1,1,2-tetrachloroethane;
m&p-xylenes; styrene; bromobenzene; 1,2,3-trichloropropane;
1,2,4-trimethylbenzene; sec-butylbenzene; 1,3-dichlorobenzene;
1,2-dichlorobenzene; and hexachlorobutadiene
200959
bromodichloromethane; tetrachloroethene;bromobenzene; 1,2,3-trichloropropane;
1,2-dichlorobenzene; and hexachlorobutadiene
200964
Sample(s) With Qualified Quantitation Limits ("UJ") or Estimated Positive Results ("J")
WRC-SW-4002-01, WRC-SW-4003-01, WRC-SW-4004-01, WRC-SW-4001-01,
and TRIP BLANK
WRC-SW-4003-01, WRC-SW-4004-01, and WRC-SW-4001-01
All samples
W5431 (PX326)
The quantitation limits for the semivolatile compounds in the samples listed below may be higher than reported, and the "not-detected" results have been flagged "UJ" on the data tables. In addition, any reported positive results for these compounds in the samples listed below should be considered estimated and have been flagged "J" on the data tables. Low recoveries (< acceptance limits) were observed for these compounds in the associated LCS or LCSD analysis.
w:\battelle\duxbury rl dv\yl031544\final\report2.doc
ENVIRONMENTAL STANDARDS

-page 9
Compounds SPGSample(s) With Qualified Quantitation Limits ("UP')
or Estimated Positive Results ("J")
2-nitrophenol and pentachlorophenol 200959 RWR-SW-5001-01, RWR-SW-5 002-01, RAB-SW-5004-01, WRL-SW-4004-01,
WRL-DU-071701-A(DUP), and WRL-SW-4005-01
200964 W5427 (0026491)
2,4,5-trichlorophenol; 2-nitrophenol; pentachlorophenol; and
200972 RB-0718-01-A
butyl benzyl phthalate
The quantitation limits for the semivolatile acid compounds in SPG2QjQ96jr~sample CMS-FP-4003-0000-01 may be higher than reported, and the "no>detected" results have been flagged "UJ" on the data tables. Low recoveriesJ^-acCe^tance limits) were observed for three semivolatile acid surrogate compounds4rrfhls sample analysis.
The quantitation limits for all semivolatile compounds quantitated with the internal standards in the samples listed below may be biased low, and the "not-detected" results have been flagged "UJ" on the data tables. In addition, any reported positive results for compounds quantitated with these internal standards should be considered estimated and have been flagged "J" on the data tables. Low area counts (<50% of the area of the internal standard in the associated continuing calibration standard) were obtained for the associated internal standards in the semivolatile analyses of these samples.
Sarnple(s) With Qualified Quantitation Limits ("UJ") Internal Standard^s) SPG or Estimated Positive Results ("J")
chrysene-d12 and 200967 CMS-FP-4002-0000-01,RWR-FP-5001-0000-01, peiylene-d,2 RWR-FP-5003-0000-01, and CMS-FP-4005-0000-01
phenanthrene-d10, 200967 CMS-PUP-072001 and CMS-PUP-072001RE chrysene-d12, and
perylene-dl2
perylene-d12 200967 RWR-FP-5004-0000-01
w:\battelle\duxbury rl dv\yl031544\final\report2.doc
ENVIRONMENTAL STANDARDS

-page 10
Two field duplicate pairs [SDG 200959 sample WRL-SW-4004-01 and its field duplicate, sample WRL-DU-071701-A (DUP), and SDG 200967 sample CMS-FP-4001-0000-01 and its field duplicate, sample CMS-DUP-072001] were submitted to the laboratory with this data set. Acceptable precision and sample representativeness were demonstrated by all reported positive results in these field QC samples.
Based on the project-specific reporting requirements, all reported positive results with concentrations between the laboratory method detection limit and the project reporting limit should be considered estimated and have been flagged "J" on the data tables.
Complete support documentation for this organic QA review is presented in Section 3 of this report. The cover sheet for this section is a checklist of all QA procedures required by the methods and examined in this data review.
w:\battelle\duxbury rl dv\yl031544\final\report2.doc
ENVIRONMENTAL STANDARDS

-page 11
B. Conclusions
Overall, the data quality is good. Based on this QA review, a few semivolatile positive results were qualified as "not-detected" due to blank contamination and a few semivolatile results were qualified as unusable due to very low MS/MSD and LCS recoveries. In addition, several volatile and semivolatile results were qualified as estimated due to calibration issues, low MS/MSD and LCS recoveries, low surrogate recoveries, low internal standard area counts, and quantitation of results below the project-required reporting limit. Overall, the data are acceptable for use, provided the data user understands the limitations and qualifications stated in this QA review. The Laboratory Case Narratives, Chain-of-Custody Records, and Project Correspondence are presented in Sections 4, 5, and 6, respectively.
Report prepared by: Report reviewed by:
Thomas H. Weinmann Stephen T. Zeiner, #EAC, CPC Quality Assurance Chemist Senior Quality Assurance Chemist III
Report reviewed and approved by: Report reviewed and approved by:
. Clay David R. Blye, CEAC Senior Quality Assurance Chemist I/ Quality Assurance Specialist/ Project Manager Principal
ENVIRONMENTAL STANDARDS, INC. Date: 1140 Valley Forge Road P.O. Box 810 Valley Forge, PA 19482-0810
(610)935-5577
w:\battelle\duxbury rl dv\yl031544\final\report2.doc
ENVIRONMENTAL STANDARDS

Section 1 Quality Assurance Review
A. Organic Data
The organic analyses of 15 aqueous samples (including QC samples), 11 sediment samples (including QC samples), and 23 tissue samples (including QC samples) were performed by Battelle Laboratories of Duxbury, Massachusetts. The samples were collectively analyzed for polyaromatic hydrocarbon (PAH) compounds by Battelle Standard Operating Procedure (SOP) 5-157 and for pesticide and PCB compounds by Battelle SOP 5-128. These analyses are specified on Table 1. The laboratory organized the samples into the three sample delivery groups (SDGs 01-350, 01-364, and 01-373).
The findings in this report are based upon a rigorous review of holding times, condition of samples upon laboratory receipt, blank analysis results, laboratory control sample (LCS) recoveries, matrix spike (MS)/matrix spike duplicate (MSD) recoveries and precision, surrogate recoveries, internal standard response, instrument sensitivity, analytical sequence, gas chromatography/mass spectroscopy (GC/MS) decafluorotriphenylphosphine (DFTPP) instrument performance checks, calibrations, overall system performance, laboratory duplicate precision, field duplicate precision, and quantitation of positive results.
Overall, the organic data quality appears to be good. The data reviewer has edited the QC forms based on the deficiencies and comments listed in this QC review. Analytical and reporting requirements specified in the QAPP were met for this data set, with the exception of the items identified in the following sections of this QA review; it should be emphasized that these items do not necessarily impact data usability. Based upon a Tier II review of the data provided, the organic data qualifiers associated with the samples mat underwent data validation are presented in the subsequent Organic Data Qualifiers section. These qualifiers should not be applied to any organic results that did not undergo data validation. Data usability issues represent an interpretation of the QC results obtained for the project samples. Quite often, data qualifications address issues relating to sample matrix problems. Similarly, the validation guidelines specify areas of the data that require qualification, yet the methods used for analysis do not require any corrective action by the laboratory. Accordingly, the data usability issues that follow should not necessarily be construed as an indication of laboratory performance.
Correctable Deficiencies
1. In the PAH fraction, the laboratory reported an extraction date of "19-Jul-Ol" for SDG 01-350 sample RB-071001 on the Field Sample Data summary form. The correct extraction date for this sample is 7/17/01.
2. In the PAH fraction, the laboratory repojteji-fl-""clHlection date of "06-Jul-Ol" for SDG 01-364 sample APB-SD-4QQ&*QQQfffiTon the Field Sample Data summary form. The correct collectionjlate-flsTthis sample is 7/9/01.

-page 2
Noncorrectable Deficiencies
1. In SDG 01-350, high levels of naphthalene (greater than the quantitation limit) were observed in the method blank samples and naphthalene results in the associated project samples were less than 10-times the blank level. According to the QAPP (Worksheet #24a), the laboratory should have reextracted and/or reanalyzed the samples. The laboratory did not reextract and/or reanalyze the samples. The impact on data usability due to the blank contamination is addressed in the subsequent Organic Data Qualifiers section.
2. In SDG 01-350, samples 90-002 and PR582 were received at the laboratory with a cooler temperature of 22.6°C. According to the QAPP (Worksheet #22a), the cooler temperature should be less than 6°C. The impact on data usability due to the elevated temperature is addressed in the subsequent Organic Data Qualifiers section.
3. In SDG 01-350, high percent differences (%Ds) were observed for endosulfan I and endrin aldehyde in the Pest/PCB continuing calibration standards analyzed on 8/27/01 and 8/28/01. According to the QAPP (Worksheet #21), the continuing calibration %D for each compound must be <25% or the standards must be reanalyzed or the system recalibrated. The laboratory did not reanalyze the standards or recalibrate the system. The impact on data usability due to the high %Ds is addressed in the subsequent Organic Data Qualifiers section.
4. In the method detection limit (MDL) determination for PAH compounds in SDGs 01-350 and 01-364, the laboratory reported replicate concentrations less than the proposed MDL. According to the Federal Register (40 CFR, Part 136, Appendix B), the laboratory should not report an MDL value if the level of analyte is below the MDL in one or more replicates. The MDL study is not considered valid because the calculated MDL may not reflect method variance at lower analyte concentrations. The actual MDLs for PAH compounds are lower than the laboratory reporting limits; therefore, data were not qualified due to this deficiency.
5. In the method detection limit (MDL) determination for Pest/PCB compounds in SDGs 01-350 and 01-373, the laboratory reported replicate concentrations greater than 10-times the proposed MDL. According to the Federal Register (40 CFR, Part 136, Appendix B), the laboratory should not report an MDL value if the level of analyte exceeds 10-times the MDL in one or more replicates. The MDL study is not considered valid because the calculated MDL may not reflect method variance at lower analyte concentrations. The actual MDLs for Pest/PCB compounds are lower than the laboratory reporting limits; therefore, data were not qualified due to this deficiency.
\\pc-dahlen\task 22 samp\data report - water\deliverable edds post 3rd validated\report3.doc
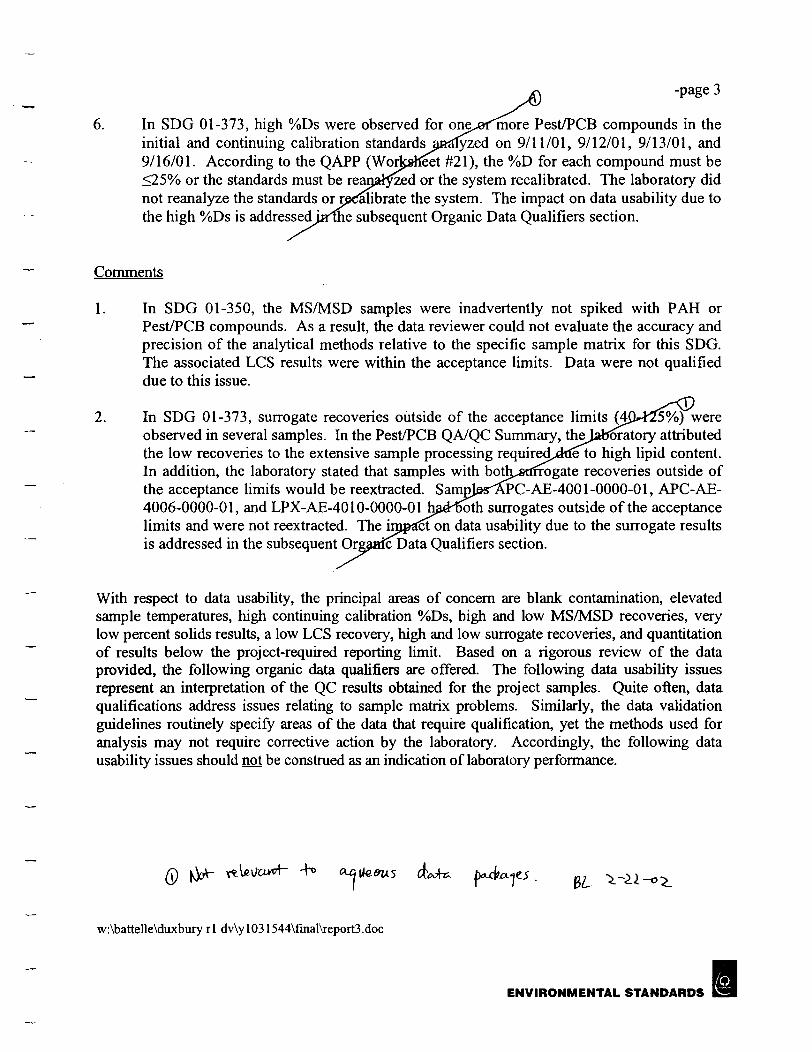
-page 3 sw
6. In SDG 01-373, high %Ds were observed for one^efrnore Pest/PCB compounds in the initial and continuing calibration standards analyzed on 9/11/01, 9/12/01, 9/13/01, and 9/16/01. According to the QAPP (Worksheet #21), the %D for each compound must be <25% or the standards must be reanalyzed or the system recalibrated. The laboratory did not reanalyze the standards or recalibrate the system. The impact on data usability due to the high %Ds is addressedjirme subsequent Organic Data Qualifiers section.
Comments
In SDG 01-350, the MS/MSD samples were inadvertently not spiked with PAH or Pest/PCB compounds. As a result, the data reviewer could not evaluate the accuracy and precision of the analytical methods relative to the specific sample matrix for this SDG. The associated LCS results were within the acceptance limits. Data were not qualified due to this issue.
2. In SDG 01-373, surrogate recoveries outside of the acceptance limits (4fWZ5%) were observed in several samples. In the Pest/PCB QA/QC Summary, thejaboratory attributed the low recoveries to the extensive sample processing required^dtleto high lipid content. In addition, the laboratory stated that samples with botij^stffrogate recoveries outside of the acceptance limits would be reextracted. SampJes^APC-AE-400 1-0000-01, APC-AE4006-0000-01, and LPX- AE-401 0-0000-01 hatPboth surrogates outside of the acceptance limits and were not reextracted. The impact on data usability due to the surrogate results is addressed in the subsequent Orgaaic Data Qualifiers section.
With respect to data usability, the principal areas of concern are blank contamination, elevated sample temperatures, high continuing calibration %Ds, high and low MS/MSD recoveries, very low percent solids results, a low LCS recovery, high and low surrogate recoveries, and quantitation of results below the project-required reporting limit. Based on a rigorous review of the data provided, the following organic data qualifiers are offered. The following data usability issues represent an interpretation of the QC results obtained for the project samples. Quite often, data qualifications address issues relating to sample matrix problems. Similarly, the data validation guidelines routinely specify areas of the data that require qualification, yet the methods used for analysis may not require corrective action by the laboratory. Accordingly, the following data usability issues should not be construed as an indication of laboratory performance.
w:\battelle\duxbury rl dv\yl031544\fmal\report3.doc
ENVIRONMENTAL STANDARDS

-page 4
Organic Data Qualifiers
Due to the trace-level presence of PAH compounds in the associated laboratory and/or field blanks, the reported positive results for PAH compounds in SDG 01-350 samples RAB-SW5004, WRC-SW-4003-01, WRC-SW-4004-01, WRC-SW-4001-01, WRC-SW-4002-02, RWR-SW-5001, RWR-SW-5002, WRL-SW-4004, WRL-DU-071701-A, and WRL-SW4005, with the exception of the results for acenaphthylene in samples WRL-SW-4004, WRLDU-071701-A, and WRL-SW-4005, should be considered "not-detected" and have been flagged "U" on the data tables. In addition, reported results below the sample-specific quantitation limits have been replaced with the quantitation limit and the appropriate "U" qualifier. It should be noted that sample volumes and dilution factors were taken into consideration when evaluating blank contamination.
Due to the trace-level presence of biphenyl and 2-methylnaphthalene in the associated method blank, the reported positive results for these compounds in SDG 01-350 sample 90-002 should be considered "not-detected" and have been flagged "U" on the data tables. In addition, reported results below the sample-specific quantitation limits have been replaced with the quantitation limit and the appropriate "U" qualifier. It should be noted that sample volumes and dilution factors were taken into consideration when evaluating blank contamination.
The quantitation limits for PAH compounds in SDG 01-350 sample 90-002 and for Pest/PCB compounds in SDG 01-350 sample PR582 may be higher than reported, and the "not-detected" results have been flagged "UJ" on the data tables. In addition, any reported positive results for PAH or Pest/PCB compounds in these samples should be considered estimated and have been flagged "J" (unless previously flagged "U") on the data tables. The temperature of these samples upon receipt at the laboratory (22.6°C) was above the acceptance limit (<6°C).
The quantitation limits for endosulfan I and endrin aldehyde in SDG 01-350 samples RAB-SW-5004, RWR-SW-5001, RWR-SW-5002, WRL-SW-4004, WRL-DU-071701-A, and WRL-SW-4005 may be higher than reported, and the "not-detected" results have been flagged "UJ" on the data tables. High %Ds (>25%) were observed for these compounds in the associated continuing calibration standards.
The reported positive result for acenaphthene in SDG 01-364jsajjple-KAB-SD-SOOS-OOOO-Ol should be considered estimated and has been flagged^J^-tJfime data tables. High recoveries (>120%) were observed for this compound inithfr-agsociated MS/MSD analyses.
The reported positive results fw-fAH compounds in SDG 01-364 samples LPX-SD-40110000-01, GMP-SD-500>GdOO-01, APB-SD-4008-0000-01, and LPX-SD-4013-0000-01 should be considered^stimated and have been flagged "J" on the data tables. Very low percent solids results ^30%) were obtained for these sediment samples.
\\pc-dahlen\task 22 samp\data report - water\deliverable edds post 3rd validated\report3.doc
"H> o_s

-page 5
The quantitation limits for the compounds in the samples listed below may be higher tha reported, and the "not-detected" results have been flagged "UJ" on the data tables. addition, any reported positive results for these compounds in the samples listed below should be considered estimated and have been flagged "J" on the data tables. Higji %Ds (>25%) were observed for these compounds in the associated continuing calibration standards.
Compound(s) SPGSamples With Qualified Quantitation Limits ("UJ")
or Estimated Positive Results/T">
alpha-BHC, dieldrin, and endrin
01-373 APC-AE-4001 -0000-01 and APC-A£-4002-0000-01
methoxychlor 01-373 APC-AE-4001-0000-01, APC/AE-4002-0000-01, APC-AE-4003-0000-01, ABC-AE-4004-0000-01, APC-AE-4005-0000-01, APC-AE-4006-0000-01, APC-AE-4007-0000-01/APC-AE-4008-0000-01,
and APC-AE-4009-0000-01
gamma-BVLC, delta-BHC, heptachlor, dieldrin, and
endrin aldehyde
01-373 LPX-AE-4008-00/0-01, LPX-AE-4009-0000-01, and I^X-AE-4010-0000-01
The quantitation limits for aldrin, alpha-BuC, beta-BHC, delta-BHC, endosulfan I, endosulfan II, endrin, endrin aldehyde, endnn ketone, heptachlor, and methoxychlor in SDG 01-373 sample LPX-AE-4001-0000-^01 may be higher than reported, and the "notdetected" results have been flagged "Ur' on the data tables. In addition, the reported positive results for gamma-BHC; 4,4VDDD; dieldrin; gamma-chlordane; and heptachlor epoxide in this sample should be considered estimated and have been flagged "J" on the data tables. Low recoveries (<40%) were observed for these compounds in the associated MS/MSD analyses. In addition/high RPDs (>30%) were observed for 4,4'-DDD and dieldrin in the associated MS/Iv^SD analyses.
The quantitation limits for endrin aldehyde in all SDG 01-373 samples may be higher than reported, and the "not-detected" results have been flagged "UJ" on the data tables. A low recovery (<40%) was ob/erved for this compound in the associated LCS analysis.
The quantitation limjfs for Pest/PCB compounds in SDG 01-373 samples APC-AE-40010000-01, APC-AJp002-0000-01, and APC-AE-4006-0000-01 may be higher than reported, and the/'not-detected" results have been flagged "UP' on the data tables. In addition, any reported positive results for Pest/PCB compounds in these samples should be considered estimated and have been flagged "J" on the data tables. Low recoveries (<40%) were observejf for one or both surrogate compounds in the analysis of these samples.
w:\battelle\duxbury rl dv\yl031544\fmal\report3.doc
ENVIRONMENTAL STANDARDS

-page 6
Any reported positive results for Pest/PCB compounds in§D6^0T-373 samples LPX-AE4004-0000-01, LPX-AE-4005-0000-01, LPX-AE^OQ9=flOO"(M)l, and LPX-AE-4010-0000-01 should be considered estimated and havfr-beeTTrmgged "J" on the data tables. High recoveries (>125%) were observed for one^pp-btjth surrogate compounds in these samples.
One field duplicate pair (SDG 01-350 sample WRL-SW-4004 and its field duplicate, sample WRL-DU-071701-A) was submitted to the laboratory with this data set and analyzed for PAH and Pest/PCB compounds. Acceptable precision and sample representativeness were demonstrated by all reported positive results in these field QC samples. A complete comparison of the reported positive results has been included in Section 3A.
Based on the project-specific reporting requirements, all reported positive results with concentrations between the laboratory method detection limit and the project reporting limit should be considered estimated and have been flagged "J" on the data tables.
Complete support documentation for this organic QA review is presented in Section 3 of this report. The cover sheet for this section is a checklist of all QA procedures required by the methods and examined in this data review.
B. Wet Chemistry Data
The wet chemistry analyses of 15 aqueous samples (including QC samples) were performed by Chesapeake Biological Laboratory (CBL) of Solomons, Maryland. The samples were analyzed for nutrients (specifically, nitrite, ammonium, phosphate, nitrate, dissolved organic carbon [DOC], total organic carbon [TOC], total suspended solids [TSS], total dissolved phosphorus, total dissolved nitrogen, total phosphorus, and total nitrogen) by CBL SOP L-62. These analyses are specified on Table 1. The laboratory organized the samples into CBL #01.
The findings in this report are based upon a rigorous review of sample holding times, condition of samples upon laboratory receipt, blank analysis results, MS recoveries, laboratory duplicate precision, instrument sensitivity, instrument detection limits (DDLs), sample preparation, and the quantitation of positive results.
Overall, the wet chemistry data quality appears to be good. The data reviewer has edited the QC forms based on the deficiencies and comments listed in this QC review. Analytical and reporting requirements specified in the QAPP were met for this data set, with the exception of the items identified in the following sections of this QA review; it should be emphasized that these items do not necessarily impact data usability. Based upon a rigorous review of the data provided, the wet chemistry qualifiers associated with the samples that underwent data validation are presented in the subsequent Wet Chemistry Data Qualifiers Section. These qualifiers should not be applied to
\\pc-dahlen\task 22 samp\data report - water\deliverable edds post 3rd validated\report3.doc

-page 7
any wet chemistry results that did not undergo data validation. Data usability issues represent an interpretation of the QC results obtained for the project samples. Quite often, data qualifications address issues relating to sample matrix problems. Similarly, the validation guidelines specify areas of the data that require qualification, yet the methods used for analysis do not require any corrective action by the laboratory. Accordingly, the data usability issues that follow should not necessarily be construed as an indication of laboratory performance.
Comment
The laboratory only performed matrix spike analyses for total dissolved nitrogen and total dissolved phosphorus. As a result, the data reviewer could not evaluate the accuracy of the analytical method relative to the specific sample matrix for all target parameters.
With respect to data usability, the principal area of concern is high laboratory duplicate relative percent differences. Based on a Tier n review of the data provided, the following wet chemistry data qualifiers are offered. The following data usability issues represent an interpretation of the QC results obtained for the project samples. Quite often, data qualifications address issues relating to sample matrix problems. Similarly, the data validation guidelines routinely specify areas of the data that require qualification, yet the methods used for analysis may not require corrective action by the laboratory. Accordingly, the following data usability issues should not be construed as an indication of laboratory performance.
Wet Chemistry Data Qualifiers
The reported positive results for ammonium and total dissolved phosphorus in all CBL #01 samples should be considered estimated and have been flagged "J" on the data tables. High relative percent differences (>10%) were observed for these parameters in the associated laboratory duplicate analyses.
One field duplicate pair (CBL #01 sample WRL-SW-4004 and its field duplicate, sample WRL-DU-071701-A) was submitted to the laboratory with this data set and analyzed for nutrient parameters. Acceptable precision and sample representativeness were demonstrated by all reported positive results in these field QC samples.
Complete support documentation for this wet chemistry QA review is presented in Section 4 of this report. The cover sheet for this section is a checklist of all QA procedures required by the methods and examined in this data review.
\\pc-dahlen\task 22 samp\data report - water\deliverable edds post 3rd validated\report3.doc

-page 8
C. Conclusions
Overall, the data quality is good. Based on this QA review, several positive organic results were qualified as "not-detected" due to blank contamination. In addition, several organic results were qualified as estimated due to elevated sample temperatures, high continuing calibration %Ds, high and low MS/MSD recoveries, very low percent solids results, a low LCS recovery, high and low surrogate recoveries, and quantitation of results below the project-required reporting limit. A few wet chemistry results were qualified as estimated due to high laboratory duplicate relative percent differences. Overall, the data are acceptable for use, provided the data user understands the limitations and qualifications stated in this QA review. The Laboratory Case Narratives and Chainof-Custody Records are presented in Sections 5 and 6, respectively.
Report prepared by: Report reviewed by:
Thomas H. Weinmann Stephen T. Zeiner, C$AC, CPC Quality Assurance Chemist Senior Quality Assurance Chemist IH
Report reviewed and approved by: Report reviewed and approved by:
CyletR. Clay David R. Blye, CEAC Senior Quality Assurance Chemist I/ Quality Assurance Specialist/ Project Manager Principal
ENVIRONMENTAL STANDARDS, INC. Date: /1140 Valley Forge Road P.O. Box 810 Valley Forge, PA 19482-0810
(610) 935-5577
w:\battelle\duxbury rl dv\yl031544\final\report3.doc
ENVIRONMENTAL STANDARDS

Section 1 Quality Assurance Review
The organic analyses of 15 soil samples (including QC samples) and one sediment sample were performed by Battelle Laboratories of Duxbury, Massachusetts. The samples were analyzed fc polyaromatic hydrocarbon (PAH) compounds by Battelle Method SOP 5-157-06 and/for pesticide/PCB compounds by Battelle Method SOP 5-128-05. These analyses are specifi a on Table 1. The laboratory organized the samples into sample delivery group (SDG) 01-499.
The findings in this report are based upon a US EPA Region I Tier II (Tier II) review/of holding times, condition of samples upon laboratory receipt, blank analysis results, labopatory control sample (LCS) recoveries, matrix spike (MS)/matrix spike duplicate (MSD) cecoveries and precision, surrogate recoveries, internal standard response, instrument sensitivity, field and laboratory duplicate precision, analytical sequence, and calibrations.
Overall, the organic data quality appears to fair. The data reviewer ha^edited the QC forms based on the deficiencies and comments listed in this QA review. /Analytical and reporting requirements defined in the QAPP were met for this data set, with ine exception of the items identified in the following sections of this QA review; it should be ernpnasized that these items do not necessarily impact data usability. Based upon a Tier II review of the data provided, the organic data qualifiers associated with the samples that underwent limited data validation are presented in the subsequent Organic Data Qualifiers sectic-i/ These qualifiers should not be applied to any organic results that did not undergo data validation. Data usability issues represent an interpretation of the QC results obtained for the/project samples. Quite often, data qualifications address issues relating to sample matrix problems. Similarly, the validation guidelines specify areas of the data that require qualification, yet the methods used for analysis do not require any corrective action by the laboratory/Accordingly, the data usability issues that follow should not necessarily be construed as an indication of laboratory performance.
Noncorrectable Deficiencies
1. For the PAH fraction, high level/of benzaldehyde (greater than the quantitation limit) were observed in the rnethoa blank samples, and the benzaldehyde result in an associated project sample was less than 10-times the blank level. According to the QAPP (Worksheet #24a), ttfe laboratory should have reextracted and/or reanalyzed the samples. The laboratory/lid not reextract and/or reanalyze the samples. The impact on data usability due to ttye blank contamination is addressed in the subsequent Organic Data Qualifiers sectioc
2. For the PAH fraction, low surrogate recoveries (<40%) were observed for naphthalene-d8, /menanthrene-d10, and chrysene-d12 in method blank ZJ49PB, analyzed on 10/10/01. According to the QAPP (Worksheet #24a), the laboratory should reextract and reanalyze the sample if any surrogate fails the specified limits. The laboratory did not reanalyze the method blank. The Environmental Standards data reviewer used the method bfank results as reported to evaluate sample results. Data were not qualified due tOytnis deficiency because all associated project samples had surrogates within the specified limits.

-page 2 ,€)
For the PAH fraction, the laboratory did not reanalyze the project samples associated with the PAH MS/MSD analyses in which more than 10% of the target analytes/nad recoveries outside of QC performance criteria. According to the QAPP, if less thapi 90% of the target analytes meet the QC performance criteria (40%-120%R), the samples must be reanalyzed. Qualification of data due to this issue is addressejzf in the subsequent Organic Data Qualifiers section.
For the pesticide/PCB fraction of all SDGs, the laboratory quantitated severa/samples for pesticides using response factors generated from an initial calibration that/was analyzed after the samples had been analyzed. According to the Battelle Duxbur/Method 5-128 (Section 3.1), a valid multi-point initial calibration should be analyzed arthe beginning of each set of continuous sample analyses. The laboratory did analyze/an initial calibration at the beginning of the analytical sequence. The laboratory, howeyer, indicated that due to the nature of the sample matrix, a loss of instrument sensitivity was observed in the associated pesticide CCV standards. The laboratory recalibrated the instrument (as required, due to the non-compliant CCV standards), but did/not reanalyze the samples analyzed prior to the recalibration because the laboratory concluded that the sample matrix negatively impacted the instrument's column condition (as evidenced by the non-compliant pesticide CCV standards that followed the/second initial calibration in the sequence). Battelle laboratory personnel indicated to/me data reviewer that these sample analyses already represented reextractions and truft the initial extractions and analyses exhibited similar matrix problems that impacted calibration stability. Reanalysis of project samples, therefore, was not warranted because similar conditions would likely be encountered. Based on an evaluation of bothnnitial calibrations and all CCV standards in the analytical sequence, the laboratory determined that the second initial calibration was the "better" of the two calibrations. The results for all samples and standards in the analytical sequence were processed yglgainst the response factors generated from this calibration.
Comments
1. In the Case Narrative^ SDG 01-499, the laboratory did not cite data package page numbers for references to issues addressed in the Case Narrative. Upon request, the laboratory providea a revised Case Narrative that included the page numbers for reference. Datawere not qualified due to this issue.
2. The results for several PAH compounds in all SDG 01-499 samples, except samples LPX-F/M004-0000-01 and LPX-FP-4006-0000-01, were reported from dilutions due to high/revels of target compounds in the original analysis.
3. For the PAH fraction, the MS/MSD samples and LCS were not spiked with benzaldehyde. nTie Environmental Standards data reviewer could not evaluate the accuracy and precision of the analytical methods for benzaldehyde in this SDG.
w:\battelle\duxbury r1 dv\y1031544\final\report5.doc
ENVIRONMENTAL STANDARDS

-page 3
4. Sample LPX-SD-071601-A is the field duplicate of SDG 01-498 sample LPX-SD-4013V
0000-01. SDG 01-498 sample LPX-SD-4013-0000-01 was not analyzed for P/ compounds; therefore, the data reviewer could not evaluate the PAH precision of/foe analytical method relative to the field duplicate pair.
5. For the pesticide/PCB fraction, sample LPX-SD-071601-A is the field duplicate of SDG 01-498 sample LPX-SD^013-0000-01. SDG 01-498 sample LPX-SD^013-0000-01 is reported as part of the QA report issued January 28, 2002.
6. According to the Sample Custody Corrective Action Form, the sample container for SDG 01-499 sample LPX-SD-071601-A was cracked upon lajjoratory receipt. The laboratory determined that the sample had not been compromised and subsequently analyzed the sample. Data were not qualified due to this issue
7. According to the Sample Custody Corrective Action Form/Sample RWR-FP-5002-0000-01 was not listed on the Chain-of-Custody form. The laboratory received this sample and listed sample RWR-FP-5002-0000-01 in the comment section on the Chain-of-Custody form. Data were not qualified due to this issue.
With respect to data usability, the principal areas/of concern include blank contamination, low MS/MSD recoveries, MS/MSD imprecision, laboratory duplicate imprecision, high surrogate recoveries, field duplicate imprecision, and results below the project-required quantitation limit (PRQL). Based on a rigorous review of the darea provided, the following organic data qualifiers are offered. The following data usability issues/represent an interpretation of the QC results obtained for the project samples. Quite often, daja qualifications address issues relating to sample matrix problems. Similarly, the data validation guidelines routinely specify areas of the data that require qualification, yet the methods useo for analysis may not require corrective action by the laboratory. Accordingly, the following data usability issues should not be construed as an indication of laboratory performaplce.
Organic Data Qualifiers
Due to the presence of benzaldehyde in the associated method blank, the reported positive resujnor benzaldehyde in SDG 01-499 sample LPX-FP-4004-0000-01 should be considered/not-detected" and has been flagged "U" on the data tables. It should be noted that samofe volumes and dilution factors were taken into consideration when evaluating blank contamination.
The/teported positive results for 2-methylnaphthalene; acenaphthene; acenaphthylene; dij3fenz[a,h]anthracene; fluorene, and naphthalene in SDG 01-499 sample RWR-FP-5002
JOO-01 should be considered estimated and have been flagged "J" on the data tables. 'Very low (<10%) recoveries were observed for these compounds in the associated MS/MSD analyses.
w:\battelle\duxbury r1 dv\y1031544\final\report5.doc
ENVIRONMENTAL STANDARDS

-page 4
The reported positive results for 2-methylnaphthalene; acenaphthene; acenaphthylene; .8)dibenz[a,h]anthracene; fluorene, and naphthalene in SDG 01-499 sample RWR-FP-50020000-01 should be considered estimated and have been flagged "J" on the data table? High relative percent differences (RPDs >30%) were observed for these compounds in/the associated MS/MSD analyses.
The reported positive results for all PAH compounds in SDG 01- 9 sample LPX-FP-4004-0000-01 should be considered estimated and have been flagged "J" on the data tables (unless previously flagged "U"). High RPDs (>30%) were^poserved for these compounds in associated laboratory duplicate analyses.
The reported positive results for 4,4'-DDD; 4,4'-DDE; ato#)-chlordane; dieldrin; and endosulfan sulfate in SDG 01-499 sample RWR-FP-5002-POOO-01 should be considered estimated and have been flagged "J" on the data tableau Low (<60%) recoveries were observed for these compounds in the associated MS/MSD analyses.
The quantitation limits for 4,4'-DDD; 4,4'-DDEf 4,4'-DDT; a/p/7a-chlordane; dieldrin; endosulfan I; endosulfan sulfate; and ga/r?ma-chlordane in SDG 01-499 sample RWR-FP-5002-0000-01 may be higher than ceported, and the "not-detected" results have been flagged "UJ" on the data tables. In addition, any reported positive results for these compounds in SDG 01-499 sample RWR-FP-5002-0000-01 should be considered estimated and have been flagged "J"/wi the data tables. High RPDs (>30%) were observed for these compounds in the associated MS/MSD analyses.
The reported positive results for 4/4''-DDT; 4,4'-DDE; 4,4'-DDD; a/p/?a-chlordane; dieldrin; endosulfan sulfate; technical chLwdane; Aroclor-1254; and Aroclor-1268 in SDG 01-499 sample LPX-FP-4004-0000-01 /hou Id be considered estimated and have been flagged "J" on the data tables. High RPI S (>30%) were observed for these compounds in associated laboratory duplicate analyse
The reported positive results for all pesticide/PCB compounds in SDG 01-499 samples LPX-FP-4006-0000-01/and RWR-FP-5004-0000-01 should be considered estimated and have been flagged "J/on the data tables. High recoveries (>125%) were observed for one of the surrogate cor/(pounds in these samples.
Two field duplicate pairs (SDG 01-499 sample CMS-FP-4001 -0000-01 and its field duplicate, SDG 01-499 sample CMS-DUP-072001 and SDG 01-498 sample LPX-SD-40tS-0000-01 and its field duplicate, SDG 01-499 sample LPX-SD-071601-A) were submitted to the laboratory with this data set. SDG 01-498 sample LPX-SD-401 3-0000-01 was evaluated in a separate QA review. Acceptable precision and sample representativeness were demonstrated by the correlation observed between the results in the field duplicate pair (i.e., when both results were > 5x the PRQL, the RPD was 50% or when one of the results was < 5x the PRQL, the difference between the
as <3x the PRQL) with the exception of the results for the following compounds in samples listed below. Complete comparisons of the quantitatively confident positive
Ssults in the field duplicate pairs have been included in Section 3.
<\o &L w:\battelle\duxburyr1dv\y1031544\final\report5.doc
ENVIRONMENTAL STANDARDS

-page 5
Compound(s) SPG Sample(s) With Qualified QuantitatiojiJjmtte-ftKF)
and/or Estimated Positiye-Rgsuits ("J")
4,4'-DDE; 4,4'PDT; dieldrin; technical chlordane; biphenyl; acenaphthene;
benzo(a)pyrene; benzo(b)fluoranthene;
benzo(g,h,i)perylene; chrysene; benzo(k)fluoranthene;
dibenz(a,h)anthracene; fluorene; indeno(1,2,3-cd)pyrene; pyrene; and
total PAHs
01-499 CMS-FP-4001-OOO^fand CMS-DU-072001
4,4'-DPD; a/p/7a-chlordane; gamma-chlordane; Aroclor-1 Aroclor-1268; and Total>roclor
01-499 LPX-SD-071601-A
Based on the project-specific reporting requirements, all reported positive results with concentpafions between the laboratory method detection limit and the PRQL should be considered estimated and have been flagged "J" on the data tables.
Complete support documentation for this organic QA review is presented in Section 3 of this reopK. The cover sheet for this section is a checklist of all QA procedures required by the lethods and examined in this data review.
B. Inorganic Data
The inorganic analyses of 26 aqueous samples (including QC samples) were performed by Battelle/Marine Sciences Laboratory (Battelle-MSL) of Sequim, Washington. The samples were collectively analyzed for vanadium, chromium, manganese, and iron by Battelle-MSL Method MSL-l-027-03; for beryllium, aluminum, cobalt, nickel, copper, zinc, arsenic, molybdenum, silver, cadmium, antimony, barium, thallium, lead, and hardness by Battelle-MSL Method MSL-l-022-04; for selenium by Battelle-MSL Method MSL-l-030; and for total mercury by Battelle-MSL Method MSL-l-013-02. These analyses are specified on Table 1. The laboratory organized the samples into SDG 1678.
The findings in this report are based upon a Tier II review of sample holding times, condition of samples upon laboratory receipt, blank analysis results, MS/MSD recoveries and precision, laboratory/field duplicate precision, blank spike/LCS recoveries, instrument sensitivity, method detection limits (MDLs), calibrations, sample preparation, a critical review of raw data, and the quantitation of positive results.
Overall, the inorganic data quality appears to be good. The data reviewer has edited the QC forms based on the deficiencies and comments listed in this QA review. Analytical and reporting requirements defined in the QAPP were met for this data set, with the exception of the items identified in the following sections of this QA review; it should be emphasized that these items do not necessarily impact data usability. Based upon a Tier II review of the data provided, the
w:\battelle\duxbury M dv\y1031544\final\report5.doc
ENVIRONMENTAL STANDARDS

-page 6
inorganic data qualifiers associated with the samples that underwent limited data validation are presented in the subsequent Inorganic Data Qualifiers Section. These qualifiers should not be applied to any inorganic results that did not undergo data validation. Data usability issues represent an interpretation of the QC results obtained for the project samples. Quite often, data qualifications address issues relating to sample matrix problems. Similarly, the validation guidelines specify areas of the data that require qualification, yet the methods used for analysis do not require any corrective action by the laboratory. Accordingly, the data usability issues that follow should not necessarily be construed as an indication of laboratory performance.
Correctable Deficiency
The laboratory reported the copper concentration in the dissolved procedural blank as "0.119ng/l" and the cobalt concentration in the TRM procedural blank as "0.0170ng/l". The correct concentrations are 0.115^g/L and 0.002921 g/L, respectively.
Noncorrectable Deficiency
The laboratory did not analyze a continuing calibration verification (CCV) standard every 10 analyses for the ICPMS and mercury methods. According to the QAPP (Worksheet #21), the laboratory should analyze a CCV every 10 analyses. Data were not qualified due to this deficiency because all other QC samples were within specifications.
Comments
1. The laboratory did not consistently blank correct all standards in the mercury initial calibrations performed on 8/02/01 and 8/03/01. The laboratory did not blank correct the 0.1-ng concentration standard in these initial calibrations. The blank correction was minimal and, therefore, did not impact the overall %RSD for the calibration.
2. Blank summary forms and ICV/CCV summary forms for the metals analyses were not included in the submitted data package. Upon Environmental Standards' request, the laboratory provided these deliverables.
3. The laboratory reported all observed detections as positive results. Battelle project management indicated to the Environmental Standards that this reporting convention was consistent with project requirements. US EPA reporting conventions typically dictate that results with concentrations less than the method detection limit (MDL) or the IDL are reported as "not-detected" results. As part of this Tier II review, the Environmental Standards data reviewer did not alter the laboratory-reported results. The impact of this reporting issue on data quality is addressed in the Inorganic and Wet Chemistry Data Qualifiers section.
w:\battelle\duxbury r1 dv\y1031544\final\report5.doc
ENVIRONMENTAL STANDARDS

-page 7
With respect to data usability, the principal areas of concern are blank contamination, negative instrument bias, dissolved and total recoverable metals results comparison, field duplicate imprecision, and results below the project-required detection limit. Based on a rigorous review of the data provided, the following inorganic data qualifiers are offered. The following data usability issues represent an interpretation of the QC results obtained for the project samples. Quite often, data qualifications address issues relating to sample matrix problems. Similarly, the data validation guidelines routinely specify areas of the data that require qualification, yet the methods used for analysis may not require corrective action by the laboratory. Accordingly, the following data usability issues should not be construed as an indication of laboratory performance.
Inorganic Data Qualifiers
Due to the trace-level presence of the following analytes in the associated initial calibration blank, continuing calibration blank, and/or preparation blank analyses, the reported positive results for the following analytes in the samples listed below should be considered "not-detected" and have been flagged "U" on the data tables. Furthermore, results that were reported below the sample-specific detection limit were replaced with the detection limit and the appropriate "U" qualifier. It should be noted that sample weights, volumes, and dilution factors were taken into consideration when evaluating blank contamination.
Analvte Sample(s) With Results Qualified as "Not-Detected" ("U")
antimony WRC-SW-4001-01 (Dissolved), RAB-SW-5004-01(TRM), RWR-SW-5001 -01 (Dissolved), and RAB-SW-5004-01 (Dissolved)
chromium All samples except WRC-SW-4004-01 (TRM)
copper RAB-SW-5004-01 (Dissolved)
silver All samples
selenium All samples except RWR-SW-5002-01 (TRM) and RAB-SW-5004-01 (TRM)
zinc RAB-SW-5004-01 (Dissolved)
The detection limits for vanadium in all samples may be higher than reported, and the "notdetected" results have been flagged "UJ" on the data tables. In addition, any reported positive results for vanadium should be considered estimated and have been flagged "J" on the data tables. Significant negative instrument bias (absolute value of concentration > twice the IDL) was observed for vanadium in the associated initial calibration blank, continuing calibration blank, and/or preparation blank analyses.
The following analytes in the samples listed below should be considered estimated and have been flagged "J" on the data tables. A comparison of the total recoverable metals (TRM) results and dissolved metals results revealed dissolved metals (dissolved) results that were significantly greater than the total metals results for these analytes. Large differences (> the detection limit) were observed for these analytes between the TRM and dissolved samples results. Complete comparisons of the quantitatively confident positive results have been included in Section 4.
w:\battelle\duxbury r1 dv\y1031544\final\report5.doc
ENVIRONMENTAL STANDARDS

-page 8
TRM Dissolved Sample Analyte Concentration Concentration MDL
WRC-SW-4002-01 aluminum 69.2 95.8
WRL-SW-4004-01 thallium 0.00722 0.02290 0.0040
WRL-DU-071701-A thallium 0.00601 0.02000 0.0040 ^g/L
WRL-SW-4005-01 thallium 0.00678 0.02280 ng/L 0.0040
Two field duplicate pairs [sample WRL-SW-4004-01 (TRM) and its field duplicate, sample WRL-DU-071701-A(TRM) and sample WRL-SW-4004-01 (Dissolved) and its field duplicate, sample WRL-DU-071701-A(Dissolved)] were submitted to the laboratory with this data set. Acceptable precision and sample representativeness were demonstrated by the reported positive results in these field QC samples with the following exception. The reported positive results for antimony in samples WRL-SW-4004-01 (TRM) and WRL-DU-071701-A(TRM) should be considered estimated and have been flagged "J" on the data tables. A high relative percent difference (>20%) was observed for antimony in the associated field duplicate analyses. Complete comparisons of the reported positive results have been included in Section 4.
Based on standard project reporting requirements, all positive results reported with concentrations between the laboratory's associated MDLs and detection limits have been flagged "J" (unless flagged "U") on the data tables.
Complete support documentation for this inorganic QA review is presented in Section 4 of this report. The cover sheet for this section is a checklist of all QA procedures required by the methods and examined in this data review.
w:\battelle\duxbury r1 dv\y1031544\final\report5.doc
ENVIRONMENTAL STANDARDS
-page 9
C. Conclusions
Overall, the data quality is fair. Based on this QA review, several results were qualified as "notdetected" due to blank contamination and as estimated due to low MS/MSD recoveries, MS/MSD imprecision, laboratory duplicate imprecision, high surrogate recoveries, field duplicate imprecision, and results below the project-required quantitation limit. Several inorganic results were qualified as "not-detected" due to blank contamination and as estimated due to negative instrument bias, dissolved and total recoverable metals results comparison, field duplicate imprecision, and results below the project-required detection limits. Overall, the data are acceptable for use, provided the data user understands the limitations and qualifications stated in this QA review. The Laboratory Case Narratives and Chain-of-Custody Records are presented in Sections 5 and 6, respectively.
Report prepared by: Report prepared by:
4-*— .4« ---'
Steven J Lennon Glenn S. Esler Quality Assurance Cherhis1 Quality Assurance Chemist
Report reviewed and approved by: Report reviewed and approved by:
Kyle<R. Clay Rock J. Vitale, CEAC, CPC Senior Quality Assurance Chemist I/ Technical Director of Chemistry/ Project Manager Principal
ENVIRONMENTAL STANDARDS, INC. Date: 1140 Valley Forge Road P.O. Box 810 Valley Forge, PA 19482-0810
(610)935-5577
w:\battelle\duxbury r1 dv\y1031544\final\report5.doc
ENVIRONMENTAL STANDARDS

Battelle Response to Selected Validator Comments Report #3 - PCB/pesticides and PAH in Water
Noncorrectable Deficiencies
1. In SDG 01-350, high levels of naphthalene (greater than the quantitation limit) were observed in the method blank samples and naphthalene results in the associated project samples were less than 10-times the blank level. According to the QAPP (Worksheet #24a), the laboratory should have reextracted and/or reanalyzed the samples. The laboratory did not reextract and/or reanalyze the samples. The impact on data usability due to the blank contamination is addressed in the subsequent Organic Data Qualifiers section.
Response: Reextracting sample is not an option since water samples were consumed. Affected field data was qualified with "B" by the laboratory to indicate contamination. Blank contamination was discussed in the report and in the associated QA/QC narrative.
2. In SDG 01-350, samples 90-002 and PR582 were received at the laboratory with a cooler temperature of 22.6°C. According to the QAPP (Worksheet #22a), the cooler temperature should be less than 6°C. The impact on data usability due to the elevated temperature is addressed in the subsequent Organic Data Qualifiers section.
Response: Samples 90-002 and PR582 were PE samples sent by EPA and can be stored at room temperature in accordance with instructions received with the PE samples.
4. In the method detection limit (MDL) determination for PAH compounds in SDGs 01-350 and 01-364, the laboratory reported replicate concentrations less than the proposed MDL. According to the Federal Register (40 CFR, Part 136, Appendix B), the laboratory should not report an MDL value if the level of analyte is below the MDL in one or more replicates. The MDL study is not considered valid because the calculated MDL may not reflect method variance at lower analyte concentrations. The actual MDLs for PAH compounds are lower than the laboratory reporting limits; therefore, data were not qualified due to this deficiency.
Response: The lab director has reviewed the MDL studies referenced above and have determined that the issue is primarily based on Naphthalene. We have a blank issue with Naphthalene when determinations are made at these very low levels. Much like phthalates being ubiquitous, so is Naphthalene. Air deposition will always be a problemwhen the detection levels reach the ppt range. As a result the measured values sometimes range above the calculated MDL. This in no way effects the other PAH compounds as implied by the statement. It does suggest that there is a problem with Naphthalene, which we already know.

5. In the method detection limit (MDL) determination for Pest/PCB compounds in SDGs 01-350 and 01-373, the laboratory reported replicate concentrations greater than 10-times the proposed MDL. According to the Federal Register (40 CFR, Part 136, Appendix B), the laboratory should not report an MDL value if the level of analyte exceeds 10-times the MDL in one or more replicates. The MDL study is not considered valid because the calculated MDL may not reflect method variance at lower analyte concentrations. The actual MDLs for Pest/PCB compounds are lower than the laboratory reporting limits; therefore, data were not qualified due to this deficiency.
Response: When this MDL was run, the calculated MDL for several of the Pesticides and PCBs were very low, as a result of our very precise measurement ability. For this reason the spike level was in reality more than 10 times the calculated MDL for these selected analytes. In the future this can be overcome by raising the MDL using some factor or by repeating the MDL with a lower spike level. Repeating the MDL is something which is typically not done (industry wide) since the increase in work load is simply not justified.
Neither of these issues has any effect on the data or our reporting of the data. The validity of the MDL results should be focused on the individual analytes affected, not the study.