superior catalytic behavior of trace pt-doped ni/mg(al)o
TRANSCRIPT

Superior catalytic behavior of trace Pt-doped Ni/Mg(Al)O in methane
reforming under daily start-up and shut-down operation
Dalin Li,1 Kazufumi Nishida,1 Yingying Zhan,1 Tetsuya Shishido,2 Yasunori Oumi,1
Tsuneji Sano1 and Katsuomi Takehira1*
1Department of Chemistry and Chemical Engineering, Graduate School of Engineering,
Hiroshima University, Kagamiyama 1-4-1, Higashi-Hiroshima 739-8527, Japan
2Department of Molecular Engineering, Graduate School of Engineering, Kyoto
University, Katsura 1, Nishikyo-ku, Kyoto 615-8510, Japan
Applied Catalysis A: General, Volume 350, Issue 2, 30 November 2008, Pages 225-236
Received 7 May 2008; Received in revised form 7 August 2008; Accepted 18 August
2008
*Correspondence should be addressed to:
Professor Katsuomi Takehira
Department of Chemistry and Chemical Engineering,
Graduate School of Engineering, Hiroshima University,
Kagamiyama 1-4-1, Higashi-Hiroshima, 739-8527, Japan
Phone : (+81-824)-24-6488
Telefax: (+81-824)-24-6488
E-mail: [email protected]
1

Abstract
Doping effects of Pt and Ru on Ni/Mg(Al)O catalysts were compared in daily
start-up and shut-down operations of steam reforming of CH4. Trace Pt-doped catalyst
showed better behavior than trace Ru-doped catalyst; the former was self-activated but
the latter was not, although both exhibited self-regenerative activity. Moreover, the
former exhibited sustainable activity, although the latter was quickly passivated, in the
autothermal reforming of CH4. Formation of Pt-Ni alloy on the surface of fine Ni metal
particles on the catalysts was suggested by EXAFS analyses. CH4 was dissociatively
activated to form hydrogen on Pt, assisted by adsorbed O or OH species, leading to the
self activation via Ni reduction by hydrogen spillover from Pt. The self-regeneration of
the Pt-Ni/Mg(Al)O catalysts can be achieved by the continuous rebirth of active Ni
metal species via reversible reduction-oxidation between Ni0 and Ni2+ in/on
Mg(Ni,Al)O periclase assisted by the hydrogen spillover.
Key Words: CH4 reforming, self activation, self-regeneration, Ni/Mg(Al)O catalyst, Pt
doping, daily start-up and shut-down operation.
2

1. Introduction
Steam reforming (SR) of hydrocarbons, especially of CH4, is the most widespread
and generally the most economical way to make hydrogen [1]. This process still requires
further advancement in the preparation of low cost catalysts with high sustainability.
Hydrogen production for polymer electrolyte fuel cells (PEFCs) is a research area of
urgent importance in addressing global warming. In contrast to the reformers in
large-scale industry processes under stationary operating conditions, the temperature
varies frequently due to daily start-up and shut-down (DSS) operations for hydrogen
production of PEFCs in domestic use. Between shut-down and start-up in the DSS
operation, the catalyst bed in the reformer is purged by steam or air to enhance safety.
Thus, a catalyst must be able to tolerate multiple cycles under such unusual transient
conditions without deterioration.
We previously reported that Ni/Mg(Al)O catalyst derived from hydrotalcite
(HT)-like compounds produced highly dispersed and stable Ni metal particles on the
surface [2-4] and were successfully applied in SR and oxidative SR of CH4 [2,3].
Deactivations of Ni-loaded catalysts were reported to be caused by coking, sintering or
oxidation of the active metal species [5,6]. Ni metal can be oxidized not only by
gaseous oxygen, but also even in the presence of steam. The Ni/Mg(Al)O catalysts were
quickly deactivated due to the oxidation of Ni metal by both oxygen gas and steam
when applied in the DSS operation of SR of CH4 [7].
Recently, we reported that the doping of trace noble metals on the Ni/Mg(Al)O
catalysts was effective for suppressing the Ni oxidation during the DSS operation [8,9].
The Ni/Mg(Al)O catalysts doped with traces of noble metals exhibited high and
3

sustainable activity in the DSS SR of CH4 [9] and partial oxidation (PO) of propane to
synthesis gas [10]. Moreover, we have reported an excellent catalytic behavior, that is,
self-regenerative activity of the Ni/Mg(Al)O catalyst doped with trace Ru during the
DSS SR of CH4 [11]. However, the Ru-doped Ni/Mg(Al)O catalyst could not be
self-activated in SR of CH4 and, moreover, was not sustainable enough when it was
used in autothermal steam reforming (ATSR) of CH4, resulting in a drastic deterioration
in the catalytic activity. In the present paper, we report both self-activation and
self-regenerative activity of trace Pt-doped Mg(Ni,Al)O catalyst. We also report its
sustainable activity not only in DSS SR but also in ATSR of CH4. The effects of Pt
doping on such catalytic behavior have been carefully investigated and compared with
those of Ru doping [11].
2. Experimental
2.1. Catalyst preparation
Ni-loaded Mg(Al)O catalyst with the Mg/Ni/Al atomic ratio of 2.5/0.5/1 was
prepared by co-precipitation as described previously [2-4]; Mg2.5(Ni0.5)-Al HT-like
precursor, in which a part of Mg2+ in Mg-Al HT was replaced by Ni2+, was prepared by
co-precipitation of the nitrates of metal components. An aqueous solution containing the
nitrates of Mg2+, Ni2+ and Al3+ was added slowly into an aqueous solution of sodium
carbonate at room temperature and at pH = 10.0. After the solution was aged at 60 ºC for
12 h, the precipitate was washed with de-ionized water and dried in air at 100 ºC. The
Mg2.5(Ni0.5)-Al HT-like precursor was calcined in a muffle furnace in a static air
atmosphere by increasing the temperature from ambient temperature to 850 ºC at a rate
4

of 0.83 ºC min-1 and maintaining it at 900 ºC for 5 h, to form Mg2.5(Al,Ni0.5)O periclase
as the precursor of Ni0.5/Mg2.5(Al)O catalyst. The periclase materials were obtained as
powders, and the Ni loading was found to be 16.0 wt% by inductively coupled plasma
spectroscopy analyses after the calcination at 850 ºC.
Pt, Rh or Ru doping was done by adopting a “memory effect” of Mg(Ni)-Al HT
[8]; a 1.0 g portion of Mg2.5(Al,Ni0.5)O periclase powders was dipped in an aqueous
solution of Pt(II), Rh(III) or Ru(III) nitrate for 1 h at room temperature, followed by
drying in air at 100 ºC. A prescribed amount of Pt(II), Rh(III) or Ru(III) nitrate was
dissolved in 5 ml of de-ionized water. Mg(Ni)-Al HT was reconstituted from
Mg2.5(Ni0.5,Al)O periclase during the dipping due to a “memory effect.” During this
reconstitution, both Pt and Ru were physically trapped, whereas Rh(III) was chemically
replaced at the Al(III) sites, in the layered structure of the HT [12]. The sample was
finally calcined at 850 ºC for 5 h and the precursors of Pt-, Rh- or Ru-doped
Ni0.5/Mg2.5(Al)O catalysts were obtained. The precursor powder was pressed to a disc,
crushed roughly, and sieved to the particle sizes of 0.36 - 0.60 mm in a diameter and
used in the reforming reactions.
As a control, 13.5 wt% Ni/γ-Al2O3 catalyst was prepared by the incipient wetness
method using γ-Al2O3 (JRC-ALO8) and an aqueous solution of Ni(II) nitrate, followed
by calcination at 850 ºC for 5 h.
2.2. Characterization of catalyst
The structures of the catalysts were studied by using powder X-ray diffraction
(XRD), transmission electron microscopy (TEM), X-ray absorption (XANES and
EXAFS), inductively coupled plasma optical emission spectrometry (ICP), temperature
5

programmed reduction (TPR), temperature programmed oxidation (TPO), and N2 and
H2 adsorption.
XRD was recorded on a Mac Science MX18XHF-SRA powder diffractometer
with mono-chromatized Cu Kα radiation (λ = 0.154 nm) at 40 kV and 30 mA. The
diffraction pattern was identified through comparison with those included in the JCPDS
(Joint Committee of Powder Diffraction Standards) database. The size of Ni metal
particles on the catalyst was calculated from Scherrer’s equation: d = Kλ/βcosθ; β, full
width at half maximum; K = 0.94 and λ = 1.5405 Å.
TEM images were obtained on a FE-TEM Hitachi HF-2200 instrument. The
samples were crushed to fine powders, dispersed in heptane using supersonic waves,
and deposited on a Cu TEM grid with a holey carbon film.
Ni K-edge, Ru K-edge and Pt L3-edge XAFS spectra were measured at the
BL01B1 station of the SPring-8 with the approval of the Japan Synchrotron Radiation
Research Institute (JASRI) (proposal 2006A1217). The storage ring was operated at 8
GeV with a ring current of 98-100 mA. A double mirror system was used to avoid
higher harmonics in the X-ray beam. A Si(111) single crystal was used to obtain a
monochromatic X-ray beam. Ni K-edge XAFS spectra were measured in transmission
mode by using two ion chambers filled with N2 (I0) and 25% Ar diluted with N2 (I). Ru
K-edge XAFS spectra were measured in transmission and fluorescence modes using ion
chambers [50% Ar diluted with N2 (I0) and 75% Ar diluted with Kr (I)] and a Lytle
detector (100% Kr), respectively. Pt L3-edge XAFS spectra were measured in
transmission and fluorescence modes using ion chambers [15% Ar diluted with N2 (I0)
and 50% Ar diluted with N2 (I)] and a Lytle detector (100% Kr), respectively. Analyses
of EXAFS data were performed using the REX2000 program (Version: 2.5.7; Rigaku
6

Corp.). For EXAFS analyses, the oscillation was first extracted from EXAFS data using
a spline-smoothing method [13]. The oscillation was normalized by an edge height ca.
50 eV higher than the adsorption edge. For the curve-fitting analysis, the empirical
phase shift and amplitude functions for the Ni-Ni, Ru-Ru and Pt-Pt bonds were
extracted from data for Ni and Pt foils and Ru metal powder, respectively. Theoretical
functions for the Ru–Ni, Pt-Ni, Ni-O and Ru-O bonds were calculated using the
FEFF8.2 program [14]. The 0.50 wt% Ru- or Pt-doped Ni0.5/Mg2.5(Al)O sample was
used for this measurement in order to guarantee the accuracy of the analytical results.
ICP measurements were performed with a Seiko SPS 7700. The content of each
metal component was determined after the sample was completely dissolved using
diluted hydrochloric acid and a small amount of hydrofluoric acid.
TPR of the catalyst were performed at a heating rate of 10 ºC min-1 using a H2/Ar
(5/95 ml min-1) mixed gas as reducing gas after passing through a 13X molecular sieve
trap to remove water. A U-shaped quartz tube reactor (6 mm i.d.) equipped with a
thermal conductivity detector for monitoring H2 consumption was used. Before the TPR
measurements, the sample was calcined at 300 ºC for 2 h in an O2/Ar (10/40 ml min-1)
mixed gas.
TPO experiments were performed on the catalyst after the steaming at 900 ºC for
10 h, followed by the stationary SR of CH4 at 700 ºC for 3 h, from room temperature to
900 ºC at a heating rate of 2.5 ºC min-1 in an O2/N2 (5/20 ml min-1) mixed gas. The
amount of coke formed on the catalyst was estimated from the amount of CO2 formed
during the TPO experiment. No CO was detected during TPO.
The N2 adsorption (-196 ºC) study was conducted to examine the BET surface
area of the samples after the calcination. The measurement was carried out on a
7

Bell-Japan Belsorp-mini. The samples were pretreated in N2 at 200 ºC for 10 h before
the measurements were obtained.
Ni dispersion was determined by static equilibrium adsorption of H2 at ambient
temperature using the pulse method. A 50-mg catalyst sample was reduced at 900 ºC in
a H2/N2 (5/20 ml min-1) mixed gas for 1 h, and this reduced catalyst was used for the
measurement. During the pulse experiment, the amount of H2 was monitored by a TCD
gas chromatograph. Uptake of H2 at monolayer coverage of the Ni species was used to
estimate Ni metal dispersion and particle size. The equation used to calculate dispersion
was:
%D = 1.17 X / Wf (1)
where X is H2 uptake in μmol g-1 of catalyst, W is the weight percent of nickel, and f is
the fraction of nickel reduced to the metal, assumed to be 80 % for the HT-derived
catalysts [9] and 100 % for the impregnated catalyst. The average crystallite diameters,
d, were calculated from %D, assuming spherical metal crystallites [15]:
d = 971 / (%D) (2)
2.3. Kinetic measurements
SR was conducted in a fixed-bed flow reactor with a CH4/H2O/N2 (50/100/25 ml
min-1) mixed gas at 700 ºC over 50 mg of the catalyst in a stationary or a DSS-like
mode as reported previously [11]. The catalyst was used as particles (0.36 - 0.60 mm in
diameter) dispersed in 50 mg of quartz beads. A U-shaped quartz reactor was used, with
the catalyst bed near the bottom. N2 was used as an internal standard for calculating the
CH4 conversion and the product yields. To test the ability of self-activation of the
catalyst, we conducted the stationary operation of SR or PO in a CH4/H2O/N2
8
(50/100/25 ml min-1) or a CH4/O2/N2 (50/25/25 ml min-1) gas mixture at 700 ºC for 180
min, after heating the catalyst from room temperature to 700 ºC in N2 (25 ml min-1) gas
flow. In the DSS SR, the reaction was started at 700 ºC after the catalyst was
pre-reduced in a H2/N2 (5/25 ml min-1) mixed gas at 900 ºC for 30 min. After the
reaction at 700 ºC, the reactor was cooled to 200 ºC under steam purging with a H2O/N2
(100/25 ml min-1) mixed gas. The reactor was maintained at 200 ºC for 30 min, after
which the temperature was again increased to 700 ºC still under the purging conditions.
When the temperature reached 700 ºC, the reaction was again started by adding CH4 (50
ml min-1) into the purging gas. The reaction was carried out at 700 ºC, followed by
steam purging. Thus the cycle reaction was repeated four times to perform the DSS-like
operation. To test the sustainability under an oxidative atmosphere, we applied air
purging with an O2/N2 (25/25 ml min-1) gas mixture combined with steam purging; such
purging conditions are expressed as, e.g., “air - steam - air”, which means the purging
by “air (700 ºC → 200 ºC) - steam (at 200 ºC) - air (200 ºC → 700 ºC)”. In the ATSR of
methane, a CH4/H2O/O2/N2 (50/100/25/25 ml min-1) mixed gas was used under the
steam purging. The thermocouple to control the reaction temperature was placed at the
center of the catalyst bed. In each SR or ATSR step at 700 ºC, analyses of product gases
by online TCD-gas chromatography were started after the gas-flow of CH4/H2O/N2 or
CH4/H2O/O2/N2 mixture was stabilized.
Steaming treatment of the catalyst was carried out using the fixed bed flow
reactor in a H2/H2O/N2 (20/100/25 ml min-1) mixed gas flow for 10 h at 900 ºC. Each
300 mg of the catalyst was steamed, and a 50-mg catalyst sample after steaming was
used for the catalytic reaction in both the stationary and DSS operations of SR. The
stationary operation was conducted in a CH4/H2O/N2 (50/100/25 ml min-1) mixed gas
9

flow at 700 ºC for 180 min, and the DSS operation was conducted as described above.
Turnover frequency (TOF) was evaluated using the catalysts as powders, because
the activity of Ni0.5/Mg2.5(Al)O-based catalyst was so high that only a small amount of
catalyst was needed to precisely measure the reaction rate in our small reactor. The
reaction had to be carried out without channeling in the catalyst bed at low CH4
conversion and very high space velocity. All catalysts were crushed, and a 10 mg
portion of the catalyst powders (0.075 - 0.180 mm in diameter) was dispersed in ca. 20
mg of quartz wool and pretreated in a H2/N2 (5/25 ml mi-1) mixed gas flow at 900 ºC for
30 min. The reaction was carried out at either 500 or 600 ºC in a CH4/H2O/N2
(88.8/177.6/44.4 ml min-1) mixed gas flow at a GHSV of 1.6×10⁶ ml gcat-1 h-1. For both
FCR and RUA catalysts, the reaction was carried out at a low GHSV of 3.6×10⁵ ml gcat-1
h-1 due to their low activities.
3. Results
3.1. Self-activation of Pt-doped Ni/Mg(Al)O in CH4 steam reforming.
We briefly reported that 0.1 wt% Rh-, Pt- and Pd-doped Ni0.5/Mg2.5(Al)O
catalysts were self-activated during a stationary SR of CH4 [8]. The effects of the
doping amounts of Rh and Ru on the SR were studied in the previous work [16]; Rh
was effective for the self-activation with the doping above 0.10 wt%, whereas Ru
showed no reforming activity for 3 h even with 0.50 wt% doping without pre-reduction.
The effects of the doping amount of Pt on the catalyst self-activation in the stationary
SR of CH4 were studied and the results are shown in Fig. 1 together with those of Rh
and Ru. All 0.50, 0.10 and 0.05 wt% Pt-doped Ni0.5/Mg2.5(Al)O exhibited high CH4
10

conversion just after starting the reaction, although 0.05 wt% Pt-doping needed a short
time of induction period. The ability of noble metals for the self-activation was in the
order of Pt > Rh >> Ru; Ru never induced the self-activation even with the 0.50 wt% of
doping. This is probably due to the strong ability of Pt followed by Rh to promote CH4
dissociation to produce hydrogen.
A theoretical study of CH4 activation, i.e., CH4 dissociation, was conducted on a
number of transition metals M (Ru, Ni, Rh, Ir, Pd, Pt) by simulating the metal M(111)
surface by a cluster model [17]. Dehydrogenations of CHx to CHx-1 are highly
endothermic in the gas-phase, and the calculated values of dissociation energy, i.e., D,
are: CH3-H, 4.85 eV; CH2-H, 5.13 eV; CH-H, 4.93 eV; C-H, 3.72 eV [17]. On the metal
surface, there is a significant reduction in the D values, owing to the presence of strong
metal-CHx-1 and metal-H bonds. Summation of the energies for the four discrete steps
gives the total dissociation energies, Dtot, for CH4,s → Cs + 4Hs and should be a more
realistic measure for the activity of the metal in CH4 dissociation. The total dissociation
is shown to be quite exothermic on Rh (by -0.7 eV); it is slightly endothermic on Ru
(0.01 eV) and Ir (0.3 eV), and it is rather endothermic on Pd and Pt (~1 eV). This
indicates that the total dissociation of CH4 on Rh is thermodynamically the most
favorable among the transition metals. The Dtot values vary in the order: Rh ≈ Ni < Ru <
Ir < Pt < Pd.
On the other hand, in the presence of adsorbed oxygen, oxygen at metal on-top
sites promotes CH4 dehydrogenation; oxygen promotes CH4 dehydrogenation on Pt, but
shows no such effect on the other transition metals [18]. In the presence of adsorbed
oxygen, in addition to the direct dissociation of CH4 on bare metal surfaces, we may
consider the following reactions:
11

CHx,s + Os → CHx-1,s + OHs (x = 4, 3, 2, 1) (3)
Because the H atom binds more strongly with Os than with the bare metal, the CH4
dissociation reactions in the presence of chemisorbed oxygen, i.e., Os, have lower
reaction energies due to hydroxyl formation [19,20]. The Os species increases
adsorption energies of H on Pt, but decreases those on the other transition metals.
Therefore, Os promotes CH4 dissociation on Pt, but does not promote it on the other
transition metals.
The results obtained for PO of CH4 over Ru, Rh- and Pt-doped Ni0.5/Mg2.5(Al)O
are depicted in Fig. 2. Pt doping was the most effective for the self-activation of
Ni0.5/Mg2.5(Al)O; even the material with 0.05 wt % of the doping exhibited a reforming
activity and produced hydrogen with high selectivity without induction period.
Although 0.01 wt % of Pt doping exhibited CH4 conversion above 20 %, no H2
production was observed, while combustion products were detected. The order of noble
metals for the self-activation was again Pt > Rh >> R; the effect of “adsorbed oxygen
species” has been clearly confirmed. In the present work (Fig. 1), steam was added
instead of oxygen, resulting in the formations of plenty of OHs on the MgO surface,
since MgO is thermodynamically unstable compared with Mg(OH)2 under steam
atmosphere [21]. MgO reacts even with moisture in the air, especially at low
coordination atomic sites, to form Mg(OH)2 brucite; MgO surface was covered by OHs
and further OHs species migrated from MgO to Pt metal surface and formed Pt-OH
species. We may consider that such Pt-OH species can also promote CH4 dissociation
instead of Os on Pt.
3.2. Activity of Pt-doped Ni/Mg(Al)O in DSS operation.
12

We previously reported that Ru and Rh doping enhanced the sustainability of
Ni0.5/Mg2.5(Al)O during DSS SR of CH4 [11,16]. Rh metal is expensive, whereas Ru
metal is rather cheap. Although oxidized Ru will evaporate and is very hazardous under
oxidizing (like ATR conditions) conditions, actually Ru has been frequently used as the
reforming catalysts. Unfortunately, the Ru doping was not effective for the
self-activation in the stationary SR of CH4; the Pt doping was the most effective among
the noble metals tested (Fig. 1). The effects of doping amount of Pt on Ni0.5/Mg2.5(Al)O
in the DSS SR of CH4 are shown in Fig. 3. The SR always proceeded selectively to H2,
CO and CO2 following the thermodynamic equilibrium under the condition of S/C = 2/1.
Pt-doping with 0.01 wt% showed a total deactivation after the second steam purging
due to a very small amount. With Pt doping above 0.03 wt%, the catalysts showed a
sustainable activity during the DSS SR, even though the activity, i.e., both CH4
conversion and rate of H2 production, decreased just after each steam purging. Such
decrease in the activity was more clearly observed with decreasing the Pt doping
amount, indicating that Pt assisted the regeneration of the active Ni species.
The physicochemical properties of Pt-doped Ni0.5/Mg2.5(Al)O are shown in Table
1. The specific surface area of Ni0.5/Mg2.5(Al)O decreased by Pt doping. Contrarily, H2
uptake as well as Ni dispersion increased, while Ni particle size decreased, with
increasing the Pt doping, indicating that Ni particles were more finely dispersed by the
Pt doping. H2-TPR measurements of Pt-doped Ni0.5/Mg2.5(Al)O exhibited a clear
decrease in Ni reduction temperature from 891 ºC for Ni0.5/Mg2.5(Al)O (no Pt doping)
to 887 ºC (0.01 wt% Pt), 874 ºC (0.05 wt% Pt), 850 ºC (0.10 wt% Pt) and finally to 823
ºC (0.50 wt% Pt) (Data are not shown). These results indicate that Pt assisted in the
reduction of Ni2+ in Mg2.5(Ni0.5,Al)O periclase [9]. No distinct reduction peak of Pt was
13

observed, suggesting that all Pt was highly dispersed or existed as Pt-Ni alloy [8]. All
these facts may result in an enhancement of the activity as well as the sustainability of
Pt-doped Ni0.5/Mg2.5(Al)O catalysts. Ni0.5/Mg2.5(Al)O was completely deactivated due
to the Ni oxidation on the catalyst surface [7]. We conclude that Ni was oxidized during
the steam purging and further re-reduced by hydrogen spillover from Pt during the SR
of CH4 at 700 ºC as previously reported for the Ru- or Rh-doped Ni/Mg(Al)O catalysts
[11,16].
3.3. Effect of steaming on Pt-doped Ni/Mg(Al)O.
The physicochemical properties of supported Ni and Pt-Ni catalysts after
steaming in a H2/H2O/N2 (20/100/25 ml min-1) mixed gas flow for 10 h at 900 ºC are
shown in Table 1. Such steaming treatment causes a severe sintering of supported metal
catalysts and is often used to conventionally evaluate the catalyst life. After the
steaming, specific surface areas of the Ni0.5/Mg2.5(Al)O, 13.5 wt% Ni/γ-Al2O3 and 0.10
wt% Pt-Ni0.5/Mg2.5(Al)O catalysts decreased significantly. H2 uptake also decreased,
indicating an increase in Ni particle size. The increase in Ni particle size was also
confirmed by the calculations from the line width in the XRD reflections. Ni loading on
γ-Al2O3 produced highly dispersed Ni particles via a formation of NiAl2O4 spinel on the
catalyst surface [22]. However, on the 13.5 wt% Ni/γ-Al2O3, Ni dispersion was lower;
Ni particle size was larger compared with those on Ni0.5/Mg2.5(Al)O and all Pt-doped
Ni0.5/Mg2.5(Al)O before steaming. In the results obtained by both XRD measurement
and H2 uptake after steaming, Ni sintering was the most significant on the 13.5 wt%
Ni/γ-Al2O3, followed by the Ni0.5/Mg2.5(Al)O and then by the 0.10 wt%
Pt-Ni0.5/Mg2.5(Al)O. Pt doping slightly suppressed the sintering of Ni particles.
14

Although a significant increase in H2 uptake was observed by 0.10 wt% Pt doping on
the Ni0.5/Mg2.5(Al)O, the contribution of Pt in H2 uptake must be negligible, since the
chemisorption stoichiometry is H/Pts = 1/1 [23] and the molar ratio of Pt/Ni on 0.10
wt% Pt-Ni0.5/Mg2.5(Al)O is calculated as 1/733 for total Ni amount, or at least 1/586 for
the surface Ni amount calculated from 80 % of Ni reduction degree [9,24]. Even when
we suppose that all Pt species are located on the surface of Ni particles, the direct
contribution of Pt on H2 uptake must be small; some other factors such as surface Pt-Ni
alloy formation or decrease in Ni particle size must be considered to explain the
increase in H2 uptake by the Pt doping. We conclude that the Pt doping on the
Ni0.5/Mg2.5(Al)O suppressed the sintering of Ni particles during the steaming treatment.
3.4. Activity of Pt-doped Ni/Mg(Al)O after steaming.
DSS SR of CH4 was carried out between 200 and 700 ºC under steam purging
over the catalysts after steaming at 900 ºC (Fig. 4). As previously reported [11,16], both
commercial FCR (12 wt%Ni/α-Al2O3) and RUA (2 wt%Ru/α-Al2O3) were deactivated;
FCR was suddenly deactivated just after the first steam purging, whereas RUA was
gradually deactivated during the reaction regardless of steam purging. Both
Ni0.5/Mg2.5(Al)O and 13.5 wt% Ni/γ-Al2O3 showed a complete deactivation just after
the first steam purging. Among the catalysts tested, 0.10 wt% Pt-Ni0.5/Mg2.5(Al)O alone
showed a stable activity during the DSS SR of CH4. Judging from the time course of
CH4 conversion during DSS operation (Fig. 4, magnified), one finds interestingly that
the activity of 0.10 wt% Pt-Ni0.5/Mg2.5(Al)O was rather stabilized after steaming; a
slight decrease in CH4 conversion observed just after each steam purging disappeared
and the CH4 conversion became almost constant throughout DSS operation after
15

steaming. A similar phenomenon was also observed for Ru- and Rh-doped Ni/Mg(Al)O
[11,16].
Thus, simply Ni supported catalysts were not sustainable for DSS operation, and
noble metal doping was effective for the catalyst sustainability. Although 13.5 wt%
Ni/γ-Al2O3 showed a stable activity in the stationary operation even after steaming, it
was not tolerant in DSS operation. The deactivation of the Ni catalysts was due to the
Ni oxidation to NiO as seen in the XRD patterns after steaming at 900 ºC followed by
DSS SR of CH4. As previously reported [11,16], a commercial RUA catalyst showed a
stable activity in DSS operation, but was deactivated significantly after steaming
probably due to the surface passivation of Ru particles by steam. Such deactivation was
also observed for 0.1 wt% Ru-Ni0.5/Mg2.5(Al)O (vide infra), suggesting that Ru is not as
tolerable as Pt and Rh. It must be emphasized that, even after steaming, 0.1 wt%
Pt-Ni0.5/Mg2.5(Al)O alone showed a high and stable activity not only in stationary
operation but also in DSS operation.
3.5. Coking on Pt-doped Ni/Mg(Al)O.
Deactivation of supported Ni catalysts took place by coking, by sintering and by
oxidation of active Ni particles. Although remarkable Ni sintering was observed over all
Ni0.5/Mg2.5(Al)O, 0.10 wt% Pt-Ni0.5/Mg2.5(Al)O, and 13.5 wt% Ni/γ-Al2O3 after
steaming (Table 1), these catalysts showed no severe deactivation. TPO was carried out
for the catalysts after steaming followed by stationary SR of CH4 at 700 ºC. Carbon
dioxide alone was produced and no other compound was detected during TPO. The
amount of coke materials calculated from the total amount of carbon dioxide produced
was as follows: 13.5 wt% Ni/γ-Al2O3, 0.11 wt%; Ni0.5/Mg2.5(Al)O, 0.70 wt% and 0.10
16

wt% Pt-Ni0.5/Mg2.5(Al)O, 1.12 wt%. As a comparison, 0.10 wt% Ru-Ni0.5/Mg2.5(Al)O
and 0.10 wt% Rh-Ni0.5/Mg2.5(Al)O catalysts showed 0.89 and 0.94 wt % of coking,
respectively, after stationary SR of CH4 [11,16]. Pt was not as effective as Ru and Rh
for suppressing coking on Ni0.5/Mg2.5(Al)O. This is partly due to a far smaller molar
ratio of Pt/Ni (1/532) than those of Rh/Ni (1/281) and Ru/Ni (1/275) for each 0.1 wt %
doping. The CO2 formation during TPO significantly depended on the types of catalyst;
both Ni0.5/Mg2.5(Al)O and 0.10 wt% Pt-Ni0.5/Mg2.5(Al)O showed similar patterns of
CO2 formation; CO2 began to form at low temperature and several peaks appeared with
increasing temperature [11,16]. It has been reported that typical graphite-like coke was
ignited at high temperature around 500 ºC, whereas either reactive carbonaceous
deposit or chemisorbed CO present on the surface after terminating reaction ignited at
temperatures below 400 ºC [25]. Moreover, recent works exhibited that various types of
carbon materials including carbon nanofibers can be produced over the Ni catalysts
depending on the particle sizes; such products possibly ignited at various temperatures.
On both Ni0.5/Mg2.5(Al)O and 0.1wt% Pt-Ni0.5/Mg2.5(Al)O, CO2 formation were
observed with several peaks between 100 ºC and 400 ºC in the TPO, as reported
previously [15]. The amount of coke was the highest on 0.10 wt% Pt-Ni0.5/Mg2.5(Al)O,
while the deactivation was the lowest,. It is likely that coke materials that formed on
0.10 wt% Pt-Ni0.5/Mg2.5(Al)O were not only typical graphitic but also consisted of
various types of carbon materials, a part of which can be gasified through the DSS
operation.
3.6. TOF of Pt-doped Ni/Mg(Al)O catalysts.
17

The activities of the catalysts before and after steaming were roughly compared
based on the CH4 conversion (Fig. 4). However, the CH4 conversions observed over
Ni0.5/Mg2.5(Al)O-based catalysts were always close to the thermodynamic equilibrium
and could not be compared precisely. A more precise evaluation of catalytic activity
must be done based on the TOF of the catalyst. TOF of supported Ni catalyst was
calculated based on both surface Ni amount and total Ni amount. The results are shown
in Table 2 together with those of 0.10 wt% Ru-Ni0.5/Mg2.5(Al)O [11]. TOF values based
on total Ni amounts (TOF-t) seem more practically reliable compared with those based
on surface Ni amounts (TOF-s), since TOF-s values were severely affected by the
sintering of Ni particles. According to the results of TOF-t measurements (Table 2),
13.5 wt% Ni/γ-Al2O3 was most severely deactivated, followed by Ni0.5/Mg2.5(Al)O and
0.10 wt% Pt-Ni0.5/Mg2.5(Al)O. A decline in TOF value after steaming was more
significant on 0.10 wt% Pt-Ni0.5/Mg2.5(Al)O than on 0.10 wt% Ru-Ni0.5/Mg2.5(Al)O,
probably due to a smaller molar amount of Pt than of Ru. The TOF values of both FCR
and RUA were one unit smaller than those of Ni0.5/Mg2.5(Al)O-based catalysts;
moreover, heavy deactivation occurred on both commercial catalysts after steaming
[11,16]. It must be noticed that the TOF value of 0.1 wt% Pt-Ni0.5/Mg2.5(Al)O showed
no significant decrease even after steaming treatment.
3.7. XRD patterns of Pt-doped Ni/Mg(Al)O after steaming.
XRD patterns of 0.10 wt% Pt-Ni0.5/Mg2.5(Al)O before and after steaming at 900
ºC, and after further followed by steam purged DSS SR of CH4, are depicted in Fig. 5.
Reflections of Ni metal together with both Mg(Ni,Al)O periclase and Mg(Ni)Al2O4
spinel were intensified for the catalyst after steaming (Figs. 5b). The Ni particle sizes
18

calculated by both XRD and H2 uptake measurements (Table 1) showed heavy Ni
sintering after steaming. Moreover, a TEM image of 0.10 wt% Pt-Ni0.5/Mg2.5(Al)O
showed Ni particle sizes of ca. 40 nm at the maximum (Fig. 6A), also demonstrating
heavy sintering after steaming. After steaming, followed by DSS SR of CH4, Ni metal
reflections were weakened and broadened (Fig. 5c), indicating that sintered Ni particles
were re-dispersed during DSS SR of CH4. This was also supported by TEM observation
of the catalyst after DSS SR of CH4 (Fig. 6B).
The 13.5 wt% Ni/γ-Al2O3 showed reflection lines of both Ni metal and γ-Al2O3
before steaming, whereas Ni metal reflections were intensified and α-Al2O3 appeared
after steaming. This indicates that Ni particles were sintered (see Table 1) and part of
γ-Al2O3 was converted to α-Al2O3 during steaming. After DSS SR of CH4, the 13.5
wt% Ni/γ-Al2O3 showed NiO reflections, indicating that Ni was oxidized to NiO.
3.8. XANES and EXAFS analyses of Pt-doped Ni/Mg(Al)O.
In the Ni K-edge XANES spectra of 0.50 wt% Pt-Ni0.5/Mg2.5(Al)O, a preedge at
8,328 eV and a peak at 8,347 eV, along with three peaks at higher energy, were observed
after calcination (Fig. 7Aa). The peak shape closely resembled that of mixture of NiO
and NiAl2O4 between 8,335 and 8,345 eV reported by Hungría et al. [26]. Because Ni2+
has octahedral coordination in both NiO and Mg(Ni,Al)O periclase, a similar spectrum
can be observed for both samples. After reduction (Fig. 7Ab), the edge position became
close to that of Ni foil (Fig. 7Af), indicating that the lattice Ni2+ in Mg(Al,Ni)O
periclase was reduced to metallic Ni. However, the oscillation above the edge is slightly
different from that of metal foil, i.e., a shoulder peak at 8,330 eV characteristic of the
spectrum for Ni foil was weakened, whilst a sharp peak at 8,347 eV characteristic of the
19

spectrum for NiO was intensified, compared to the spectrum of Ni foil. These
differences suggest that Ni was not fully reduced but existed partly as oxidized state in
Mg(Al,Ni)O [11] as reported on silica-coated Ni catalysts [27]. This well coincided with
ca. 80-90% of reduction degree for Mg(Al,Ni)O periclase [9,23]. After reduction
followed by DSS SR of CH4 (Fig. 7Ac), the peak at 8,347 eV was intensified, whilst the
shoulder at 8,330 eV was weakened, indicating that Ni was oxidized during DSS SR.
After steaming at 900 ºC (Fig. 7Ad), followed by DSS SR of CH4 (Fig. 7Ae), no
significant change appeared in the spectrum, indicating that Ni remained in the metallic
state. In the Fourier transforms of k3-weighted Ni K-edge EXAFS spectra, two peaks
were observed at 1.66 and 2.56 Å (both non-phase shift corrected) for each sample after
calcination (Fig. 7Ba). Hungría et al. [26] reported that two peaks were observed at 1.65
and 2.56 Å (both non-phase shift corrected) for the Fourier transformed EXAFS of NiO
and were assigned to Ni-O and Ni-Ni bonding, respectively. After reduction (Fig. 7Bb),
both peaks at 1.66 and 2.56 Å disappeared and a new peak appeared at 2.13 Å
(non-phase shift corrected), coinciding with that observed for Ni foil as a control (Fig.
7Bf). This bond distance coincided with the value for Ni metal reported by Juan-Juan et
al. [27] and indicated that Ni2+ in Mg2.5(Ni0.5,Al)O periclase was reduced to Ni metal. Pt
apparently showed no effect on the spectra of Ni, because the Pt/Ni molar ratio was too
small (i.e., 1/106) on 0.5 wt% Pt-Ni0.5/Mg2.5(Al)O. After reduction followed by DSS SR
of CH4 (Fig. 7Bc), the peak at 2.13 Å was weakened, whilst both peaks at 1.66 and 2.56
Å were intensified, indicating that Ni was partly oxidized during DSS SR. Both spectra
showed no significant change after steaming at 900 ºC (Fig. 7Bd) and followed by DSS
SR of CH4 (Fig. 7Be), indicating that Ni remained mainly in the metallic state.
In the Pt L3-edge XANES spectra of 0.50 wt% Pt-Ni0.5/Mg2.5(Al)O , an intensified
20
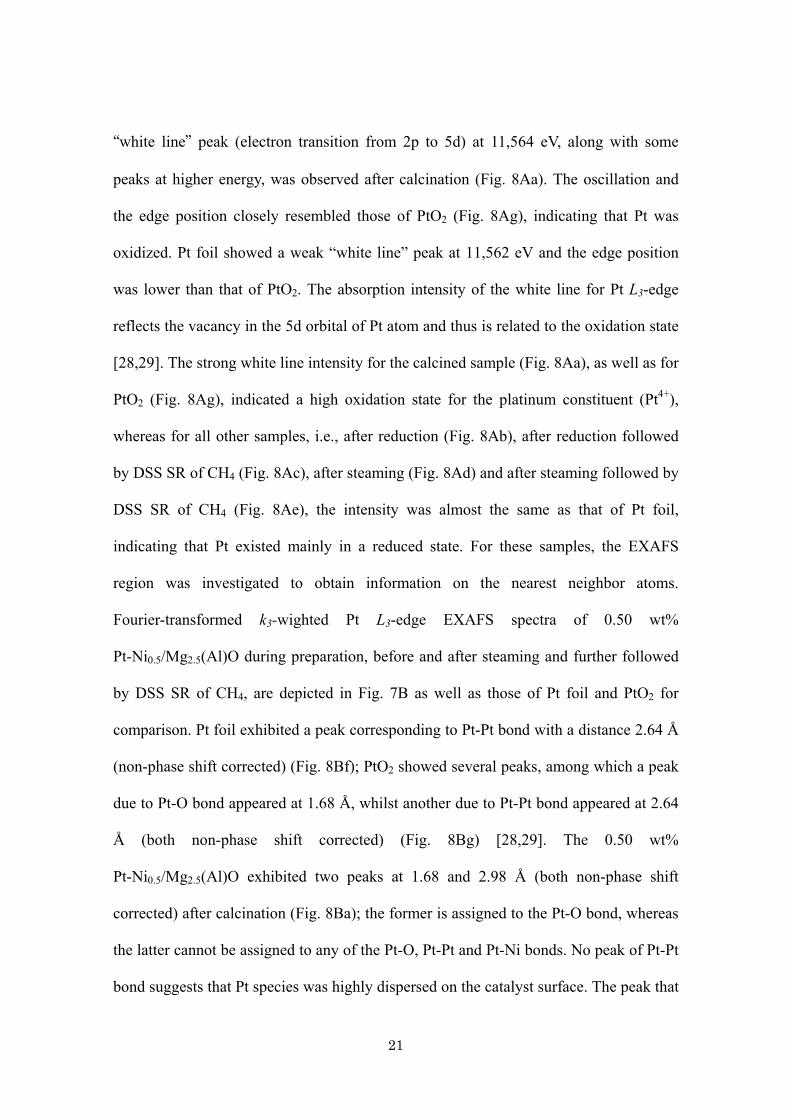
“white line” peak (electron transition from 2p to 5d) at 11,564 eV, along with some
peaks at higher energy, was observed after calcination (Fig. 8Aa). The oscillation and
the edge position closely resembled those of PtO2 (Fig. 8Ag), indicating that Pt was
oxidized. Pt foil showed a weak “white line” peak at 11,562 eV and the edge position
was lower than that of PtO2. The absorption intensity of the white line for Pt L3-edge
reflects the vacancy in the 5d orbital of Pt atom and thus is related to the oxidation state
[28,29]. The strong white line intensity for the calcined sample (Fig. 8Aa), as well as for
PtO2 (Fig. 8Ag), indicated a high oxidation state for the platinum constituent (Pt4+),
whereas for all other samples, i.e., after reduction (Fig. 8Ab), after reduction followed
by DSS SR of CH4 (Fig. 8Ac), after steaming (Fig. 8Ad) and after steaming followed by
DSS SR of CH4 (Fig. 8Ae), the intensity was almost the same as that of Pt foil,
indicating that Pt existed mainly in a reduced state. For these samples, the EXAFS
region was investigated to obtain information on the nearest neighbor atoms.
Fourier-transformed k3-wighted Pt L3-edge EXAFS spectra of 0.50 wt%
Pt-Ni0.5/Mg2.5(Al)O during preparation, before and after steaming and further followed
by DSS SR of CH4, are depicted in Fig. 7B as well as those of Pt foil and PtO2 for
comparison. Pt foil exhibited a peak corresponding to Pt-Pt bond with a distance 2.64 Å
(non-phase shift corrected) (Fig. 8Bf); PtO2 showed several peaks, among which a peak
due to Pt-O bond appeared at 1.68 Å, whilst another due to Pt-Pt bond appeared at 2.64
Å (both non-phase shift corrected) (Fig. 8Bg) [28,29]. The 0.50 wt%
Pt-Ni0.5/Mg2.5(Al)O exhibited two peaks at 1.68 and 2.98 Å (both non-phase shift
corrected) after calcination (Fig. 8Ba); the former is assigned to the Pt-O bond, whereas
the latter cannot be assigned to any of the Pt-O, Pt-Pt and Pt-Ni bonds. No peak of Pt-Pt
bond suggests that Pt species was highly dispersed on the catalyst surface. The peak that
21

appeared at 2.25 Å (non-phase shift corrected) after reduction (Fig. 8Bb) can be
assigned to the Pt-Ni bond because this value is between 2.13 Å (Ni-Ni bond) and 2.64
Å (Pt-Pt bond) observed for Ni foil and Pt foil, respectively. This peak was observed
also after reduction followed by DSS SR of CH4 (Fig. 8Bc); it weakened and shifted
slightly toward a shorter bond length after steaming (Fig. 8Bd), and then it again came
back to the original bond length as well as the original shape after steaming followed by
DSS SR of CH4 (Fig. 8Be). This indicates that the Pt-Ni species was stable and survived
during DSS SR of CH4 and moreover regenerated after steaming followed by DSS SR
of CH4.
4. Discussion
4.1. Self-regenerative activity of Pt-doped Ni/Mg(Al)O.
Curve fitting results of Ni K-edge EXAFS of 0.50 wt% Pt-Ni0.5/Mg2.5(Al)O
together with Ni foil and NiO are summarized in Table 3. No contribution of Ni-Pt was
detected because the molar ratio of Pt/Ni was too small, i.e., 1/106; only Ni-Ni bond was
observed around 2.48 Å for all samples. The Ni-O bond appeared at 2.06 Å when the
sample was reduced followed by DSS SR of CH4, indicating that the surface of Ni
particles was oxidized during DSS SR. Both coordination number and bond length
slightly decreased after steaming, whereas both values were recovered to the original
values after steaming followed by DSS SR.
Table 4 shows curve fitting results of Pt L3-edge EXAFS of 0.50 wt%
Pt-Ni0.5/Mg2.5(Al)O as well as those of Pt foil and PtO2. Neither Pt-Pt bond nor Pt-O
bond was observed but the Pt-Ni bond alone appeared for all samples. The Pt-Ni bond
22

length was 2.53 Å, which is 0.04 Å longer than the Ni-Ni bond in metallic Ni (2.49 Å)
and 0.24 Å shorter than the Pt-Pt bond in metallic Pt (2.77 Å). The coordination number
of Pt-Ni shell was 6.8, far smaller than that of Pt foil (12), suggesting that Pt is located
in the surface layer of Ni particles. In the present work, Pt was doped on Mg(Al,Ni)O
periclase particles by adopting “memory effect” and, therefore, Pt is reasonably located
on the surface of Ni particles after calcination, followed by reduction. A similar location
was previously observed for Ru-Ni [11] and Rh-Ni [15] systems. The coordination
number of the Pt-Ni shell (6.8) was larger than those observed for Ru-Ni (3.5) and
Rh-Ni (5.0), indicating that Pt was more deeply incorporated into Ni particles than Ru
and Rh on 0.50 wt% Ru- and Rh-Ni0.5/Mg2.5(Al)O [11,16]. Moreover, a small increase
in coordination number (7.7) after steaming followed by DSS SR of CH4 indicates that
Pt was even more deeply incorporated during such treatment. We conclude that Pt was
always located mainly in the surface layer of Ni particles during the reaction.
Chen et al. [30] reported that the surfaces of Pt-Ni bimetallic catalysts prepared
by sequential impregnations of Pt and Ni on γ-Al2O3 were always Pt-terminated with
the Pt/Ni ratio of 1/1, regardless of the sequential order, i.e., first with Pt and then with
Ni, or vice versa. This is due to the segregation of Pt to the surface during the hydrogen
reduction, as predicted by means of density functional theory (DFT) modeling and,
moreover, verified experimentally using Auger electron spectroscopy and
high-resolution electron energy loss spectroscopy on single crystal Ni/Pt(111) surfaces
[31]. Contrarily, Tomishige et al. [32] reported that sequential impregnation i.e., first Ni
followed by Pt, exhibited better catalytic performances than co-impregnation methods
in oxidative steam reforming of CH4. In the present work, Pt-Ni/Mg(Al)O catalysts
were prepared by Pt impregnation on Mg(Ni,Al)O periclase, suggesting that Ni particles
23

were originally enriched with Pt in the surface layer. In fact, no significant change was
observed in either the Fourier transforms (Fig. 8Bb-e) or the curve fitting results (Table
4) of Pt L3-edge EXAFS of 0.50 wt% Pt-Ni0.5/Mg2.5(Al)O during the reaction, i.e.,
reduced, reduced-steamed, reduced-DSS and reduced-steamed-DSS. Only the sample
after reduction followed by steaming exhibited a small shift and a shape alteration in
Pt-Ni peak (Fig. 8Bd) and a greater Rf value compared with the other samples (Table 4),
suggesting that the Pt-Ni bimetallic structure was somewhat distorted due to heavy Ni
sintering after steaming. One should notice that the original Pt-Ni bimetallic structure
was recovered by DSS SR of CH4 even after such heavy sintering (Fig. 8Be and Table
4).
TPR curves of 0.10 wt% Pt-Ni0.5/Mg2.5(Al)O after reduction exhibited a single
peak of the Ni2+ → Ni0 reduction at 850 ºC (Fig. 9a). After steaming at 900 ºC, the
reduction peak was usually separated into two peaks, one at 918 ºC and another at 267
ºC (Fig. 9b). It seems that Ni/Mg(Al)O or Mg(Al,Ni)O periclase was reductively
decomposed to large-sized Ni particles and Mg(Al,Ni)O of lower Ni content after
steaming. Part of the Ni2+ ions in Mg2.5(Ni0.5,Al)O periclase were first reduced to Ni
metal, exposed to steaming and finally grew to isolated large-sized Ni particles.
Simultaneously Mg(Al,Ni)O periclase lost a part of Ni2+, was exposed to steaming and
finally formed the sintered structure containing hard-to-reduce Ni2+. The peak at 267 ºC
can be assigned to the isolated Ni particles, whereas the peak at 918 ºC to the
hard-to-reduce Ni2+. At low temperature, some other peaks also appeared at 121 and
200 ºC after steaming, indicating a phase separation of Ni-Pt alloy; Pt exhibited
reduction peaks at 100-200 °C, whereas Ni was reduced at 250-400 °C in the TPR of
supported Pt-Ni bimetallic catalysts [33]. When 0.10 wt% Pt-Ni0.5/Mg2.5(Al)O after
24

steaming was exposed to DSS SR of CH4, the peak at 200 ºC disappeared and the peak
at 267 ºC shifted to a higher temperature of 290 ºC, whereas the peak at 918 ºC
completely shifted toward a lower temperature of 830 ºC (Fig. 9c). These results
suggest that the separated species, i.e., Pt and Ni, were again combined and
reconstituted to the original bimetallic phase on the catalyst; Ni metal particles were
covered by Ni-Pt alloy on the surface as well as Ni2+ in the Mg(Al)O periclase phase.
In the TEM images of 0.10 wt% Pt-Ni0.5/Mg2.5(Al)O (Fig. 6); the large-sized Ni
particles (~40 nm) observed after steaming (Fig. 6A) disappeared and were replaced by
small-sized particles (< 20 nm) after followed further by DSS SR of CH4 (Fig. 6B).
This indicates that the sintered Ni particles were redispersed during DSS SR. The TPR
results given above, along with the XRD (Fig. 5c) and TEM (Fig. 6) observations of
0.10 wt% Pt-Ni0.5/Mg2.5(Al)O after steaming followed by DSS SR of CH4, are
important for understanding the catalytic mechanism. Even after severe passivation by
steaming at 900 °C, the sintered Ni metal particles were redispersed, and the original
active sites were regenerated during DSS SR in the presence of Pt. The sintered Ni
particles must be oxidized to Ni2+ by steam and are possibly incorporated into
Mg(Al,Ni)O periclase. In turn, Ni2+ in Mg(Al,Ni)O periclase can be quickly reduced,
assisted by hydrogen spillover on Pt metal or Pt-Ni alloy. Such reduction-oxidation
between Ni0 and Ni2+ on/in Mg(Ni,Al)O periclase aided by hydrogen spillover on Pt
metal or Pt-Ni alloy effectively contributed to the regeneration of activity on the
Pt-doped Ni/Mg(Al)O catalysts during DSS SR operation.
4.2. Prominent behaviors of Pt-doped Ni/Mg(Al)O.
25

Among Rh, Ru and Pt, Ru is frequently used as a reforming catalyst for PEFCs
due to the low cost [33]. Although Pt is cheaper than Rh, Pt has been used as oxidation
or combustion catalyst but has not been frequently used as a reforming catalyst [36]. Pt
possesses a potential of C-H activation (vide supra) [18]. It has been confirmed that Pt
doping enhances the activity and, moreover, assists the self-regeneration of active Ni
sites on Ni/Mg(Al)O catalyst through CH4 activation followed by hydrogen spillover.
When we consider down stream of H2-production for PEFCs, water-gas shift and
then CO elimination steps follow SR of CH4 [1]. It was reported that steam
condensation heavily sintered and deactivated Cu-catalysts for CO shift reaction [37,38].
Therefore, purging conditions must be selected to avoid steam condensation. In the
present work, steam was replaced totally or partially with air, and the activity of
Pt-Ni0.5/Mg2.5(Al)O was compared with that of Ru-Ni0.5/Mg2.5(Al)O in DSS SR of CH4.
The results are depicted in Fig. 10. Under totally air purging conditions, both catalysts
showed high and stable activity in DSS SR of CH4 between 700 °C and 200 °C (Fig.
10A). Moreover, both CH4 conversion and H2 production rate exhibited no detectable
decrease just after each air purging. This is in contrast to the previous observation, i.e.,
CH4 conversion decreased after every steam purging due to Ni oxidation (Fig. 3) [11].
This indicates that air, or oxygen, as purging gas did not oxidize Ni on either catalyst as
steam during DSS operation. However, the combination of air and steam as purging gas
quickly deactivated 0.10 wt% Ru-Ni0.5/Mg2.5(Al)O; both combined purging of
air-steam-air and steam-air-steam totally deactivated the catalyst after the first purging
(Fig. 10B). On the contrary, 0.10 wt% Pt-Ni0.5/Mg2.5(Al)O was not deactivated by such
combined purging (Fig. 10B). Just after each purging, both CH4 conversion and H2
production rate decreased, but the values gradually increased and the original values
26

were recovered during stationary SR of CH4. This suggests that the regenerative activity
works on the Pt-Ni catalyst even under air-steam combined purging. It is concluded that
Pt-doped Ni/Mg(Al)O is more sustainable than Ru-doped Ni/Mg(Al)O catalyst under
air-steam combined purging.
ATSR seems to be a hopeful candidate for the future PEFCs reformers because
the exothermic oxidation can supply the heat for endothermic steam reforming [39].
ATSR of CH4 was carried out on both Pt- and Ru-Ni0.5/Mg2.5(Al)O catalysts in DSS
mode under steam purging (Fig. 11). When 0.10 wt% Ru-Ni0.5/Mg2.5(Al)O was prepared
by calcination under either N2 or air atmosphere after Ru-doping, the amount of Ru that
obtained was 0.095 and 0.077 wt%, respectively, as seen by ICP analyses. This indicates
that a small amount of Ru sublimated out as RuO4 during calcination in air atmosphere.
Regardless of such differences in Ru doping, both 0.10 wt% Ru-Ni0.5/Mg2.5(Al)O
calcined in air and in N2 exhibited significant deactivation just after the first steam
purging, indicating that 0.10 wt% Ru-doping was not sustainable enough in the steam
purged DSS ATSR of CH4. Even when Ru doping was increased up to 0.50 wt%, the
activity decreased significantly after the first steam purging. This indicates that Ru was
not suitable for DSS ATSR (Fig. 11). Contrarily, 0.10 wt% Pt doping was sustainable
enough for the steam purged DSS ATSR of CH4. We conclude that Pt-doped
Ni/Mg(Al)O is more sustainable than Ru-doped Ni/Mg(Al)O not only in air-steam
purged DSS SR of CH4 but also in steam purged DSS ATSR of CH4.
The Ru K-edge XANES spectra of 0.50 wt% Ru-Ni0.5/Mg2.5(Al)O after reduction,
and after reduction followed by DSS ATSR of CH4, are depicted in Fig. 12A. Ru metal
as a control showed a peak at 22,124 eV, along with a preedge at 22,105 eV and some
characteristic peaks at the higher energy (Fig. 12Aa). These values are slightly lower
27

than those reported by Hosokawa et al. [40] (i.e., a preedge at 22,115 eV and a peak at
22,128 eV). After reduction, 0.50 wt% Ru-Ni0.5/Mg2.5(Al)O showed a peak at 22,124 eV,
along with a pre-edge at 22,105 eV and a shoulder at 22,136 eV (Fig. 12Ab), and some
characteristic peaks at the higher energy. These results suggest that Ru was mainly
reduced to metallic state, but was partly oxidized, judging from the shoulder at 22,136
eV [41]. It was reported that bulk RuO2 on Ru/CeO2 showed a main peak between
22,130 and 22,148 eV [42]. After reduction followed by DSS ATSR of CH4, the
pre-edge at ca. 22,105 eV disappeared and, moreover, the peak at 22,124 eV and
especially the shoulder at 22,136 eV were intensified, indicating that Ru was
considerably oxidized [40,42].
Such Ru oxidation after DSS ATSR of CH4 was also supported by the Fourier
transforms of k3-weighted Ru K-edge EXAFS spectra of 0.50 wt% Ru-Ni0.5/Mg2.5(Al)O
(Fig. 12B). Ru metal as a reference exhibited an intensive peak at 2.27 Å (non-phase
shift corrected), corresponding to the Ru-Ru bond in metallic Ru (Fig. 12Ba) [41]. After
reduction, 0.50 wt% Ru-Ni0.5/Mg2.5(Al)O showed a peak at a little shorter distance, i.e.,
2.08 Å (non-phase shift corrected), tentatively assigned to the Ru-Ni bond due to the
formation of Ni-Ru alloy (Fig. 12Bb). After reduction followed by DSS ATSR of CH4,
the peak shifted toward further shorter distance, i.e., 1.58 Å (non-phase shift corrected),
due to the formation of Ru-O bond [41] by Ru oxidation. We previously reported that
part of Ru was separated as RuO2 from the Ru-Ni binary system when Ru-doped
Ni/Mg(Al)O catalyst was passivated by steaming at 900 ºC [11]. Hosokawa et al. [42]
observed a peak at 3.0 Å (non-phase shift corrected) for bulk RuO2 supported on CeO2
and assigned it to Ru-Ru bonding in the bulk RuO2. In the present work, no such peak
28

was observed (Fig. 12Bc), suggesting that RuO2 was dispersed and isolated on 0.50 wt%
Ru-Ni0.5/Mg2.5(Al)O passivated by DSS ATSR.
Table 5 shows curve fitting results of Ru K-edge EXAFS of 0.50 wt%
Ru-Ni0.5/Mg2.5(Al)O. Neither Ru-Ru nor Ru-O bonds were observed but Ru-Ni bonds
alone appeared for the catalyst after reduction. The Ru-Ni bond length was 2.49 Å, very
close to the Ni-Ni bond in metallic Ni (2.49 Å) and 0.17 Å shorter than the Ru-Ru bond
in metallic Ru (2.66 Å). The coordination number of Ru-Ni shell was 3.7, far smaller
than that of the Ru metal (12), suggesting that Ru is located in the surface layer of Ni
particles, as reported in the previous paper [11]. After reduction followed by DSS ATSR
of CH4, the Ru-Ni shell disappeared and Ru-O shell was found at 2.07 Å, indicating that
Ru was separated as RuO2 from the Ru-Ni binary system. Such phase separation is
reasonably accompanied by the corruption of the active sites, resulting in the catalyst
deactivation due to the Ni oxidation (Fig. 11).
It must be emphasized that trace Pt-doped Ni/Mg(Al)O exhibited sustainable
activity under oxidative conditions, i.e., steam-oxygen mixed purging and ATSR.
Moreover this catalyst was self-activated and exhibited self-regenerative activity as well
as high TOF values in DSS SR of CH4. The self-activation was performed by
hydrogen-spillover from Pt and, moreover, the self-regeneration was achieved by the
continuous rebirth of active Ni species (Scheme 1), that is assisted by both Ni2+ → Ni0
reduction by the hydrogen spillover and by reversible reduction-oxidation between Ni0
and Ni2+ in/on Mg(Ni,Al)O periclase.
5. Conclusion
29

Ni/Mg(Al)O catalyst doped with trace Pt was self-activated and, moreover,
exhibited self-regenerative activity during DSS SR of CH4. Although Ru-Ni/Mg(Al)O
was quickly deactivated, Pt-Ni/Mg(Al)O exhibited sustainable activity under oxidative
conditions. CH4 was dissociatively activated to form hydrogen on Pt; leading to the self
activation via Ni reduction by hydrogen spillover from Pt. Pt-Ni alloy was formed on
the surface of fine Ni particles on the catalysts. The Pt-Ni/Mg(Al)O catalyst was
passivated by oxidative incorporation of Ni0 to Ni2+ in Mg(Ni,Al)O periclase, whereas
trace Pt assisted the regeneration of Ni metal from the Ni2+ by hydrogen spillover. The
self-regeneration of Pt-Ni/Mg(Al)O can be achieved by the continuous rebirth of active
Ni species via reversible reduction-oxidation between Ni0 and Ni2+ in/on Mg(Ni,Al)O
periclase assisted by hydrogen spillover from Pt.
30

References
[1] J.R. Rostrup-Nielsen, Catal. Today 71 (2002) 243-247.
[2] K. Takehira, T. Shishido, P. Wang, T. Kosaka, K. Takaki, Phys. Chem. Chem.
Phys. 5 (2003) 3801-3810.
[3] K. Takehira, T. Shishido, P. Wang, T. Kosaka, K. Takaki, J. Catal. 221 (2004)
43-54.
[4] K. Takehira, T. Kawabata, T. Shishido, K. Murakami, T. Ohi, D. Shoro, M. Honda,
K. Takaki, J. Catal. 231 (2005) 92-104.
[5] V.A. Tsipouriari, Z. Zhang, X.E. Verukios, J. Catal. 179 (1998) 283-291.
[6] H.S. Bengaard, J.K. Nørskov, J. Sehested, B.S. Clausen, L.P. Nielsen, A.M.
Molenbroek, J.R. Rostrup-Nielsen, J. Catal. 209 (2002) 365-384.
[7] T. Ohi, T. Miyata, D. Li, T. Shishido, T. Kawabata, T. Sano, K. Takehira, Appl.
Catal. A 308 (2006) 194-203.
[8] T. Miyata, D. Li, M. Shiraga, T. Shishido, Y. Oumi, T. Sano, K. Takehira, Appl.
Catal. A 310 (2006) 97-104.
[9] T. Miyata, M. Shiraga, D. Li, I. Atake, T. Shishido, Y. Oumi, T. Sano, K. Takehira,
Catal. Commun. 8 (2007) 447-451.
[10] M. Shiraga, D. Li, I. Atake, T. Shishido, Y. Oumi, T. Sano, K. Takehira, Appl.
Catal. A 318 (2007) 143-154.
[11] D. Li, I. Atake, T. Shishido, Y. Oumi, T. Sano, K. Takehira, J. Catal. 250 (2007)
299-312.
[12] F. Basile, G. Fornasari, E. Pluzzi, A. Vaccari, Appl. Clay Sci. 13 (1998) 329-345.
[13] J. W. Cook, D.E. Sayers, J. Appl. Phys. 52 (1981) 5024-5031.
31

[14] A.L. Ankudinov, B. Ravel, J.J. Rehr, S.D. Conradson, Phys. Rev. B 58 (1998)
7565-7576.
[15] C.H. Bartholomew, R.B. Pannell, J.L. Butler, J. Catal. 65 (1980) 335-347.
[16] D. Li, T. Shishido, Y. Oumi, T. Sano, K. Takehira, Appl. Catal. A 332 (2007)
98-109.
[17] M.-S. Liao, Q.-E Zhang, J. Mol. Catal. A 136 (1998) 185-194.
[18] C.-T. Au, C.-F. Ng, M.-S. Liao, J. Catal. 185 (1999) 12-22.
[19] C.-T. Au, H.-Y. Wang, J. Catal. 167 (1997) 337-345.
[20] C.-T. Au, M.-S. Liao, C.-F. Ng, J. Phys. Chem. A 102 (1998) 3959-3969.
[21] J.H. Eun, J.H. Lee, S.G. Kim, M.Y. Um, S.Y. Park, H.J. Kim, Thin Solid Films
435 (2003) 199-204.
[22] N. Sahli, C. Petit, A.C. Roger, A. Kienneman, S. Libs, M.M. Bettebar, Catal.
Today 113 (2006) 187-193.
[23] L. Hu, K.A. Boateng, J. M. Hill, J. Mol. Catal. A 259 (2006) 51-60.
[24] A. Olafsen, Å. Slagtern, I.M. Dahl, U. Olsbye, Y. Schuurman, C. Mirodatos, J.
Catal. 229 (2005) 163-175.
[25] M.C.J. Bradford, M.A. Vannice, Appl. Catal. A 142 (1996) 73-96.
[26] A.B. Hungría, N.D. Browning, R.P. Erni, M. Fernández-García, J.C. Conesa, J.A.
Pérez-Omil, A. Martínez-Arias, J. Catal. 235 (2005) 251-261.
[27] J. Juan-Juan, M.C. Román-Martínez, M.J. Illán-Gómez, Appl. Catal. A 301
(2006) 9-15.
[28] S. Hamada, K. Ikeue, M. Machida, Appl. Catal. B 71 (2007) 1-6.
[29] M. Casapu, J.-D. Grunwaldt, M. Maciejewski, A. Baiker, S. Eckhoff, U. Göbel, M.
Wittrock, J. Catal. 251 (2007) 28-38.
32

[30] Y. Shu, L.E. Murillo, J.P. Bosco, W. Hang, A.I. Frenkel, J.G. Chen, Appl. Catal.
A 339 (2008) 169-179.
[31] C.A. Menning, H.H. Hwu, J.G. Chen, J. Phys. Chem. B 110 (2006) 15471-15477.
[32] B. Li, S. Kado, Y. Mukainakano, T. Miyazawa, T. Miyao, S. Naito, K. Okumura,
K. Kunimori, K. Tomishige, J. Catal. 245 (2007) 144-155.
[33] B. Pawelec, S. Damynova, K. Arishtirova, J.L.G. Fierro, L. Petrov, Appl. Catal. A
323 (2007) 188-201.
[34] T. Suzuki, H. Iwanami, T. Yoshinari, Int. J. Hydrogen Energy 25 (2000) 119-126.
[35] J. Zheng, J.J. Strohm, C. Song, Fuel Process. Technol. 89 (2008) 440-448.
[36] T.F. Garetto, E. Rincón, C.R. Apesteguía, Appl. Catal. B 73 (2007) 65-72.
[37] O. Ilinich, W. Ruettinger, X.-S Liu, R. Farrauto, J. Catal. 247 (2007) 112-118.
[38] K. Nishida, I. Atake, D. Li, T. Shishido, Y. Oumi, T. Sano, K. Takehira, Appl.
Catal. A 337 (2008) 48-57.
[39] B.J. Dreyer, I.C. Lee, J.J. Krummenacher, L.D. Schmidt, Appl. Catal. A 307 (2006)
184-194.
[40] S. Hosokawa, S. Nogawa, M. Taniguchi, K. Utani, H. Kanai, S. Imamura, Appl.
Catal. A 288 (2005) 67-73.
[41] C. Roth, N. Benker, M. Mazurek, F. Scheiba, H. Fuess, Appl. Catal. A 319 (2007)
81-90.
[42] S. Hosokawa, M. Taniguchi, K. Utani, H. Kanai, S. Imamura, Appl. Catal. A 289
(2005) 115-120.
33

Figure captions
Fig. 1 Self-activation of Pt-, Rh- and Ru-Ni0.5/Mg2.5(Al)O with various doping
amounts in stationary SR of CH4.
●, 0.50 wt% Pt-Ni0.5/Mg2.5(Al)O; ■, 0.10 wt% Pt-Ni0.5/Mg2.5(Al)O; ▲, 0.05
wt% Pt-Ni0.5/Mg2.5(Al)O; ♦, 0.01 wt% Pt-Ni0.5/Mg2.5(Al)O; ○, 0.50 wt%
Rh-Ni0.5/Mg2.5(Al)O; □, 0.10 wt% Rh-Ni0.5/Mg2.5(Al)O; ∆, 0.05 wt%
Rh-Ni0.5/Mg2.5(Al)O; ×, 0.50 wt% Ru-Ni0.5/Mg2.5(Al)O; +, 0.10 wt%
Ru-Ni0.5/Mg2.5(Al)O.
Fig. 2 Self-activation of Pt-, Rh- and Ru-Ni0.5/Mg2.5(Al)O with various doping
amounts in stationary PO of CH4.
●, 0.50 wt% Pt-Ni0.5/Mg2.5(Al)O; ■, 0.10 wt% Pt-Ni0.5/Mg2.5(Al)O; ▲, 0.05
wt% Pt-Ni0.5/Mg2.5(Al)O; ♦, 0.01 wt% Pt-Ni0.5/Mg2.5(Al)O; ○, 0.50 wt%
Rh-Ni0.5/Mg2.5(Al)O; □, 0.10 wt% Rh-Ni0.5/Mg2.5(Al)O; ×, 0.50 wt%
Ru-Ni0.5/Mg2.5(Al)O; +, 0.10 wt% Ru-Ni0.5/Mg2.5(Al)O.
Fig. 3 DSS SR of CH4 over Pt-Ni0.5/Mg2.5(Al)O with various Pt doping percentages
under steam purging.
Full line, CH4 conversion; dotted line, rate of H2 production.
○, 0.01 wt% Pt-Ni0.5/Mg2.5(Al)O; □, 0.03 wt% Pt-Ni0.5/Mg2.5(Al)O; ■, 0.05
wt% Pt-Ni0.5/Mg2.5(Al)O; ●, 0.10 wt% Pt-Ni0.5/Mg2.5(Al)O; ▲, 0.50 wt%
Pt-Ni0.5/Mg2.5(Al)O.
Fig. 4 Comparison of the activity of supported Ni catalysts before and after steaming
at 900 ºC for 10 h in steam purged DSS SR of CH4.
Full line, before steaming; dotted line, after steaming.
34

Reaction conditions: CH4/H2O/N2 = 50/100/25 ml min-1; 700 ºC; catalyst, 50
mg.
●, 0.10 wt% Pt-Ni0.5/Mg2.5(Al)O; ○, Ni0.5/Mg2.5(Al)O; ▲, 13.5 wt%
Ni/γ-Al2O3.
Fig. 5 XRD patterns of 0.1 wt% Pt-Ni0.5/Mg2.5(Al)O after reduction, after steaming at
900 ºC and after further followed by steam purged DSS SR of CH4.
a) 0.10 wt% Pt-Ni0.5/Mg2.5(Al)O after reduction; b) 0.10 wt%
Pt-Ni0.5/Mg2.5(Al)O after steaming at 900 ºC; c) 0.10 wt% Pt-Ni0.5/Mg2.5(Al)O
after steaming at 900 ºC followed by the DSS SR.
●, Ni metal; ○, Mg(Ni,Al)O periclase; □, MgAl2O4 spinel.
Fig. 6 TEM images of 0.10 wt% Pt-Ni0.5/Mg2.5(Al)O after steaming (A) and after
further followed by DSS SR of CH4 (B).
Fig. 7 Ni K-edge XANES (A) and Fourier transforms of k3-weighted Ni K-edge
EXAFS (B) spectra of 0.50 wt% Pt-Ni0.5/Mg2.5(Al)O during preparation,
before and after steaming and further followed by DSS SR of CH4.
a) after calcination; b) after reduction; c) after reduction followed by DSS SR;
d) after steaming at 900 ºC; e) after steaming followed by DSS SR; f) Ni foil.
Fig. 8 Pt L3-edge XANES (A) and Fourier transforms of k3-weighted Pt L3-edge
EXAFS (B) of 0.50 wt% Pt-Ni0.5/Mg2.5(Al)O during preparation, before and
after steaming and further followed by DSS SR of CH4.
A’; A at higher magnification.
a) after calcination; b) after reduction; c) after reduction followed by DSS SR;
d) after steaming at 900 ºC; e) after steaming followed by DSS SR; f) Pt foil;
g) PtO2.
35

Fig. 9 TPR profiles of 0.10 wt% Pt-Ni0.5/Mg2.5(Al)O before and after steaming at 900
ºC followed by DSS SR of CH4.
a) after reduction; b) after steaming at 900 ºC; c) after steaming at 900 ºC
followed by DSS SR.
Fig. 10 Comparison of the activities of Pt-Ni0.5/Mg2.5(Al)O and Ru-Ni0.5/Mg2.5(Al)O
in DSS SR of CH4 under various purging conditions.
Full line, CH4 conversion; dotted line, rate of H2 production.
A, ●, 0.10 wt% Pt-Ni0.5/Mg2.5(Al)O under air purging; ■, 0.10 wt%
Ru-Ni0.5/Mg2.5(Al)O under air purging.
B, ●, 0.10 wt% Pt-Ni0.5/Mg2.5(Al)O under air-steam-air purging; ■, 0.10 wt%
Ru-Ni0.5/Mg2.5(Al)O under air-steam-air purging; ○, 0.10 wt%
Pt-Ni0.5/Mg2.5(Al)O under steam-air-steam purging; □0.10 wt%
Ru-Ni0.5/Mg2.5(Al)O under steam-air-steam purging;
Fig. 11 Comparison of the activities of Pt-Ni0.5/Mg2.5(Al)O and Ru-Ni0.5/Mg2.5(Al)O
in DSS ASTR of CH4.
Full line, CH4 conversion; dotted line, rate of H2 production.
●, 0.10 wt% Pt-Ni0.5/Mg2.5(Al)O; ○, 0.50 wt% Ru-Ni0.5/Mg2.5(Al)O; ■, 0.10
wt% Ru-Ni0.5/Mg2.5(Al)O calcined in air; ▲, 0.10 wt% Ru-Ni0.5/Mg2.5(Al)O
calcined in N2.
Fig. 12 Ru K-edge XANES (A) and Fourier transforms of k3-weighted Ru K-edge
EXAFS (B) spectra of 0.50 wt% R-Ni0.5/Mg2.5(Al)O before and after DSS
ASTR of CH4.
a) Ru foil; b) 0.50 wt% Ru-Ni0.5/Mg2.5(Al)O after reduction; c) 0.50 wt%
Ru-Ni0.5/Mg2.5(Al)O after DSS ASTR.
36

37
Scheme 1. The self-activation and self-regenerative activity of trace Pt-doped
Ni/Mg(Al)O catalyst.

Table 1. Physicochemical properties of supported metal catalysts before and after steaming.a
Ni (Ru) particle size (nm) Specific surface
areab (m2 gcat-1)
H2 uptakec
(μmol gcat-1)
Dispersiond
(%) XRDe H2 uptakefCatalyst
Before After Before After Before After Before After Afterg Before After
Ni0.5/Mg2.5(Al)O 173.6 56.8 120.7 40.2 13.1 4.4 6.8 18.4 n.d. 7.4 22.3
13.5 wt% Ni/γ-Al2O3 106.8 61.0 74.4 19.3 8.1 2.1 9.0 21.0 n.d. 12.0 46.4
0.01 wt% Pt-Ni0.5/Mg2.5(Al)O 142.8 160.2 14.6 6.3 6.6
0.05 wt% Pt-Ni0.5/Mg2.5(Al)O 144.0 169.9 15.5 6.4 6.3
0.1 wt% Pt-Ni0.5/Mg2.5(Al)O 141.2 56.9 225.3 44.3 20.6 4.0 5.5 16.5 10.0 4.7 24.0
0.5 wt% Pt-Ni0.5/Mg2.5(Al)O 152.0 224.1 20.5 5.1 4.7
a Steaming was carried out at 900 ºC for 10 h in a H2/H2O/N2 (20/100/25 ml min-1). b The catalysts were calcined at 800 ºC for 5 h before catalytic tests. c Determined by H2 pulse method. d Calculated from the H2 uptake assuming the reduction degree of 80 % for hydrotalcite derived catalysts [15,39] and 100 % for impregnated catalysts. e Calculated from the full width at half maximum of Ni (200) and Ru (101) reflections in the XRD using the Scherrer equation. f Calculated using a equation: d = 971/(%D)/10 where D is a dispersion [29]. g After steaming at 900 ºC, followed by steam purged DSS SR operation between 200 and 700 ºC.
38

Table 2. Turnover frequency of supported Ni catalysts before and after steaming.a,b
CH4 conversion
(%)
TOF-sc
(s-1)
TOF-td
(s-1) Before
or
After
Catalyst 500 ºC 600 ºC
H2 uptake
(μmol gcat-1) 500 ºC 600 ºC 500 ºC 600 ºC
Ni0.5/Mg2.5(Al)Oe 14.6 43.5 163.2 2.95 8.81 0.35 1.06
0.10 wt% Ru-Ni0.5/Mg2.5(Al)Oe 12.8 37.7 213.4 1.99 5.84 0.31 0.93
0.10 wt% Pt-Ni0.5/Mg2.5(Al)Oe 13.7 38.0 205.0 2.20 6.12 0.33 0.92 Before
13.5 wt% Ni/γ-Al2O3f 9.35 29.3 71.1 4.35 13.6 0.27 0.84
Ni0.5/Mg2.5(Al)Oe 5.42 25.9 26.6 6.73 32.1 0.13 0.63
0.10 wt% Ru-Ni0.5/Mg2.5(Al)Oe 10.3 37.1 55.3 6.14 22.2 0.25 0.90
0.10 wt% Pt-Ni0.5/Mg2.5(Al)Oe 7.43 30.5 52.3 4.70 19.3 0.18 0.74 After
13.5 wt% Ni/γ-Al2O3f 3.75 11.9 24.0 5.16 16.3 0.09 0.29
a Steaming was carried out at 900 ºC for 10 h in a H2/H2O/N2 (20/100/25 ml min-1). The catalysts were used as powders of 0.075-0.180 mm in diameter. b SR of methane was carried out between 500-600 ºC in a CH4/H2O/N2 (88.8/177.6/44.4 ml min-1) at the GHSV of 1.6 × 10⁶ ml gcat
-1 h-1e or 3.6 × 10⁵ ml gcat-1 h-1f after prereduction at 900 ºC for 0.5 h.
c TOF value was calculated based on surface Ni amount. d TOF value was calculated based on total Ni amount.
39

Table 3. Curve fitting results of Ni K-edge EXAFS of 0.5wt%Pt-Ni0.5/Mg2.5(Al)O after reduction, steaming and DSS SR of CH4
a
ΔE0 Rf
a C.N., coordination number; R, bond length / Å; ΔE0 , difference in the origin of photoelectron energy between the reference and the sample.; σ, Debye-Waller factor / Å; Rf , residual factor. b *R = 1.72 - 2.65 Å, *k = 4 - 15.5 Å-1. c *R = 1.09 - 2.65 Å, *k = 4 - 15.5 Å-1. d Data from X-ray crystallography.
Sample Shells C.N. R σ
/ Å / Å / eV / %
reduced b Ni-Ni 7.9±1.3 2.49±0.01 0.072±0.02 -0.2±2.3 7.3
reduced-steamed b Ni-Ni 7.2±1.3 2.48±0.01 0.059±0.02 -9.9±2.4 7.2
reduced-DSS c Ni-Ni 6.8±2.4 2.46±0.02 0.099±0.02 5.3±5.2 10.3
Ni-O 2.3±3.5 2.06±0.12 0.091±0.04 -10.8±5.9
reduced-steamed-DSS b Ni-Ni 8.5±1.5 2.48±0.01 0.068±0.02 -2.7±2.3 4.5
NiOd Ni-O 6 2.02
Ni foild Ni-Ni 12 2.49
40

Table 4. Curve fitting results of Pt L3-edge EXAFS of 0.5wt%Pt-Ni0.5/Mg2.5(Al)O after reduction, steaming and DSS SR of
CH4a
σ
/ Å
ΔE0
/ eV
Rf
/ %
a C.N., coordination number; R, bond length / Å; ΔE0 , difference in the origin of photoelectron energy between the reference and the sample.; σ, Debye-Waller factor / Å; Rf , residual factor. b *R = 1.78 - 2.57 Å, *k = 4 - 16.0 Å-1. c Data from X-ray crystallography.
Sample Shells C.N. R
/ Å
reduced b Pt-Ni 6.8±1.1 2.53±0.01 0.074±0.01 9.4±2.2 3.4
reduced-steamed b Pt-Ni 6.7±1.1 2.52±0.01 0.090±0.01 1.9±2.3 19.5
reduced-DSS b Pt-Ni 6.8±1.1 2.53±0.01 0.073±0.01 9.8±2.2 8.5
reduced-steamed-DSS b Pt-Ni 7.7±1.2 2.54±0.01 0.081±0.01 9.8±2.2 5.4
PtO2c Pt-O 6 1.99
Pt foilc Pt-Pt 12 2.77
41

a C.N., coordination number; R, bond length / Å; ΔE0 , difference in the origin of photoelectron energy between the reference and the sample.; σ, Debye-Waller factor / Å; Rf , residual factor.
Table.5. Curve fitting results of Ru K-edge EXAFS of the 0.5wt%Ru-Ni0.5/Mg2.5(Al)O catalyst after reduction
and DSS ATSR of CH4a
Ru-Ni 3.7±0.8 2.49±0.01 0.079±0.02 -12.9±2.9 3.0
42
b After reduction. c After DSS ATSR.
Sample Shells C.N. R
/ Å
σ
/ Å
ΔE0
/ eV
Rf
/ %
0.5 wt% Ru-Ni0.5/Mg2.5(Al)Ob
0.5 wt% Ru-Ni0.5/Mg2.5(Al)Oc Ru-O 3.8±0.6 2.07±0.01 0.064±0.02 9.2±2.0 0.8
RuO2 Ru-O 6
2.66 12 Ru-RuRu metal

Figure 1. K. Takehira et al
0
20
40
60
80
100
0 50 100 150 200
Time on stream / min
CH
4 con
vers
ion
/ %
80
85
90
95
0 20 40 60 80Time on stream / min
CH
4 con
vers
ion
/ %
43

Figure 2. K. Takehira et al.
0
20
40
60
80
100
0 50 100 150 200
Time on stream / min
CH
4 con
vers
ion
/ %
75
76
77
78
0 20 40 60 80Time on stream / min
CH
4 con
vers
ion
/ %
44

Figure 3. K. Takehira et al.
0
20
40
60
80
100
0 60 120 180 240
Time on stream / min
CH
4
0
2
4
6
8
10
Rat
e of
H2 p
rodu
ctio
n / m
ol h-1
gca
t-1
n /
ioer
snv
co
%
45

Figure 4. K. Takehira et al.
0
20
40
60
80
100
0 90 180 270 360
Time on stream / min
CH
4 con
vers
ion
/ %
90
92
94
96
98
0 90 180 270 360Time on stream / min
CH
4 con
vers
ion
/ %
46

Figure 5. K. Takehira et al.
5 10 15 20 25 30 35 40 45 50 55 60 65 70 75 80
2 theta / degree
Inte
nsity
/ cp
s
2 kcps
a)
b)
c)
●
●
●
●
●
●
○
○
○
○
○
○
○
○
○
□□
□□
□□□
□
□□ □□
Inte
nsity
/ cp
s
47

48
Figure 6. K. Takehira et al.
20 nm
20 nm
A
B

Figure 7. K. Takehira et al.
8310 8330 8350 8370 8390
Photon energy / eV
Nor
mal
ized
inte
nsity
a)
b)
c)
d)
e)
f)A
0 1 2 3 4 5 6
R / Å
|FT|
a)
b)
c)
d)
e)
f)
B
49

Figure 8. K. Takehira et al.
11540 11560 11580 11600 11620
Photon energy / eV
Nor
mal
ized
inte
nsity
a)b)c)d)
e)
f)
g)
A
0 1 2 3 4 5 6R / Å
|FT|
B
a)
b)
c)
d)
e)
f)
g)
11560 11565
a)
b)c)d)e)
f)
g)A'
50

100 200 300 400 500 600 700 800 900 1000 1100
Temperature / °C
H2 c
onsu
mpt
ion
rate
/ a.
u.
a)
b)
c)
51
Figure 9. K. Takehira et al.

Figure 10. K. Takehira et al.
0
20
40
60
80
100
0 60 120 180
Time on stream / min
CH
4 con
vers
ion
0
2
4
6
8
10
Rat
e of
H2 p
rodu
ctio
n / m
ol h-1
gca
t-1B
0
20
40
60
80
100
0 60 120 180 240
Time on stream / min
CH
4 con
vers
ion
/ %
0
2
4
6
8
10
Rat
e of
H2 p
rodu
ctio
n / m
ol h-1
gca
t-1
A
52

53
Figure 11. K. Takehira et al.
0
20
40
60
80
100
0
4
0
1
2
3
4
5
6
Rat
e of
H2 p
rodu
ctio
n / m
ol h-1
gca
t-190 180 270 360
Time on stream / min
CH
con
vers
ion
/ %

22080 22100 22120 22140
Photon enerygy / eV
Nor
mal
ized
inte
nsity
a)
b)
Ac)
0 1 2 3 4 5 6
R / Å
|FT|
a)
b)
B
c)
54
Figure 12. K. Takehira et al.

Scheme 1. K. Takehira et al.
NiPt
Pt
Mg2+ Al3+Ni2+ Ni2+
HCH4
Mg2+ Al3+
H
Mg2+ Al3+Ni2+
PtNi
NiPtNiPt
Pt
Mg2+ Al3+Ni2+ Ni2+Pt
Mg2+ Al3+Ni2+ Ni2+
Mg2+ Al3+Ni2+ Ni2+
HCH4
Mg2+ Al3+Mg2+ Al3+
H
Mg2+ Al3+Ni2+
Mg2+ Al3+Ni2+
PtNiPtNi
55