superior industries international - supind.com · superior industries international . nyse: ......
TRANSCRIPT

First Quarter 2015 Earnings Conference Call
May 06, 2015
Superior Industries
International
NYSE: SUP

Non-GAAP Financial Measures and Forward-Looking Statements
Forward-Looking Statements
This webcast and presentation contains statements that are forward-looking statements within the meaning of the Private Securities Litigation Reform Act of 1995. Forward looking statements include all statements that do not relate solely to historical or current facts and can generally be identified by the use of future dates or words such as "may," "should," "could," “will,” "expects," "seeks to," "anticipates," "plans," "believes," "estimates," "intends," "predicts," "projects," "potential" or "continue" or the negative of such terms and other comparable terminology. These statements also include, but are not limited to, the 2015 outlook and projections for reported net sales, value-added sales, EBITDA margin, capital expenditures and the change in working capital, improving operational efficiencies, and sales volume comparisons for the second quarter and second half of 2015, and are based on current expectations, estimates and projections about the company's business based, in part, on assumptions made by management. These statements are not guarantees of future performance and involve risks, uncertainties and assumptions that are difficult to predict. Therefore, actual outcomes and results may differ materially from what is expressed or forecasted in such forward-looking statements due to numerous factors, risks and uncertainties discussed from time to time in the company's Securities and Exchange Commission filings and reports, including the company's most recent Annual Report on Form 10-K and subsequent filings. You are cautioned not to unduly rely on such forward looking statements when evaluating the information presented in this press release. Such forward-looking statements speak only as of the date on which they are made and the company does not undertake any obligation to update any forward-looking statement to reflect events or circumstances after the date of this webcast or presentation. Use of Non-GAAP Financial Measures In addition to the results reported in accordance with GAAP included throughout this earnings release, this release refers to “Adjusted EBITDA,” which we have defined as earnings before interest, taxes, depreciation, amortization, restructuring charges and impairments of long-lived assets and “Value-Added Sales” which we define as net sales less upcharges primarily for the aluminum value in net sales. Adjusted EBITDA as a percentage of valued added sales is a key measure that is not calculated according to GAAP. Adjusted EBITDA as a percentage of value added sales is defined as Adjusted EBITDA divided by Valued Added Sales. Management believes the non-GAAP financial measures used in this presentation are useful to both management and investors in their analysis of the Company’s financial position and results of operations. This non-GAAP financial information is provided as additional information for investors and is not in accordance with or an alternative to GAAP. These non-GAAP measures may be different from similar measures used by other companies.
For reconciliations of these non-GAAP financial measures to the most directly comparable financial measures calculated and presented in accordance with GAAP, see the supplemental data pages attached to the Company’s press release on First Quarter 2015 Financial Results which, together with the press release have been posted on the Company’s website through the “investor” link at [www.supind.com].
We have not quantitatively reconciled differences between valued-added sales , EBITDA and EBITDA margins and their corresponding GAAP measures, in our 2015 Outlook, due to the inherent uncertainty regarding variables affecting the comparison of these forward-looking measures. The magnitude of these differences, however, may be significant.
2

First Quarter Highlights
3
Lower unit volumes impacted financial results o Net Sales of $173.7M; Value-Added sales of $82.3M
o Unit shipments declined 293k units
o Adjusted EBITDA of $13.4M, 16.3% as percentage of Value-Added Sales
o 52 basis point improvement despite 12% decline in value-added sales
o Net income of $4.3M or $0.16 per diluted share
o Includes $1.9M pretax, $1.2M after tax or $0.04 per share, in costs associated with the closing of manufacturing facility in Rogers, Arkansas
Q1 Financial Highlights
Q1 Business Highlights
Focused on becoming more efficient and operationally stronger organization
o Commercial production underway at new facility in Mexico which will help to lower overall cost structure and provide more flexibility o Ramp up will continue throughout 2015; expect to reach full capacity by year-end o Expansion to add 500k wheels capacity per year progressing smoothly o Mexico JV finishing facility increasing competitiveness o Aligning workforce with volume
Improvements in safety and quality Relocation of corporate headquarters to Michigan Continued commitment to returning cash to shareholders
o Paid quarterly dividend of $0.18 o Repurchased 108K shares for $2.1 M through Q1, 319K shares for $6.1 through May 5, 2015

Strategic Priorities
Improving global competitiveness
Building on culture of product innovation and technology
Evaluating opportunities for disciplined growth and value creation
Balanced approach to capital allocation
Increasing visibility with financial community
4

QOQ Comparison NA Light Vehicle Production Superior Shipments
1Q15 4.25 2.54 1Q14 4.18 2.83
% Change 1.6% (10%)
Superior Shipments – Year-over-Year Quarterly Comparison
5
SUP shipments totaled 2.54 million, down 10% from prior year period o Significant declines in:
o Ford F-Series: down (160K) units or (32%) y-o-y o Ford Edge: down (81K) units, or (77%) y-o-y o Nissan Maxima: down (56K) units, or (98%) y-o-y o Chrysler Town & Country: down (51K) units, or (52%) y-o-y
o Partially mitigated by increases in: o Ford Focus: up 82K units, or 9000% y-o-y o Ford Explorer: up 46K units, or 31% y-o-y o K2XX: up 43K units, or 10% o Toyota Highlander: up 42K units, or 45% y-o-y
Lower unit shipments had $17 million negative impact on sales
As expected, shipments will continue to be low in second quarter; volume picture is expected to improve significantly in 2H due to SUP customer demand
Units (in millions)
Superior’s year-over-year quarterly shipment comparison was down.
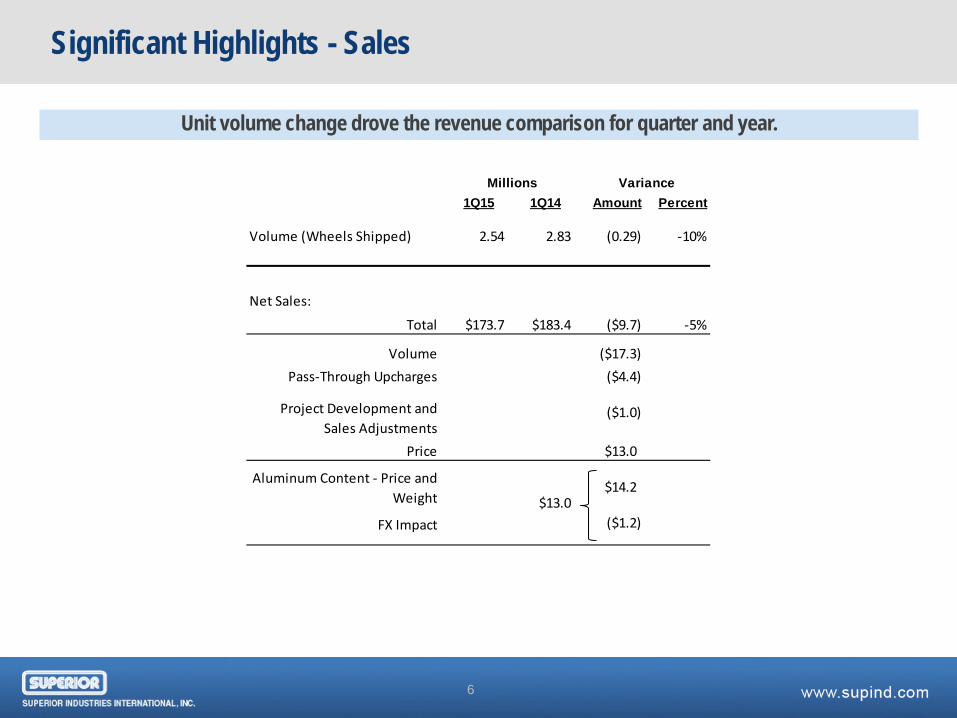
Significant Highlights - Sales
6
Unit volume change drove the revenue comparison for quarter and year.
1Q15 1Q14 Amount Percent
Volume (Wheels Shipped) 2.54 2.83 (0.29) -10%
Net Sales:
Total $173.7 $183.4 ($9.7) -5%
Volume ($17.3)Pass-Through Upcharges ($4.4)
Project Development and Sales Adjustments
($1.0)
Price $13.0
Aluminum Content - Price and Weight
$14.2
FX Impact ($1.2)
Millions Variance
$13.0

1Q EBITDA Comparison – Year Over Year
7
The volume decline and mix directly drove lower EBITDA. Restructuring costs and metal timing also impacted the comparison. Operating cost performance was favorable.
Volume & Mix - Decrease of (293K) units; fewer premium content wheels shipped
Metal – Aluminum pass through timing difference on adjustments with customers vs. suppliers
Cost Performance – Primarily efficiencies gained from restructuring manufacturing footprint, lower energy, maintenance and labor cost. partially offset by increased severance
Rogers Shutdown Expense - $1.4M in 1Q15 for plant decommissioning; none in 1Q14
Other – Long list of items in this category
$14.8
$12.0
$(4.5)
$(2.0)
$6.8 $(1.4)
$(1.7)
$2.5
$4.5
$6.5
$8.5
$10.5
$12.5
$14.5
$16.5
EBITDA 1Q14A Volume & Mix Metal Cost Performance Rogers Restructuring Cost Other EBITDA 1Q15A
EBIT
DA i
n m
illio
ns
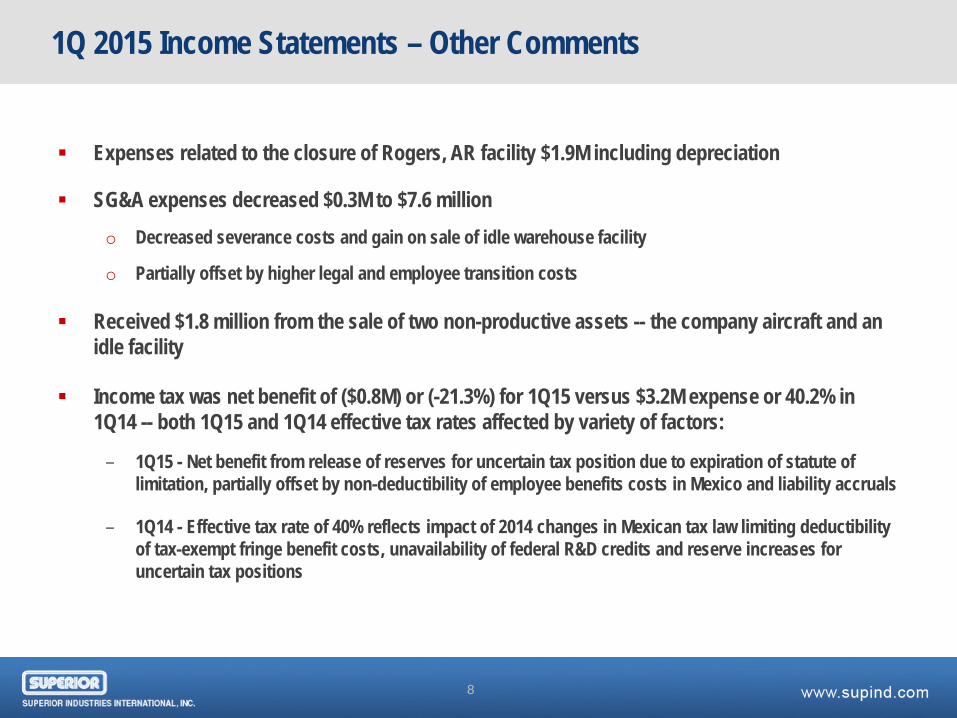
1Q 2015 Income Statements – Other Comments
8
Expenses related to the closure of Rogers, AR facility $1.9M including depreciation
SG&A expenses decreased $0.3M to $7.6 million o Decreased severance costs and gain on sale of idle warehouse facility
o Partially offset by higher legal and employee transition costs
Received $1.8 million from the sale of two non-productive assets -- the company aircraft and an idle facility
Income tax was net benefit of ($0.8M) or (-21.3%) for 1Q15 versus $3.2M expense or 40.2% in 1Q14 -- both 1Q15 and 1Q14 effective tax rates affected by variety of factors:
– 1Q15 - Net benefit from release of reserves for uncertain tax position due to expiration of statute of limitation, partially offset by non-deductibility of employee benefits costs in Mexico and liability accruals
– 1Q14 - Effective tax rate of 40% reflects impact of 2014 changes in Mexican tax law limiting deductibility of tax-exempt fringe benefit costs, unavailability of federal R&D credits and reserve increases for uncertain tax positions

Cash Flow Comments
9
Operating cash flow increased $9.7 million vs. prior year
Operating working capital¹ use improved $12.8 million
Capital expenditures were $15.0 million -- $10.4 million decline from 2014
o Existing facilities $ 7.1M o New facility $ 7.9M o Total 1Q15 $ 15.0M
Announced new $30 million share repurchase program in October 2014
o 108K shares / $2.1 million repurchased in 1Q15 o 319K shares /$6.1 million repurchased through May 5, 2015
Note 1 – Operating working capital includes accounts receivable, inventory, prepaid aluminum and accounts payable
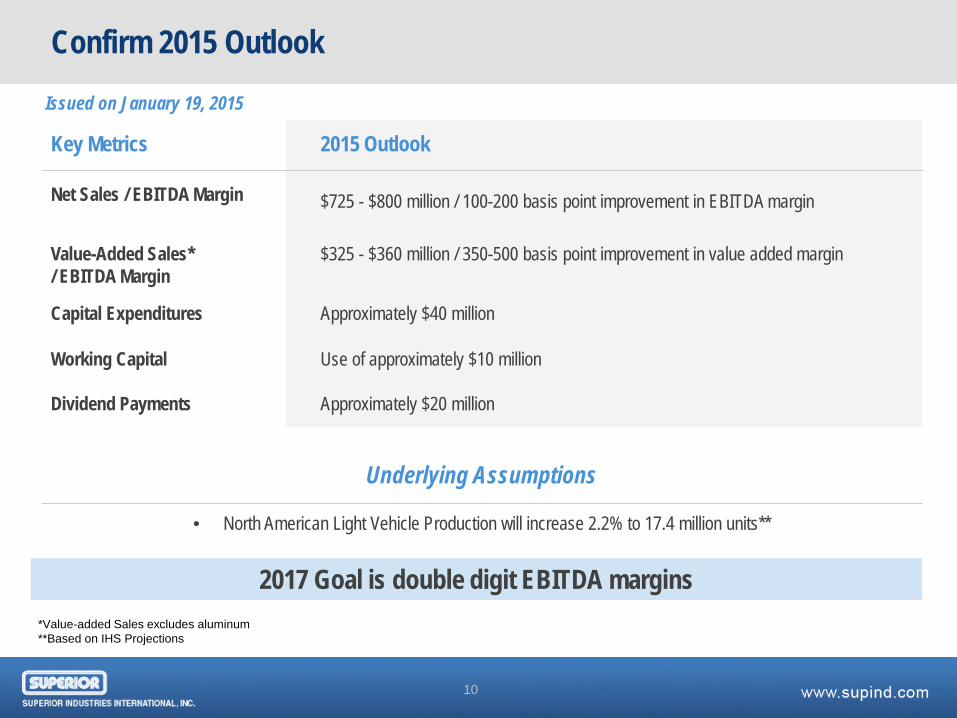
Confirm 2015 Outlook
Key Metrics
2015 Outlook
Net Sales / EBITDA Margin $725 - $800 million / 100-200 basis point improvement in EBITDA margin
Value-Added Sales* / EBITDA Margin
$325 - $360 million / 350-500 basis point improvement in value added margin
Capital Expenditures Approximately $40 million
Working Capital Dividend Payments
Use of approximately $10 million Approximately $20 million
*Value-added Sales excludes aluminum **Based on IHS Projections
Underlying Assumptions
• North American Light Vehicle Production will increase 2.2% to 17.4 million units**
2017 Goal is double digit EBITDA margins
10
Issued on January 19, 2015

First Quarter Income Statements
11
Una
udite
d
(US$ in Thousands, except for units and per share amounts) 1Q15 1Q14
Actual Actual Variance
Unit Shipments 2,538,345 2,830,948 (292,603)
Total Revenues $ 173,729 $ 183,390 $ (9,661)
Gross Profit $ 11,222 $ 15,636 $ (4,414) % of Revenues 6.5% 8.5% -2.1%
SG&A Expenses $ (7,552) $ (7,934) $ 381 % of Revenues -4.3% -4.3% 0.0%
Operating Income $ 3,669 $ 7,702 $ (4,033)
Interest Income, net $ 85 $ 348 $ (263) Foreign Exchange Gain (Loss) $ (233) $ (6) $ (227) Other Income (Expense), net $ 51 $ 14 $ 36
Income Before Income Taxes $ 3,573 $ 8,059 $ (4,487)
Income Tax (Provision) Benefit $ 761 $ (3,237) $ 3,998
Net Income $ 4,334 $ 4,822 $ (488)
Income Per Share - Diluted $ 0.16 $ 0.18 $ (0.02)
EBITDA $ 12,016 $ 14,772 $ (2,756) EBITDA % 6.9% 8.1% -1.1%
EBITDA Adjusted (1) $ 13,370 $ 14,772 $ (1,401) EBITDA % Adjusted (1) 7.7% 8.1% -0.4%
Value Added Sales (2) $ 82,263 $ 93,871 $ (11,608) EBITDA % Adjusted (1) 16.3% 15.7% 0.5%
(1) 1Q15 actual and budget EBITDA adjusted for $1.4M and $1.5M of Rogers restructuring charges respectively. (2) Value added sales excludes aluminum and upcharges

Summary Balance Sheets
12
Una
udite
d
(US$ in Millions) March December Increase
ASSETS 2015 2014 (Decrease) Cash & Cash Equivalents $ 44.7 $ 62.5 $ (17.8) Short Term Investments 3.8 3.8 $ - Accounts Receivable, net 105.4 102.5 2.9 Inventories, net 75.0 74.7 0.3 Prepaid Aluminum 21.5 14.4 7.1 Other Current Assets 15.0 18.1 (3.1) Total Current Assets 265.4 276.0 (10.6)
Property, Plant & Equipment 254.3 255.0 (0.7) Investments 2.0 2.0 - Deferred Taxes 15.4 17.9 (2.5) Other Assets 29.4 29.0 0.4 Total Assets $ 566.5 $ 579.9 $ (13.4)
LIABILITIES & EQUITY Accounts Payable $ 22.5 $ 23.9 $ (1.4) Other Current Liabilities 44.9 48.0 (3.1) Total Current Liabilities 67.4 71.9 (4.5)
Non-Current Liabilities 63.2 69.0 (5.8) Shareholders' Equity 435.9 439.0 (3.1) Total Liabilities & Equity $ 566.5 $ 579.9 $ (13.4)
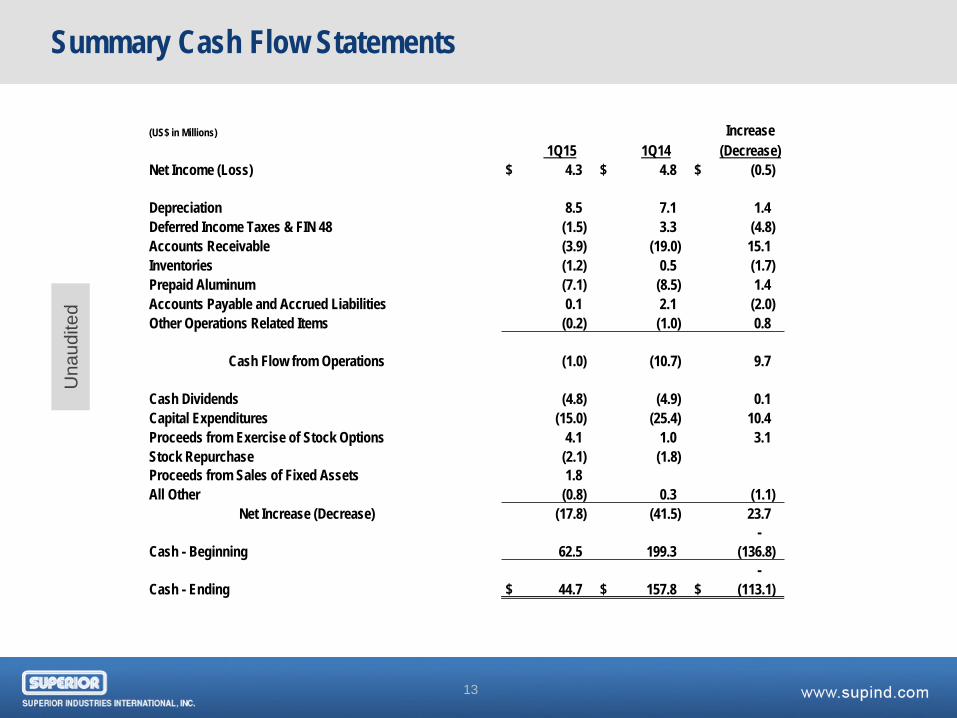
Summary Cash Flow Statements
13
Una
udite
d
(US$ in Millions) Increase 1Q15 1Q14 (Decrease)
Net Income (Loss) $ 4.3 $ 4.8 $ (0.5)
Depreciation 8.5 7.1 1.4 Deferred Income Taxes & FIN 48 (1.5) 3.3 (4.8) Accounts Receivable (3.9) (19.0) 15.1 Inventories (1.2) 0.5 (1.7) Prepaid Aluminum (7.1) (8.5) 1.4 Accounts Payable and Accrued Liabilities 0.1 2.1 (2.0) Other Operations Related Items (0.2) (1.0) 0.8
Cash Flow from Operations (1.0) (10.7) 9.7
Cash Dividends (4.8) (4.9) 0.1 Capital Expenditures (15.0) (25.4) 10.4 Proceeds from Exercise of Stock Options 4.1 1.0 3.1 Stock Repurchase (2.1) (1.8) Proceeds from Sales of Fixed Assets 1.8 All Other (0.8) 0.3 (1.1)
Net Increase (Decrease) (17.8) (41.5) 23.7 -
Cash - Beginning 62.5 199.3 (136.8) -
Cash - Ending $ 44.7 $ 157.8 $ (113.1)