superpave overlay of sand anti-fracture layer over pccp · modot research, development and...
TRANSCRIPT
MoDOT
Research, Development and Technology
ROT 00-001 Final Report
SuperPave Overlay of Sand Anti-Fracture Layer
OverPCCP Rl 97-045
March, 2000
TECHNICAL REPORT DOCUMENTATION PAGE
1. Report No. 2. Government Accession No. 3. Recipient's Catalog No. RI97.Q45
4. Title and Subtitle 5. Report Date SuperPave Overlay of Sand Anti-Fracture Layer over PCCP March, 2000
6. Performing Organization Code
MoDOT
7. Author(s) 8. Performing Organization Report No. Missouri Department of Transportation RDT 00-001 I Rl97-045
9. Performing Organization Name and Address 10. Work Unit No. Missouri Department of Transportation
Research, Development and Technology Division 11. Contract or Grant No.
P.O.Box270 Jefferson City, MO 65102
12. Sponsoring Agency Name and Address 13. Type of Report and Period Covered
Missouri Department of Transportation Construction and First Annual Report
Research, Development and Technology Division 14. Sponsoring Agency Code
P.O.Box270 MoDOT Jefferson City, MO 65102
15. Supplementary Notes
The investigation was conducted in cooperation with the U.S. Department of Transportation, Federal Highway Administration.
16. Abstract
A new technology called a sand anti-fracture (SAF) layer was proposed as an efficient and cost effective method of
pavement rehabilitation. The SAF layer is a fine aggregate graded asphalt mixture using highly polymerized asphalt
cement and is placed between a Portland Cement Concrete (PCC) pavement and an asphalt overlay. The purpose oftbe
SAF layer is to retard reflective cracking in asphalt overlays over PCC pavements and reduce PCC pavement repair
costs. Eight test sections were coostructed in summer 1998 on Route 1-29 in Holt Couoty to evaluate tbe SAF layer.
The test sections contains two degrees of pavement repair, two different overlay thicknesses, two different grades of
asphalt cement, and sections incorporating tbe recommended I" SAF layer. These test sections will be compared to
each other to evaluate tbe performance of tbe SAF layer, as well as tbe Super Pave overlay design and to determine
which provides tbe greatest benefit-to-cost ratio.
This report contains information from beginning oftbe project uotil tbe end of 1999. Visual distress surveys and falling
weight deflectometer (FWD) testing were conducted prior to construction and on a bi-yearly basis. The conclusions
and recommendations presented are preliminary and are subject to change as additional data are obtained.
17. Key Words I 18. Distribution Statement
Sand Anti-Fracture, SuperPave, Portland Cement Concrete, Visual No restrictions. This document is available tu the public Distress Survey, Falling Weight Deflectometer (FWD) through the National Technical Information Center, Springfield
Virginia 22161.
19. Security Classification (of this report) 20. Security Classification (of this page) 21. No. of Pages 22. Price
Unclassified Unclassified 18 w/o Appendices
Fonn DOT F 1700.7 (06/98)

RESEARCH INVESTIGATION RI97-045
CONSTRUCTION AND FIRST ANNUAL REPORT SUPERP AVE OVERLAY OF
SAND ANTI-FRACTURE LAYER OVER PCCP
PREPARED BY MISSOURI DEPARTMENT OF TRANSPORTATION RESEARCH, DEVELOPMENT, AND TECHNOLOGY
Written by:
JASON M. BLOMBERG, E.I.T. Intermediate Research and Development Assistant
JEFFERSON CITY, MISSOURI Date Submitted: March 2000
The opinions, findings and conclusions expressed in this publication are those of the principal investigator and the Research, Development, and Technology Division of the Missouri Department of Transportation.
They are not necessarily those of the U.S. Department of Transportation, Federal Highway Administration. This report does not constitute a standard, specification or regulation.

ACKNOWLEDGMENTS
The author gratefully acknowledges the contributions of the following individuals:
Manda Brandt, MoDOT initial principal investigator, coordinated the sampling, testing, and monitoring throughout construction of the project.
Ron Netemeyer & Joe Shroer, MoDOT Field Office, contact for materials.
Phil Blankenship, Koch Materials, performed SAF mix design.
Eric Burks, Stowe Johnson, Steve Clark, and Michael Blackwell, performed field testing and sampling.
The author is also grateful to John Donahue and Patty Lemongelli for manuscript review.

EXECUTIVESU~RY
This project on Route 1-29 in Holt County was constructed during the sununer of 1998 in
District 1. The project consisted of using a new technology, which involved placing a
sand anti-fracture (SAF) layer. The SAF layer is placed between a Portland Cement
Concrete pavement (PCCP) and an asphalt overlay. The purpose of the SAF layer is to
retard reflective cracking in asphalt overlays over PCCP and reduce initial PCC pavement
repair cost. If successful, the SAF layer will extend the service life of a pavement and
may justify decreasing the amount of original pavement repair and/or the thickness of an
asphalt overlay. The project was also Missouri's first SuperPave project to be
implemented in District 1. Information regarding the design, construction, and
implementation ofSuperPave in the project can be found in Appendix A of this report.
The surface of the original pavement consisted of approximately a 9-inch reinforced
concrete pavement on a 4-inch, Type 3 aggregate base. The pavement had severe
deterioration at the joints and mid-panel cracks caused by durability "D" cracking that
constituted the need for an extensive rehabilitation of the pavement. Before an asphalt
overlay was constructed, a l-inch SAF layer was placed on the original PCC pavement.
The SAF layer is composed of a fine aggregate graded asphalt mixture using highly
polymerized asphalt cement with high voids in the mineral aggregate (VMA) and asphalt
content and low air voids. The purpose of the SAF layer is to reduce the progression of
reflective cracking with little or no pavement repair. After the SAF layer was placed, an
asphalt overlay was constructed using the new SuperPave design methods.
This project includes eight test sections containing two degrees of pavement repair, two
different overlay thicknesses, two different grades of asphalt cement, and sections
incorporating the recommended 1" SAF layer. These test sections will be compared to
each other to evaluate the performance of the SAF layer, as well as the SuperPave
overlay design and to determine which provides the greatest benefit-to-cost ratio.
The most recent distress surveys indicate that all test sections that were constructed on 1-
29 in Holt County are still performing very well after 1-Y. years of service. No reflective

cracking has appeared in either of the overlays, with or without the SAF layers. At this
time no conclusions can be drawn from the performance of the eight test sections based
on the distress surveys and the Falling Weight Deflectometer (FWD) data. Future
monitoring and testing is needed to compare the performance of each of the test sections.
Presently, there are no apparent differences in the performance between the SAF and
conventional overlays. Therefore, making recommendations on using the SAF layer to
reduce reflective cracking and initial PCCP repair cost would be premature. However,
another project on Route 36 in DeKalb County has already been proposed to use the new
SAF technology. This project consists of constructing an asphalt overlay using an
underlying SAF layer on an existing asphalt overlay over jointed reinforced concrete
pavement. The actual performance and cost savings benefit that Missouri will receive
from using the sand anti-fracture layer is still to be determined. Meanwhile, Research,
Development, and Technology will continue monitoring the eight test sections on Route
1-29 in order to validate the SAF layer as an efficient and cost-effective method of
pavement rehabilitation.
TABLE OF CONTENTS
List of Figures...................................................................... ii
List of Tables...................................................................... ii
Introduction . . . . . . . . . . . . . . . . . . . . . . . . . . . . . . . . . . . . . . . . . . . . . . . . . . . . . . . . . . . . . . . . . . . . . . . . 1
Objectives . . . . . . . . . . . . . . . . . . . . . . . . . . . . . . . . . . . . . . . . . . . . . . . . . . . . . . . . . . . . . . . . . . . . . . . . .. 2
Discussion of Present Conditions................................................ 3
Technical Approach.............................................................. 3 Project Origin............................................................. 3 Project Layout............................................................ 4 Sampling and Testing................................................... 5 Project Construction..................................................... 6
Results and Discussion.. . . . . . . . . . . . . . . . . . . . . . . . . . . . . . . . . . . . . . . . . . . . . . . . . . . . . . . . . . . 8 Pre-construction. . . . . . . . . . . . . . . . . . . . . . . . . . . . . . . . . . . . . . . . . . . . . . . . . . . . . . . . . . . 8 Post construction ........................................................ . Project Costs ............................................................. .
8 9
Conclusions. . . . . . . . . . . . . . . . . . . . . . . . . . . . . . . . . . . . . . . . . . . . . . . . . . . . . . . . . . . . . . . . . . . . . . . . . 10
Recommendations.................................................................. 10
Bibliography........................................................................ 11
Appendix A- SuperPave Construction
Appendix B- Work Plan
Appendix C - Mix Designs
Appendix D- SAF Special Provisions
i

LIST OF FIGURES
Figure 1 -Project Limits........................................................... 12
Figures 2-5 -Pre-construction Photos........................................... 13
Figure 6 -Test Section Layout................................................... 14
Figure 7- SAF layer sticking to roller wheel................................... 15
Figure 8 - SAF layer tearing from paver screed................................ 15
Figure 9- Blisters forming on SAF layer....................................... 15
LIST OF TABLES
Table 1 -Analysis Matrix......................................................... 16
Table 2 -Monitoring Area Layout.............................................. 17
Table 3- Cost Estimate of Test Sections....................................... 18
ii

INTRODUCTION
One of the main challenges MoDOT has with asphalt overlays over PCC pavements is to prevent
or retard reflective cracking. In order to decrease reflective cracking occurring in asphalt
overlays, MoDOT has spent a great deal of money on PCC pavement repair before an overlay is
constructed. In an effort to reduce pavement repairs, Koch Materials Company presented
MoDOT a new technology called a sand anti-fracture (SAF) mixture layer. This technology
originated in France and has been brought to the United States by Koch Materials. The SAF
layer is a sand asphalt mixture placed between a PCC pavement and an asphalt overlay.
According to Koch Materials, the SAF layer will fill pop-outs and other pavement irregularities
and resist reflective cracking thereby reducing the need for PCC pavement repair before an
asphalt overlay is constructed.
The first project in the United States implementing the SAF layer was constructed in Oklahoma
in 1995. An evaluation of the project, conducted in 1997, substantiated an increase in resistance
to reflective cracking by using the SAF layer with a stone mastic asphalt (SMA) wearing course.
However, the Oklahoma DOT concluded that the SAF mix caused a greater number of distresses
than the standard leveling course and fabric membrane treatments, and the SAF layer was not
recommended to replace Oklahoma conventional methods. Oklahoma DOT's approach in
rehabilitating a PCCP on an interstate route consisted of placing a 1 Y.-inch wearing course over
a l-inch SAF layer. The overlay may not have been sufficient to handle the traffic loading
capacity, thus resulting in significant rutting and bleeding.
A legitimate concern of the SAF layer is its sensitivity to rutting and lower structural integrity
compared to standard asphalt concrete. Koch Materials recommends that a wearing surface be
placed within one or two days following the placement of the SAF layer. The SAF layer in
Oklahoma was exposed to traffic for seven days, and significant rutting and bleeding occurred on
the SAF layer. Rutting was also a challenge to the I-29 project in Holt County. However,
rutting was not a problem if proper temperature of the high polymer asphalt binder was achieved.
The SAF layer on the I-29 project withstood traffic for approximately one week without any
pavement distresses.
I

Another issue of the SAF layer is its structural integrity. The SAF layer has a modulus value of
only half of a standard asphaltic concrete mix. Because of the lower modulus value, the
thickness of the SAF layer should not exceed l-inch, and the SAF thickness should not be
included with the calculated pavement design thickness of the asphalt overlay.
Unlike the project in Oklahoma, MoDOT used the SAF layer as a stress relieving membrane
between an old PCC pavement and an asphalt overlay to prevent reflective cracking and reduce
initial pavement repair costs. The SAF layer fills pop-outs and other irregularities and resists
reflective cracking, thereby reducing pavement repairs to only the most severely damaged areas.
MoDOT also used SuperPave mix design methods and a greater asphalt thickness compared to
the Oklahoma project. This should give the asphaltic concrete overlay the structural integrity
required to prevent rutting and other pavement distresses.
The SuperPave and SAF project was constructed in the summer of 1998 on Route 1-29 in Holt
County. This project included eight different test sections containing a combination of two
degrees of pavement repair, two different overlay thicknesses, two different grades of asphalt
cement, and some sections incorporating the recommended l-inch SAF layer. Each test section
will be monitored and evaluated in an effort to procure the most efficient and cost effective
pavement design. A 5-year study on the performance of the SuperPave and SAF layers was
proposed. Further monitoring may be warranted depending upon the performance and service
life of the pavement. This report contains information from beginning of the project until the end
of 1999. The recommendations and conclusions included in this report are drawn from the pre
construction, construction, and post-construction sampling, testing, and observations. The
conclusions and recommendations presented are preliminary and are subject to change as
additional data are obtained.
OBJECTIVES
The objective of this research investigation is to evaluate the effectiveness of the sand anti
fracture layer in reducing reflective cracking in asphalt overlays over PCC pavements. The
benefits that MoDOT anticipates from the SAF layer are the savings from the reduction of initial
2

pavement repair costs, possibilities of a reduction in overlay thickness, and a longer lasting
service life of the asphalt overlay.
DISCUSSION OF PRESENT CONDITIONS
When PCC pavements need rehabilitation, the most widely used method that MoDOT has
implemented in the past is a standard IC or m asphalt overlay over the PCCP. The thickness of
the asphalt overlay depended on traffic and pavement condition. Usually, a 1 %-inch IC mix was
placed as the wearing surface, while 2 to 4 inches of an m mix was placed as a binder course
layer. Recently, MoDOT has required a new Super Pave mix design for all pavements over 3500
ADT. The SuperPave mix design is an improved system for specifying asphalt binders and
mineral aggregates and developing asphalt mixture designs to establish a better performing
pavement. Construction and design information regarding SuperPave are included in Appendix
A of this report.
Another problem MoDOT has with asphalt overlays ofPCC pavements is reflective cracking
that occurs in the asphalt layer due to the underlying deteriorated PCCP joints and cracks. The
research performed during this investigation is essential in determining the benefits that MoDOT
anticipates by supplementing the sand anti-fracture layer with the SuperPave asphalt overlays.
TECHNICAL APPROACH
Protect Origin
The SAF project is located on both northbound and southbound lanes of Route 1-29, Holt
County, Missouri, between Station 790+02 (south of Mound City) and Station 1045+00 (south of
Route 159) for a total project length of 4.829 miles. A map showing the project location and
limits can be found in Figure 1.
The original pavement was built in 1974 under project number 1-IG-29-2 (10) 76. The pavement
was a 24-feet wide reinforced, 9-inch Portland Cement Concrete Pavement with 61.5 ft. sawed
contraction joints. The materials and respective proportions used in the pavement were as
follows:
3

Coarse Aggregate: Plattsmouth Limestone, Kerford Quarries, Weeping Waters, Nebraska.
Fine Aggregate: Missouri River Class A Sand from Holiday Sand and Gravel, 5 miles south of Craig, MO.
Cement: Type 1 Cement from Missouri Portland Cement Co., Sugar Creek, MO.
Mix Proportions: 1.00: 2.00: 2.85
Air: Air Entrainment Agent, AdAire Single Strength, Average% Air= (4.9- 5.4).
Water: 4.7-4.9 gallons per sack of cement.
A 4-inch, Type 3 Aggregate Limestone Base (Erving Creek Limestone) was the original
constructed base material. The underlying sub grade consisted of a silty clay loam material. The
subgrade had to be reworked to obtain suitable stability before pavement construction. After
approximately 20 years of service, the PCC pavement showed signs of major D-cracking and
joint deterioration, which constituted the need for a complete rehabilitation of the road.
Photographs in Figures 2-5 illustrate the original pavement condition that was typical in this
project.
Project Layout
The I-29 project was agreed upon to be an excellent candidate for minimal pavement repair and
evaluation of the effectiveness of the SAF layer in reducing reflective cracking. MoDOT
personnel from District 1 and the Research, Development, and Technology Division, evaluated
the SAF layer performance by monitoring reflective cracking and rutting, determining load
transfer at underlying PCCP joint locations, and visual examination of drilled cores, if necessary.
By analyzing the data collected from each of the test sections, MoDOT hopes to determine the
optimum method of rehabilitating PCC pavements.
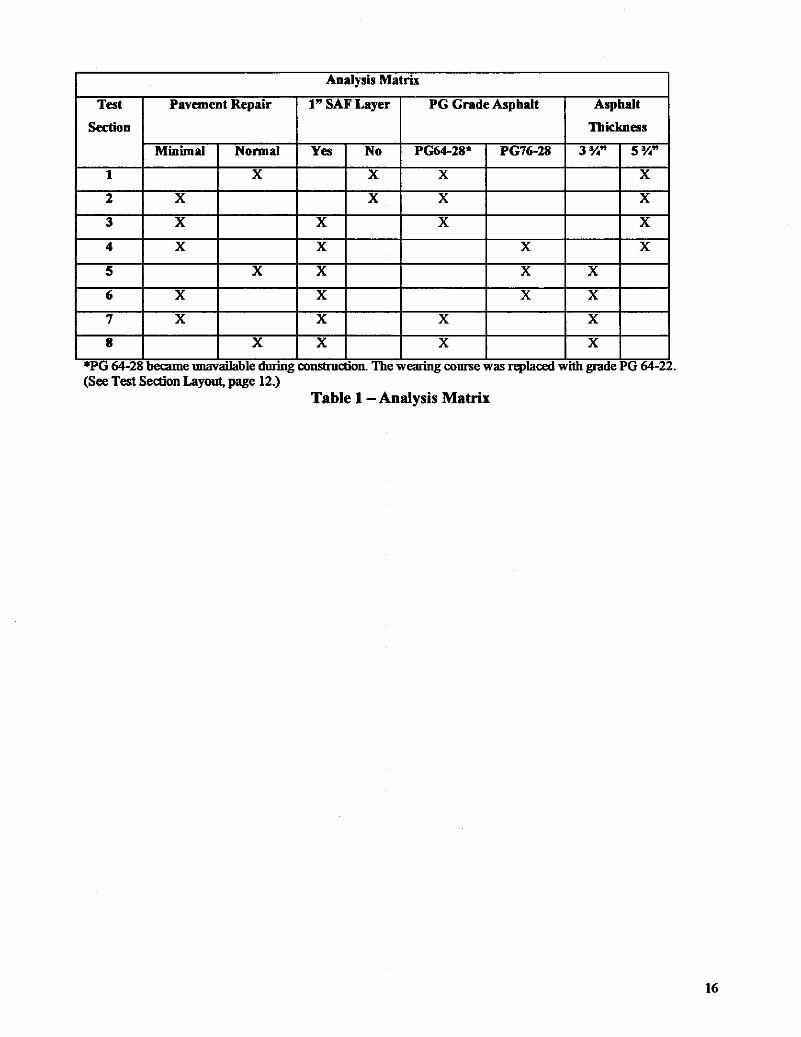
The SAF layer was constructed in 1998 on Route 1-29 in Holt County. This project includes
eight test sections containing a combination of the following: two degrees of pavement repair,
two different overlay thicknesses, two different grades of asphalt cement, and some sections
incorporating the recommended l-inch SAF layer. The layout of the eight test sections is shown
in Figure 6. The test sections' analysis matrix is shown in Table 1.
4

The two degrees of pavement repair used for this project were normal pavement repair and
minimum pavement repair. Normal pavement repair included maintenance at all locations that
showed medium to severe pavement distress. This is a conventional method used on most
pavements in order to maximize the performance of the overlay. Minimum pavement repair
included maintenance of only the most severe pavement deterioration in which there would be a
Joss of support and structural integrity if the pavement were not repaired. On this project,
minimum pavement repair resulted in 75% reduction in pavement repair costs as compared to
normal repair.
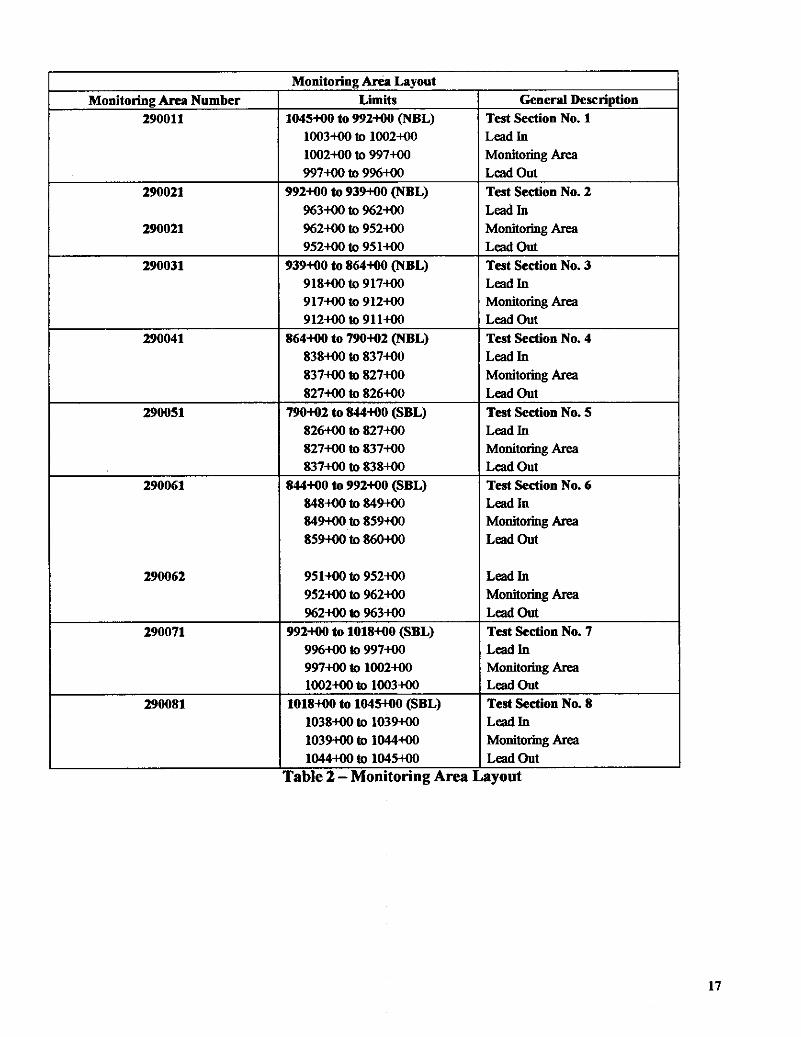
Due to the 10 mile total project length, the actual monitoring area was reduced to shorter 500 -
1000 feet lengths within the 0.5-3.0 mile test section. In addition, test section six was split into
two 1000 feet monitoring areas, because of its 3 mile length. The other test sections have one
monitoring area each. The sampling and monitoring area layout is listed in Table 2.
Sampling and Testing
Originally, the SAF project test sites were designed for inclusion into the long-term pavement
performance (LTPP) program as part of an SPS-6 site. This did not occur. However, the testing
and sampling protocol did meet most LTPP standards for all materials, mixes, and pavement and
base layers.
The SAF project work plan in Appendix B gives an outline of the work performed in this project.
All testing and evaluations were performed within the monitoring areas of each of the eight test
sections. A pre-construction distress survey was conducted on the existing pavement to record
pavement joints, cracks, and severity of distresses. The joints and cracks were also marked using
a nail on the in-slope. The nail was used to re-locate the joints and cracks after the overlay was
constructed. Falling Weight Deflectometer (FWD) testing was conducted prior to the overlay to
obtain load transfer data at the PCCP joints and pavement moduli.
After pre-construction data were obtained, the same monitoring areas were used for testing
during construction. The location and dimensions of all PCCP joint and crack repairs were
recorded. Also, the joints and cracks that were not repaired, but would have been repaired under
s
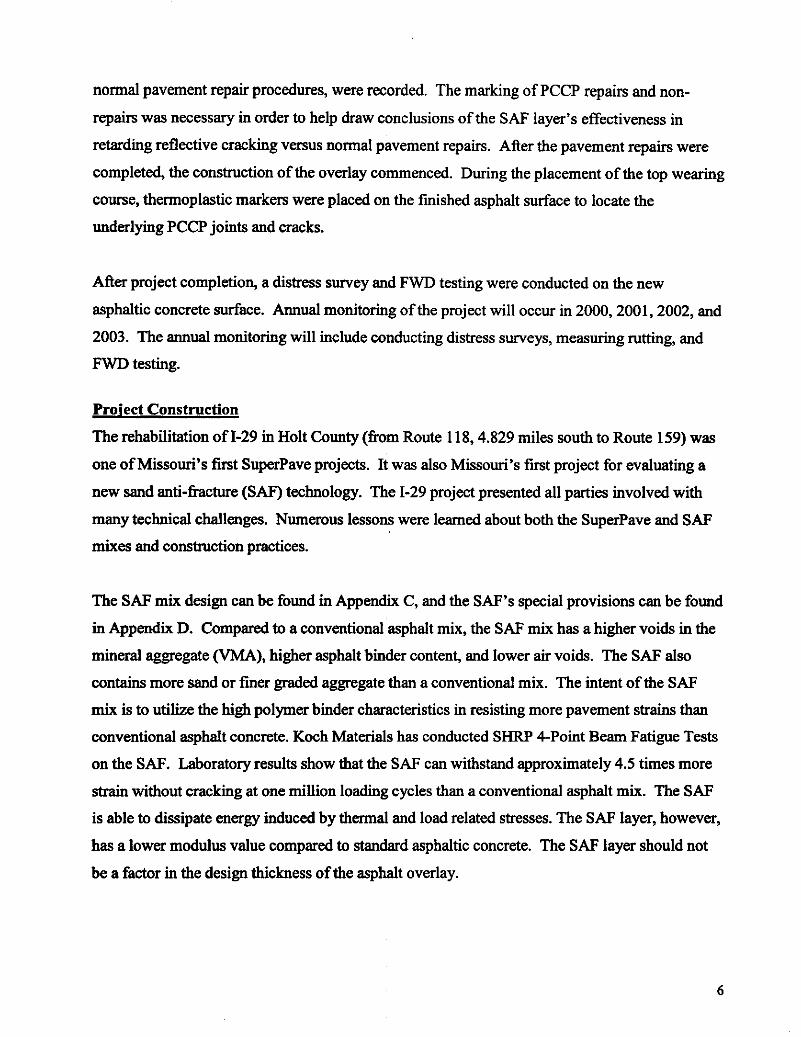
normal pavement repair procedures, were recorded. The marking of PCCP repairs and non
repairs was necessary in order to help draw conclusions of the SAF layer's effectiveness in
retarding reflective cracking versus normal pavement repairs. After the pavement repairs were
completed, the construction of the overlay commenced. During the placement of the top wearing
course, thermoplastic markers were placed on the fmished asphalt surface to locate the
underlying PCCP joints and cracks.
After project completion, a distress survey and FWD testing were conducted on the new
asphaltic concrete surface. Annual monitoring of the project will occur in 2000, 2001, 2002, and
2003. The annual monitoring will include conducting distress surveys, measuring rutting, and
FWD testing.
Project Construction
The rehabilitation ofl-29 in Holt County (from Route 118, 4.829 miles south to Route 159) was
one of Missouri's first SuperPave projects. It was also Missouri's first project for evaluating a
new sand anti-fracture (SAF) technology. The 1-29 project presented all parties involved with
many technical challenges. Numerous lessons were learned about both the SuperPave and SAF
mixes and construction practices.
The SAF mix design can be found in Appendix C, and the SAF's special provisions can be found
in Appendix D. Compared to a conventional asphalt mix, the SAF mix has a higher voids in the
mineral aggregate (VMA), higher asphalt binder content, and lower air voids. The SAF also
contains more sand or finer graded aggregate than a conventional mix. The intent of the SAF
mix is to utilize the high polymer binder characteristics in resisting more pavement strains than
conventional asphalt concrete. Koch Materials has conducted SHRP 4-Point Beam Fatigue Tests
on the SAF. Laboratory results show that the SAF can withstand approximately 4.5 times more
strain without cracking at one million loading cycles than a conventional asphalt mix. The SAF
is able to dissipate energy induced by thermal and load related stresses. The SAF layer, however,
has a lower modulus value compared to standard asphaltic concrete. The SAF layer should not
be a factor in the design thickness of the asphalt overlay.
6

Placement of the SAF layer had some initial constructibility problems. One problem was getting
the right amount of the high polymer asphalt for the mix. Due to the inexperience in dealing
with the binder's high polymer characteristics, the asphalt plant had difficulties in establishing
the binder's proper temperature to accurately measure and control the flow of the binder. The
asphalt plant's meter devices would "gum up" and may have given erroneous readings. During
the construction of test section eight, the asphalt content was apparently too high. As a result,
the SAF layer had poor workability and rutted severely. A high asphalt content also created
difficulty keeping the truck beds clean, and the mix would stick to truck tires and rollers as
shown in Figure 7. In addition, the mix was very hard to fmish and appeared to tear from the
screed during placement Figure 8 illustrates the blemishes on the SAF layer after placement.
The severe rutting that occurred in test section eight resulted in the removal of a short stretch
between stations 1038+00 to 1041+49. Despite the initial problems, once the proper temperature
was established for the high polymer asphalt binder, measuring and controlling the flow of
asphalt was no longer a problem. Consequently, the occurrence of pavement rutting had
diminished, and placement and workability problems were improved.
Another concern was the formation ofblisters, as shown in Figure 9, which occurred after
placement of the SAF layer. According to Koch Materials, evaporated gases from trapped
moisture cause the blisters to form, but they disappeared once the overlay was placed and did not
cause any significant problems to the pavement structure or the SAF layer.
Despite the problems that occurred during construction, the finished product seemed to be a
success. The SAF layer's effectiveness in reducing reflective cracking will be monitored for a 5-
year performance period. This report includes test data and surveys for approximately the first 1-
y, years of service life of the project. The construction issues concerning SuperPave can be found
in Appendix A, and the SuperPave mix designs can be found in Appendix C of this report.
RESULTS AND DISCUSSION
7

Pre-construction
Pre-construction sampling and testing was performed on the subgrade. The original subgrade
was primarily composed of a silty clay soil. In some locations, however, the subgrade was
composed of mostly sand material. The plasticity index (PI) of the soil ranged from as low as 2
in the sand-silt areas to as high as 12 in the silt-clay areas. Concrete cores were also taken from
the roadway to determine the overall concrete strength. Out of a total of 18 cores that were
sampled, the average compressive strength and the average split tensile strength were 5760 psi
and 709 psi, respectively. Overall, the structural evaluation of the sub grade, base, and original
pavement were in good condition. However, the severe D-cracking and deterioration at the
joints and cracks constituted the need for rehabilitation. The Falling Weight Deflectometer
(FWD) testing results performed on the original pavement indicated that approximately 46% of
the joints tested had a load transfer below 700/o. The distress surveys performed on the original
pavement concluded that there was high severity cracking and deterioration at many of the joints.
Also, there were many areas of low to moderate severity cracks that would soon become major
pavement distresses.
Post construction
Post construction testing included FWD testing and pavement distress surveys. The FWD data
obtained from the annual monitoring has been used to compare each section and help determine
the effectiveness of the SAF layer in reducing reflective cracking. Poor load transfers of the
PCC joints and cracks indicate areas with a possibility of reflective cracks perpetrating through
the asphalt overlay. Although the PCC joints and cracks within the monitoring areas were
marked on the finished asphalt surface with thermoplastic markers, the FWD loading plate was
difficult to align in the same position as the previous tests. However, the thermoplastic markers
kept the FWD loading plate in the relatively same locations as the previous tests so that
comparisons can continue to be made. The FWD testing performed as of October 1999 indicated
that approximately 96 % of the joints tested within the monitoring areas of the test sections had
load transfers greater than 70 %. No significant comparisons of the individual test sections can
be recognized, at this time, by comparing the FWD data.
8

Distress surveys taken after the construction of the overlay show that virtually no cracks are
appearing in any of the test sections after 1 Y. years of service life. Two transverse cracks are
starting to appear in test section eight and will be monitored throughout the investigation. One
crack extends across the driving lane at station 1040+37. The crack is located in the problem
area where the SAF layer was removed and replaced. The other transverse crack extends
approximately 6 feet across the driving lane measured from the edge of the roadway at station
1043+73.
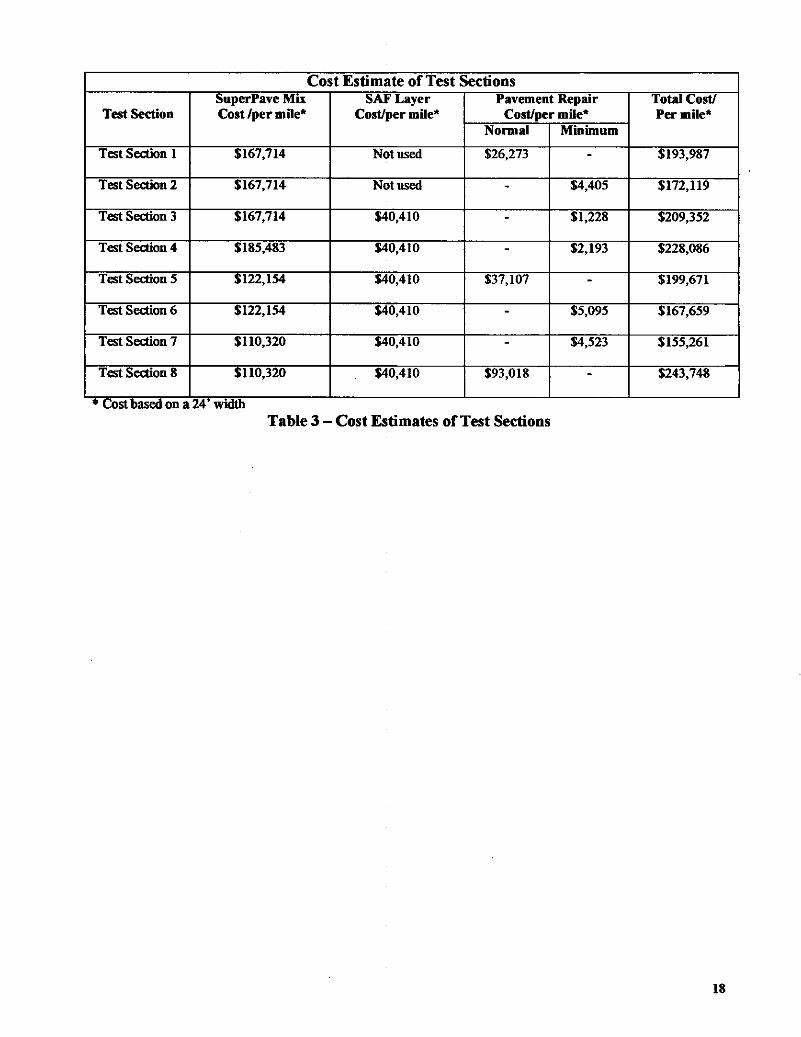
ProJect Costs
The construction cost of each test section varied depending on overlay thickness, grade of
asphalt, degree of pavement repair, and whether the SAF layer was used. Table 3 lists the cost
estimate of each test section. The construction cost of the SAF layer was not always less than
performing normal pavement repairs. However, when pavement repairs exceed $40,000, like
test section eight, the construction cost of the SAF layer is less than performing normal pavement
repairs. In most cases, there is not a significant difference between the construction cost of the
SAF layer compared to normal pavement repair. The actual pavement performance of each test
section in the future will dictate which method is the most cost effective.
CONCLUSIONS
9

• The most recent distress surveys indicate that all test sections that were constructed on 1-29
in Holt County are still performing very well after 1 Y, years of service.
• No significant reflective cracking has appeared in test sections incorporating the l-inch SAF
layer or test sections constructed by conventional methods.
• No distinct differences of performance of the eight test sections can be made from the
distress surveys or the FWD data to indicate which sections are performing better than the
others.
• The difference in construction cost between the SAF layer and normal pavement repair
methods depend on the amount of pavement repair that is needed.
RECOMMENDATIONS
• Based on current test results and observations recommendations on the SAF implementation
for pavement rehabilitation cannot be given.
• Further testing and monitoring of the eight test sections on Route 1-29 is needed in order to
validate the SAF technology as an effective and economical solution for pavement
rehabilitation.
• It is recommended that the SAF technology be considered for other projects. (Note: A follow
up project on the SAF technology is underway for Route 36 in Dekalb County, where
Research, Development & Technology will continue monitoring the SAF performance.)
10

BIBLIOGRAPHY
1. Brewer, Wilson B., "Sand Anti-Fracture Mixture 1-35 Logan County, Oklahoma", Research, Development and Technology Transfer, March 1997.
2. Koch Materials Company, "Sand Anti-Fracture (SAF) Mixture Trial", 1997.
11

MISSOURI HIGHWAY AND TRANSPORTATION COMMISSION PLANS FOR PROPOSED STATE HIGHWAY
.. I .. <> "' ~ .., "' "'
T62N
T61N
1 0 2 J 4 e-·- I Scale In Ali les
HOLT COUNTY
T62N
T61N
12

' f lgu o·e J (Slot ion 9S7- 96 SilL)
Fl: u,.. 4 (Stotlon 913+16 !'Ill,) Figu"' S (Swtloon 1 OOIJoHJ6 SBL)
13

0 • 15 ,...
1-29 Southbotmd Driving Lane, Profile View
#7 #6
Normal Pavement Repsir
Mininimum Pavement Repair --1-29 Northbound Driving Lane, Profile View
Figure 6 - Test Section Layout
#5
#4
14

ngure 1 • SAF layer sticking to NJIIer wheel
F'igu.rc 8 - SAF layer tearing from streeder
Figure 9 - Bllsrt rs forming on SA¥ layer
15
Analysis Matrix
Test Pavement Repair l"SAFLayer PG Grade Asphalt Asphalt
Section Thickness
Minimal Normal Yes No PG64-28* PG76-28 3%" 5%"
1 X X X X
2 X X X X
3 X X X X
4 X X X X
5 X X X X
6 X X X X
7 X X X X
8 X X X X
*PG 64-28 became unavailable dunng construction. The weanng coUISe was replaced with grade PG 64-22. (See Test Section Layout, page 12.)
Table 1 -Analysis Matrix
16
Monitoring Area Layout
Monitoring Area Number Limits General Description
290011 1045-HJO to 992-HIO (NBL) Test Section No. 1
1003-100 to 1002-HJO Lead ln
1002-HIO to 997-1{)0 Monitoring Area 997-HJO to 996-1{)() Lead Out
290021 992-HJO to 939-HJO (NBL) Test Section No. 2 963-1{)() to 962-t{)() Leadln
290021 962t00 to 952t00 Monitoring Area
952-HJO to 951 tOO Lead Out
290031 939-HJO to 864-HJO (NBL) Test Seetion No. 3
918t00 to 917t00 Lead ln 917t00 to 912t00 Monitoring Area
912t00 to 911-HJO Lead Out
290041 864-HJO to 790-HJ2 (NBL) Test Seetion No. 4
838t00 to 837-HJO Leadln
837t00 to 827-HIO Monitoring Area
827t00 to 826-HJO Lead Out
290051 790-HJ2 to 844-HJO (SBL) Test Seetion No. 5
826-100 to 827-HJO Leadln
827-HJO to 837-HJO Monitoring Area 837-t{)() to 838-t{)() Lead Out
290061 844-HJO to 992-HJO (SBL) Test Section No. 6 848-t{)() to 849t00 Leadln 849t00 to 859-1{)0 Monitoring Area 859t00 to 860-1{)0 Lead Out
290062 951-100 to 952-t{)() Leadln 952-t{)() to 962-t{)() Monitoring Area 962-t{)() to 963-t{)() Lead Out
290071 992-HJO to 1018-HJO (SBL) Test Section No. 7
996t00 to 997-100 Lead ln
997t00 to 1002-100 Monitoring Area 1002t00 to 1 003t00 Lead Out
290081 1018-HJO to 1045-HJO (SBL) Test Section No. 8
1038-100 to 1039t00 Leadln
1039t00 to 1044t00 Monitoring Area 1044-1{)() to 1045-t{)() Lead Out . . Table 2- Momtonng Area Layout
17
Cost Estimate of Test Sections SuperPave Mix SAFLayer Pavement Repair Total Cost/
Test Section Cost /per mile* Cost/per mile* Cost/per mile* Per mile* Normal Minimum
Test Section 1 $167,714 Not used $26,273 - $193,987
Test Section 2 $167,714 Not used - $4,405 $172,119
Test Section 3 $167,714 $40,410 - $1,228 $209,352
Test Section 4 $185,483 $40,410 - $2,193 $228,086
Test Section 5 $122,154 $40,410 $37,107 - $199,671
Test Section 6 $122,154 $40,410 - $5,095 $167,659
Test Section 7 $110,320 $40,410 - $4,523 $155,261
Test Section 8 $110,320 $40,410 $93,018 - $243,748
' • Cost based on a 24 width Table 3-Cost Estimates of Test Sections
18
APPENDIX A SuperPave Construction

SuperPave Overlay
The following paragraphs include pertinent information regarding the construction of the
SuperPave asphaltic concrete overlay constructed over the sand anti-fracture (SAF) layer.
This project was Missouri's first SuperPave project to be implemented in District 1.
SuperPave is a new asphalt mix design method that incorporates performance based
asphalt materials characterization with the design environmental conditions to improve
the performance of asphalt pavements.
The SuperPave mix designs, SP125 and SP190, can be found in Appendix B. The
verification of the SuperPave mix design presented many technical challenges from the
beginning of the project. During mix verification, it was discovered that there was a
difference in the combined bulk specific gravity of the stone (Gsb) that the contractor had
used versus the Gsb that MoDOT used. Evidently, the test procedures between MoDOT
and the contractor varied considerably. The different Gsb led to differences in the values
of voids in the mineral aggregate (VMA) and percent air voids in the mix (Va). Also,
there were conflicting data compiled by the different brand of gyratory compactors used.
MoDOT used a Pine Gyratory while the contractor used a Troxler Gyratory. Due to these
differences, there was no verification of either the SP-190 or SP-125 SuperPave mixes.
Another challenge that developed throughout the course of the project was the
determination of asphalt content in the mix. The asphalt content directly affects the voids
in the mineral aggregate (VMA) of the mix. An ignition oven designed by the National
Center for Asphalt Technology (NCAT) was used to determine the asphalt content. Test
results from the ignition oven proved erratic compared to the asphalt nuclear gauge, daily
tank sticks, and plant totalizer readings.
Also, early during construction, the supply of asphalt binder PG64-28 became depleted.
A switch to asphalt binder grade PG 64-22 was necessary to complete the project.
Despite the asphalt grade variable, the test sections were made more comparable by
placing the PG 64-22 binder on the top 1 %-inch wearing surface on all test sections that

originally called for PG 64-28. Test sections 2 and 3 also had PG 64-22 as the top 2
inches of the bituminous base course. The original PG 64-28 was used as the bituminous
base course for the remaining bituminous base layers of the test sections. (See Figure 6).
Only temporary solutions were proposed for the SuperPave mix design problems.
Further testing and discussions are needed in order to achieve an agreement on some of
the issues.

APPENDIXB Work Plan

STUDY PROPOSAL
Date: 1/30/98
Project Number: RI 97-045
Title: Superpave Overlay of Sand Anti-Fracture Layer Over PCCP
Research Agency: Materials Field Office, Koch Materials, and RD&T Division
Investigators: Manda Brandt, RD&T - Principal Investigator Joe Shroer!Ron Netemeyer, Field Office -Contact for Materials Phil Blankenship, Koch Materials - Performing SAF Mixture Design
Objective: To evaluate the effectiveness of approximately one inch of Sand Anti-Fracture · Mixture (SAF) in reducing reflective cracking in asphalt overlays over PCCP with minimum pavement repair.
Background and Significance of Work: The main problem MoDOT has with AC overlays of PCCP is reflective cracking. This SAF layer, according to Koch Materials, will reduce the amount of reflective cracking with a reduced pavement overlay thickness and only minimal PCCP pavement repair required. SAF is a fme graded asphalt mixture using a highly polymerized asphalt cement with high VMA and asphalt content and low air voids.
Action Plan: The SAF layer will be constructed on 1-29 in Holt County on Job 1110737. There will be 8 test sections, as shown in Table 1. The investigation includes pavements with two degrees of pavement repair, two different overlay thicknesses, and two different grades of asphalt cement, with some sections incorporating the recommended I" SAF layer. The sections will be compared to evaluate: the performance of the SAF layer, as well as the pavement overlay design that provides the greatest benefit related to cost.
J:IRI9704SIWORKPLAN.SAM

00 00~ SB 1-291 ~N~nn~ Min
I 7
NB 1-291 I Nonnal
I 1
00 ~ TestSec~on ACOL
1 53/4"
2 53/4"
3 53/4"
4 53/4"
5 33/4"
6 33/4"
7 33/4"
8 33/4"
J:IR19704SIWORKPLAN.SAM
TEST SECTIONS
~ Minimum I Nonnal
6 5
Minimum
I Minimum
I Minimum
2 3 4
~ ~ SAF PAV'T REP ACGRADE MILES
Nonnal 64-28 1.0
Minimum 64-28 1.0
1" Minimum 64-28 1.5
1" Minimum 76-28 1.5
1" Nonnal 76-28 1.0
1" Minimum 76-28 3.0
1" Minimum 64-28 0.5
1" Nonnal 64-28 0.5
Table 1. Test Section Layout
~ I
I
~
J110737 1-29 HoltCo.
Pav'tRepair TestSec~on
Pav'tRepair TestSec~on

Literature Search: Koch Materials has supplied information regarding the SAF layer.
Method of Implementation: If this method is successful, we will propose implementation procedures based on a fmal report and presentations to design and materials related personnel.
Anticipated Benefits: It is anticipated that the SAF layer will reduce the amount of reflective cracking in asphalt overlays over PCCP, therefore extending the life of the asphalt overlay. There will also be cost savings through the reduction of overlay thickness and required pavement repair.
Research Period: There will be a construction report at the end of the 1998 construction season. The site will be monitored annually for five years and a final report will detail the performance of the test sections.
Funding: The test site construction will be funded by District l's construction fund. The construction sampling, annual monitoring, and report expenses will be funded by the RD&T division with SPR funds.
J:\RI9704SIWORK.PLAN.SAM

WORK PLAN
Procedure:
,... PLANNING PHASE-
Monitoring Areas and Numbering Scheme Due to the I 0 mile total project length, the actual monitoring area will be reduced to shorter 500-1 000' lengths within the 0.5-3 mile test section. In addition, test section 6 will have two I 000' monitoring areas, because of its 3 mile length. The other test sections will have one monitoring area each. These monitoring areas will be numbered as follows: 2900XY, where X is the test section number as shown in Table 1, andY is the consecutive number of the monitoring area within that test section. For example, 290062 would be the second monitoring area within test section 6. 290051 would be the first monitoring area within test section 5. This numbering scheme will allow the test section data to be incorporated into the existing LTPP database.
Designated Sampling Areas There will be a sampling area, for destructive testing, at the beginning and end of each of the nine monitoring areas. These sampling areas will be I 00' in length and will not overlap the monitoring areas. They are referred to as Lead In and Lead Out in Table 2.
J:IRI97045\WORKPLAN.SAM

Monitorin!! Area No. Limits General Descrii!tion 1045+00 to 992+00 (NBL) Test Section #I
I 003+00 to 1002+00 Lead In 290011 1002+00 to 997+00 Monitoring Area
997+00 to 996+00 Lead Out
992+00 to 939+00 (NBL) Test Section #2 963+00 to 962+00 Lead In
290021 962+00 to 952+00 Monitoring Area 952+00 to 951 +00 Lead Out
939+00 to 864+00 (NBL) Test Section #3 918+00 to 917+00 Lead In
290031 917+00 to 912+00 Monitoring Area 912+00to 911+00 Lead Out
864+00 to 790+02 (NBL) Test Section #4 838+00 to 837+00 Lead In
290041 837+00 to 827+00 Monitoring Area 827+00 to 826+00 Lead Out
790+02 to 844+00 (SBL) Test Section #5 826+00 to 827+00 Lead In
290051 827+00 to 837+00 Monitoring Area 837+00 to 838+00 Lead Out
844+00 to 992+00 (SBL) Test Section #6 848+00 to 849+00 Lead In
290061 849+00 to 859+00 Monitoring Area 859+00 to 860+00 Lead Out
951+00 to 952+00 Lead In 290062 952+00 to 962+00 Monitoring Area
962+00 to 963+00 Lead Out
992+00 to 1018+00 (SBL) Test Section #7 999+00 to 1 000+00 Lead In
290071 1000+00 to 1005+00 Monitoring Area 1005+00to1006+00 Lead Out
1018+00 to 1045+00 (SBL) Test Section #8 1038+00 to 1039+00 Lead In
290081 1039+00 to 1044+00 Monitoring Area 1044+00to1045+00 Lead Out
Table 2. Sampling and Monitoring Area Layout
J:IRI97045\WORKPLAN.SAM

~ CONSTRUCTION IN 1998- The test sections will be sampled and tested as follows:
Pre-Construction Sampling March, 1998 A field crew from the RD&T division will perform the following within the monitoring areas:
• Marking of each joint and working crack with a nail on the in-slope. This nail will be used for joint/crack location reference in the future.
• Distress Survey of the existing PCCP. • Falling Weight Deflectometer (FWD) Testing of the monitoring areas according to
SPS-6 Protocol.
District 1 Construction Personnel will perform 5 point cross sections, of the existing PCCP, within the monitoring areas.
A field crew from the RD&T division will perform the following within the sampling areas: • Sampling of the existing PCCP with 4", 6" and 12" cores. • Within the 6" holes - au gering of the base, and splitspoon or shelby tube of the sub grade
to 4' below the surface of the subgrade. • Within the 12" holes- augering to 12" below the top of the subgrade. • Shoulder Augering- to depth of20' or to refusal.
Construction Sampling May- September(?), 1998 Within the monitoring areas, a field crew from the RD&T division will:
• Note the locations and dimensions of all PCCP joint/crack repairs. • Mark the finished surface of the asphaltic concrete overlay with a thermoplastic
pavement marker to locate the joints and working cracks.
Within the monitoring areas of the minimal pavement repair test sections, District 1 Construction personnel will note the joints and cracks that would have been repaired under normal pavement repair procedures.
Within the paving hoppers or the sampling areas when possible, an RD&T field crew will: • Obtain bulk samples of the SAF and all SuperPave Mixes.
At the asphalt plant, the RD&T field crew will: • Collect bulk aggregate and asphalt cement samples.
Post-Construction Sampling September or October, 1998 Within the monitoring areas, the RD&T field crew will:
• Complete a distress survey if necessary. • Perform FWD Testing of the finished asphaltic concrete surface.
J:IRI97045\WORKPLAN.SAM

Within the monitoring areas, District I Construction Personnel will perform 5 point cross section surveys of the finished asphaltic concrete surface.
Within the sampling areas, the RD&T field crew will: • Obtain 4" cores of the asphaltic concrete overlay.
,.. REPORTS AND ANNUAL MONITORING-
• December 31. 1998 - The test site construction will be summarized in a construction report.
• 1999. 2000. 2001. 2002. and 2003 on the anniversary of the test sections being open to trafficThe annual monitoring will include but will not be limited to the following: five point cross sections, distress surveys, and FWD tests of the monitoring areas. As well as coring of the sampling areas in the years 2000 and 2003.
• December 31. 2003 - The annual surveys will be summarized to create a final report detailing the performance of the test sections.
J:IRI97045\WORKPLAN.SAM

Staffing: Preliminary Planning
Manda Brandt, Intermediate Research Assistant Senior Field Testing Technician Testing Technician
Construction Sampling Manda Brandt, Intermediate Research Assistant Senior Field Testing Technician Testing Technician Temporary Employee Temporary Employee
Annual Surveys (Five years at 40 hours/year) Senior Field Testing Technician Senior Field Testing Technician Senior Field Testing Technician Senior Field Testing Technician
Final Report and Presentations Senior Research and Development Engineer
Equipment:
120 hours 40 hours
120 hours
80 hours 240 hours 240 hours 240 hours 240 hours
200 hours 200 hours 200hours 200 hours
160 hours
At this time, it is estimated that we will have ample in-house equipment to complete this project. However, some incidental equipment and supplies may need to be purchased at the time of construction, this cost will be reflected in the budget.
J:\RI9704S\WORKPLAN.SAM

Budget:
Estimated Construction Cost
1998 EXPENSES:
RD&T Salaries: Preliminary Planning
Intermediate Research Assistant Senior Field Testing Technician Testing Technician
Construction Sampling Intermediate Research Assistant Senior Field Testing Technician Testing Technician Temporary Employee Temporary Employee
Sub-Total Salaries
120 hours 40hours
120 hours
80 hours 240hours 240hours 240 hours 240hours
Salary Additive (@67%) Possible Overtime
Total1998 Salaries
$3,500,000.00
@ $19.00/hr $2,280.00 @ $17.00/hr $ 680.00 @ $13.00/hr $ 1,560.00
@ $19.00/hr $ 1,520.00 @ $17 .00/hr $ 4,080.00 @ $13.00/hr $3,120.00 @ $ 7.50/hr $ 1,800.00 @ $ 7.50/hr $ 1,800.00
$16,840.00 $11,282.80 $5,000.00
$33.122.80
RD&T Equipment: All per mile costs include operating and depreciation costs, respectively. 1998 Construction Sampling
5107 Bridge Van Pool Car 5757 Drill Truck FWD Van
12 trips X 550 mi @($0.212/mi+$0.130/mi) $2,257.20 12 trips X 550 mi @($0.131/mi+$0.142/mi) $ 1,801.80 2 trips X 550 mi @($0.293/mi+$0.141/mi) $ 477.40 2 trips X 550 mi @($0.250/mi+$0.150/mi) $ 440.00
Incidental Equipment and Supplies $15,000.00
Total 1998 Equipment $ 19.976.40
TOTAL FOR 1998 $53,099.20
1999 Annual Survey 5 Senior Field Testing Technicians 40 hours @ $17 .00/hr $ 3,400.00
Salary Additive (@67%) $ 2,278.00 5107 Bridge Van 1 trips X 550 mi @($0.212/mi+$0.130/mi) $ 188.10 Pool Car 1 tripsX550mi@($0.131/mi+$0.142/mi) $ 150.15 FWD Van 1 trips X 550 mi @($0.250/mi+$0.150/mi) $ 220.00
TOTAL FOR 1999 $6,236.25
J:IRJ97045\WORKPLAN.SAM

2000 Annual Survey 5 Senior Field Testing Technicians 40 hours @ $17.00/hr $ 3,400.00
Salary Additive (@67%) $2,278.00 5107 Bridge Van I trips X 550 mi @($0.212/mi+$0.130/mi) $ 188.10 Pool Car I trips X 550 mi @($0.131/mi+$0.142/mi) $ 150.15 5757 Drill Truck I trips X 550 mi @($0.293/mi+$0.141/mi) $ 238.70 FWD Van I trips X 550 mi @($0.250/mi+$0.150/mi) $ 220.00
TOTAL FOR 2000
2001 Annual Survey 5 SeniorFieldTestingTechnicians 40hours @$17.00/hr
Salary Additive (@67%) 5107 Bridge Van I trips X 550 mi @($0.212/mi+$0.130/mi) Pool Car I trips X 550 mi @($0.131/mi+$0.142/mi) FWD Van I trips X 550 mi @($0.250/mi+$0.150/mi)
TOTAL FOR 2001
2002 Annual Survey 5 Senior Field Testing Technicians 40 hours @ $17.00/hr
Salary Additive (@67%) 5I07 Bridge Van I trips X 550 mi @($0.212/mi+$0.130/mi) Pool Car I trips X 550 mi @($0.13I/mi+$0.I42/mi) FWD Van I trips X 550 mi @($0.250/mi+$0.I50/mi)
TOTAL FOR 2002
2003 Annual Survey 5 Senior Field Testing Technicians 40 hours @ $I7.00/hr
Salary Additive (@67%) 5I07 Bridge Van I trips X 550 mi @($0.2I2/mi+$0.130/mi) Pool Car I trips X 550 mi @($0.131/mi+$0.142/mi) 5757 Drill Truck I trips X 550 mi @($0.293/mi+$0.141/mi) FWD Van I trips X 550 mi @($0.250/mi+$0.150/mi)
2003 Final Report
$6,474.95
$3,400.00 $2,278.00 $ I88.IO $ 150.15 $ 220.00
$6,236.25
$3,400.00 $2,278.00 $ I88.10 $ I50.I5 $ 220.00
$6,236.25
$3,400.00 $2,278.00 $ 188.IO $ 150.15 $ 238.70 $ 220.00
Senior R & D Engineer Salary Additive
I60 hours @ $24.00/hr $ 3,840.00 (@67%) $2,572.80
TOTAL FOR 2003 $12,887.75
TOTAL RD&T PROJECT COST $91,170.65
J:IRI9704SIWORKPLAN.SAM

APPENDIXC Mix Designs

JOB NO.• Jt10737
MISSOURI HIGHWAY AND TRANSPORTATION DEPARTMENT • DIVISION OF MATERIALS
ASPHAL nc CONCRETE SAND ANTI-FRACTURE MIXTURE
SAF98·3
~F19i~~-~.~~~S'~-~~-~~9!~======.ROU=.,-:TE:::,•:=1:::·29=====~COUN~ .. =.TY~-~- l!?l.'--..,t.-UiJorrAi#rAl'i:-'p~r._~·-~c~,ll!98c:c ... =-··-""-=·==-====,=;;;:·=
rB.QQl;18!C!??EIF~C!~ITYCODEIPRODUCER-L~~~TION~==========~IDE~-N.:w SP.GJ:t. !§~~~R .. FQ_~~¥)~ I LEDGES I %CHERT ABS.,_,
i!_~FLS I 3061800211 I ldel<er-Amazonla Ouany. Amazonia. MO 98- 4631 2.343 2.733 Plansmoulh I 3P 6.1 :
2.530 ..• __ 2:7~2 _ .. /lm!"onla ..... L IJA!, .... ··------ ... _ ~.0 __ .
98- ~.1!29 ___ z.54o __ 2._7.6L ~mazon!• .. __ !.. _I!AZ_ ···--___ -~:) _ .
;t_002FAAF.NS_ .J 1tJ201.0C!I !.'.. __ !_ H!>~lday_ S&G No,_t, St._Josepll. ~<L. __ ··-· ... _ ___ ....... 98- 4628 2.815 0.4 - '
2.844 Mtsoou~ River Sand
----------·-- --······-- ---·-·--· ······-···--···-··- -------·--·-·--- ·------- -·- -· ·-------------------- ·---------·-··-·-··---· --------------···----·-··
·1015AC!'Q .. 70-34 I 3025937027 I Koch No. 2370. Musk~~og~ee~·~OK~=======98~·==5~26~~ ~,~.0~16~==~PG~71!_:34 ~Mold Temp!:.~27o:=5~'=F====
MATERIAL
314"
112"
318" 14
18
116
130
150
1100
~~ ·-
LABORATORY
LSS
100.0
100.0
1000 98.0
78.1
56.6
43.9
33.6
26.9
98·
4!!~---
MFS
98·
53!2==
LSS
100.0 100.0
100.0 100.0
99.8 100.0
71.2 100.0
43.3 63.5
28.4 34.1
21.0 18.1
16.6 8.2
14.0 2.8
98-
~628
N!?
100.0
100.0
100.0 99.9
98.3
93.2
75.3
29.1
0.2
II 98· 98- 98· 98·
·---=~~~J=.-.o="'~7.-~_.="-"'-'~~o=.=c~~JI,.--PERCENT 2().0_ 20_.0
20.0 20.0
20.0 20.0
20.0 20.0 19.6 14.2
15.6 8.7
11.3 5.7
8.8 4.2
6.7 3.3
5.4 2.8
__ 2~c<!_-~5,9
25.0 35.0
25.0 35.0
25.0 35.0 25.0 35.0
15.9 34.4
8.5 32.6 4.5
2.1
0.7
26.4
10.2
0.1 1.6 . 0.1 2~.1 12.5 c!...-==~='==='.;====--==========!'.====5,Q=-----="'~=== - 0.::_4 ===0-~0r======== - -- ... ,.
II Gmm• MIX COMPOSITION
COMB.
GRAD .. . -·· j
100.0
100.0
100.0
93.8 74.6
58.1 43.9
22.3
90
7.9
CHARACTERISTICS
AASHTOT-4 II Gsbo
IIGvroWI.•
2.315
2.531
4600
i 25.GYBAIIONS.!Ndesl 50 GYRATIONS lNI'I1axl I r VOIDS• 1.4 Gmbo 2.283 % VOIDS• 1.1 Gmbo 2.290 ,
"I VMA• 17.6 Hveem VMA• 17.3 Hveem
I MIN.AGG.
BINDER CONTENT
91.4%
8.6%
-.. ~c·.-=.-ooc.-.-=·.·==--=c=JI CALIBRATION NUMBER • MASTER GAUGE SERIAL NO. •
80069
no
St~.· 1~===c-===='==---='-~t~.--'-~--~~ _ ~·==========' MAST. GA. BACK. CNT.•
SAMPLE WEIGHT •
2215 8100
AI • • 1.368282 A2 • 2.142846
Test Temp. • 538• C
Conection Factor • 0.37
Min. Test WI. • 1200
""::.:;J
]

'M"OURI DEPARTIIEH1'0FTRANSPORTA110N • DIVISION OF IIAlERW.S SPt90 98-38 R3
ASPIW.TICCONCREIE TYPESPtiO
JOB NO.• Jtl0737 PROJECT• ACJM.ACIMG-29-211391 ROUTE•I-29 COUNTY• Holt DATE• 7128198
BULK APPAR.
~ CODE/FACILITYCODE /PRODUCER-lOCATION IDENT. SP.GR. SP.GR. FORMATION I LEDGES I '!1. CHERT ABS.
00207SPLSE /3030893411 I Mallin MM 1934, Sa.vamllh. MO 98- 4510 2.554 2.730 Amazonia --'-~--- ---- _________ 2,_L --- --·----------- --- ... -·
00204SPLSE I 3030893411 I Mallin Uall1934, Savlnnllh. MO 98- 4511 2.538 2.739 Amazonia I BAZ 2.9 -·- . --- ·-------· --------------00204SPLSE I 3030893411 --L~-~-f934_._~MQ ________________ 911-__ ~ 2.532 2.784 Amazonia I BAZ 3.3 - -----------002MSACMS I 3030693411 I Mallin Marl1934, S..11ooato, MO
00204ACGV I 30211501411 I LYJIWI~ft4,~Noblall<a
002HUCHI. I 3001704018 I Alii Glove eerner.eo., ~ MO
Ot!SACPG..84-22 /3042000124 I Shell Oil Kaow.CIIY.MOIMia •. Wood"- ill
t.IATERIAL 98- 98-
IOENT. 4510 4511
98038 t9.0mm 9.5mm
314" 100.0 100.0
ttr 57.9 100.0
3m" 23.8 100.0
M 3.8 28.8 liB 3.3 4.8
"•ta S.t 3.8
m s.o 3.8 .so 2.8 3.5
1100 2.7 3.4
~ 2.4 3.2
LABORATORY • IJGmm-CHARACTERISTICS UOmbo AASHTOTP4 HGob-
CAUBRATIONNUMBER • MASTER GAUGE SERIAL NO. •
98-
4382
9.5mm
100.0
100.0
100.0
42.2
3.5 2.7
2A 2.1
u 1.7
2.449
2.351
2.551
80104
770
98- 98- 98-
4363 4384 691
MFS GV HI.
100.0 100.0 100.0
100.0 100.0 100.0
100.0 100.0 100.0 89.8 88.4 100.0 88.2 84.0 100.0
38.2 42.5 100.0
22.1 27.0 100.0 12.0 15.8 100.0
5.8 8.4 89.5 3.7 8.0 89.0
'!I. VOIDS. 4.0 V.M.A.• 13.0
'!I.FUED- 69
MAST. GA. BACK. CNT.• SAMPLE WEIGHT •
911- 4363 ~ ___ 2._!!5 __ Ama>l)r_i_a~-------------2~7-
__ 911- 4384 ___ 2,_568 ___ -~-831 PlabRI. 0.9 ··-···----- ... -----------··· -------- ··-----------··-·
98-
98-
n II
PERCENT
n TSR-
-200/AC-
GviOWl•
2211
7300
691 2.251 ___ Hyi!,_Lme
tt58 1.032
98- 98- 911-
4510 45tt 4382
27.0 20.0 18.5
27.0 20.0 18.5
15.8 20.0 18.5 8.5 20.0 18.5
t.O 5.4 7.8 0.8 1.0 0.8 0.8 0.8 0.5
0.8 0.7 0.4 0.8 0.7 0.4
0.7 0.7 0.4 0.8 0.8 0.3
83 ...... 9 t.t Ndeeo 129
4800 N- 204
At - 4.489069 A2 • 3.183845
PO 84-22 GviO Mold Temo. 286"·297"1'
911- 98- 98-
4383 4384 691 COMB
23.5 10.0 1.0 GRAD
23.5 10.0 1.0 100.0
23.5 10.0 1.0 88.6
23.5 10.0 1.0 78.5
23.5 8.8 1.0 47.5 18.0 8.4 1.0 25.9 8.0 4.3 t.O 18.4
5.2 2.7 t.O 10.8
2.8 1.8 t.O 7.3
1.4 0.8 t.O 5.1
0.9 0.8 1.0 4.0
MIX COMPOSITION MIN.AGG. 84.4'!1.
ASPHALT CONTENT 5.8"'
Test Temp.• 538*C Cornldlon FactaP <0.08

IIISSOURI DEPMTIIIENT OF 111NISPDRTA'TIOH • DMSION 01' MAli!RIALS
ASPIW • ."riC CONCRETE TYPE 1Pt2S
SP125 98- 38ll2
JOB NO.• PROJECT•
Jtl0737 ACfM.ACIMQ.29.2(138) DATE- 7f2MJ8
BULl( APPAR. %
batvv.,.,.CODEIFACUTYCODEIPRODUCER-LOCATION !DENT. SP.GR. SP.GR. FORMATION I LEDGES I %CHERT AilS.
~--/3CJ30893411 .1~~~11:14-'--~"'-'MO"=-------=· 4510 2.554 2.730 --~-__!_8AZ ___________ 2.~-00204SPLSE 13CJ30893411 ~-~No.934,S..••IIIl,MO ·- ..... 98- 45!1. . _2.538 2.738 Amazonia 18AZ 2.9
~--1.3000BB_3_111 .L~~No.~_~MO, ________ 11!: __ ~-1:.~-~,?81_---~--_.! -~ ·--· _ _ _ _ --~'-'-
(10204~ • .J.~!tj_f'="""".Ridlof..'!.'\~,.~~---'"-"~'"~·-----·-~-~--~~----_1,!1;1_!_ __ ~!'Uv"!--.---·· --------- ___ !1-9_ ~.J.S.00!!01018__!~~-~~tlp'911!'d..~~-----'·""--!1!1-~_!_ _____ ~l,ln!e ______________________ _
015ACPG .. I4-22 13042000124 I ShoiOI -CIIv.MO!Mia.. Wood-.1.1 98- 1158 1.032 PGM-22 GwoMoldl...,_288".297"f
"'TERIAL 98- 98- 98- 98- 98- 98- n .. .. 98- .. .. ..
~me~NT~·----•45~to~--m45•'•'--•4~~~---4~~=---~~~--~an~-------~"----•45~t~o~~45~1~1--•4~~~---4~~~--~4~~----~·~• ...... COMB
98038 lt.Omm Umm Umm MFS f1V HI. PERCENT 15.0 21.0 24.0 29.0 10.0 1.0 GRAD
1' 314" 112" 318" .. 118 118
1130
ISO 1100
100.0 100.0
57.9 23.9 3.8 3.3 3.1 3.0 u 2.7
1~0 1~0 1~0
1~0 100.0 100.0 100.0 100.0 100.0 100.0 100.0 100.0 28.9 42.2 811.1
4.8 3.5 • .2 3.1 2.7 38.2
3.1 2.4 22.1 3.5 2.1 12.0 3.4 1.8 5.1
1~0 1~0
100.0 100.0 100.0 100.0 100.0 100.0 88.4 100.0 84.0 1~0
42.5 100.0 27.0 100.0 15.1 100.0 8.4 ...
1200 2.4 3.2 1.7 3.7 1.0 •. o LABORATORY • I Gmm
iCtUIRAC:reRIISTICS I Gmbo MSHTOTP4 n 0o11-
CAUIIRATION MJMBER • MASTER GAUGE SERIAL NO. •
2.438 2.340 2.578
110080 770
4.0
14.8 73
MAST. GA. BACIC. CNT.• SAMPLEWEJOHT •
H
2205 7500
15.0 21.0 24.0 29.0 10.0 1.0 100.0 15.0 21.0 24.0 29.0 10.0 1.0 100.0 8.7 21.0 24.0 29.0 10.0 1.0 83.7 3.8 21.0 24.0 29.0 10.0 1.0 •. 8 0.5 5.8 10.1 29.8 ... 1.0 54.8
0.5 1.0 0.8 .... 8.4 1.0 29.5
o.5 0.1 0.8 11.1 4.3 1.0 11.3 0.5 0.8 0.8 8.4 2.7 1.0 12.0 0.4 0.7 0.5 3.5 1.1 1.0 7.7 G.4 0.7 0.5 1.7 o.e 1.0 5.2
G.4 0.7 0.4 1.1 0.8 1.0 4.2
83 - • 0.1 - 108
4800 - 174 AI-~
A2 • 3.101187
83.7% 8.3%
T111T...,.• 538'C
CoooldloloF-· +0.011%

APPENDIXD SAF Special Provisions
Job No. J110737
Q. EXPERIMENTAL SAND ANTI-FRACTURE MIXTURE MSP-97-10
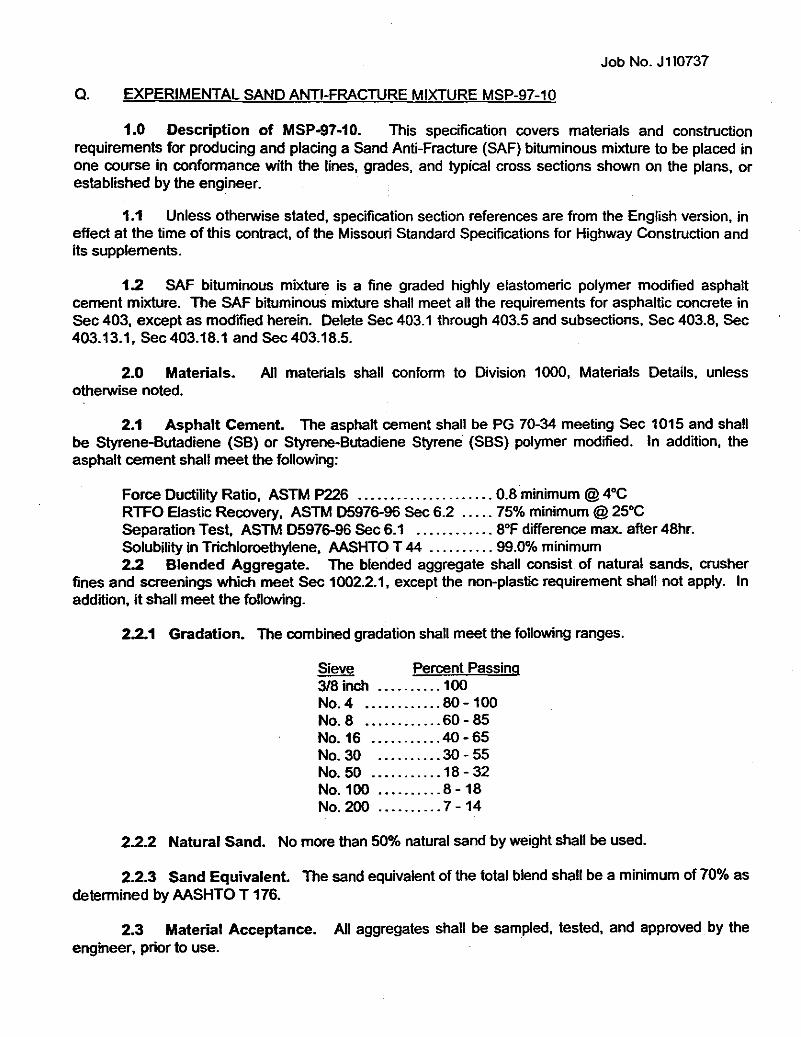
1.0 Description of MSP-97-10. This specification covers materials and construction requirements for producing and placing a Sand Anti-Fracture (SAF) bituminous mixture to be placed in one course in conformance with the lines, grades, and typical cross sections shown on the plans, or established by the engineer.
1.1 Unless otherwise stated, specification section references are from the English version, in effect at the time of this contract, of the Missouri Standard Specifications for Highway Construction and its supplements.
1.2 SAF bituminous mixture is a fine graded highly elastomeric polymer modified asphalt cement mixture. The SAF bituminous mixture shall meet all the requirements for asphaltic concrete in Sec 403, except as modified herein. Delete Sec 403.1 through 403.5 and subsections, Sec 403.8, Sec 403.13.1, Sec 403.18.1 and Sec 403.18.5.
2.0 Materials. All materials shall conform to Division 1000, Materials Details, unless otherwise noted.
2.1 Asphalt Cement. The asphalt cement shall be PG 70-34 meeting Sec 1015 and shall be Styrene-Butadiene (SB) or Styrene-Butadiene Styrene (SBS) polymer modified. In addition, the asphalt cement shall meet the following:
Force Ductility Ratio, ASTM P226 ..................... 0.8 minimum @ 4°C RTFO Bastic Recovery, ASTM 05976-96 Sec 6.2 ..... 75% minimum @ 25°C Separation Test, ASTM D5976-96 Sec 6.1 ............ 8°F difference max. after 48hr. Solubility in Trichloroethylene, AASHTO T 44 .......... 99.0% minimum 2.2 Blended Aggregate. The blended aggregate shall consist of natural sands, crusher
fines and screenings which meet Sec 1002.2.1, except the non-plastic requirement shall not apply. In addition, it shall meet the following.
2.2.1 Gradation. The combined gradation shall meet the following ranges.
Sieve Percent Passing 318 inch .......... 1 00 No.4 ............ 80-100 No.8 ............ 60-85 No. 16 .......... .40- 65 No. 30 .......... 30- 55 No. 50 ........... 18- 32 No.100 .......... 8-18 No. 200 .......... 7- 14
2.2.2 Natural Sand. No more than 50% natural sand by weight shall be used.
2.2.3 Sand Equivalent. The sand equivalent of the total blend shall be a minimum of 70% as determined by AASHTO T 176.
2.3 Material Acceptance. All aggregates shall be sampled, tested, and approved by the engineer, prior to use.

Job No. J 110737
3.0 Job Mix Formulas. The contractor shall contact Larry Reddick, Koch Materials Company, 4915 Chelsea, Kansas City, Missouri, 64130-2623, (816) 922-3413, for preparation of the job mix formulas. Koch Materials Company will provide the testing equipment to perform the Force Ductility Ratio testing, the Hveem Stability testing and the Complex Shear Modulus testing, and will provide personnel to conduct the testing in the field lab. Koch Materials Company will provide technical support for production and placement of the SAF mixture.
3.1 The manufacturer of the SAF bituminous mixture shall obtain, in the presence of the engineer, representative samples of asphalt cement and mineral aggregates for tests. The samples of materials shall be of the size specified by the engineer and shall be submitted to the Central Laboratory for testing. The manufacturer shall also develop and submit the job mix formula and present certified test results for the engineer's approval. At least 60 days prior to the manufacturer preparing any of the mixture on the project, the engineer shall have received both the representative samples of the job mix materials and the manufacturer's proposed job mix formula.
3.1.1 No mixture will be accepted for use until the job mix formula for the project is approved by the engineer.
3.1.2 The job mix formula shall be within the master range specified for the SAF bituminous mixture, and shall include the type and sources of all materials, the gradations of the aggregates, the relative quantity of each ingredient, and shall state a definite percentage for each sieve fraction of aggregate and for asphalt cement.
3.1.3 The job mix formula approved for the SAF bituminous mixture shall be in effect until modified in writing by the engineer. When unsatisfactory results or other conditions occur, or should a source of material be changed, a new job mix formula may be requested.
3.2 Proportioning. The engineer will approve the job mix formula and all materials and methods prior to use and will approve the proportions to be used within the following limits.
Asphalt cement, percent . . . . . . . . . . . . . . . . . . . . . . 7.5 - 1 0 Additives ..................... ~ ............. As required
3.3 Mixture Testing Procedures.
3.3.4 SAF bituminous mixture shall be tested in accordance with AASHTO Provisional Standard TP 4, Edition 1 C. Standard Method for Preparing and Determining the Density of Hot Mix Asphalt (HMA) Specimens by Means of the SHRP Gyratory Compactor, except as herein noted.
3.4 Compaction Criteria.
3.4.1 The number (N) of gyrations required for gyratory compaction shall be as follows:
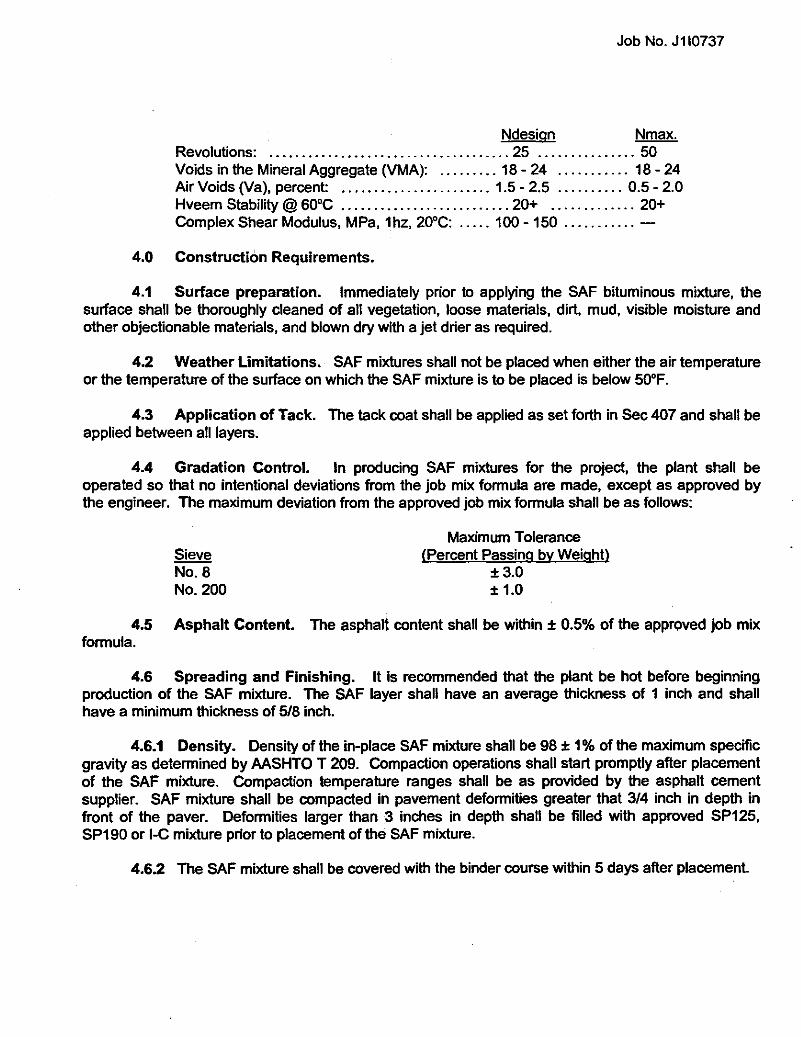
Job No. J110737
Ndesign Nmax. Revolutions: ..................................... 25 ............... 50 Voids in the Mineral Aggregate (VMA): ......... 18-24 ........... 18-24 Air Voids (Va), percent: ....................... 1.5 - 2.5 .......... 0.5 - 2.0 Hveem Stability @ eo•c .......................... 20+ ............. 20+ Complex Shear Modulus, MPa, 1hz, 200C: ..... 100-150 ........... -
4.0 Construction Requirements.
4.1 Surface preparation. Immediately prior to applying the SAF bituminous mixture, the surface shall be thoroughly cleaned of all vegetation, loose materials, dirt, mud, visible moisture and other objectionable materials, and blown dry with a jet drier as required.
4.2 Weather Umitations. SAF mixtures shall not be placed when either the air temperature or the temperature of the surface on which the SAF mixture is to be placed is below so•F.
4.3 Application of Tack. The tack coat shall be applied as set forth in Sec 407 and shall be applied between all layers.
4.4 Gradation Control. In producing SAF mixtures for the project, the plant shall be operated so that no intentional deviations from the job mix formula are made, except as approved by the engineer. The maximum deviation from the approved job mix formula shall be as follows:
Sieve No.8 No. 200
Maximum Tolerance (Percent Passing by Weight>
±3.0 ± 1.0
4.5 Asphalt Content. The asphalt content shall be within ± 0.5% of the approved job mix formula.
4.6 Spreading and Finishing. It is recommended that the plant be hot before beginning production of the SAF mixture. The SAF layer shall have an average thickness of 1 inch and shall have a minimum thickness of 5/8 inch.
4.6.1 Density. Density of the in-place SAF mixture shall be 98 ± 1% of the maximum specific gravity as determined by AASHTO T 209. Compaction operations shall start promptly after placement of the SAF mixture. Compaction temperature ranges shall be as provided by the asphalt cement supplier. SAF mixture shall be compacted in pavement deformities greater that 3/4 inch in depth in front of the paver. Deformities larger than 3 inches in depth shall be filled with approved SP125, SP190 or 1-C mixture prior to placement of the SAF mixture.
4.6.2 The SAF mixture shall be covered with the binder course within 5 days after placement.

Job No. J110737
4.7 Verification specimens of the SAF mixture produced for the project shall be made in accordance with MSP-95-03N "Superpave Asphaltic Concrete Pavement".
4.7.1 The Voids in the Mineral Aggregate (VMA) and Air Voids (Va) shall be within± 1.0% of the approved job mix formula when compacted to N_..,.
4.8 Test Strip. This work shall consist of constructing SAF bituminous test strips for each mix design to determine the compactive effort necessary to provide the specified density.
4.8.1 Test strips shall be constructed after approval of a job mix formula and calibration of the SAF bituminous mixing plant. Tack coat shall be applied to the roadbed section followed by the placement of approximately 250 tons or one hour's production, which ever is less, of approved mix in a single lane within the project limits. The paver and rollers to be used on the project shall be used to put down the test strip. Separate test strips shall be provided for each mix design. Acceptable test strips shall meet density and all other specification requirements for the mixture tested.
4.8.2 Density will be determined in accordance with this specification. Steel wheel rollers in the static mode shall be used for compaction of the mixture. Pneumatic rollers and steel wheel rollers in the vibratory mode shall not be used. If necessary additional test strips shall be constructed until a rolling pattern has been established which will provide the specified density. A new test strip shall also be required whenever a change in the job mix formula occurs, the compaction method or the compaction equipment is changed or unacceptable results occur. Test strips which do not have the specified density shall be removed as directed by the engineer. No additional mix shall be laid until a rolling pattern, acceptable to the engineer, has been established on a test strip.
4.8.3 The materials in test strips approved by the engineer will be paid for at the unit price bid for those materials as provided in the contract. All materials in unacceptable test strips removed by the contractor shall become the property of the contractor and will be disposed of by the contractor at the expense of the contractor.
4.9 Any traffic damaged or marred areas shall be repaired by the contractor at no additional charge.
5.0 Method of Measurement.
5.1 Measurement of SAF bituminous mixture complete in place, including any multiple passes or courses, will be made to the nearest square yard. Measurement of individual passes or courses will not be made. Final measurement of the completed surface will not be made except for authorized changes during construction, or where appreciable errors are found in the contract quantity. The revision or correction will be computed and added to or deducted from the contract quantity.
6.0 Basis of Payment.
6.1 The accepted quantity of SAF bituminous mixture will be paid for at the contract unit price for SAF bituminous mixture, per square yard.

Job No. J110737
R SUPERPAVE ASPHALTIC CONCRETE PAVEMENT MSP-95-03N
1.0 DESCRIPTION OF MSP-95-03N. This work shall consist of providing a SuperPave bituminous mixture (Type SP125, SP125LP, SP190, or SP250) to be placed in one or more courses on a prepared base or underlying course in conformance with the lines, grades, thicknesses, and typical cross sections shown on the plans, or established by the engineer.
1.1 Unless otherwise stated, specification section references are from the English version, in effect at the time of this contract, of the Missouri Standard Specifications for Highway Construction and its supplements.
1.2 SuperPave (SP) bituminous mixtures are dense graded bituminous mixtures compacted in the Laboratory with a SuperPave Gyratory Compactor. The bituminous mixtures shall meet all the requirements for asphaltic concrete in Sec 403, except as modified herein. Delete Sec 403.1 through 403.5 and subsections.
2.0 MATERIALS. All materials shall conform to Division 1000, Materials Details, unless otherwise noted.
· 2.1 Asphalt Cement. The asphalt cement shall be a Performance Graded material of the grade specified in the contract for the SP125, SP125LP, SP190 and SP250 mixtures.
2.2 Aggregates. Aggregates shall meet the requirements of Sec 1002 for Type 1-C when a SP125/SP125LP mixture is specified and for Type 1-B when a SP190 or SP250 mixture is specified except as herein modified.
2.2.1 Sec 1002.1.1.1, 1002.1.3.1, 1002.1.5, 1002.1.8, 1002.2.2, and 1002.2.3 will not apply. However, gravel aggregates shall be washed sufficiently to remove any objectionable coating, and crushing of gravel aggregates will be required to meet the coarse or fine aggregate angularity specified herein.
2.2.2 Fine aggregates manufactured by the mechanical reduction of sound durable rock shall be manufactured from ledges which meet the same soundness requirements as for the coarse aggregate.
2.2.3 Blended Aggregate. The blended aggregate shall meet the grading for the specified SP mixture.
2.2.3.1 For SP125LP mixtures, at least 50 percent by volume of the plus number 8 material shall be from crushed porphyry as specified in Sec 1 002. Depending on the actual gradation of porphyry aggregate furnished, the amount of crushed porphyry required will vary, however at least 40 percent by weight of crushed porphyry will be required.
Job No. J110737
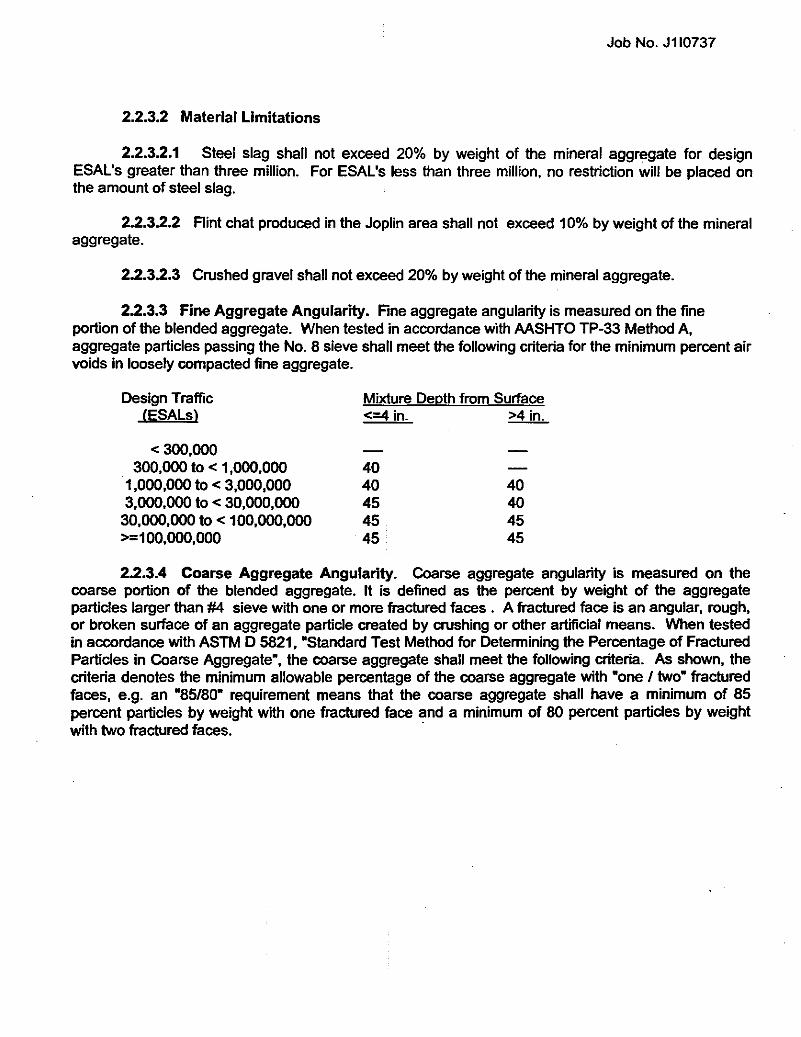
2.2.3.2 Material Limitations
2.2.3.2.1 Steel slag shall not exceed 20% by weight of the mineral aggregate for design ESAL's greater than three million. For ESAL's less than three million, no restriction will be placed on the amount of steel slag.
2.2.3.2.2 Aint chat produced in the Joplin area shall not exceed 1 0% by weight of the mineral aggregate.
2.2.3.2.3 Crushed gravel shall not exceed 20% by weight of the mineral aggregate.
2.2.3.3 Fine Aggregate Angularity. Rne aggregate angularity is measured on the fine portion of the blended aggregate. When tested in accordance with AASHTO TP-33 Method A, aggregate particles passing the No. 8 sieve shall meet the following criteria for the minimum percent air voids in loosely compacted fine aggregate.
Design Traffic CESALs)
< 300,000 300,000 to < 1,000,000
·1,000,000 to < 3,000,000 3,000,000 to < 30,000,000
30,000,000 to < 100,000,000 >=100,000,000
Mixture Depth from Surface <=4 in. >4 in.
40 40 45 45 45
40 40 45 45
2.2.3.4 Coarse Aggregate Angularity. Coarse aggregate angularity is measured on the coarse portion of the blended aggregate. It is defined as the percent by weight of the aggregate particles larger than #4 sieve with one or more fractured faces . A fractured face is an angular, rough, or broken surface of an aggregate particle created by crushing or other artificial means. When tested in accordance with ASTM D 5821, "Standard Test Method for Determining the Percentage of Fractured Particles in Coarse Aggregate", the coarse aggregate shall meet the following criteria. As shown, the criteria denotes the minimum allowable percentage of the coarse aggregate with "one I two" fractured faces, e.g. an "85/80" requirement means that the coarse aggregate shall have a minimum of 85 percent particles by weight with one fractured face and a minimum of 80 percent particles by weight with two fractured faces. ·
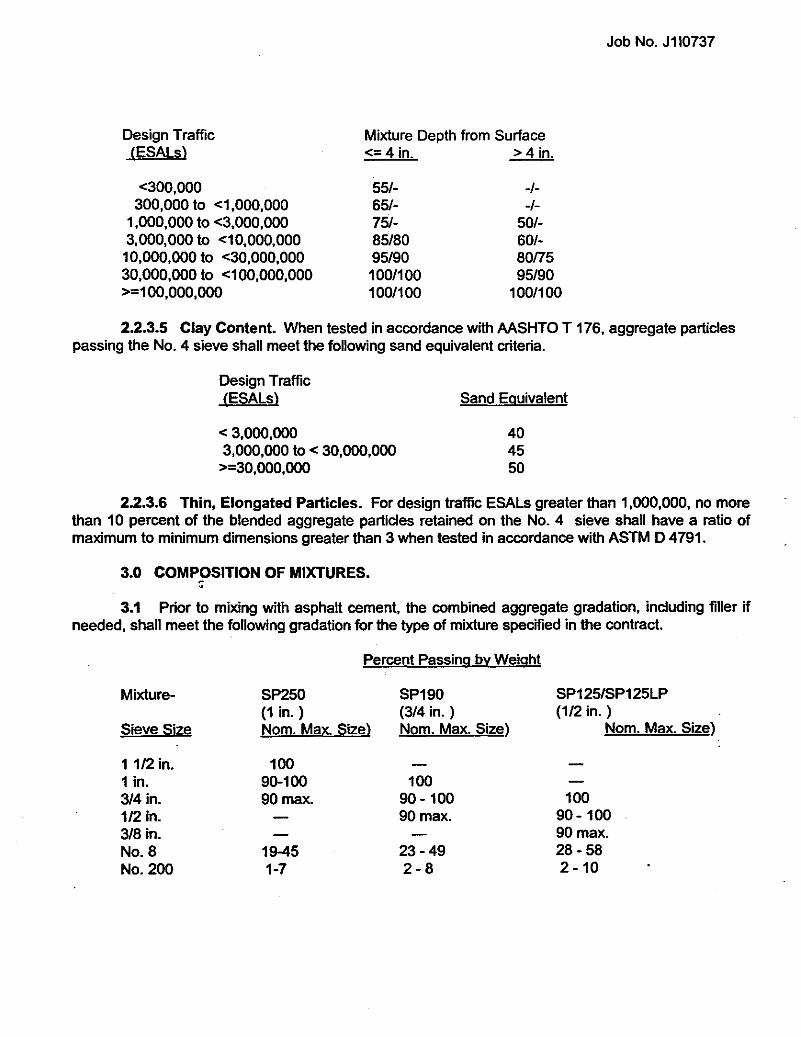
Design T raffle CESALsl
<300,000
Mixture Depth from Surface <= 4 in. > 4 in.
-1--1-
50/-60/-80/75 95/90
Job No. J110737
300,000 to <1,000,000 1,000,000 to <3,000,000 3,000,000 to <10,000,000
10,000,000 to <30,000,000 30,000,000 to <100,000,000 >=1 00,000,000
55/-65/-75/-85/80 95/90 100/100 1001100 100/100
2.2.3.5 Clay Content. When tested in accordance with AASHTO T 176, aggregate particles passing the No. 4 sieve shall meet the following sand equivalent criteria.
Design Traffic CESALsl
< 3,000,000 3,000,000 to< 30,000,000
>=30,000,000
Sand Equivalent
40 45 50
2.2.3.6 Thin, Elongated Particles. For design traffic ESALs greater than 1,000,000, no more than 10 percent of the blended aggregate particles retained on the No.4 sieve shall have a ratio of maximum to minimum dimensions greater than 3 when tested in accordance with ASTM D 4791.
3.0 COMPOSITION OF MIXTURES • . 3.1 Prior to mixing with asphalt cement, the combined aggregate gradation, including filler if
needed, shall meet the following gradation for the type of mixture specified in the contract.
Percent Passing by Weight
Mixture- SP250 SP190 SP125/SP125LP (1 in.) (3/4 in.) (1/2 in. )
Sieve Size Nom. Max. Size) Nom. Max. Size) Nom. Max. Size)
1 1/2 in. 100 1 in. 90-100 100 3/4 in. 90max. 90- 100 100 1/2 in. 90max. 90-100 3/8 in. 90max. No.8 19-45 23-49 28-58 No.200 1-7 2-8 2-10

Job No. J110737
3.1.1 The combined aggregate gradation shall not pass through the restricted zone as shown in the table below and as plotted on a 0.45 power chart.
Sieve Size
No.4 No.8 No.16 No.30 No. 50
SP250
39.5 26.8-30.8 18.1-24.1 13.6-17.6 11.4
Aggregate Restricted Zone SP190 SP125/SP125LP
34.6 22.3-28.3 16.7-20.7 13.7
39.1 25.6-31.6 19.1-23.1 15.5
3.1.2 A job mix formula may be approved which permits the combined aggregate gradation to be outside the limits of the master range when the full tolerances specified herein are applied.
3.1.3 All mixtures shall contain a minimum of one percent hydrated lime in accordance with Sec 403.5(e).
4.0 JOB MIX FORMULAS.
4.1 General. The contractor shall provide the job mix formula for each mixture. Representative samples of asphalt cement and mineral aggregates shall be submitted to the Central Laboratory for mixture verification. At least 30 days prior to the contractor preparing any of the mixture on the project, the engineer shall have received both the representative samples of the job mix materials and the contractor's proposed job mix formula.
4.1.1 The mix design shall contain the following information:
a. Source, grade and specific gravity of asphalt cement.
b. Source, type (formation, etc.), ledge number if applicable, and gradation of the aggregates.
c. Bulk and apparent specific gravities of each aggregate fraction in accordance with AASHTO T85 for coarse aggregates and AASHTO T84 for fine aggregates.
d. Specific gravity of hydrated lime or mineral filler, if used, in accordance with AASHTO T100.
e. Percentage of each aggregate component.
f. Combined gradation of the job mixture.
g. Percent asphalt cement, by weight, based on the total mix.

Job No. J 110737
h. Bulk specific gravity (Gmb)by AASHTO T166 Method A of a laboratory compacted mixture compacted Ndesign gyrations .
i. Percent air voids (V a) of the laboratory compacted specimen compacted to Ndesign gyrations.
j. Voids in the mineral aggregate (VMA) and voids in the mineral aggregate filled with asphalt cement (VFA) at Ndesign gyrations.
k. Maximum specific gravity (Gmm) as determined by AASHTO T209 after the sample has been short term aged in accordance with AASHTO TP4 , Edition 1 D.
I. The tensile strength ratio as determined by AASHTO T283.
m. The gyratory sample weight to produce a 115 mm minimum height specimen.
n. Gyratory molding temperature.
o. Number of gyrations at Ninitial• Ndesign.• and Nmaximum·
p. Dust proportion ratio (-200/Pbe).
q. Bulk specific gravity (Gsb) of the combined aggregate.
4.1.2 No mixture will be accepted for use until the job mix formula for the project is approved by the engineer.
4.1.3 The job mix formula shall be within the master range specified for the particular type of asphaltic concrete, and shall include the type and sources of all materials, the gradations of the aggregates, the relative quantity of each ingredient, and shall state a definite percentage for each sieve fraction of aggregate and for asphalt cement.
4.1.4 The job mix formula approved for each mixture shall be in effect until modified in writing by the engineer. When unsatisfactory results or other conditions occur, or should a source of material be changed, a new job mix formula may be required.
4.2 Mixture Testing Procedures.
4.2.1 SP bituminous mixtures shall be tested in accordance with AASHTO Provisional Standard TP 4, Edition 1 D, Standard Method for Preparing and Determining the Density of Hot Mix Asphalt (HMA) Specimens by Means of SHRP Gyratory Compactor, except as herein noted.
4.2.2 SP mix design shall follow the procedures defined for Level 1, Chapter 3, of SHRP Publication SHRP-A-407, the SuperPave Mix Design Manual for New Construction and Overlays.
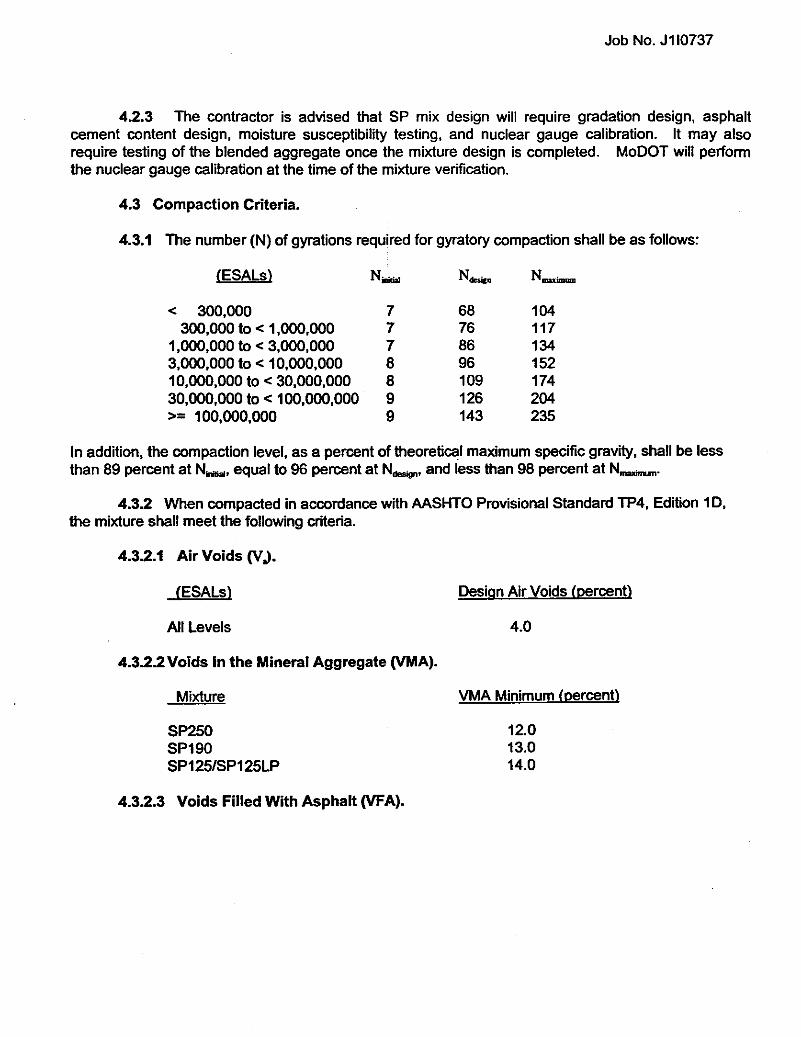
Job No. J110737
4.2.3 The contractor is advised that SP mix design will require gradation design, asphalt cement content design, moisture susceptibility testing, and nuclear gauge calibration. It may also require testing of the blended aggregate once the mixture design is completed. MoDOT will perform the nuclear gauge calibration at the time of the mixture verification.
4.3 Compaction Criteria.
4.3.1 The number (N) of gyrations required for gyratory compaction shall be as follows:
CESALs) N...., N-.. Nmaximum
< 300,000 7 68 104 300,000 to < 1 ,000,000 7 76 117
1 ,000,000 to < 3,000,000 7 86 134 3,000,000 to< 10,000,000 8 96 152 10,000,000 to< 30,000,000 8 109 174 30,000,000 to< 100,000,000 9 126 204 >= 100,000,000 9 143 235
In addition, the compaction level, as a percent of theoretical maximum specific gravity, shall be less than 89 percent at N..,.., equal to 96 percent at N_. and less than 98 percent at N..........,.
4.3.2 When compacted in accordance with AASHTO Provisional Standard TP4, Edition 1 D, the mixture shall meet the following criteria.
4.3.2.1 Air Voids (V.).
CESALs)
All Levels
4.3.2.2 Voids in the Mineral Aggregate (VMA).
Mixture
SP250 SP190 SP125/SP125LP
4.3.2.3 Voids Filled With Asphalt (VFA).
Design Air Voids (percent)
4.0
VMA Minimum {percent>
12.0 13.0 14.0

fESALsl
< 300,000 300,000 to <3,000,000 >= 3,000,000
4.4 Other Criteria.
VFA (percent\
70-80 65-78 65-75
Job No. J110737
4.4.1 The ratio of minus No. 200 material to effective asphalt cement (P .. ) shall be between 0.6 and 1.2.
4.4.2 The mixture shall have a tensile strength ratio (TSR) greater than 80 percent when tested in accordance with AASHTO T 283. Specimens for AASHTO T 283 shall be compacted to 95mm with 7 ± 1 percent air voids.
4.5 If difficulty is experienced in obtaining a satisfactory mixture with the aggregate combinations submitted, the contractor will be advised and new types or sources of materials may be required by the engineer. Note that additional aggregate other than local stone or sand such as a clean 3/8" chip or well graded manufactured sand composed of quality material, porphyry or higher quality limestone may be required in order to modify the mixture for compliance.
5.0 CONSTRUCTION. For the purposes of placement, SP250/SP190 shall be treated like Type 1-8 mixture and SP125/SP125LP like Type 1-C mixture, except that the compacted thickness for SP250 shall be between 3 inches and 4 inches and the compacted thickness for SP190 shall be between 2 inches and 3 inches.
5.1 Weather Limitations.
5.1.1 SP190 and SP125/SP125LP mixtures shall be placed in accordance with the weather limitations of Sec 403.
5.1.2 SP250 mixtures shall be placed in accordance with the following weather limitations. SP250 mixtures shall not be placed (1) when either the air temperature or temperature of the surface on which the mixture is to be placed is below 40 F, (2) on any wet or frozen surface, or (3) when weather conditions prevent the proper handling or finishing of the mixture. Temperatures are to be obtained in accorcance with MHTO Test Method T20.
5.2 Gradation Control. In producing mixtures for the project, the plant shall be operated so that no intentional deviations from the job mix formula are made. The maximum deviation from the approved job mix formula shall be as follows:

Nominal Maximum Sieve size for Mixture No.8 No.200
Job No. J110737
Max. Tolerance !Percent Passing by Mass)
± 5.0 ± 3.0 ± 1.0
5.3 Density. The final density of the in-place mixture shall be between 92 and 95 percent of the field determined maximum specific gravity (AASHTO T 209).
5.4 Asphalt Content. The asphalt content shall be within ±0.3 percent of the approved job mix formula.
5.5 Recompacted Mixture. When the produced mixture is recompacted using the SuperPave Gyratory Compactor, the mixture shall meet the following criteria.
5.5.1 The Voids in the Mineral Aggregate (VMA) shall be within ± 1.2 percent of the approved job mix formula at N- gyrations. The VMA will be determined using the average field determined bulk specific gravity's (AASHTO T 166) of the two SuperPave gyratory compacted specimens, the field calculated percent aggregate, the field measured percent asphalt as determined by the nuclear gauge method MHTD Test Method T54-10-94 or binder ignition method AASHTO TP53-95, Edition 1A, and the job mix formula aggregate bulk specific gravity.
5.5.2 The air voids (V J shall be within ± 1.0 percent of the approved job mix formula at N-.. gyrations. The air voids will be calculated from the field determined maximum specific gravity's (AASHTO T 209) and the field determined bulk specific gravity's (AASHTO T 166).
5.6 Test Strips. Bituminous test strips shall be constructed for each SP mixture of 2000 tons or more per contract to determine the compactive effort necessary to provide the specified density.
5.6.1 The test strips shall be constructed after approval of a job mix formula and calibration of the bituminous mixing plant. Prime or tack coat, if specified, shall be applied to the roadbed section followed by the placement of approximately 250 tons or one hour's production, which ever is less, of approved mix in a single lane within the project limits. The paver and rollers to be used on the project shall be used to put down the test strip. Separate test strips shall be provided for each mixture, using the thickness specified on the typical section. If more than one thickness is used for a specified mixture, the thicker lift shall be placed in a test strip as a minimum. Test strips for subsequent lifts which incorporate a new mix design may, at the contractor's option, be placed after completion of the previous lift. Acceptable test strips shall meet density, gradation, percent asphalt cement, and the volumetric requirements of the contract.
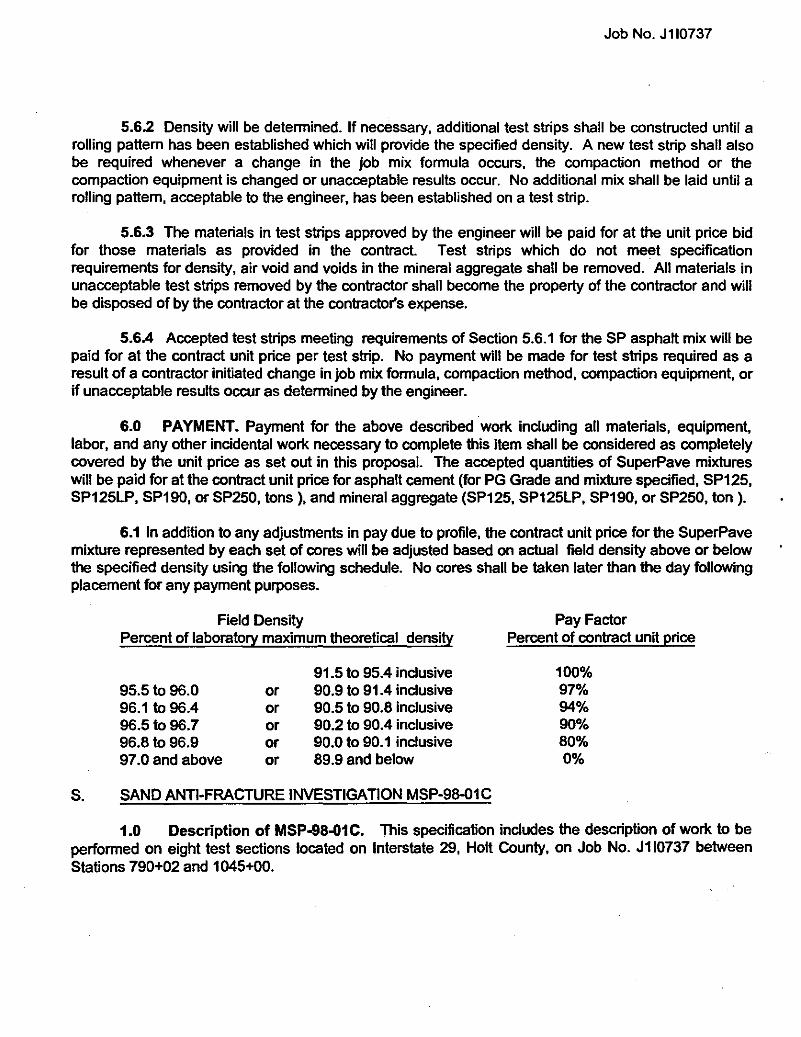
Job No. J110737
5.6.2 Density will be detennined. If necessary, additional test strips shall be constructed until a rolling pattern has been established which will provide the specified density. A new test strip shall also be required whenever a change in the job mix fonnula occurs, the compaction method or the compaction equipment is changed or unacceptable results occur. No additional mix shall be laid until a rolling pattern, acceptable to the engineer, has been established on a test strip.
5.6.3 The materials in test strips approved by the engineer will be paid for at the unit price bid for those materials as provided in the contract. Test strips which do not meet specification requirements for density, air void and voids in the mineral aggregate shall be removed. All materials in unacceptable test strips removed by the contractor shall become the property of the contractor and will be disposed of by the contractor at the contractor's expense.
5.6.4 Accepted test strips meeting requirements of Section 5.6.1 for the SP asphalt mix will be paid for at the contract unit price per test strip. No payment will be made for test strips required as a result of a contractor initiated change in job mix fonnula, compaction method, compaction equipment, or if unacceptable results occur as detennined by the engineer.
6.0 PAYMENT. Payment for the above described worl< including all materials, equipment, labor, and any other incidental worl< necessary to complete this item shall be considered as completely covered by the unit price as set out in this proposal. The accepted quantities of SuperPave mixtures will be paid for at the contract unit price for asphalt cement (for PG Grade and mixture specified, SP125, SP125LP, SP190, or SP250, tons), and mineral aggregate (SP125, SP125LP, SP190, or SP250, ton).
6.1 In addition to any adjustments in pay due to profile, the contract unit price for the SuperPave mixture represented by each set of cores will be adjusted based on actual field density above or below the specified density using the following schedule. No cores shall be taken later than the day following placement for any payment purposes.
Field Density Percent of laboratory maximum theoretical density
95.5to 96.0 96.1 to 96.4 96.5 to 96.7 96.8to 96.9 97.0 and above
or or or or or
91.5 to 95.4 inclusive 90.9 to 91.4 inclusive 90.5 to 90.8 inclusive 90.2 to 90.4 inclusive 90.0 to 90.1 inclusive 89.9 and below
S. SAND ANTI-FRACTURE INVESTIGATION MSP-98-01C
Pay Factor Percent of contract unit price
100% 97% 94% 90% 80% 0%
1.0 Description of MSP-98-01C. This specification includes the description of worl< to be perfonned on eight test sections located on Interstate 29, Holt County, on Job No. J110737 between Stations 790+02 and 1045+00.

Job No. J110737
1.1 Unless otherwise stated, specification section references are from the version, in effect at the time of this contract, of the Missouri Standard Specifications for Highway Construction and its supplements.
1.2 This specification explains the experimental features of eight test sections. The purpose of this investigation is to study rehabilitation methods for portland cement concrete pavement (PCCP). The test sections feature varying methods of pavement repair. Some sections include a Sand-Anti Fracture (SAF) layer. Two different performance graded binders are to be used in the SuperPave overlay. These test sections are explained in more detail in Section 2.5 of this specification.
2.0 General.
2.1 Contract specified tests and procedures shall govern the contractor's operations and the acceptance of the completed work. Due to the research nature of this project, there will be other extensive testing of materials and procedures during construction. Additional testing by the department or other interested parties for research purposes will not be used for contract compliance.
2.2 The contractor shall keep the engineer advised of all work schedules and changes. A schedule of work order is required seven days prior to work beginning and any changes, except those caused by weather or the engineer, shall be transmitted to the engineer in writing three days prior to the change in the work schedule occurring.
2.2.1 If notice of work schedule change is not received in the required time period, the contractor shall cease work until the required testing or data collection can be completed by the department or other interested parties.
2.3 The department and other interested parties shall be allowed access to all operations and be given the full cooperation of the contractor or approved subcontractors, whether work is accomplished on the project or at an off-site location.
2.4 Testing and Sampling. The contractor is advised that some testing or data collection, by department personnel, between operations may affect work scheduling. These possible intemuptions will be discussed as part of the pre-construction meeting and are to be included as part of the required written work schedule. Some possible instances include but are not limited to the following.
2.4.1 Distress surveying of the PCCP prior to overlay.
2.4.2 Five point cross sectioning of the PCC pavement by MoDOT construction personnel prior to and after the placement of the overlay, for thickness measurement as described in Section 5.1.
2.4.3 Photographic record, taken by MoDOT construction personnel, within the minimum repair test section monitoring areas, of the PCCP joints that would have been repaired under normal pavement repair practices.

Job No. J110737
2.4.4 Sampling of the PCCP, base or subgrade by means of coring or test pits.
2.4.5 Sampling of the SAF and asphaltic concrete by coring and bulk sampling.
2.4.6 Marking of the surface course of the asphaltic concrete by MoDOT Research, Development & Technology (RD&T) personnel as described in Section 5.2.
2.5 Test Section Locations and General Descriptions. There are eight test sections to be constructed on this project as listed below. NBL and SBL refer to Northbound Lane and Southbound Lane, respectively. The specified pavement treatments will span the full width of the roadway as described in this contract.
TEST SECTION # LIMITS GENERAL DESCRIPTION
1 1045+00 to 992+00 (NBL) 5 3/4" Asphalt Overlay with PG 64-28 Normal Pavement Repair
2 992+00 to 939+00 (NBL} 5 3/4" Asphalt Overlay with PG 64-28 Minimum Pavement Repair
3 939+00 to 864+00 (NBL) 5 3/4" Asphalt Overlay with PG 64-28 1"SAF Minimum Pavement Repair
4 864+00 to 790+02 (NBL) 5 3/4" Asphalt Overlay with PG 76-28 1"SAF Minimum Pavement Repair
5 790+02 to 844+00 (SBL) 3 3/4" Asphalt Overlay with PG 76-28 1"SAF Normal Pavement Repair
6 844+00 to 992+00 (SBL) 3 3/4" Asphalt Overlay with PG 76-28 1"SAF Minimum Pavement Repair
7 992+00 to 1018+00 (SBL} 3 3/4" Asphalt Overlay with PG 64-28 1"SAF Minimum Pavement Repair

Job No. J110737
TEST SECTION # LIMITS GENERAL DESCRIPTION
8 1018+00 to 1045+00 (SBL) 3 3/4" Asphalt Overlay with PG 64-28 1"SAF Normal Pavement Repair
2.5.1 Monitoring Areas and Numbering Scheme. Due to the 10 mile total project length, the actual RD&T monitoring area will be reduced to shorter 500- 1000 foot lengths within the 0.5- 3 mile test section. In addition, test section 6 will have two 1000 foot monitoring areas, because of its 3 mile length. The other test sections will have one monitoring area each. These monitoring areas will be numbered as follows: 2900XY, where X is the test section number as shown in Section 2.5, and Y is the consecutive number of the monitoring area within that test section. For example, 290062 would be the second monitoring area within test section 6. 290051 would be the first monitoring area within test section 5. This numbering scheme will allow the test section data to be incorporated into an existing RD&T database.
2.5.2 Designated Sampling Areas. There will be a sampling area, for destructive testing, at the beginning and end of each of the nine monitoring areas. These sampling areas will be 100 feet in length and will not overlap the monitoring areas. They are referred to as Lead In and Lead Out in the following table.
Monitoring Area No.
290011
290021
290031
290041
290051
Limits
1045+00 to 992+00 (NBL) 1003+00 to 1002+00 1002+00 to 997+00 997+00 to 996+00
992+00 to 939+00 (NBL) 963+00 to 962+00 962+00 to 952+00 952+00 to 951+00
939+00 to 864+00 (NBL) 918+00 to 917+00 917+00 to 912+00 912+00 to 911+00
864+00 to 790+02 (NBL) 838+00 to 837+00 837+00 to 827+00 827+00 to 826+00
790+02 to 844+00 (SBL) 826+00 to 827+00 827+00 to 837+00 837+00 to 838+00
General Description
Test Section #1 Lead In Monitoring Area Lead Out
Test Section #2 Lead In Monitoring Area Lead Out
Test Section #3 Lead In Monitoring Area Lead Out
Test Section #4 Lead In Monitoring Area Lead Out
Test Section #5 Lead In Monitoring Area Lead Out

Monitoring Area No.
290061
290062
290071
290081
Limits
844+00 to 992+00 (SBL) 848+00 to 849+00 849+00 to 859+00 859+00 to 860+00
951 +00 to 952+00 952+00 to 962+00 962+00 to 963+00
992+00 to 1018+00 (SBL) 999+00 to 1 000+00 1 000+00 to 1 005+00 1005+00to1006+00
1018+00 to 1045+00 (SBL) 1 038+00 to 1 039+00 1039+00 to 1044+00 1 044+00 to 1 045+00
Job No. J110737
General Description
Test Section #6 Lead In Monitoring Area Lead Out
Lead In Monitoring Area Lead Out
Test Section #7 Lead In Monitoring Area Lead Out
Test Section #8 Lead In Monitoring Area Lead Out
3.0 Pavement Repairs. The joints or cracks requiring pavement repair are specified in this contract, however the engineer reserves the right to require the repair of additional joints or cracks during construction. The designated pavement repair locations are not to be modified without concurrence from the engineer.
4.0 Sand Anti-Fracture. The Sand Anti-Fracture mixture shall be placed in accordance with the version of MSP-97-10 included in the contract.
5.0 SuperPave Asphaltic Concrete Overlay. Asphaltic concrete shall meet all the applicable requirements of the version of MSP-95-03 included in the contract.
5.1 Total Compacted Thickness Requirement. Due to the research nature of this work, the total final compacted thickness of the SuperPave asphaltic concrete overlay within the monitoring areas shall not vary more than ± 0.50 inch from the thickness required by the typical section.
5.1.1 The thickness will be based on the average of five point cross-sections taken at 100 foot intervals within the monitoring areas listed in Section 2.5.2.
5.1.2 If the above thickness tolerances are exceeded, the following deductions will apply for each monitoring area involved.
5.1.2.1 The contract price for all affected plan quantities for the deficient monitoring area will be reduced by 10 percent for a total variance of± 0.50 inch to ± 1.00 inch.
5.1.2.2 Total variances greater than ± 1.00 inch are not acceptable. Pavement shall be removed and replaced to be within these tolerances to the satisfaction of the engineer.

Job No. J110737
5.2 Marking of Asphaltic Concrete Overlay. The asphaltic concrete surface immediately over the PCCP joints and working cracks will be permanently marked by RD& T personnel as follows.
5.2.1 A 4 inch x 4 inch square of thermoplastic pavement marking shall be placed in front of the finish roller immediately over the location of the PCCP joint in order to permanently mark the finished surface of the SuperPave asphaltic concrete over the joint. The thermoplastic square will be placed in front of the roller by a person standing on the shoulder of the roadway. This mark will allow the RD&T division to determine the existence of reflective cracks in the Mure.
5.2.2 The asphaltic concrete overlay will be marked within the monitoring areas.
5.2.3 The contractor shall fully cooperate with this marking operation. If the above described method of markin~ is unsatisfactory to the RD&T personnel, the contractor shall cooperate with any modifications as directed by the engineer.
5.2A There will be no additional pay for this marking operation. The thermoplastic squares will be provided and placed by the RD&T division. .
5.3 Construction Joints. Due to the research nature of this project, it is necessary to provide continuous, uniform lifts beginning 500 feet before the lead in, and continuing throughout the monitoring and lead out areas. Transverse construction joints shall be avoided in these areas.
5.3.1 In the event that for any reason there is any transverse construction joint within these areas, at the contractor's expense the affected asphaltic concrete lift shall be completely removed to the full width of original placement by an approved method, to 500 feet before the lead in area and to the end of the lead out area, and the entire area replaced until a continuous, uniform lift meeting this specification has been provided. There will be no direct payment to the contractor for any expense involved in meeting this portion of the specification, other than as designated for approved work.