supplement 1 - school of life sciences - university of illinois at
TRANSCRIPT

1
SUPPLEMENTARY MATERIALS
The Draft Genome of the Globally Widespread and Invasive Argentine ant (Linepithema humile)
Table of Contents SUPPLEMENTARY MATERIALS………………………………………………………….………….. 1 AFFILIATIONS & ROLES IN PROJECT …………………………………….. 2 SUPPLEMENTARY INFORMATION…………………………………. ……... 5 Source material (Table S1, S14; Fig. S17) ……………………………………….. 5 RNA library preparation and EST sequencing…………………………………….. 9 Illumina Sequencing……………………………………………………………….. 10 Assembly……………………………………………………………………........... 11 Annotation (Table S2; Fig. S4) ………………………………………………......... 12 Cytoplasmic ribosomal protein genes …………………………………………….. 27 Oxidative phosphorylation………………………………………………………… 30 Single nucleotide polymorphisms (SNPs)(Table S3, S8) ………………………… 32 Repetitive DNA…………………………………………………………………… 37 Viruses and viroids (Table S4)……………………………………………………. 39 KEGG, InterProScan, Gene Ontology Analysis (Table S7, S5; Fig. S2, S3, S6)…. 40 OrthoMCL…………………………………………………………………………. 54 Mitochondrial genome (Fig. S1) ………………………………………………….. 55 GC Compositional Domain Analysis (Table S9; Fig. S5-S10)………………….... 56 MicroRNAs………………………………………………………………………… 65 RNAi (Fig. S16)……………………………………………………………………. 66 Wing and reproductive system development (Fig. S11) …………………………. 68 Chemoreception (Grs, OBPs, Ors, IRs) (Table S10, S15, S11, S12) ……………... 72 Delta 9 desaturase genes (Fig. S15) ………………………………………………. 94 Cytochrome P450s (Fig. S13) ……………………………………..………........... 98 Hox genes (Fig. S18) ……………………………………………………………… 99 Immune response (Table S16) ……………………………………………………. 101 Opsins ……………………………………………………………………………... 104 Behavior……………………………………………………………………………. 105 Yellow/Major royal jelly proteins (Fig. S14) ……………………………………... 108 Insulin signaling …………………………………………………………………… 110 Evolutionary rate analysis (Fig. S19) ……………………………………………… 112 Foraging Gene qPCR (Fig. S20) ………………………………………………….. 114 Annotation of the L. humile genome as a teaching tool …………………………… 116 ACKNOWLEDGEMENTS……………………………………………................ 117

2
AFFILIATIONS & ROLES IN PROJECT
Christopher D. Smitha*, Aleksey Ziminb, Carson Holtc, Ehab Abouheifd, Richard Bentone, Elizabeth Cashf, Vincent Crosete, Cameron R. Currieg,h, Eran Elhaiki, Christine G. Elsikj, Marie-Julie Faved, Vilaiwan Fernandezd, Jürgen Gadauf, Joshua D. Gibsonf, Dan Graurk, Kirk J. Grubbsf, Darren E. Hagenj, Martin Helmkampff, Jo-Anne Holleyl, , Hao Huc, Ana Sofia Ibarraran Viniegrad, Brian R. Johnsonm, Reed M. Johnsonl, Abderrahman Khilad, Jay W. Kima, Joseph Lairdl, Kaitlyn A. Mathism, Joseph A. Moellerg,h, Monica C. Munoz-Torresj, Marguerite C. Murphyn, Rin Nakamuraa, Surabhi Nigamn, Rick P. Oversonf, Jennifer E. Placeka, Rajendhran Rajakumard, Justin T. Reesej, Hugh M. Robertsonl,o, Chris R. Smithp, Andrew V. Suarezl,o, Garret Sueng,h, Elissa L. Suhrl, Shu Taoj, Candice W. Torresm, Ellen van Wilgenburgm, Lumi Viljakainenq, Kimberly K. O. Waldenl, Alexander L. Wildl, Mark D. Yandellc, James A. Yorker, Neil D. Tsutsuim*
aDepartment of Biology, San Francisco State University, San Francisco, CA 94132; bInstitute for Physical Science and Technology, University of Maryland, College Park, MD 20742; cDepartment of Human Genetics, Eccles Institute of Human Genetics, University Utah and School of Medicine, Salt Lake City, UT 84112; dMcGill University, Department of Biology, 1205 Avenue Dr. Penfield, Montreal, Quebec, Canada, H3A 1B1; eCenter for Integrative Genomics, Genopode Bldg., University of Lausanne, CH-1015 Lausanne, Switzerland; fSchool of Life Sciences, Arizona State University, Tempe, AZ 85287; gDepartment of Bacteriology, University of Wisconsin-Madison, Madison WI 53706; ; hDOE Great Lakes Bioenergy Research Center, University of Wisconsin-Madison, Madison, WI 53706; iThe Johns Hopkins University School of Medicine, Baltimore, MD 21205; jDepartment of Biology, Georgetown University, Washington, DC 20057; kDepartment of Biology and Biochemistry, University of Houston, Houston, Texas 77204; lDepartment of Entomology, University of Illinois at Urbana-Champaign, Urbana, IL 61801; mDepartment of Environmental Science, Policy and Management, UC Berkeley, Berkeley, CA 94720-3114;nDepartment of Computer Science, San Francisco State University, San Francisco, CA 94132; oInstitute of Genomic Biology, University of Illinois, Urbana 61801; pDepartment of Biology, Earlham College, Richmond, IN 47374; qDepartment of Molecular Biology and Genetics, Cornell University, NY; rDepartment of Mathematics, University of Maryland, College Park, MD 20742.
Project Coordination and Writing of Main Text:
Christopher D. Smitha, Neil D. Tsutsuim
Sample Handling, Transcriptome & Genomic DNA Sequencing:
Hugh M. Robertsonl,o, Christopher D. Smitha, Neil D. Tsutsuim Assembly:
James A. Yorker, Aleksey Ziminb, Christopher D. Smitha
Automated Annotation: Mark Yandellc, Carson Holtc, Hao Huc
Gene Ontology, Inteproscan, & KEGG Analyses: Jennifer E. Placeka, Christopher D. Smitha
Cytoplasmic Ribosomal Protein Genes:
Martin Helmkampff

3
Oxidative Phosphorylation Genes:
Joshua D. Gibsond
Repetitive Elements:
Jay W. Kima, Christopher D. Smitha
Chemoreceptor Genes:
Hugh Robertsonl,o Jo-Anne Holleyl, Elisssa L. Suhrl, Andrew V. Suarezl.o Kimberly K. O.
Waldenl, Alexander L. Wildl, Vincent Crosete, Richard Bentone
P450 Genes:
Reed Johnsonl
Olfactory Learning and Memory:
Kaitlyn Mathism, Brian R. Johnsonm, Candice W. Torresm
Opsins and Circadian Genes:
Neil D. Tsutsuim Immune Genes:
Lumi Viljakainenq, Kirk J. Grubbsf
Behavior and Aggression Genes: Candice W. Torresm, Rin Nakamuraa
Hox Genes: Monica C. Munoz-Torresj, Darren Hagenj, Christine G. Elsikj
Global Compositional Analysis:
Eran Elhaiki, Justin T. Reesej, Dan Graurk, Christine G. Elsikj
DNA Methylation Toolkit:
Chris R. Smithp RNAi Pathway Genes:
Shu Taoj, Monica C. Munoz-Torresj, Jennifer E. Placeka, Christopher D. Smitha, Christine
G. Elsikj
MicroRNAs:
Darren E. Hagenj, Christine G. Elsikj
Wing Polyphenism and Reproductive Division of Labor:
Ehab Abouheifd, Marie-Julie Faved, Vilaiwan Fernandesd, Rajendhran Rajakumard, Ana
Sofia Ibarraran Viniegrad, Abderrahman Khilad

4
Candidate Caste Determination Genes:
Chris R. Smithp, Rajendhran Rajakumard, Martin Helmkampff, Garret Sueng,h, Cameron
Currieg,h
Yellow / Major Royal Jelly Protein Genes: Rick P. Oversonf, Martin Helmkampff
Desaturase Genes:
Elizabeth Cashf, Martin Helmkampff
Evolutionary Rate Analysis:
Carson Holtc, Christopher D. Smitha
Earlham College Evolutionary Genomics Class Annotation:
Chris R. Smithp et al.
Mitochondrial Genome Assembly: Joshua D. Gibsonf, Chris R. Smithp
SNP Analysis:
Surabhi Nigamn, Marguerite C. Murphyn, Christopher D. Smitha
Cuticular Hydrocarbon Analysis, Microsatellite genotyping, Behavioral assays:
Ellen van Wilgenburgm
Insulin Pathway Genes:
Rajendhran Rajakumard, Joseph A. Moellerg,h, Garret Sueng,h, Cameron R. Currieg,h

5
SUPPLEMENTARY INFORMATION
Source material We collected an Argentine ant colony fragment (hereafter “Saratoga”) from a residential
orchard in Saratoga, Santa Clara County, California, USA (N37º 15' 23.5"; W122º 00'
55.2").
Several lines of evidence confirmed that these ants are members of the large
supercolony that dominates California. First, we conducted a genetic analysis of 12
workers at 13 microsatellite loci and estimated the genetic distances to 9 other L. humile
populations (1). We genotyped 12 workers from the Saratoga at 13 polymorphic
microsatellite loci (GenBank Accession numbers AF173164, AF093514, AF093515,
AF093517, AF093520, AF093521, AF093522, AF093524, AF093525, AF093526,
AF093527, AF093531, and AF093533) (2-4) and estimated the genetic distances of this
population to nine other L. humile populations (1) according to Nei (5) using the
computer program GenAlEx (www.anu.edu.au/BoZo/GenAlEx/) (Table S14). The
Saratoga population was genetically most similar to ants in Berkeley, California (Nei
distance=0.037) that is part of the large Californian supercolony. Other genetically
similar populations were those in Melbourne, Australia and the largest supercolony in
Hawaii (Nei distances <0.1). The Saratoga ants were least similar to one of the smaller
supercolonies in Hawaii, a supercolony in South Africa and a smaller supercolony from
Lake Hodges, La Mesa, California (Nei distances all >0.26).

6
Table S1. The number and types of sequencing runs performed. The runs using DNA from a single diploid queen pupae and ~100 diploid workers from a single colony in the invasive range. Workers were pooled for a single DNA extraction. The same 3kb and 8kb paired end libraries were used for the 454 and Illumina sequencing. # runs Sequencing platform Paired-end? Source material 7 454FLX Titanium No Single queen pupa 1 454FLX Titanium Yes; 3kb ~100 workers 1 454FLX Titanium Yes; 8kb ~100 workers 1 Illumina 84 cycle No ~100 workers 1 Illumina Yes; 3kb ~100 workers 1 Illumina Yes; 8kb ~100 workers 1 454FLX - transcriptome No Mixed caste, age,
location Table S14. Genetic comparison (Nei genetic distance) between the sequenced L. humile population (Saratoga, CA) and nine other introduced populations. Pairwise population matrix of Nei Genetic Distance SAR AU B F HB HR J LH NZ SA
SAR 0.000 AU 0.071 0.000
B 0.037 0.093 0.000 F 0.110 0.115 0.051 0.000
HB 0.094 0.150 0.161 0.206 0.000
HR 0.424 0.423 0.452 0.482 0.356 0.000
J 0.249 0.136 0.279 0.228 0.203 0.407 0.000
LH 0.262 0.266 0.312 0.375 0.220 0.081 0.361 0.000
NZ 0.118 0.094 0.132 0.137 0.164 0.372 0.108 0.280 0.000
SA 0.314 0.267 0.341 0.442 0.411 0.412 0.454 0.335 0.372 0.000 LEGEND California, USA
Saratoga (SAR) 37° 15' 24'' N 122° 00' 55'' W Berkeley (B) 37° 52' 22'' N 122° 15' 52'' W Lake Hodges (LH), La Mesa 33° 3' 45'' N 117° 7' 8'' W
France Marseille (F) 43° 29' 80'' N 05° 37' 41'' W
Australia Melbourne (AU) 37° 47' 53'' N 144° 57' 32'' W
New Zealand Wellington (NZ) 41° 28' 00'' N 174° 76' 00'' W
Japan Iwakuni City, Yamaguchi (J) 34°06'15"N 132°12'01"E
Hawaii, USA Kipuka Nene (HB) 19° 13' 21'' N 155° 38' 04'' W KMC (HR) 19° 26' 01'' N 155° 16' 25'' W
South Africa Stellenbosch (SA) 33° 3' 45'' N 117° 7' 8'' W

7
Second, we performed standard aggression assays (1) to assay the colonymate
recognition behavior of the Saratoga ants. We collected L. humile workers from three
Californian populations; Saratoga, Berkeley (which is part of the large supercolony that
dominates California), and Lake Hodges (one of the smaller Californian supercolonies).
Live ants were transported to the laboratory and maintained on a diet of sugar water,
chicken egg and protein solution (modified LB broth). We performed standard behavioral
assays to test for aggression between Saratoga and the other two populations. We
observed the behavior of the ants for three minutes and scored the assay as aggressive if
the ants showed one or more of the following behaviors; flaring of mandibles, recoil
behavior, biting, or grabbing. These assays revealed no aggression between workers of
the Saratoga population and the population in Berkeley (0 out of 20 trials). We did,
however, find high levels of aggression between the Saratoga population and workers of
the smaller supercolony from Lake Hodges, La Mesa, California (17 out of 20 trials).

8
Figure S17. Cuticular hydrocarbon profiles of Argentine ant workers from the source location for this genome sequencing project (Saratoga, CA) and two other sites in the location for this genome sequencing project (Saratoga, CA) and two other sites in the introduced California range. Argentine ants at the Berkeley, CA site belong to the large supercolony that occupies the vast majority of the introduced range, whereas the Lake Hodges, CA population is spatially much smaller and is genetically, behaviorally and chemically distinct.
Finally, we compared the
cuticular hydrocarbon profiles of the
Saratoga population to the Berkeley
population and the smaller Lake
Hodges colony (Fig. S17). Cuticular
hydrocarbons are substances that are
used by Argentine ants to distinguish
colonymates from ants that belong to
foreign colonies. We extracted
cuticular hydrocarbons from
individual workers from each of the
populations used for the behavioral
assays by immersing each ant in 45
mL of hexane for 10 minutes. Each
worker’s profile was analyzed
separately, using gas chromatography
and mass spectrometry (GC–MS). To
detect quantitative differences in the
hydrocarbon patterns of our samples, we injected 1 mL of each sample into an Agilent
7890 GC equipped with a 190915-433 capillary column (30 m X 250 mm X 0.25 X m,
Agilent Technologies). We used helium as carrier gas at 1 mL/min, the injector in
splitless mode (1 min), and a temperature program of 2 min at 80 °C, to 270 °C at 20
°C/min, then to 310 °C at 3 °C/min (6). Injector temperature was set at 250°C. Electron

9
impact mass spectra were obtained with an ionization voltage of 70 eV and a source
temperature of 250 °C.
Combined, these data indicate the Saratoga population is part of the large
Californian supercolony.
RNA library preparation and EST sequencing EST sequencing was performed on material from a combination of different castes and
life stages: adult workers, queens and males, larvae of mixed age and caste, queen pupae,
worker pupae, and RNA from worker heads and antennae (to enrich for behavioral and
chemoreception genes)(Table S1). Most of this material was collected from sites
belonging to the large California supercolony, but we also generated and sequenced
cDNA from workers collected in the native range (Argentina). We extracted and purified
the polyA+ RNA using an Ambion MicroPurist RNA kit, reverse transcribed and
generated cDNA using the Joint Genome Institute protocol, quantified each extraction
separately for each type of source material, then mixed them together prior to sequencing.
The cDNA was nebulized and used to generate a 400-800bp library, which was then
sequenced using a Roche 454 Genome Sequencer LR70 FLX. This run yielded about
128Mb of DNA sequence. These reads assembled into 20,070 contigs.
Preparation of a 3kb and 8kb paired-end genomic libraries, emulsion-based clonal
amplification and sequencing on the 454 Genome Sequencer FLX-Titanium system were
performed according to the manufacturer’s instructions (454 Life Sciences, Branford,
CT). Each library was sequenced on one GS-Titanium 70x75 picotiter plate. Signal
processing and base calling were performed using the bundled 454 Data Analysis
Software version 2.0.00. The sequencing of the 3kb and 8kb paired-end genomic libraries

10
produced a total of 1,206,954 and 1,400,165 reads with average read-lengths of 382bp
and 386bp, respectively.
Illumina Sequencing
Shotgun Library construction and sequencing:
A shotgun genomic library was constructed from 5ug of genomic DNA using the
Genomic DNA Sample Prep kit from Illumina (San Diego, CA). The library was loaded
at 12pM on two lanes of a flowcell and sequenced on a Genome Analyzer II for 76 cycles
from one end of the fragments according to the manufacturer’s instructions (Illumina,
San Diego, CA). The yield from both lanes was 33.7 million reads with a read-length of
75bp and an estimated error rate of 0.49% (based on the alignment of PhiX control DNA
run on one lane to the PHiX reference genome).
3kb and 8kb mate-pairs library construction
These libraries were constructed according to the Illumina mate-pair sample preparation
kit (Illumina, San Diego, CA) with one modification: the ends of the 3kb or 8kb
fragments were ligated with a biotinylated linker so that, upon circularization, the ends of
the 3kb or 8kb fragments are separated by this adaptor (5’
TCGTATAACTTCGTATAATGTATGCTATACGAAGTTATTACG 3’). The libraries
were loaded at a concentration of 12pM on one lane each and sequenced on a Genome
Analyzer IIx for 76cycles on each end according to the manufacturer’s protocol. The total
numbers of reads were 19 million and 15 million for the 3kb and 8kb libraries,
respectively. The error rate of the control DNA was 0.35% for each end.

11
Assembly We used the Roche gsAssembler Version 2.3 to generate the initial assembly of the
genome using both 454 and Illumina data. Briefly, Illumina reads were trimmed to 70bp
and a FASTA file was used as input to gsAssembler requiring a minimal contig length of
100bp and coverage of 5 reads. The assembly was run in ‘heterozygous’ mode since we
were assembling a diploid genome.
We used CABOG assembler (7) to create the assembly employing the optional
MER overlapper and BOG unitigger modules. The data was first pre-processed to detect
the linker in the 454 paired end reads and convert them into regular mate pairs. Since
Illumina sequencing 3kb and 8kb paired end reads were prepared using a 454 Titanium
linker, they had to be screened for linker as well. We also trimmed off the low quality
sequence. For the 454 data we relied on the clear ranges (coordinates of the start and end
of the high-quality sequence on the reads) given in the SFF files. We trimmed Illumina
data based on the quality scores supplied by the sequencer.
After eliminating the low quality sequences and linkers, the 454 data contained
nearly 6M (million) unmated reads, with 376bp average trimmed length, and 1.6M mate
pairs in 3kb and 8Kb mate pairs with ~200bp average trimmed read length. Given the
250.8Mb estimated genome size this data set has 9x coverage by the unmated reads, 2.5x
sequence and 36x clone coverage by the 3kb and 8kb mate pairs. The Illumina data
contained 40M unmated 72bp reads, and 55M mate pairs in 3kb and 8Kb mate pairs.
Both Illumina mate pair libraries have 72 bases sequenced on each end of the clone. This
data set had 12x coverage by the unmated reads.
We note that this data set had significant redundancy problems in the paired end
8kb libraries produced by both sequencing technologies. Redundancy means that when

12
the library was generated, multiple identical copies of each pair of mated reads were
created. It was ultimately necessary to discard 66% of the 454 8kb mate pairs and 32% of
the Illumina 8kb mate pairs due to redundancy. To filter out redundant mate pairs we first
created a partial preliminary assembly. We did not run the scaffolding step for this
assembly. We then examined mated read positions in contigs to detect the mate pairs
whose inserts appeared to start and end within +-1 base. We then eliminated all but one
copy of each such redundant mate pair. Then we re-assembled the data to create the final
assembly. Redundancy appears to be a problem in other projects and highlights the need
for genome projects to test mate-paired libraries for redundancy using methods similar to
those above or specialized tools such as 454 Replicate Filter)
http://microbiomes.msu.edu/replicates/) prior to assembly since these oversampled clones
can skew the assembly process.
Annotation We used the automatic annotation pipeline MAKER (8) to annotate the genome of L.
humile. MAKER generates high-quality annotations by taking into account evidence
from multiple sources. MAKER first runs RepeatMasker (www.repeatmasker.org) over
the genome to find simple repeats, satellites and interspersed repeats. These sequences
are masked prior to protein and EST sequence database searching and gene prediction. To
annotate the L. humile genome, we used a database that combined RepeatMasker’s insect
library with novel P. barbatus and L. humile repeats identified in this study by Repeat
Modeler (www.repeatmasker.org/RepeatModeler.html) and PILER (Table 1) (9).
MAKER was configured to use WU-BLAST (10) to align EST and protein
evidence to the genome; the resulting alignments were then clustered and filtered to

13
remove redundant hits. BLAST hits with high sequence identity were realigned to the
non-RepeatMasked genome with the splice-site aware algorithm Exonerate (11) to ensure
that splice-sites were correct. Misaligned ESTs and genomic contaminants were removed
by checking each alignment for valid splice donors and acceptors. Only validly spliced
ESTs were used to inform the gene predictors; this greatly cuts down on false positives.
EST data from related organisms was aligned using TBLASTX (10) and subjected to the
same filtering procedures. The ESTs used for annotation were derived from Newbler
assemblies of L. humile RNA-seq reads generated by the 454 platform. MAKER also
used TBLASTX to align a combined set of Genbank (12) hymenoptera ESTs and P.
barbatus ESTs. MAKER’s protein evidence came from a protein database comprised of
UniProtKB (13), the D. melanogaster proteome (Release 5.25) from FlyBase
(www.flybase.org), the Apis and Nasonia proteomes from Genbank (12) and insect
chemosensory proteins from Genbank.
Three ab-initio predictors were trained for use with MAKER: SNAP (14),
Augustus (15), and GeneMark (16). GeneMark was trained using a 30Mb genomic
scaffold from the L. humile assembly. Augustus (15) was trained using its self-training
pipeline autoAug.pl together with the MAKER aligned EST evidence. We then ran
MAKER with the evidence described above, using GeneMark and Augustus as
predictors. From the resulting MAKER predictions, we chose 3,352 genes with the best
annotation quality scores (17) and used them as a training set for SNAP. We then added
the trained SNAP to the MAKER configuration and re-ran MAKER. MAKER revises
gene predictions post-facto, adding UTRs and alternatively spliced transcripts as
suggested by the EST evidence. It then measures their congruency with the protein and

14
EST evidence, based upon their Annotation Edit Distances (AED) (17), choosing the best
gene model for each gene. These comprise a high confidence gene-set for downstream
analyses (8). Predictions without support or less congruent with the evidence are retained
as predictions.
After producing MAKER based genome annotations, we used the program
InterProScan (18) to identify putative protein domains in ab initio gene predictions not
overlapping MAKER annotations. Ab initio predictions that contained a recognizable
InterPro protein domain were then added as gene models to an updated gene annotation
set. We later filtered this updated annotation set for representation of likely repetitive
elements using RepeatMasker (http://repeatmasker.org). RepeatMasker was run with the
RepBase (19) repeat libraries in conjunction with a species specific repeat library
prepared for L. humile, and the results were filtered to remove repetitive elements labeled
“low complexity”, “simple repeat”, or having a RepeatMasker score of at less than 200.
Finally, transcripts for which at least 50% of their length was identified as being
repetitive were removed from the final annotation dataset.
Annotating the L. humile genome took roughly 8000 CPU hours using the
distributed computer clusters at CHPC, University of Utah (http://www.chpc.utah.edu).
In total we found 15,345 genes and generated another 29,206 gene-predictions that did
not overlap EST or protein sequence alignments. In total, 855 new gene annotations were
added to the final annotation set based on the presence of InterPro protein domains, and
23 of the original MAKER annotations were removed because of repeat filtering. The
final dataset contained a total of 16,123 protein coding genes and 16,177 transcripts.
All gene annotations and supporting evidence alignments produced by MAKER

15
as well as protein domain information derived from InterProScan were loaded into a
Chado (20) (http://gmod.org/wiki/Chado) database to facilitate community access to
genome annotations and supporting evidence. The annotation curation tool Apollo (21)
was then deployed to allow researchers to view and manually edit the genome
annotations contained within the database (Table S2). Apollo allows users to connect to a
Chado database remotely thereby providing researchers the ability to curate the genome
annotations from distant locations. Apollo was configured as a Java Web Start
Application for distribution to the community, which kept configuration of the program
under the control of a central server and ensured a degree of consistency in the way data
could be viewed and accessed.
For manual annotation, users selected reference genes from a well-curated species
(i.e. D. melanogaster, A. mellifera, N. vitripennis) and identified the best matching
MAKER gene model using BLASTP. Exon-by-exon alignment was used to refine intron-
exon boundaries in Apollo to create a gene model that had splice sites consistent with all
EST data and comparative BLAST evidence. Effort was made to annotate a protein
matching the full length of the reference gene, when possible, and irregular features such
as missing start codons, stop codons, gaps, and other anomalies were noted in the
comment form of Apollo. Final gene models were confirmed by BLAST back to the
reference gene set to confirm reciprocal best hits, and relevant synonyms of orthologs
were recorded into the Chado database. Prediction sets and the OGS1.1 can be obtained
through http://HymenopteraGenome.org/linepithema/genome_consortium/datasets.html.

16
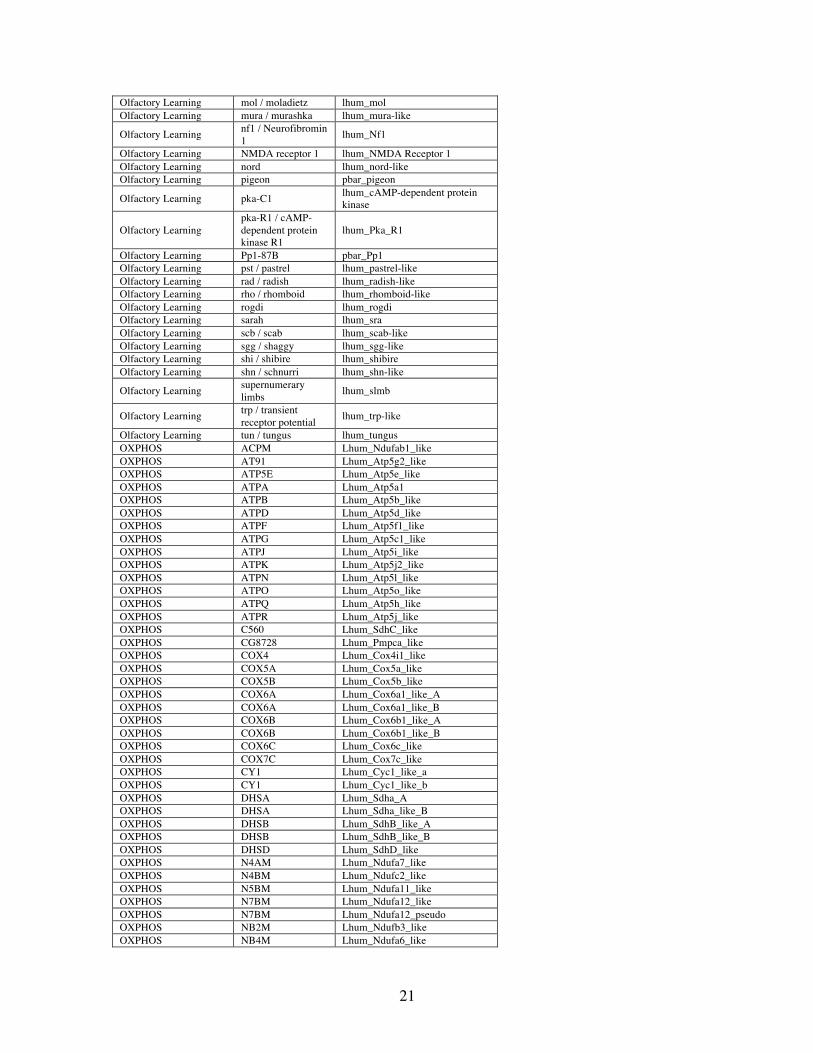
Table S2. Manually annotated genes. The following represents a list of manually curated genes as of the time of publication. The pathway, process, or predicted function of each gene is indicates as well as the D. melanogaster or other reference gene used to annotate the model. The MAKER identifiers are provided as the proposed name for each gene. Gustatory receptors (Grs) and Olfactory receptors (Ors) are listed separately in Tables S10 and S11, respectively. Process/Function Drosophila Gene
Name Lhum MAKER Gene ID
Aggression (inter-male) ade5 lhum_ade5-like Aggression (inter-male) eca lhum_eclair Aggression (inter-male) ed lhum_echinoid-like Aggression (inter-male) noc lhum_no ocelli-like Aggression (inter-male) sgl lhum_sgl behavior homer lhum_homer Biogenic amine receptor / GPCR DmDAMB/DopR2 lhum_DopR2
Biogenic amine receptor / GPCR DmDOP1 lhum_DopR
Caste Implicated - larval storage Hex110 Lhum_Hex110
Caste Implicated - larval storage Hex70a Lhum_Hex70a
Caste Implicated - larval storage Hex70b Lhum_Hex70b
Caste Implicated - larval storage Hex70c Lhum_Hex70c
Caste Implicated - Nutrition Sensing AKT Lhum_AKT
Caste Implicated - Nutrition Sensing atg1 Lhum_atg1
Caste Implicated - Nutrition Sensing 4EBP Lhum_4EBP
Caste Implicated - Nutrition Sensing EIF-4B Lhum_E1F4B
Caste Implicated - Nutrition Sensing lkb1 Lhum_lkb1
Caste Implicated - Nutrition Sensing Ilp Lhumr_Ilp1
Caste Implicated - Nutrition Sensing Ilp Lhum_Ilp2
Caste Implicated - Nutrition Sensing InR Lhum_InR1
Caste Implicated - Nutrition Sensing InR Lhum_InR2
Caste Implicated - Nutrition Sensing Mo25 Lhum_Mo25
Caste Implicated - Nutrition Sensing PDK1 Lhum_PDK1
Caste Implicated - Nutrition Sensing Pi3k21B Lhum_ Pi3K21B
Caste Implicated - Nutrition Sensing PI3K59F Lhum_PI3K59F
Caste Implicated - Nutrition Sensing Pi3K68D Lhum_Pi3K68D
Caste Implicated - Nutrition Sensing Pi3K92E Lhum_Pi3K92E
Caste Implicated - Nutrition Sensing Raptor Lhum_Raptor
Caste Implicated - Nutrition Sensing Rheb Lhum_Rheb
Caste Implicated - Nutrition Sensing Rector Lhum_rictor
Caste Implicated - Nutrition Sensing TOR Lhum_Tor
Caste Implicated - SNF1A Lhum_SNF1A

17
Nutrition Sensing Caste Implicated - Nutrition Sensing TSC1 Lhum_Tsc1
Caste Implicated - Nutrition Sensing TSC2 Lhum_Tsc2
Caste Implicated Gene - yolk protein Vg Lhum_Yp1
Cell Cycle Control CDC42 Lhum_CDC42 Cell Cycle Control CycB Lhum_CycB Chitinase CG5613 Lhum_CG5613 Chitinase CG7565 Lhum_CG7565 Chitinase Chit Not Found Chitinase Cht2 Lhum_Cht2 Chitinase Cht3 Lhum_Cht3 Chitinase Cht4 Not Found Chitinase Cht5 Lhum_Cht5 Chitinase Cht6 Lhum_Cht6 Chitinase Cht7 Lhum_Cht7 Chitinase Cht8 Lhum_Cht8 Chitinase Cht9 Not Found Chitinase Cht11 Lhum_Cht11 Chitinase Cht12 Not Found Chitinase K06A9.1b Lhum_K06A9.1b Chitinase - Cation Binding CG8460 Lhum_CG8460
Circadian clock lhum_clock Circadian cryptochrome 2 lhum_cryptochrome2 Circadian cycle lhum_cycle Circadian timeless lhum_timeless Cytoskeleton dynamics/morphology Rac1 Lhum_Rac1
Cytoskeleton dynamics/morphology Rho1 Lhum_Rho1
Desaturase (delta-9) CG9747 Lhum_CG9747_a Desaturase (delta-9) CG9747 Lhum_CG9747_b Desaturase (delta-9) CG9747 Lhum_CG9747_c Desaturase (delta-9) CG9747 Lhum_CG9747_d Desaturase (delta-9) CG9747 Lhum_CG9747_e Desaturase (delta-9) CG9747 Lhum_CG9747_f Desaturase (delta-9) CG9747 Lhum_CG9747_g Desaturase (delta-9) CG9747 Lhum_CG9747_h Desaturase (delta-9) CG9747 Lhum_CG9747_i Desaturase (delta-9) CG9747 Lhum_CG9747_j Desaturase (delta-9) CG9747 Lhum_CG9747_k Desaturase (delta-9) CG9747 Lhum_CG9747_l Desaturase (delta-9) CG9747 Lhum_CG9747_m Desaturase (delta-9) CG9747 Lhum_CG9747_n Desaturase (delta-9) CG9747 Lhum_CG9747_o Desaturase (delta-9) CG9747 Lhum_CG9747_p Desaturase (delta-9) CG9747 Lhum_desat_frag1 Desaturase (delta-9) CG9747 Lhum_desat_frag7 Desaturase (delta-9) CG9747 Lhum_desat_frag8 Desaturase (delta-9) CG9747 Lhum_desat_frag9 Desaturase (delta-9) CG8630 Lhum_CG8630_a Desaturase (delta-9) CG8630 Lhum_CG8630_b Desaturase (delta-9) CG8630 Lhum_CG8630_c Desaturase (delta-9) CG8630 Lhum_CG8630_d Desaturase (delta-9) CG9743 Lhum_CG9743 Desaturase (delta-9) CG15531 Lhum_CG15531 Desaturase (delta-9) desat1 Lhum_desat_frag2 Desaturase (delta-9) desat1 Lhum_desat_frag3 Desaturase (delta-9) desat1 Lhum_desat_frag4 Desaturase (delta-9) desat1 Lhum_desat_frag5 Desaturase (delta-9) desat1 Lhum_desat_frag6 Desaturase (delta-9) - CHC alkene synthesis desat1 Lhum_desat1_a

18
Desaturase (delta-9) - CHC alkene synthesis desat1 Lhum_desat1_b DNA methylation Dnmt1 Lhum_Dnmt1 DNA methylation Dnmt2 Lhum_Dnmt2 DNA methylation Dnmt3 Lhum_Dnmt3 EGF signaling 26- argos lhum_argos EGF signaling 27- star S not found EGF signaling 28-keren krn lhum_keren embryonic dev. ecd Lhum_ecd Embryonic Development - HOX Abdominal A Lhum-Abd-A-like
Embryonic Development - HOX Abdominal B Lhum-Abd-B-like
Embryonic Development - HOX Antennapedia Lhum-Antp-like
Embryonic Development - HOX Deformed Lhum-Dfd-like
Embryonic Development - HOX Fushi Tarazu Lhum-ftz-like
Embryonic Development - HOX Hox3-A Lhum-Hox3-A-like
Embryonic Development - HOX Labial Lhum-lab-like
Embryonic Development - HOX Proboscipedia Lhum-pb-like
Embryonic Development - HOX
Sex Combs Reduced Lhum-Scr-like
Embryonic Development - HOX Ultrabithorax Lhum-Ubx-like
Endocytosis Aux Lhum_Aux Endocytosis Chc Lhum_Chc Endocytosis Rab5 Lhum_Rab5 Endocytosis Rab7 Lhum_Rab7 Endocytosis Rab8 Lhum_Rab8 Endocytosis Syt1 Lhum_Syt1 errata CG16979 lhum_CG16979 errata CG34424 lhum_CG34424 Fertility Eggless lhum_egg Fertility Ovarian tumor lhum_otu Fertility Sans fille lhum_snf Fertility Sex combs extra lhum_sce Fertility Sex lethal lhum_sxl Foraging for lhum_for_upstream/downstream* glycolysis Ald Lhum_Ald glycolysis Gapdh1 Lhum_Gapdh1 glycolysis Hex-C Lhum_Hex-C glycolysis Pfk Lhum_Pfk glycolysis Pgi Lhum_Pgi Heat shock response Hsp 70Aa Lhum_Hsp70 Heme binding c-cup Lhum_c-cup Imaginal Disc Development Idgf1 Not Found
Imaginal Disc Development Idgf2 Not Found
Imaginal Disc Development Idgf3 Not Found
Imaginal Disc Development Idgf4 Lhum_Idgf4
Imaginal Disc Development Idgf5 Not Found
Immune Genes 18w lhum_18w Immune Genes Atg12 lhum_Atg12 Immune Genes Atg5 lhum_Atg5 Immune Genes Atg7 lhum_Atg7 Immune Genes aub lhum_aub Immune Genes bsk lhum_bsk Immune Genes cact1 lhum_cact1a

19
Immune Genes cact1 lhum_cact1b Immune Genes cactin lhum_cactin Immune Genes casp lhum_casp Immune Genes CG11372 lhum_galectin Immune Genes CG32226 lhum_galectin2 Immune Genes Dcr-2 lhum_Dcr-2 Immune Genes Def lhum_def Immune Genes dl lhum_dl Immune Genes dome lhum_dome Immune Genes Duox lhum_Duox Immune Genes egr lhum_egr Immune Genes FADD lhum_FADD Immune Genes galectin 1 lhum_galectin1 Immune Genes GNBP1 lhum_GNBP1-1 Immune Genes GNBP1 lhum_GNBP1-2 Immune Genes GNBP1 lhum_GNBP1-2_like1 Immune Genes GNBP1 lhum_GNBP1-2_like2 Immune Genes hop lhum_hop Immune Genes hymenoptaecin lhum_hymenoptaecin Immune Genes Iap2 lhum_Iap2 Immune Genes IKKg lhum_IKKg Immune Genes imd lhum_imd Immune Genes Jra lhum_Jra Immune Genes kay lhum_kay Immune Genes Lys-2 hum_Lys-2 Immune Genes Lys-3 hum_Lys-3 Immune Genes Myd88 lhum_MyD88 Immune Genes NA lhum_Naickin-1 Immune Genes NA lhum_Naickin-2a Immune Genes NA lhum_Hisnavicin-3 Immune Genes NA lhum_Naickin-2b Immune Genes NimA lhum_NimA Immune Genes NimC1 lhum_NimC Immune Genes NOS lhum_NOS Immune Genes PGRP-LC lhum_PGRP-LC Immune Genes PGRP-LC lhum_PGRP-LC_like Immune Genes PGRP-S1 lhum_PGRP-S1 Immune Genes PGRP-S2 lhum_PGRP-S2a Immune Genes PGRP-S2 lhum_PGRP-S2b Immune Genes PGRP-SA lhum_PGRP-SA Immune Genes Pli lhum_Pli Immune Genes pll lhum_pll Immune Genes PPO lhum_PPO Immune Genes Rel lhum_Rel Immune Genes Rpn3 lhum_Rpn3 Immune Genes SCR-B10 lhum_SCR-B10 Immune Genes SCR-B2 lhum_SCR-B2 Immune Genes SCR-B5 lhum_SCR-B5 Immune Genes SCR-B9 lhum_SCR-B9 Immune Genes SCR-C lhum_SCR-C Immune Genes serpin-1 lhum_Serpin-1 Immune Genes Serpin-3 lhum_Serpin-3 Immune Genes Serpin-4 lhum_Serpin-4 Immune Genes serpin-5 lhum_Serpin-5 Immune Genes SP1 lhum_SP1a Immune Genes SP1 lhum_SP1b Immune Genes SP14 lhum_SP14 Immune Genes SP2 lhum_SP2 Immune Genes SP30 lhum_SP30 Immune Genes SP46 lhum_SP46 Immune Genes SP49 lhum_SP49 Immune Genes spz1 lhum_spz1 Immune Genes spz2 lhum_spz2 Immune Genes spz4 lhum_spz4 Immune Genes spz5 lhum_spz5 Immune Genes spz6 lhum_spz6

20
Immune Genes Stat92E lhum_Stat92E Immune Genes Tab2 lhum_Tab2 Immune Genes Tak1 lhum_Tak1 Immune Genes TEP7 lhum_TEP7 Immune Genes TEPA lhum_TEPA Immune Genes TepIII lhum_TepIII Immune Genes Toll-1 lhum_Toll-1a Immune Genes Toll-1 lhum_Toll-1b Immune Genes Toll-10 lhum_Toll-10 Immune Genes Toll-6 lhum_Toll-6 Immune Genes Toll-8 lhum_Toll-8 Immune Genes Traf1 lhum_Traf1 Immune Genes Traf6 lhum_Traf6 Immune Genes tub lhum_tub juvenile hormone jhamt Lhum_jhamt juvenile hormone jhe Lhum_jhe Larval cuticle formation GMCOX2 Lhum_GMCOX2 larval development amon Lhum_amon learning and mem 14-3-3zeta lhum_14-3-3zeta Learning or memory S6kII lhum_S6KII-like Memory 14-3-3epsilon lhum_14-3-3epsilon Memory aPKC lhum_aPKC
Memory As lhum_ubiquitin protein ligase E3A
Memory CaMKII lhum_CaMKII Memory cer no ortholog Memory CrebB-17A lhum_creb Memory Ddc lhum_Ddc Memory dgs lhum_dgs Memory dnc lhum_dnc Memory drk lhum_drk Memory eag lhum_eag Memory eas lhum_eas-like Memory exba lhum_exba Memory Gld2 lhum_Gld2-like Memory per lhum_per Memory Phm lhum_cytochrome P450-like Memory pum lhum_pumilio-like Memory sbr lhum_small bristles-like Memory stau lhum_stau-like Memory Tbh lhum_tbh Memory Tequila lhum_tequila-like Memory w lhum_white Memory yu lhum_yu-like methyl binding protein mbd2 lhum_mbd2
miRNA 67 distinct orthologs
mushr. body dev mbt lhum_mbt nervous sys dev. shd Lhum_shd nuclear transport Ran Lhum_Ran Olfactory Learning 14-3-3zeta lhum_14-3-3zeta Olfactory Learning cher / cheerio lhum_cher Olfactory Learning dikar lhum_dikar-like Olfactory Learning Fas2 / Fasciclin 2 lhum_Fas2 Olfactory Learning Fas3 / Fasciclin 3 lhum_Fas3-like Olfactory Learning futsch lhum_futsch-like
Olfactory Learning gclm / Glutamate-cysteine ligase modifier subunit
lhum_gclm
Olfactory Learning gp210 lhum_gp210 Olfactory Learning gry / gryzun lhum_gry Olfactory Learning klingon lhum_klingon-like Olfactory Learning lat / latheo lhum_lat Olfactory Learning ltd / lightoid lhum_ltd-like Olfactory Learning mnb / minibrain lhum_mnb-like Olfactory Learning mob2 lhum_mob2-like
21
Olfactory Learning mol / moladietz lhum_mol Olfactory Learning mura / murashka lhum_mura-like
Olfactory Learning nf1 / Neurofibromin 1 lhum_Nf1
Olfactory Learning NMDA receptor 1 lhum_NMDA Receptor 1 Olfactory Learning nord lhum_nord-like Olfactory Learning pigeon pbar_pigeon
Olfactory Learning pka-C1 lhum_cAMP-dependent protein kinase
Olfactory Learning pka-R1 / cAMP-dependent protein kinase R1
lhum_Pka_R1
Olfactory Learning Pp1-87B pbar_Pp1 Olfactory Learning pst / pastrel lhum_pastrel-like Olfactory Learning rad / radish lhum_radish-like Olfactory Learning rho / rhomboid lhum_rhomboid-like Olfactory Learning rogdi lhum_rogdi Olfactory Learning sarah lhum_sra Olfactory Learning scb / scab lhum_scab-like Olfactory Learning sgg / shaggy lhum_sgg-like Olfactory Learning shi / shibire lhum_shibire Olfactory Learning shn / schnurri lhum_shn-like
Olfactory Learning supernumerary limbs lhum_slmb
Olfactory Learning trp / transient receptor potential lhum_trp-like
Olfactory Learning tun / tungus lhum_tungus OXPHOS ACPM Lhum_Ndufab1_like OXPHOS AT91 Lhum_Atp5g2_like OXPHOS ATP5E Lhum_Atp5e_like OXPHOS ATPA Lhum_Atp5a1 OXPHOS ATPB Lhum_Atp5b_like OXPHOS ATPD Lhum_Atp5d_like OXPHOS ATPF Lhum_Atp5f1_like OXPHOS ATPG Lhum_Atp5c1_like OXPHOS ATPJ Lhum_Atp5i_like OXPHOS ATPK Lhum_Atp5j2_like OXPHOS ATPN Lhum_Atp5l_like OXPHOS ATPO Lhum_Atp5o_like OXPHOS ATPQ Lhum_Atp5h_like OXPHOS ATPR Lhum_Atp5j_like OXPHOS C560 Lhum_SdhC_like OXPHOS CG8728 Lhum_Pmpca_like OXPHOS COX4 Lhum_Cox4i1_like OXPHOS COX5A Lhum_Cox5a_like OXPHOS COX5B Lhum_Cox5b_like OXPHOS COX6A Lhum_Cox6a1_like_A OXPHOS COX6A Lhum_Cox6a1_like_B OXPHOS COX6B Lhum_Cox6b1_like_A OXPHOS COX6B Lhum_Cox6b1_like_B OXPHOS COX6C Lhum_Cox6c_like OXPHOS COX7C Lhum_Cox7c_like OXPHOS CY1 Lhum_Cyc1_like_a OXPHOS CY1 Lhum_Cyc1_like_b OXPHOS DHSA Lhum_Sdha_A OXPHOS DHSA Lhum_Sdha_like_B OXPHOS DHSB Lhum_SdhB_like_A OXPHOS DHSB Lhum_SdhB_like_B OXPHOS DHSD Lhum_SdhD_like OXPHOS N4AM Lhum_Ndufa7_like OXPHOS N4BM Lhum_Ndufc2_like OXPHOS N5BM Lhum_Ndufa11_like OXPHOS N7BM Lhum_Ndufa12_like OXPHOS N7BM Lhum_Ndufa12_pseudo OXPHOS NB2M Lhum_Ndufb3_like OXPHOS NB4M Lhum_Ndufa6_like

22
OXPHOS NB5M Lhum_Ndufb4_like OXPHOS NB6M Lhum_Ndufa13_like OXPHOS NB7M Lhum_Ndufb6_like OXPHOS NB8M Lhum_Ndufb7_like OXPHOS NI2M Lhum_Ndufb9_like OXPHOS NI8M Lhum_Ndufa2_like OXPHOS NIAM Lhum_Ndufb8_like OXPHOS NIDM Lhum_Ndufb10_like OXPHOS NIGM Lhum_Ndufb2_like OXPHOS NIMM Lhum_Ndufa1_like OXPHOS NINM Lhum_Ndufb1_like OXPHOS NIPM Lhum_Ndufs5_like OXPHOS NISM Lhum_Ndufb5_like OXPHOS NUAM Lhum_Ndufs1 OXPHOS NUBM Lhum_Ndufv1_like_a OXPHOS NUCM Lhum_Ndufs2_like OXPHOS NUDM Lhum_Ndufa10_like OXPHOS NUEM Lhum_Ndufa9_like OXPHOS NUFM Lhum_Ndufa5_like OXPHOS NUGM Lhum_Ndufs3_like OXPHOS NUHM Lhum_Ndufv2_like OXPHOS NUIM Lhum_Ndufs8_like OXPHOS NUKM Lhum_Ndufs7_like OXPHOS NUML Lhum_Ndufa4_like OXPHOS NUMM Lhum_Ndufs6_like OXPHOS NUPM Lhum_Ndufa8_like OXPHOS NUYM Lhum_Ndufs4_like OXPHOS UCR1 Lhum_Pmpcb_like OXPHOS UCR2 Lhum_Uqcrc2_like OXPHOS UCR6 Lhum_Uqcrb_like OXPHOS UCRH Lhum_Uqcrh_like OXPHOS UCRI Lhum_Uqcrfs1_like_A OXPHOS UCRI Lhum_Uqcrfs1_like_B OXPHOS UCRQ Lhum_Uqcrc2_like_a OXPHOS UCRQ Lhum_Uqcrq_like OXPHOS UCRX Lhum_Uqcr10_like_a OXPHOS UCRX Lhum_Uqcr10_like_b OXPHOS UCRY Lhum_Uqcr11_like OXPHOS Vha55 Lhum_Atp12a OXPHOS Vha68 Lhum_Atp6v1a pigmentation Pink Lhum_Pink Protein coding cappuccino lhum_capu protein coding maleless lhm_mle protein coding nemy lhum_nemy protein coding Pdk Lhum_Pdk protein coding Rap Lhum_Rap protein coding/cholinergic receptor
nAChRa1 Lhum_nAChRa1
protein coding/GPCR mGlutR1 Lhum_mGlutR1 protein coding/GPCR Rab 6 Lhum_rab6 protein coding/RTK EphR Lhum_Eph protein folding Cnx99a Lhum_Cnx99a-1 protein folding Gp 93 Lhum_GP93 protein folding PDI Lhum_PDI-1 Protein kinase Asator Lhum_Asator protein kinase Fak56D Lhum_Fak56D ras protein signal transduction f-cup Lhum_f-cup
Regulation of Ca +2 dependent processes Cam/ Calmodulin lhum_cam
REPRODUCTION DNA Damage/TE Armi, Armitage lhum_armi
REPRODUCTION DNA Damage/TE
ATM, Ataxia-telangiectasia gene lhum_ATM
REPRODUCTION ATR, Ataxia lhum_ATR

23
DNA Damage/TE telangiectasia and Rad3-related gene
REPRODUCTION DNA Damage/TE
Chk2, Checkpoint kinase 2 or Loki lhum_loki
REPRODUCTION DNA Damage/TE
CK2beta; casein kinase II beta lhum_CK2beta
REPRODUCTION DNA Damage/TE Csul, Capsuleen lhum_csul
REPRODUCTION DNA Damage/TE
Cuff, Cutoff or Dom3Z lhum_Dom3Z
REPRODUCTION DNA Damage/TE
eIF5b, eukaryotic translation initiation factor 5b
lhum_EIF5b
REPRODUCTION DNA Damage/TE
Gbb; glass bottom boat/ protein 60A lhum_gbb
REPRODUCTION DNA Damage/TE
Hen1, Hua enhancer 1 or pimet;
lhum_pimet
REPRODUCTION DNA Damage/TE
HP1, heterochromatin protein 1
lhum_HP1-like
REPRODUCTION DNA Damage/TE
Hsp90/ Dmel Hsp83 lhum_hsp90A lhum_hsp90B
REPRODUCTION DNA Damage/TE
PIWI, P-element-induced wimpy testis
Lhum_Piwi-like
REPRODUCTION DNA Damage/TE Spn-E, Spindle-E lhum_SpnE
REPRODUCTION DNA Damage/TE
Stam; Signal transducing adaptor molecule
lhum_stam
REPRODUCTION DNA Damage/TE Tf, Traffic Jam lhum_trafficjam
REPRODUCTION DNA Damage/TE Tud, Tudor protein; lhum_tud
REPRODUCTION DNA Damage/TE Zuc, Zucchini lhum_zuc
REPRODUCTION Maternal Determ 6-Vasa Lhum_Vasa-like-RB
Ribosomal Protein RACK1 lhum_Rack1 Ribosomal Protein RpL10 lhum_RpL10 Ribosomal Protein RpL10Ab lhum_RpL10A Ribosomal Protein RpL11 lhum_RpL11 Ribosomal Protein RpL12 lhum_RpL12 Ribosomal Protein RpL13 lhum_RpL13 Ribosomal Protein RpL13A lhum_RpL13A Ribosomal Protein RpL14 lhum_RpL14 Ribosomal Protein RpL15 lhum_RpL15 Ribosomal Protein RpL17 lhum_RpL17 Ribosomal Protein RpL18 lhum_RpL18 Ribosomal Protein RpL18A lhum_RpL18A Ribosomal Protein RpL19 lhum_RpL19 Ribosomal Protein RpL21 lhum_RpL21 Ribosomal Protein RpL22 lhum_RpL22 Ribosomal Protein RpL23 lhum_RpL23 Ribosomal Protein RpL23A lhum_RpL23A Ribosomal Protein RpL24 lhum_RpL24 Ribosomal Protein RpL24-like lhum_RpL24-like Ribosomal Protein RpL26 lhum_RpL26 Ribosomal Protein RpL27 lhum_RpL27 Ribosomal Protein RpL27A lhum_RpL27A Ribosomal Protein RpL28 lhum_RpL28 Ribosomal Protein RpL29 lhum_RpL29 Ribosomal Protein RpL3 lhum_RpL3 Ribosomal Protein RpL30 lhum_RpL30 Ribosomal Protein RpL31 lhum_RpL31 Ribosomal Protein RpL32 lhum_RpL32

24
Ribosomal Protein RpL34a lhum_RpL34 Ribosomal Protein RpL35 lhum_RpL35 Ribosomal Protein RpL35A lhum_RpL35A Ribosomal Protein RpL36 lhum_RpL36 Ribosomal Protein RpL36A lhum_RpL36A Ribosomal Protein RpL37a lhum_RpL37 Ribosomal Protein RpL37A lhum_RpL37A Ribosomal Protein RpL38 lhum_RpL38 Ribosomal Protein RpL39 lhum_RpL39 Ribosomal Protein RpL4 lhum_RpL4 Ribosomal Protein RpL40 lhum_RpL40 Ribosomal Protein RpL41 lhum_RpL41 Ribosomal Protein RpL5 lhum_RpL5 Ribosomal Protein RpL6 lhum_RpL6 Ribosomal Protein RpL7 lhum_RpL7 Ribosomal Protein RpL7A lhum_RpL7A Ribosomal Protein RpL8 lhum_RpL8 Ribosomal Protein RpL9 lhum_RpL9 Ribosomal Protein RpLP0 lhum_RpLP0 Ribosomal Protein RpLP0-like lhum_RpLP0-like Ribosomal Protein RpLP1 lhum_RpLP1 Ribosomal Protein RpLP2 lhum_RpLP2 Ribosomal Protein RpS10b lhum_RpS10 Ribosomal Protein RpS11 lhum_RpS11 Ribosomal Protein RpS12 lhum_RpS12 Ribosomal Protein RpS13 lhum_RpS13 Ribosomal Protein RpS14a lhum_RpS14 Ribosomal Protein RpS15 lhum_RpS15 Ribosomal Protein RpS15Aa lhum_RpS15A Ribosomal Protein RpS16 lhum_RpS16a Ribosomal Protein RpS16 lhum_RpS16b Ribosomal Protein RpS17 lhum_RpS17 Ribosomal Protein RpS18 lhum_RpS18 Ribosomal Protein RpS19a lhum_RpS19 Ribosomal Protein RpS2 lhum_RpS2 Ribosomal Protein RpS20 lhum_RpS20 Ribosomal Protein RpS21 lhum_RpS21 Ribosomal Protein RpS23 lhum_RpS23a Ribosomal Protein RpS23 lhum_RpS23b Ribosomal Protein RpS24 lhum_RpS24 Ribosomal Protein RpS25 lhum_RpS25 Ribosomal Protein RpS26 lhum_RpS26 Ribosomal Protein RpS27 lhum_RpS27 Ribosomal Protein RpS27A lhum_RpS27A Ribosomal Protein RpS28b lhum_RpS28a Ribosomal Protein RpS28b lhum_RpS28b Ribosomal Protein RpS29 lhum_RpS29 Ribosomal Protein RpS3 lhum_RpS3 Ribosomal Protein RpS30 lhum_RpS30a Ribosomal Protein RpS30 lhum_RpS30b Ribosomal Protein RpS3A lhum_RpS3A Ribosomal Protein RpS4 lhum_RpS4 Ribosomal Protein RpS5a lhum_RpS5 Ribosomal Protein RpS6 lhum_RpS6 Ribosomal Protein RpS7 lhum_RpS7 Ribosomal Protein RpS8 lhum_RpS8 Ribosomal Protein RpS9 lhum_RpS9 Ribosomal Protein RpSA lhum_RpSA RNAi Pathway AGO1 lhum_AGO1 RNAi Pathway AGO2 lhum_AGO2 RNAi Pathway AGO3 lhum_AGO3 RNAi Pathway dcr1 lhum_dcr1 RNAi Pathway drosha lhum_drosha RNAi Pathway loqs lhum_loqs RNAi Pathway pasha lhum_pasha RNAi Pathway Belle Lhum_Belle-like

25
RNAi Pathway Elp1 Lhum_Elp1-like RNAi Pathway Embargoed Lhum_Crm1-like RNAi Pathway Exportin 5 Lhum_Xpo5-like RNAi Pathway Fmr1 Lhum_Fmr1-like RNAi Pathway Loqs2 Lhum_Loqs2-like RNAi Pathway Pros45 Lhum_Pros45-like RNAi Pathway R2D2 Lhum_similar-to-R2D2 RNAi Pathway Sid1 Lhum_Sid1-like RNAi Pathway Translin Lhum_Trsn-like RNAi Pathway Trax Lhum_Trax-like RNAi Pathway VIG Lhum_VIG-like Serotonic Transporter dmel_SerT lhum_SerT signaling pathways L(2)TID Lhum_l(2)tid unfolded protein response ATF6 Lhum_ATF6-1
unfolded protein response IRE1 Lhum_IRE-1-1
unfolded protein response XBP-1 Lhum_XBP-1-1
Vesicular Transport Arf2 Lhum_Arf2 Vision blue opsin lhum_blueopsin
Vision long wavelength opsin 1 lhum_LWopsin1
Vision long wavelength opsin 2 lhum_LWopsin2
Vision pteropsin-like lhum_pteropsin-like Vision UV opsin lhum_UVopsin WBSCR gene hsap_EIF4H lhum_EIF4H_like WBSCR gene hsap_LAT2 lhum_LAT2_like WBSCR gene hsap_LIMK1 lhum_LIMK1_like WBSCR gene hsap_STX1A lhum_STX1A_like WBSCR gene hsap_TBL2 lhum_TBL2_like WBSCR gene hsap_WBSCR16 lhum_WBSCR16_like WBSCR gene hsap_WBSCR22 lhum_WBSCR22_like WBSCR genes hsap_ABHD11 lhum_ABHD11_like WBSCR genes hsap_BAZ1B lhum_BAZ1B_like WBSCR genes hsap_BCL7B lhum_BCL7B_like WBSCR genes hsap_CLIP2 lhum_CLIP2_like WBSCR genes hsap_FKBP6 lhum_FKBP6_like WBSCR genes hsap_HIP1 lhum_HIP1_like WBSCR genes hsap_PMS2 lhum_PMS2_like WBSCR genes hsap_RFC2 lhum_RFC2_like WBSCR genes hsap_STAG3 lhum_STAG3_like
WING-A/P pattern 10-decapentaplengic lhum_dpp
WING-A/P pattern 11-hedgehog lhum_hedgehog WING-A/P pattern 12-thinkveins lhum_thickveins
WING-A/P pattern 13-daughters against dpp lhum_dad
WING-A/P pattern 14-mothers against dpp lhum_mad
WING-A/P pattern 15-smoothened lhum_smoothened WING-A/P pattern 16-knirps lhum_knirps WING-A/P pattern 17-baboon lhum_baboon WING-A/P pattern 19-punt lhum_punt WING-A/P pattern 1-brinker lhum_brinker WING-A/P pattern 20-saxophone lhum_saxophone WING-A/P pattern 2-engrailed lhum_engrailed WING-A/P pattern 3-escargot lhum_escargot WING-A/P pattern 4- medea lhum_medea WING-A/P pattern 5-optomotorblind lhum_omb WING-A/P pattern 6-patched lhum_patched
WING-A/P pattern 7-cubitus interruptus lhum_cubitusinterruptus
WING-A/P pattern 8-smad on x lhum_smox WING-A/P pattern 9a-spalt-related lhum_spalt-related

26
WING-A/P pattern 9-spalt lhum_spalt WING-Apoptosis 11-p53 lhum_p53 WING-Apoptosis 12-JNK basket bsk lhum_JNK WING-Apoptosis 13-Eiger egr lhum_eiger WING-Apoptosis 14-wengen wgn lhum_wengen WING-Apoptosis 15-Buffy lhum_bcl-like WING-Apoptosis 16- Ras1 Ras85D lhum_ras1 WING-Apoptosis 19- Dredd lhum_dredd WING-Apoptosis 1-dronc Nc lhum_dronc WING-Apoptosis 20- caspase-like lhum_caspase-like WING-Apoptosis 21- caspase-likeB lhum_caspase-likeB WING-Apoptosis 22- caspase-likeC lhum_caspase-likeC WING-Apoptosis 2-drice ICE lhum_drICE WING-Apoptosis 3-diap-1/thread th lhum_diap1 WING-Apoptosis 8-dcp-1 lhum_dcp-1 WING-D/V pattern 10-serrate Lhum_serrate WING-D/V pattern 11-mindbomb Lhum_mindbomb WING-D/V pattern 12-dsrf(blistered) Lhum_blistered WING-D/V pattern 13-notum/wingful Lhum_notum WING-D/V pattern 14-Hipk Lhum_hipk WING-D/V pattern 15-tartan/capricious Lhum_tartan-capricious-likeA WING-D/V pattern 16-tartan/capricious Lhum_tartan-capricious-likeB WING-D/V pattern 17-arrow Lhum_arrow WING-D/V pattern 18-dally Lhum_dally WING-D/V pattern 19-nemo Lhum_nemo WING-D/V pattern 1-wingless Lhum_wingless WING-D/V pattern 20-armadillo Lhum_armadillo
WING-D/V pattern 21-suppressor of hairless(Su(H)) Lhum_suppressorofhairless
WING-D/V pattern 22-Nipped-A Lhum_nipped-a WING-D/V pattern 23-mastermind Lhum_mastermind WING-D/V pattern 2-apterous Lhum_apterous WING-D/V pattern 3-distaless Lhum_distal-less WING-D/V pattern 4-cut Lhum_cut WING-D/V pattern 5-scalloped Lhum_scalloped WING-D/V pattern 6-vestigial Lhum_vestigial WING-D/V pattern 7-delta Lhum_delta WING-D/V pattern 8-fringe Lhum_fringe WING-D/V pattern 9-notch Lhum_notch WING-muscle dev 23 -mef2 lhum_mef2 WING-muscle dev 24 -spl1 lhum_spl1 WING-muscle identity 18-twist lhum_twist

27
Figure S4. Neighbor joining tree of DNA methyltransferases using the BLOSUM 62 matrix (made using Jalview, 22). The tree includes Dnmts from two mammal species, Homo sapiens and Mus musculus, for reference (only Dnmt3b shown for reference).
Cytoplasmic ribosomal protein genes Up to 10% of a cell’s protein inventory is estimated to be an integral part of its
ribosomes, the macromolecular complexes that catalyze protein synthesis in all
organisms (24). While ribosomal RNA lies both structurally and functionally at the heart
of each ribosome, a suite of peripherally arranged ribosomal proteins fulfills many
critical roles pertaining to the assembly and stability of the complex. Riboproteins are,
however, far more than ‘RNA glue’ – many serve as a binding platform for other factors
in the translational process, and mediate the manifold molecular interactions of the
ribosome (25). In one particular example, RACK1 (now recognized as an integral
ribosomal component, 26) links several signal transduction pathways to the ribosome and
can thus regulate translation in response to cell stimuli. It may also be involved in the
regulation of specific mRNA translation, and the recruitment of ribosomes to sites that

28
require a localized boost of protein synthesis (27). In addition, various extra-ribosomal
functions have been described for some ribosomal proteins, lending credibility to the
hypothesis that they were co-opted from a set of pre-existing proteins during the
evolution of the ribosome from a RNA-only complex to a ribonucleoprotein particle (28).
In concurrence with their indispensable role, ribosomal proteins are highly conserved
within eukaryotes, both in terms of number and sequence. Cytoplasmic ribosomes
contain about 80 proteins (CRPs) that are encoded by a variable number of genes
(mitochondrial ribosomes, being of prokaryotic origin, possess a slightly different protein
makeup). However, it is widely believed that in animals, only one gene copy acts as the
principal template for each riboprotein (29, 30). Conservedness and wide genomic
distribution – as found in D. melanogaster and humans (29, 31) – make riboprotein genes
ideally suited to evaluate the coverage and fidelity of both genome assemblies and
automatically annotated gene sets.
Gene models coding for the cytoplasmic ribosomal proteome of L. humile were
identified by performing a BLAST search against the OGS1.1. Ribosomal protein
sequences of D. melanogaster from FlyBase (http://flybase.org) served as query
sequences. These models were inspected and edited if necessary, using Apollo (21). Care
was taken to ensure that the predicted gene structures matched corresponding
transcriptomic data. Models were also aligned to homologous protein sequences from D.
melanogaster and A. mellifera (the latter obtained from the Ribosomal Protein Gene
Database, http://ribosome.med.miyazaki-u.ac.jp) using the default parameters in MAFFT
v6 (32) to monitor the integrity of the reading frame and the extent of the predicted
coding domains. Gene homology relations were inferred by querying the annotated D.

29
melanogaster proteins deposited at FlyBase with the translated gene models. Best
reciprocal BLAST hits were interpreted as orthologs (33). Non-functional gene copies
were identified by searching the L. humile genome assembly using the TBLASTN
program and the D. melanogaster CRP sequences as queries, with the low complexity
filter disabled and the e-value cut-off set to 10-4. The same strategy was employed to
assess the number of CRP genes in N. vitripennis.
A total of 83 genes were found in the L. humile genome, encoding the full set of
79 cytoplasmic ribosomal proteins recognized in insect and mammalian genomes (29,
31). Four proteins are represented by two genes (RpS16, RpS23, RpS28 and RpS30);
these duplicates seem to have arisen in evolutionary recent time, as is indicated by
identical gene structures and an average sequence identity of 97% between the pairs.
In addition, we identified the receptor of activated c kinase (RACK1), which is
now known to be a constituent ribosomal protein even though it is not counted among the
‘traditional’ CRPs. Two CRP-like genes (RpL24-like and RpLP0-like) that are
presumably of ancient origin and present in all eukaryotic genomes (29) were also found,
although their functions remain unknown. As in other animals, three genes, RpL40,
RpS27A and RpS30, code for fusion proteins that consist of ubiquitin or ubiquitin-like
sequences at the N-terminus and the respective CRPs at the C-terminal end. All of the
above-mentioned genes are represented by EST data and thus transcriptionally active,
although it can be hypothesized that only one copy of each duplicate pair acts as the
primary gene, while the other one is generally expressed at considerably lower levels (29,
30).
Evidence for non-functional gene copies was scarce. Lack of EST support, a

30
truncated open reading frame and comparably low similarity to its mother gene RpL18,
indicate the presence of a single pseudogene. In contrast to the D. melanogaster genome,
and particularly the human genome with its thousands of processed CRPs pseudogenes
(30), no pseudogenes derived from retrotransposition events were discovered.
Overall, the CRP gene repertoire of the Argentine ant shows high similarity to
that of other insects. The number of genes and recent duplicates is within the same range
as in D. melanogaster (88 genes), A. mellifera (80 genes) and N. vitripennis (79 genes),
and the average sequence identity compared to the D. melanogaster orthologs is 77%
(range: 52–100%). The high sequence similarity to the reference genes made it possible
to reliably identify sequencing errors that resulted in reading frame shifts or premature
stop codons. Relative to the total number of nucleotide positions coding for CRP genes
(including RACK1), the five cases of presumable sequencing error that were discovered
indicate one erroneous position in every 8300 nucleotides. The fidelity of the assembly
sequence thus amounts to an excellent 99.988 % in coding regions of the genome,
comparable to the accuracy achievable with Sanger technology. The completeness of the
gene set also suggests that the L. humile genome assembly thoroughly covers the gene
space of the genome. Further evidence for the quality of the assembly is given by the fact
that no instances of scaffold misassembly could be identified during the annotation of the
CRP genes.
Oxidative phosphorylation The oxidative phosphorylation (OXPHOS) pathway produces ATP, the major source of
cellular energy, by utilizing a proton gradient across the inner mitochondrial membrane.
This pathway is unique in its composition; incorporating 67 nuclear-encoded genes as

31
well as all 13 mitochondrial protein-coding genes (34). These mitochondrial genes tend
to accumulate substitutions more quickly than nuclear genes, potentially leading to
incompatibility with the nuclear genes with which they normally interact. This may lead
to selective pressure on the nuclear genes to compensate for the mitochondrial change
(35). This potentially very rapid evolution within a highly functionally constrained
pathway may implicate this pathway in hybrid incompatibility between recently diverged
populations.
We found evidence for 79 nuclear encoded OXPHOS genes in the genome
sequence of L. humile, compared to the 81 reported in D. melanogaster (36). Of the D.
melanogaster genes, 14 are duplicated from the other 67 “core” nuclear encoded
OXPHOS genes). One of these core genes (cox7a) is missing from the L. humile genome
assembly. This gene is also not found in A. mellifera but is found in other
holometabolous insects, including N. vitripennis, which may indicate that this is a
deletion specific to aculeate hymenopterans. One of the 79 L. humile genes may be a
processed pseudogene, since it is the result of a duplication and contains the full
transcript in a single exon. There appear to be eight L. humile-specific duplications (not
including the aforementioned pseudogene) that are not found in other taxa. All of the
conserved copies of these duplications (that is, the copy that is most similar to the D.
melanogaster reference gene) have EST support, consistent with the relatively high
expression level of the nuclear encoded OXPHOS genes. However, all but one of the
divergent copies had no EST support, indicating that these genes may have been co-opted
for a different purpose.

32
Single nucleotide polymorphisms (SNPs) Since the genomic reads used for the L. humile assembly were derived from multiple
diploid females (1 queen pupa and ~100 workers) (Table S1), it was possible to identify
single nucleotide polymorphisms (SNPs) from the natural genetic diversity captured in
the raw reads. Such SNP-rich regions might indicate genes or regulatory regions under
selection and since our genomic sequences were from the introduced range, these SNPs
could be excluded from other polymorphisms that differ in the native range.
We used the Roche gsMapper tool and custom Perl scripts to identify SNPs in the V0.4
Celera assembly of the L. humile genome. Briefly, individual unpaired 454 and Illumina
reads were mapped back to the reference assembly using the Roche gsMapper tool. We
intentionally only evaluated cases in which a single nucleotide in one read had another
single base transition or transversion mutation and omitted cases of insertions and
deletions. Custom Perl scripts were used to extract SNPs that were present in 10% or
more of the reads and to identify C->T and T->C SNPs followed by a G. All SNP data
were converted to GFF3, then loaded into the Chado database to determine intersections
with InterProScan and other results. Overall, we discovered a total of 381,232 SNPs with
two supporting reads and 231,248 with three or more overlapping reads where the SNP is
present in at least 10% of the read data. Overall, single base transition mutations
accounted for 78.84% of SNPs, while transversions accounted for 21.15%. In the main
text we report results for all single base SNPs occurring in at least three reads and in
more than 10% of mapped reads. The top 100 ranked genes with SNPs can be found in
Table S3.

33
Table S3. Top 100 genes containing the most SNPs. The total number of SNPs present in at least hree reads and 10% of mapped reads were tabulated over the exons for OGS1.1 and manually annotated genes. The genes with the highest number of SNPs per kilobase (kb) are listed in ranked order along with the predicted function based on InterProScan and GO analyses. Genes that also rank in the top 100 genes with a CG<->TG SNP are listed with an asterisk. L. humile Gene ID # SNPs Sum Exon
Length (bp) #
SNP/kb Interproscan/GO Function
LH10736 66 763 87 Unknown LH15115 48 610 79 Unknown
LH10737* 140 1992 70 Unknown LH14822 23 337 68 Unknown LH10484 39 574 68 Unknown LH10768 19 281 68 Male sterility, NAD-binding LH10490 17 253 67 ATP synthesis coupled proton transport
LH11476* 30 447 67 Unknown LH15774 54 807 67 Zinc finger, C2CH-type LH10566 28 421 67 Unknown LH10738 107 1702 63 Unknown LH24234 26 425 61 MoeA, N-terminal, domain I and II
LH19459* 114 1922 59 Glucose-methanol-choline oxidoreductase LH13364 47 800 59 Unknown LH23737 17 293 58 Unknown LH11566 17 301 56 Male sterility, NAD-binding LH10423 34 602 56 Maternal tudor protein LH10777 20 355 56 Unknown LH13452 21 397 53 Cellular retinaldehyde-binding/triple function LH10522 18 347 52 Cytochrome b/b6 LH19086 18 356 51 Cytochrome P450 LH10523 12 238 50 Respiratory-chain NADH dehydrogenase LH10151 21 421 50 Unknown LH14397 29 587 49 Retrotransposon LH10668 13 267 49 Alanyl tRNA synthetase LH14471 30 641 47 Male sterility, NAD-binding
LH11410 17 369 46 S-adenosyl-L-methionine-dependent methyltransferases
LH10428 35 763 46 Unknown LH18354 34 752 45 Protein tyrosine phosphatase activity LH10554 83 1861 45 Zinc finger, CCHC-type LH23198 26 589 44 Unknown LH10564 15 340 44 Unknown LH14669 13 296 44 Unknown
LH15116* 60 1397 43 Unknown LH10361 11 258 43 Cytochrome P450 LH20971 11 269 41 Unknown LH10002 21 517 41 Unknown LH15114 63 1552 41 Male sterility, NAD-binding

34
LH12438 28 690 41 Retroviral Protease-related LH14791 23 580 40 Unknown LH23196 17 436 39 Unknown LH13453 11 286 38 Cellular retinaldehyde-binding/triple function LH10295 17 442 38 Cytochrome P450 LH20452 11 289 38 Male sterility, NAD-binding LH12750 23 614 37 Unknown LH22547 65 1814 36 Beta-ketoacyl synthase LH14710 28 789 35 Unknown LH10691 9 255 35 Unknown LH10371 17 484 35 Zinc finger, CCHC-type LH10368 8 229 35 EGF-like LH12706 36 1043 35 Unknown LH10485 16 466 34 Unknown LH10031 30 877 34 Unknown LH10275 21 615 34 Unknown LH10294 14 410 34 Cytochrome P450 LH10175 18 528 34 Unknown LH15775 11 324 34 Unknown LH10223 26 767 34 Beta-ketoacyl synthase LH10240 13 386 34 Unknown LH10172 8 239 33 Cytochrome P450 LH24208 58 1744 33 M,I,L,Y,V Aminoacyl-tRNA synthetase, class I LH10528 7 212 33 Unknown LH23634 16 499 32 Unknown LH20022 9 284 32 Unknown LH19133 20 639 31 Unknown LH10562 11 352 31 Unknown LH13944 28 904 31 Unknown LH10118 8 260 31 Beta-ketoacyl synthase LH11789 38 1237 31 Male sterility, NAD-binding LH11587 37 1207 31 Unknown LH23651 26 850 31 Zinc finger, C2CH-type LH10713 4 131 31 Unknown LH10769 23 766 30 Cellular retinaldehyde-binding/triple function LH10557 9 300 30 Unknown LH23236 13 434 30 Unknown LH10539 6 202 30 Unknown LH10845 17 586 29 Cellular retinaldehyde-binding/triple function LH10221 34 1174 29 Unknown LH23116 37 1279 29 Unknown LH14821 10 346 29 Unknown LH10861 21 730 29 Unknown LH19443 33 1150 29 Nose resistant to fluoxetine-4 LH15067 28 978 29 Unknown LH18214 18 629 29 Copper ion homeostasis LH18957 38 1340 28 Unknown LH10061 12 425 28 Collagen alpha
LH15199 16 567 28 FAD-dependent pyridine nucleotide-disulphide oxidoreductase

35
LH15106 21 745 28 Unknown LH10510 8 284 28 Cytochrome P450 LH14782 22 786 28 Unknown LH10194 10 358 28 Unknown LH10072 41 1486 28 EGF-like LH11848 21 769 27 Unknown LH13469 6 221 27 Histone Acetyl Transferase Dimerization LH13456 13 487 27 Unknown LH11735 30 1133 26 General trancription factor 2-related LH15598 14 529 26 Zinc finger, CCHC-type LH22726 9 345 26 Unknown LH10292 23 884 26 Unknown
L. humile Gene ID # SNPs Sum Exon Length (bp)
# SNP/kb Interproscan/GO Function
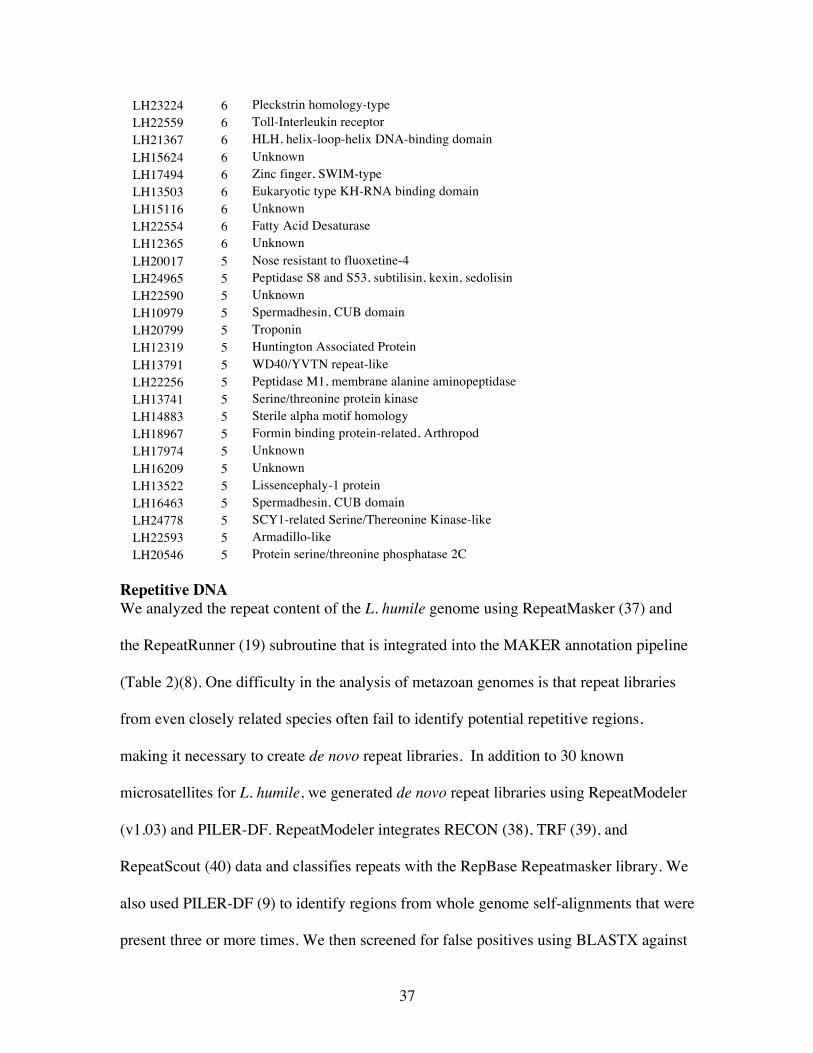
Table S8. Top 100 genes containing the most CG <-> TG SNPs. The total number of CG->TG and TG->CG SNPs present in at least 10% of mapped reads were tabulated over the introns and exons for OGS1.1 and manually annotated genes. The genes with the highest number of SNPs are listed in ranked order along with the predicted function based on InterProScan and GO analyses. Genes that also rank in the top 100 genes with any SNP are listed with an asterisk.
L. humile Gene ID
# CG <->TG SNPs
Interproscan/GO Function
LH22547* 26 Beta-ketoacyl synthase LH10223* 13 ABC transporter LH19567 12 ABC transporter
LH15114* 12 Male sterility, NAD-binding LH13099 12 Unknown LH21678 11 Major facilitator superfamily general substrate transporter LH19774 11 Zinc finger, C6HC-type
LH12438* 11 Retroviral Protease-related LH10072* 11 EGF-like LH14263 11 Immunoglobulin-like fold
LH10281* 11 Male sterility, NAD-binding LH10324 10 Helicase-related LH11824 10 Beta-ketoacyl synthase LH10984 10 Syntaxin/epimorphin, conserved site LH23430 10 Maternal tudor protein LH12427 10 Unknown LH17005 10 Unknown LH15975 10 Protein kinase C, phorbol ester/diacylglycerol binding
LH10554* 9 Zinc finger, CCHC-type LH23822 8 Acetylcholine Receptor Protein Alpha 1, 2, 3, 4 LH10737 8 Unknown
LH19108* 8 Carboxylesterase, type B LH16800 8 Unknown LH24790 8 Guanine nucleotide exchange factor for Ras-like GTPases, N-terminal

36
LH19987 8 Unknown LH25151 8 Serine/threonine protein kinase LH11485 8 Tetratricopeptide region LH14375 8 TonB box
LH12706* 8 Unknown LH14824 8 Rab GTPase activator activity LH21310 8 Peptidase M2, peptidyl-dipeptidase A LH19459 8 Glucose-methanol-choline oxidoreductase LH21309 8 EGF-like LH14856 7 Glycoside hydrolase, family 47 LH15643 7 EGF-like LH15694 7 Cytochrome P450 LH16977 7 Low density lipoprotein-receptor, class A / serine-type endopeptidase LH16271 7 Peptidase S8 and S53, subtilisin, kexin, sedolisin LH10850 7 Cytochrome P450 LH24147 7 Guanine nucleotide exchange factor for Ras-like GTPases LH11563 7 Restriction endonuclease, type II-like LH15429 7 Helix-turn-helix, Psq LH22089 7 Pyridoxal phosphate-dependent decarboxylase LH17329 7 Unknown LH18215 7 Zinc finger, LIM-type LH16950 7 Cholesterol transporter
LH14700* 7 Unknown LH17535 6 Plectin/Plakin repeat LH23698 6 Tyrosyl-DNA phosphodiesterase LH11284 6 Peptidase S54, rhomboid LH19447 6 Formate C-acetyltransferase
LH10442* 6 Ribonuclease H-like LH15166 6 Zinc finger, SWIM-type LH22562 6 Multidrug resistance ABC transporter MsbA LH17034 6 Fibronectin, type III-like
LH12749* 6 Unknown LH14073 6 Fibronectin, type III-like LH16922 6 Armadillo-like helical LH12090 6 Calcium-binding EF-hand LH17201 6 Dynein heavy chain LH14988 6 Transmembrane 4 Superfamil, Invertebrate LH20348 6 Pyridoxal phosphate-dependent transferase LH22813 6 Family A G protein-coupled receptor-like LH13835 6 Peptidase M14, carboxypeptidase A LH15363 6 Zinc finger, C2H2-type LH16103 6 Vestigial/tondu LH18363 6 Acyltransferase ChoActase/COT/CPT
LH19470 6 Unconventional myosin/plant kinesin-like protein/non-motor protein conserved region MyTH4
LH20070 6 Eukaryotic translation initiation factor 3 subunit 8 LH22201 6 Adenylosuccinate synthetase LH19132 6 Beta-ketoacyl synthase LH11476 6 Unknown LH23873 6 Exonuclease, RNase T and DNA polymerase III
37
LH23224 6 Pleckstrin homology-type LH22559 6 Toll-Interleukin receptor LH21367 6 HLH, helix-loop-helix DNA-binding domain LH15624 6 Unknown LH17494 6 Zinc finger, SWIM-type LH13503 6 Eukaryotic type KH-RNA binding domain LH15116 6 Unknown LH22554 6 Fatty Acid Desaturase LH12365 6 Unknown LH20017 5 Nose resistant to fluoxetine-4 LH24965 5 Peptidase S8 and S53, subtilisin, kexin, sedolisin LH22590 5 Unknown LH10979 5 Spermadhesin, CUB domain LH20799 5 Troponin LH12319 5 Huntington Associated Protein LH13791 5 WD40/YVTN repeat-like LH22256 5 Peptidase M1, membrane alanine aminopeptidase LH13741 5 Serine/threonine protein kinase LH14883 5 Sterile alpha motif homology LH18967 5 Formin binding protein-related, Arthropod LH17974 5 Unknown LH16209 5 Unknown LH13522 5 Lissencephaly-1 protein LH16463 5 Spermadhesin, CUB domain LH24778 5 SCY1-related Serine/Thereonine Kinase-like LH22593 5 Armadillo-like LH20546 5 Protein serine/threonine phosphatase 2C
Repetitive DNA We analyzed the repeat content of the L. humile genome using RepeatMasker (37) and
the RepeatRunner (19) subroutine that is integrated into the MAKER annotation pipeline
(Table 2)(8). One difficulty in the analysis of metazoan genomes is that repeat libraries
from even closely related species often fail to identify potential repetitive regions,
making it necessary to create de novo repeat libraries. In addition to 30 known
microsatellites for L. humile, we generated de novo repeat libraries using RepeatModeler
(v1.03) and PILER-DF. RepeatModeler integrates RECON (38), TRF (39), and
RepeatScout (40) data and classifies repeats with the RepBase Repeatmasker library. We
also used PILER-DF (9) to identify regions from whole genome self-alignments that were
present three or more times. We then screened for false positives using BLASTX against

38
known D. melanogaster genes (Release 5.25).
Initial runs of PILER-DF and RepeatModeler against the L. humile genome
assembly returned 554 total raw repeat predictions of which RECON, RepeatScout, and
PILER-DF generated 362, 135, and 57, respectively (Table 2). We then removed 16
redundant sequences that were greater than 80% identical over 80% of their length and
identified 15 sequences to be false positives via a BLASTX analysis against known
genes. Alignments displaying sequence identities greater than a threshold value while
scoring higher than 30 bits were manually checked for homology to repetitive gene
clusters such as histones and Stellate elements, well-conserved functional sites, or genes
with repetitive exon structures such as mucin or dumpy. The sequence identity threshold
was iteratively relaxed until diminishing returns converged to zero at 50% sequence
identity. At each iteration, sequences identified as false positives were culled from the
repeat library. In addition, we found additional LTRs and DNA transposons using a
custom script to identify long terminal repeats (LTR) and terminal inverted repeats (TIR)
at the terminal ends of unclassified repeat predictions.
Published data for the honeybee (A. mellifera, 41) and jewel wasp (N. vitripennis,
42) genomes illustrate two extremes of genomic repeat composition for Hymenoptera:
the honeybee is AT-rich (67%) but devoid of all except a few mariner (43) and rDNA-
specific R2 (44) transposable elements, while Nasonia has an AT content (58%) similar
to other D. melanogaster (56%) and numerous retroid elements. The L. humile genome
assembly has a 62% AT composition, intermediate to Nasonia and Apis, but also contains
23.6Mb (11%) of interspersed TEs. A total of 7,828 retroid and 8,720 DNA transposon
fragments were identified, however, the majority of interspersed elements (67,928,

39
17.1Mb, 6.8% of genome) were identified with de novo predications and could not be
classified to a specific TE family. We discovered most known families of transposable
elements with the exception of L1 and CRE/SLAC LINE-like elements. Gypsy/DIR1
and R1/LOA/Jockey elements were the most abundant retroid elements and Tc1 repeats
were the most abundant DNA TEs.
Viruses and viroids Viruses specifically infecting hymenopterans have been reported for the red imported fire
(Solenopsis invicta, 45, 46) and A. mellifera (47), and may play a significant role in
colony survival and fitness. We screened the L. humile genome for the presence of 1778
sequenced virus and viroid genomes and report TBLASTX hits that had bit scores greater
than 100 or had more than 50% of the virus aligned in the genome with 50% or greater
sequence identity. This analysis yielded ~300 significantly aligning regions spanning
over 400 kilobases (Table S4). Previous studies in N. vitripennis identified poxvirus-
associated PRANC domains in the genome that appeared to be laterally transferred from
Wolbachia endosymbionts. We downloaded Nasonia-defined PRANC domains from
www.treebase.org (Study #S10521) and used them to train a custom hidden Markov
model using HHMER 3.0 (48). We then scanned the L. humile genome using this HMM,
but could not identify statistically significant PRANC domains.

40
Table S4. Viral and viroid DNA. Viruses and viroids found in the L. humile genome, ranked by total number of bases aligned by TBLASTX. Viruses & viroids restricted to insect (orange), plant or algae (green), microbes (purple), vertebrates (grey), or unknown (white) are indicated. *, Iridoviridae also infect fish, amphibians, and reptiles. Virus Family Bases Aligned Baculoviridae 144,777 Polydnaviridae 112,214 Caulimoviridae 59,001 Poxviridae 45,497 Phycodnaviridae 26,643 Unclassified dsDNA viruses 8,762 Mimiviridae 8,564 Herpesvirales 7,395 Iridoviridae* 6,526 Ascoviridae 5,031 Caudovirales 3,981 Apscaviroid 1,923 Pospiviroid 1,629 Nimaviridae 1,542 Cocaviroid 1,503 Coleviroid 924 Hostuviroid 486 Avsunviroid 459 Unclassified phage 282 Asfarviridae 222 Unclassified viroids 186
TOTAL 437,781 bp
KEGG, InterProScan, and Gene Ontology Analysis We used InterProScan (49) and KEGG (50) (Fig. S2, Table S5) to identify putative
functional domains and looked for enriched Gene Ontology (GO) gene functions both in
the species-specific genes identified from the L. humile OGS1.1 and for all Argentine ant
genes relative to D. melanogaster, A. mellifera, and N. vitripennis (Tables S6 and S7).
We analyzed the complete set of L. humile MAKER predictions (15,345) and ab initio
gene predictions (29,206) with InterProScan and KEGG to identify gene regions with
similarity to known functional domains. Raw InterProScan results were parsed using
custom Perl scripts to generate a Gene Ontology GAF2.0 file that was used as an input to
identify enriched Gene Ontology terms using Go-Term-Finder v0.86 (51)

41
(http://search.cpan.org/dist/GO-TermFinder/). For comparative purposes we performed a
similar GO enrichment analysis on the D. melanogaster GO annotations
(geneontology.org, 52). Since we were unaware of an existing GO annotation for the A.
mellifera and N. vitripennis genomes, we generated one using InterProScan analysis of
the ‘preOGS2 honeybee peptides’ and OGS1.2 Nasonia peptides (www.beebase.org).
Enrichments were tested for statistical significance using a Fisher exact test with
Bonferroni correction and a 0.05 false discovery rate.
In total, 23,575 GO terms were reported for L. humile. This is a similar proportion
of the genes as in other Hymenoptera, but distinct from D. melanogaster (Tables S6 and
S7). This difference may, however, be partially due to ascertainment bias, as all three
Hymenoptera had automated annotations, whereas D. melanogaster genomes are human-
curated with biological verification.

42
Figure S2. Overview of annotated KEGG pathways. Brightly shaded lines indicate pathways with L. humile genes that have been annotated in OGS1.1. Specific KEGG maps can be downloaded from http://HymenopteraGenome.org/linepithema/genome_consortium/datasets.html

43
Figure S3. GO enrichment figures. GO terms for L. humile-specific genes were compared to the genome-wide statistics and evaluated for enrichment using Go-Term-Finder. The number of genes annotated with each GO terms are shown along with the percentage indicidence for L. humile-specific genes (blue) and all L. humile genes (red). P-value for enrichements are indicated to the right. Yellow highlighting indicates example GO terms that describe genes seen to have expansions in L. humile from other data in this study. GO cellular location terms are highlighted in green. A)

44
B)

45
Table S6. Summary of GO Slim Terms for L. humile, N. vitripennis, A. mellifera, and D. melanogaster. GO terms were ‘slimmed’ using the Amigo online tool. Percent of genes mapped to each GO term is shown for each species. Blue cells indicate terms that are represented fewer times than D. melanogaster, while yellow stippled cells are found a higher percent of the time than in fruitfly. Frequencies comparable to Drosophila are shaded grey.
BIOLOGICAL PROCESS L.
humile N.
vitripennis A.
mellifera D. melanogaster biological_process 11.62 11.52 11.52 16.36
transport 1.52 1.61 1.5 1.57 cell communication 0.7 0.69 0.71 1.3 signal transduction 0.61 0.58 0.6 0.93
ion transport 0.39 0.49 0.4 0.21 response to stress 0.36 0.35 0.35 0.64
transcription 0.34 0.35 0.33 0.33 generation of precursor metabolites and
energy 0.32 0.37 0.29 0.11 protein transport 0.25 0.32 0.22 0.24
cell cycle 0.18 0.14 0.18 0.89 cell death 0.11 0.12 0.11 0.3
death 0.11 0.12 0.11 0.32 response to external stimulus 0.09 0.06 0.09 0.38
growth 0.07 0.06 0.07 0.22 regulation of gene expression,
epigenetic 0.07 0.06 0.07 0.16 reproduction 0.05 0.06 0.07 1.09
cell-cell signaling 0.05 0.06 0.07 0.3 cell differentiation 0.05 0.03 0.04 1.72
response to abiotic stimulus 0.05 0.04 0.33 cell proliferation 0.02 0.03 0.02 0.14
response to biotic stimulus 0.02 0.03 0.02 0.2 cell growth 0.02 0.02 0.05
MOLECULAR FUNCTIONS molecular_function 16.31 15.99 16.52 11.08
catalytic activity 10.85 10.2 11.1 6.45 transferase activity 3.49 2.94 3.65 2.38 hydrolase activity 3 3.23 3.05 1.82
binding 2.86 3.17 2.81 2.4 transporter activity 1.45 1.41 1.48 1.28
kinase activity 1.07 0.89 1.02 0.69 protein binding 0.91 0.98 0.91 1.05
enzyme regulator activity 0.68 0.72 0.69 0.41 signal transducer activity 0.57 0.49 0.69 0.81
nucleic acid binding 0.52 0.58 0.46 0.42 peptidase activity 0.48 0.52 0.46 0.17
receptor activity 0.45 0.37 0.57 0.65 nuclease activity 0.41 0.52 0.42 0.23
protein kinase activity 0.34 0.23 0.31 0.36

46
ion channel activity 0.32 0.35 0.33 0.27 transcription regulator activity 0.29 0.37 0.31 0.17
DNA binding 0.27 0.29 0.22 0.16 receptor binding 0.25 0.23 0.22 0.27
lipid binding 0.23 0.26 0.22 0.12 nucleotide binding 0.18 0.2 0.2 0.07
cytoskeletal protein binding 0.14 0.17 0.13 0.15 RNA binding 0.14 0.14 0.13 0.2
structural molecule activity 0.14 0.14 0.15 0.11 carbohydrate binding 0.11 0.12 0.11 0.06
phosphoprotein phosphatase activity 0.09 0.12 0.09 0.09 translation factor activity, nucleic acid
binding 0.09 0.12 0.09 0.04 antioxidant activity 0.09 0.12 0.09 0.05
translation regulator activity 0.09 0.12 0.09 0.06 chromatin binding 0.05 0.06 0.04 0.03
motor activity 0.05 0.06 0.04 0.03 actin binding 0.05 0.06 0.04 0.02
transcription factor activity 0.02 0.03 0.02 0.01 neurotransmitter transporter activity 0.02 0.03 0.02 0.04
calcium ion binding 0.02 0.03 0.02 0.01 oxygen binding 0.02 0.02 0.01
CELLULAR LOCATION cellular_component 3.83 4.06 3.69 3.54
cell 3.59 3.77 3.47 3.36 intracellular 3.02 3.17 2.87 2.66
cytoplasm 1.52 1.67 1.41 1.2 nucleus 0.61 0.52 0.57 0.74
mitochondrion 0.29 0.37 0.31 0.24 cytoskeleton 0.27 0.32 0.29 0.39 nucleoplasm 0.27 0.23 0.27 0.31
plasma membrane 0.25 0.26 0.24 0.35 chromosome 0.2 0.26 0.2 0.34
endoplasmic reticulum 0.2 0.26 0.18 0.11 Golgi apparatus 0.18 0.23 0.18 0.12
extracellular region 0.14 0.14 0.13 0.12 cytosol 0.09 0.12 0.09 0.09
ribosome 0.09 0.06 0.09 0.04 nuclear chromosome 0.07 0.09 0.07 0.12
vacuole 0.07 0.09 0.07 0.04 peroxisome 0.07 0.09 0.07 0.02
external encapsulating structure 0.02 0.06 0.04 0.02 cell envelope 0.02 0.06 0.04 0.01
extracellular space 0.02 0.03 0.02 0.03 nucleolus 0.02 0.03 0.02 0.03 lysosome 0.02 0.03 0.02 0.02
microtubule organizing center 0.02 0.03 0.02 0.08

47
Table S7. GO terms from L. humile-specific genes that are enriched relative to D. melanogaster, A. mellifera, and N. vitripennis.
GO ID GO Term p-value Ontology Aspect
# Genes
GO:0005623 cell 5.72E-13 Cell Loc 3396 GO:0044464 cell part 5.72E-13 Cell Loc 3396 GO:0005622 intracellular 2.44E-05 Cell Loc 2134 GO:0044456 synapse part 1.96E-04 Cell Loc 43 GO:0045202 synapse 1.96E-04 Cell Loc 43 GO:0045211 postsynaptic membrane 4.47E-04 Cell Loc 41
GO:0043167 ion binding 1.63E-20 Molc Fxn 1463 GO:0043169 cation binding 1.63E-20 Molc Fxn 1463 GO:0046872 metal ion binding 1.14E-19 Molc Fxn 1424 GO:0005509 calcium ion binding 8.41E-16 Molc Fxn 245 GO:0008270 zinc ion binding 2.96E-09 Molc Fxn 892 GO:0046914 transition metal ion binding 1.87E-08 Molc Fxn 1119
GO:0004674 protein serine/threonine kinase activity 1.68E-07 Molc Fxn 201
GO:0004803 transposase activity 6.51E-05 Molc Fxn 29
GO:0004623 phospholipase A2 activity 8.76E-05 Molc Fxn 36 GO:0005488 binding 1.98E-04 Molc Fxn 4713
GO:0004190 aspartic-type endopeptidase activity 4.06E-04 Molc Fxn 34
GO:0070001 aspartic-type peptidase activity 4.06E-04 Molc Fxn 34
GO:0004091 carboxylesterase activity 2.04E-03 Molc Fxn 44
GO:0004620 phospholipase activity 2.37E-03 Molc Fxn 48 GO:0016298 lipase activity 8.88E-03 Molc Fxn 55 GO:0016042 lipid catabolic process 1.59E-05 Biol Proc 42 GO:0006313 transposition, DNA-mediated 8.45E-05 Biol Proc 29 GO:0032196 transposition 8.45E-05 Biol Proc 29 GO:0007165 signal transduction 1.36E-04 Biol Proc 502 GO:0007154 cell communication 1.95E-04 Biol Proc 534
GO:0007264 small GTPase mediated signal transduction 7.17E-04 Biol Proc 92
GO:0032501 multicellular organismal process 9.12E-03 Biol Proc 208 GO:0050794 regulation of cellular process 2.71E-02 Biol Proc 1075 GO:0065007 biological regulation 3.11E-02 Biol Proc 1075 GO:0006644 phospholipid metabolic process 3.77E-02 Biol Proc 71 GO:0019637 organophosphate metabolic process 4.88E-02 Biol Proc 78 GO:0007242 intracellular signaling cascade 2.13E-02 Biol Proc 195

48
Table S5. KEGG automated annotation server (KAAS) annotation results. The total number of nodes in KEGG pathways were manually tallied and used to calculate percent coverage for each pathway. Individual KEGG pathway maps are available from http://genomes.arc.georgetown.edu/drupal/linepithema/?q=genome_consortium_datasets
KEGG Map # Pathway Name
Total # of KEGG nodes
# L. humile OGS1.1 Genes
Mapped to Map
% Pathway Coverage
10 Glycolysis / Gluconeogenesis 52 24 44.2 20 Citrate cycle (TCA cycle) 27 22 85.2 30 Pentose phosphate pathway 42 15 35.7
40 Pentose and glucuronate interconversions 61 9 14.8
51 Fructose and mannose metabolism 70 16 21.4 52 Galactose metabolism 50 11 22.0
53 Ascorbate and aldarate metabolism 53 4 7.5 61 Fatty acid biosynthesis 178 5 2.8
62 Fatty acid elongation in mitochondria 34 6 17.6 71 Fatty acid metabolism 83 18 21.7
72 Synthesis and degradation of ketone bodies 6 5 83.3 100 Steroid biosynthesis 72 4 4.2 120 Primary bile acid biosynthesis 46 3 6.5
130 Ubiquinone and other terpenoid-quinone biosynthesis 27 8 25.9
140 Steroid hormone biosynthesis 134 4 2.2 190 Oxidative phosphorylation 189 79 42.3 195 Photosynthesis 65 0 0.0 230 Purine metabolism 167 80 50.3 232 Caffeine metabolism 28 1 7.1 240 Pyrimidine metabolism 106 62 60.4
250 Alanine, aspartate and glutamate metabolism 45 21 46.7
260 Glycine, serine and threonine metabolism 71 19 25.4
270 Cysteine and methionine metabolism 82 16 19.5
280 Valine, leucine and isoleucine degradation 56 26 46.4 281 Geraniol degradation 17 0 0.0
290 Valine, leucine and isoleucine biosynthesis 33 7 21.2 300 Lysine biosynthesis 37 5 16.2 310 Lysine degradation 61 21 34.4

49
330 Arginine and proline metabolism 59 23 39.0 340 Histidine metabolism 42 5 9.5 350 Tyrosine metabolism 111 15 12.6
351 1,1,1-Trichloro-2,2-bis(4-chlorophenyl)ethane (DDT) degradation 12 1 8.3
360 Phenylalanine metabolism 52 9 13.5
361 gamma-Hexachlorocyclohexane degradation 40 6 15.0
362 Benzoate degradation via hydroxylation 58 3 6.9 363 Bisphenol A degradation 16 2 6.3 380 Tryptophan metabolism 78 13 16.7
400 Phenylalanine, tyrosine and tryptophan biosynthesis 45 3 6.7 401 Novobiocin biosynthesis 35 2 5.7 410 beta-Alanine metabolism 36 13 36.1
430 Taurine and hypotaurine metabolism 20 4 20.0
440 Phosphonate and phosphinate metabolism 15 3 26.7 450 Selenoamino acid metabolism 22 9 40.9 460 Cyanoamino acid metabolism 21 3 9.5
471 D-Glutamine and D-glutamate metabolism 13 2 15.4 480 Glutathione metabolism 61 18 31.1 500 Starch and sucrose metabolism 90 17 17.8 510 N-Glycan biosynthesis 38 32 84.2 511 Other glycan degradation 9 9 100.0 512 O-Glycan biosynthesis 14 2 14.3
513 High-mannose type N-glycan biosynthesis 15 1 6.7 514 O-Mannosyl glycan biosynthesis 13 1 7.7
520 Amino sugar and nucleotide sugar metabolism 40 25 62.5 521 Streptomycin biosynthesis 16 6 37.5
523 Polyketide sugar unit biosynthesis 32 1 3.1
524 Butirosin and neomycin biosynthesis 25 1 4.0 531 Glycosaminoglycan degradation 21 11 52.4 532 Chondroitin sulfate biosynthesis 18 7 38.9 533 Keratan sulfate biosynthesis 19 2 10.5 534 Heparan sulfate biosynthesis 30 10 36.7 561 Glycerolipid metabolism 42 18 38.1 562 Inositol phosphate metabolism 38 23 57.9
563 Glycosylphosphatidylinositol (GPI)-anchor biosynthesis 23 15 69.6

50
564 Glycerophospholipid metabolism 70 33 44.3 565 Ether lipid metabolism 31 7 22.6 590 Arachidonic acid metabolism 55 5 12.7 591 Linoleic acid metabolism 15 3 20.0 592 alpha-Linolenic acid metabolism 25 2 8.0 600 Sphingolipid metabolism 46 16 34.8
601 Glycosphingolipid biosynthesis - lacto and neolacto series 16 3 12.5
603 Glycosphingolipid biosynthesis - globo series 19 3 15.8
604 Glycosphingolipid biosynthesis - ganglio series 38 2 5.3 620 Pyruvate metabolism 73 22 30.1
623 2,4-Dichlorobenzoate degradation 33 1 0.0
624 1- and 2-Methylnaphthalene degradation 37 4 10.8 625 Tetrachloroethene degradation 11 1 0.0
626 Naphthalene and anthracene degradation 47 3 6.4 628 Fluorene degradation 28 1 3.6
630 Glyoxylate and dicarboxylate metabolism 63 10 19.0 631 1,2-Dichloroethane degradation 5 1 20.0
632 Benzoate degradation via CoA ligation 54 8 16.7 633 Trinitrotoluene degradation 15 0 6.7 640 Propanoate metabolism 53 15 28.3 641 3-Chloroacrylic acid degradation 9 3 33.3 642 Ethylbenzene degradation 19 1 5.3 643 Styrene degradation 26 4 11.5 650 Butanoate metabolism 53 16 30.2
660 C5-Branched dibasic acid metabolism 19 1 5.3 670 One carbon pool by folate 28 12 42.9 680 Methane metabolism 34 6 20.6
710 Carbon fixation in photosynthetic organisms 35 13 37.1 720 Reductive carboxylate cycle CO2 14 7 50.0 730 Thiamine metabolism 25 3 12.0 740 Riboflavin metabolism 16 4 25.0 750 Vitamin B6 35 4 8.6
760 Nicotinate and nicotinamide metabolism 58 6 12.1
770 Pantothenate and CoA biosynthesis 29 7 27.6 780 Biotin metabolism 17 2 11.8 785 Lipoic acid metabolism 8 3 37.5

51
790 Folate biosynthesis 35 8 22.9 830 Retinol metabolism 41 6 12.2
860 Porphyrin and chlorophyll metabolism 86 17 19.8
900 Terpenoid backbone biosynthesis 22 11 45.5 901 Indole alkaloid biosynthesis 28 1 3.6
903 Limonene and pinene degradation 39 6 20.5 908 Zeatin biosynthesis 16 1 6.3 910 Nitrogen metabolism 69 9 13.0 920 Sulfur metabolism 29 4 13.8 930 Caprolactam degradation 23 3 13.0 940 Phenylpropanoid biosynthesis 70 2 1.4
944 Flavone and flavonol biosynthesis 32 1 3.1
945 Stilbenoid, diarylheptanoid and gingerol biosynthesis 25 1 4.0
950 Isoquinoline alkaloid biosynthesis 48 4 8.3
960 Tropane, piperidine and pyridine alkaloid biosynthesis 19 5 21.1
965 Betalain biosynthesis 15 1 6.7 970 Aminoacyl-tRNA biosynthesis 21 25 119.0
980 Metabolism of xenobiotics by cytochrome P450 36 6 13.9 981 Insect hormone biosynthesis 21 5 28.6
982 Drug metabolism - cytochrome P450 60 6 8.3
983 Drug metabolism - other enzymes 32 16 50.0
1040 Biosynthesis of unsaturated fatty acids 28 6 28.6 1051 Biosynthesis of ansamycins 39 1 2.6
1055 Biosynthesis of vancomycin group antibiotics 34 1 2.9 2010 ABC transporters 304 10 3.6 2020 Two-component system 249 4 1.6 3010 Ribosome 143 83 60.1 3018 RNA degradation 71 47 64.8 3020 RNA polymerase 46 24 52.2 3022 Basal transcription factors 26 23 88.5 3030 DNA replication 46 31 65.2 3040 Spliceosome 77 101 131.2 3050 Proteasome 52 35 65.4 3060 Protein export 23 21 82.6 3070 Bacterial secretion system 21 2 9.5 3320 PPAR signaling pathway 53 14 26.4 3410 Base excision repair 60 21 35.0

52
3420 Nucleotide excision repair 51 34 66.7 3430 Mismatch repair 30 17 53.3 3440 Homologous recombination 55 18 34.5 3450 Non-homologous end-joining 20 7 30.0 4010 MAPK signaling pathway 125 60 47.2 4011 MAPK signaling pathway - yeast 57 8 15.8 4012 ErbB signaling pathway 60 26 41.7 4013 MAPK signaling pathway - fly 30 15 43.3 4020 Calcium signaling pathway 48 28 60.4
4060 Cytokine-cytokine receptor interaction 299 7 2.0 4062 Chemokine signaling pathway 50 35 70.0
4070 Phosphatidylinositol signaling system 43 23 51.2
4080 Neuroactive ligand-receptor interaction 90 26 28.9 4110 Cell cycle 81 68 82.7 4111 Cell cycle - yeast 118 55 44.9 4112 Cell cycle - Caulobacter 31 2 6.5 4114 Oocyte meiosis 72 43 59.7 4115 p53 signaling pathway 60 19 30.0 4120 Ubiquitin mediated proteolysis 109 78 70.6
4130 SNARE interactions in vesicular transport 35 20 54.3 4140 Regulation of autophagy 23 11 39.1 4142 Lysosome 67 51 76.1 4144 Endocytosis 97 67 67.0 4146 Peroxisome 64 44 68.8 4150 mTOR signaling pathway 30 21 70.0 4210 Apoptosis 60 16 23.3 4260 Cardiac muscle contraction 23 19 87.0
4270 Vascular smooth muscle contraction 46 24 56.5 4310 Wnt signaling pathway 71 54 73.2 4320 Dorso-ventral axis formation 27 17 63.0 4330 Notch signaling pathway 24 19 83.3 4340 Hedgehog signaling pathway 19 19 89.5 4350 TGF-beta signaling pathway 55 27 47.3 4360 Axon guidance 79 29 38.0 4370 VEGF signaling pathway 28 17 64.3 4510 Focal adhesion 60 46 78.3 4512 ECM-receptor interaction 116 12 10.3 4514 Cell adhesion molecules (CAMs) 21 4 23.8 4520 Adherens junction 74 25 33.8 4530 Tight junction 56 31 55.4 4540 Gap junction 43 21 51.2
4610 Complement and coagulation cascades 49 2 4.1

53
4612 Antigen processing and presentation 42 12 26.2 4614 Renin-angiotensin system 21 3 14.3
4620 Toll-like receptor signaling pathway 78 19 21.8
4621 NOD-like receptor signaling pathway 56 13 21.4
4622 RIG-I-like receptor signaling pathway 52 12 19.2 4623 Cytosolic DNA-sensing pathway 33 9 27.3 4626 Plant-pathogen interaction 74 7 9.5 4630 Jak-STAT signaling pathway 27 16 55.6 4640 Hematopoietic cell lineage 140 2 1.4
4650 Natural killer cell mediated cytotoxicity 82 16 20.7
4660 T cell receptor signaling pathway 59 25 39.0
4662 B cell receptor signaling pathway 38 17 39.5 4664 Fc epsilon RI signaling pathway 40 16 40.0
4666 Fc gamma R-mediated phagocytosis 47 26 57.4
4670 Leukocyte transendothelial migration 79 22 29.1
4672 Intestinal immune network for IgA production 55 0 1.8 4710 Circadian rhythm - mammal 14 5 28.6 4711 Circadian rhythm - fly 17 7 41.2 4712 Circadian rhythm - plant 35 2 5.7 4720 Long-term potentiation 25 17 68.0 4722 Neurotrophin signaling pathway 77 38 44.2 4730 Long-term depression 34 17 52.9 4740 Olfactory transduction 15 6 33.3 4742 Taste transduction 28 3 14.3 4810 Regulation of actin cytoskeleton 71 45 67.6 4910 Insulin signaling pathway 63 46 71.4 4912 GnRH signaling pathway 40 25 62.5
4914 Progesterone-mediated oocyte maturation 39 34 84.6 4916 Melanogenesis 38 28 73.7 4920 Adipocytokine signaling pathway 37 15 37.8 4930 Type II diabetes mellitus 25 11 40.0 4940 Type I diabetes mellitus 23 3 13.0
4950 Maturity onset diabetes of the young 42 6 11.9
4960 Aldosterone-regulated sodium reabsorption 19 11 57.9
4962 Vasopressin-regulated water reabsorption 23 22 100.0

54
4964 Proximal tubule bicarbonate reclamation 13 7 53.8 5010 Alzheimer's disease 26 80 303.8 5012 Parkinson's disease 38 68 178.9
5014 Amyotrophic lateral sclerosis (ALS) 40 17 42.5 5016 Huntington's disease 64 100 156.3 5020 Prion diseases 57 8 14.0 5110 Vibrio cholerae infection 39 26 66.7
5120 Epithelial cell signaling in Helicobacter pylori infection 50 27 52.0
5130 Pathogenic Escherichia coli infection 47 16 34.0 5140 Leishmania infection 50 9 18.0 5200 Pathways in cancer 210 92 43.8 5210 Colorectal cancer 51 22 43.1 5211 Renal cell carcinoma 50 25 48.0 5212 Pancreatic cancer 44 17 38.6 5213 Endometrial cancer 33 19 60.6 5214 Glioma 58 17 31.0 5215 Prostate cancer 43 23 53.5 5216 Thyroid cancer 20 12 45.0 5217 Basal cell carcinoma 20 18 85.0 5218 Melanoma 26 11 42.3 5219 Bladder cancer 28 8 32.1 5220 Chronic myeloid leukemia 45 21 46.7 5221 Acute myeloid leukemia 35 13 37.1 5222 Small cell lung cancer 37 22 56.8 5223 Non-small cell lung cancer 39 16 41.0 5322 Systemic lupus erythematosus 50 11 22.0 5340 Primary immunodeficiency 46 2 2.2
5410 Hypertrophic cardiomyopathy (HCM) 39 10 23.1
5412 Arrhythmogenic right ventricular cardiomyopathy (ARVC) 59 9 15.3
5414 Dilated cardiomyopathy (DCM) 38 12 31.6 5416 Viral myocarditis 37 8 24.3
TOTALS 244 245
OrthoMCL We used OrthoMCL v2.0 (53) to identify ortholog groups between between the three
Hymenoptera species, A. mellifera (preOGS2 41), N. vitripennis (OGS1.2, 42), and L.
humile (OGS1.1, this study) as well as D. melanogaster (Release 5.27, 54) OrthoMCL

55
also identified species-specific gene expansion families (inparalogs) based on BLASTP
protein sequence similarity. To avoid complicating orthology-paralogy results, we first
reduced each protein dataset using custom Perl scripts to contain only the single longest
isoform when multiple isoforms were present. Next, the results from an all-by-all BLAST
were parsed determine best reciprocal hits and MCL v09-308 Markov Clustering
algorithm was used to define final ortholog, inparalog, and co-ortholog groupings. We
used the suggested parameter values and options for OrthoMCL for all steps in the
pipeline.
Mitochondrial genome
Animal mitochondrial
genomes are
approximately 16Kb in
length and typically
contain 37 genes (55).
The mitochondrial
sequence of L. humile
did not fully assemble
in the v4.0 genome
assembly; the longest
scaffold of
mitochondrial DNA
was 5Kb long and
contained >8 genes (partial genes on either end). Using an iterative process of searching
Figure S1. The Argentine ant mitochondrial genome. The general arrangement of the L. humile mitochondrial genome based on that of A. mellifera. Red dashed lines represent the approximate location of the ends of scaffolds

56
the L. humile v4.0 scaffolds, contigs, transcriptome, raw sequencing reads, and L. humile
mitochondrial sequences deposited at NCBI, we were able to assemble three large
scaffolds covering an estimated 77% (12,516bp) of the mitochondrial genome (Fig. S1)
(calculated using the Apis mellifera ligustica mitochondrial genome as a reference) (56).
The program Sequencher v4.5 (Gene Codes Corp. 2005) was used to align and assemble
fragments; all merged fragments had at least 20bp of overlap. This assembly at least
partially covers 24 genes and there is EST support for 20. This includes 12 of the 13
protein coding genes, 11 of 22 tRNAs and one of the two ribosomal RNAs. The EST
support and multiple genes covered by scaffolds is good evidence that none of the
scaffolds included in this assembly are of nuclear origin (NuMts). We estimate that the
three major scaffolds are separated by two short gaps and one large gap that includes the
origin of replication (a highly repetitive AT-rich region) (Fig. S1). There is complete
synteny within each scaffold with the A. mellifera mitochondrial genome, but without
bridging gaps between scaffolds we are not able to judge larger scale synteny.
Additionally, the L. humile mitochondrial genome appears more similar to A. mellifera
than N. vitripennis, which contained an inversion that resulted in the juxtaposition of COI
(+tRNA-L) and ND5 (57). In L. humile ND5 and ND3 were recovered within a single
scaffold, confirming their proximity and the absence of the inversion seen in N.
vitripennis.
GC Compositional Domain Analysis The DNA contains segments that have a characteristic GC-content that differ
significantly from the GC-content of adjacent segments. These are referred to as
compositional domains. Compositional domains that are compositionally more

57
homogeneous than the chromosome on which they reside are termed “compositionally
homogeneous domains,” while a subset of long (≥ 300kb) compositionally homogeneous
domains retains the traditional name “isochores.” The isochore theory depicts the genome
as a mosaic of long homogeneous domains (58); however, this description has been
repeatedly refuted (59-61), and a new model has been proposed to describe the complex
nature of the genome. The compositional-domain model portrays the genome as a
mixture of short and long domains that may be homogeneous or nonhomogeneous in
respect to the chromosome on which they reside. Indeed, in all animals studied so far, the
distribution of compositional-domain lengths showed an abundance of short domains and
a paucity of long ones. The genome of the L. humile is no exception in this respect (Table
S9). The composition and organization of compositional domains was shaped by different
evolutionary processes involving either fusion or fission of domains. By identifying
compositional domains over multiple genomes, it is possible to track the evolutionary
processes affecting compositional-domain architecture.
Table S9. Distribution of compositional domain lengths.
Order Species Number of compositional domains in length group Total number Assembly size (Mb)
1 kb - 10 kb (%) 10 kb - 100 kb (%)
100 kb - 1 Mb (%)
1 Mb - 10 Mb (%)
L. humile 31,978 (89) 3,755 (10.5) 188 (0.5) 0 (0) 35,921 250.8
A. mellifera 42,006 (91.1) 3,944 (8.6) 150 (0.3) 0 (0) 46,100 230 Hymenoptera
N. vitripennis 51,064 (92.8) 3,870 (7.0) 72 (0.1) 0 (0) 55,006 240
Coleoptera T. castaneum 15,432 (90.0) 1,535 (8.9) 183 (1.1) 3 (0.02) 17,153
131
A. gambiae 36,941 (91.5) 3,185 (7.9) 231 (0.6) 0 (0) 40,357 223
Diptera
D. melanogaster 12,297 (85.3) 1,973 (13.7) 154 (1.1) 0 (0) 14,424 120
*Number of non-ambiguous nucleotides in the assembly

58
Recursive segmentation procedures that partition genomic sequences into
compositional domains have been shown to be the most accurate segmentation methods
(60, 62). Here, we partitioned the genomic sequences into compositional domains using
IsoPlotter, a segmentation algorithm that employs a dynamic halting criterion (60).
IsoPlotter recursively segments the chromosomes by maximizing the difference in GC
content between adjacent subsequences. The process of segmentation was terminated
when the difference in GC content between two neighboring segments was no longer
statistically significant.
We carried out four analyses to study genome architecture in insects. In the first
analysis, we calculated the distribution of compositional-domain lengths. For
convenience, compositional domains were divided by the order of magnitude of their
lengths into short (103-104 bp), medium (104-105 bp), and long (105-107 bp). We, next,
tested whether the lengths of compositional domains follow a power-law distribution.
The minimum domain length and the power-law exponent were estimated using the
method of Clauset, Shalizi, and Newman (63). To test the power-law hypothesis, the
observed data were compared to data generated from a power-law distribution and the
similarity between the two distributions was calculated using the Kolmogorov-Smirnov
statistic (64). Based on the observed goodness-of-fit, we calculated a p-value that
quantifies the probability that the data were drawn from the hypothesized distribution.
We used the Matlab scripts provided by Clauset, Shalizi, and Newman (63) at
http://www.santafe.edu/~aaronc/powerlaws/. In the third analysis, we compared the
distributions of GC contents of compositional domains. Finally, we compared the
compositional-domain GC contents versus their lengths in a log scale.
59
We computed the genomic distribution of the ratio of observed to expected CpG
dinucleotides (CpG(O/E)) by computing CpG(O/E) for each compositional domain and
then determining the total number of nucleotides for compositional domains with
equivalent CpG(O/E). CpG(O/E) is defined as CpG(O/E) = PCpG/(PC*PG), where
PCpG, Pc and PG are the frequencies of CpG dinucleotides, C nucleotides, and G
nucleotides, respectively. We also computed the distribution of CpG(O/E) for coding
exons and introns, after concatenating coding exons or introns, respectively, for each
gene.
We also completed a CpG(O/E) analysis of the genome using a 1kb sliding
window over the genome sequence similar to Elango et al (Figure S5). Overall this
method produced a distibution comparable to the CpG(O/E) analysis performed on
compositional domains.

60
Figure S5. Dinucleotide NpN Observed/Expected (OE) analysis using 1kb sliding window across genomic scaffolds.

61
Figure S6. Dinucleotide NpN Observed/Expected (OE) analysis for OGS1.1 genes.

62
Figure S7. Compositional domain GC content versus compositional domain lengths on a log scale. The middle horizontal line (solid red) represents the mean genome GC content within margins of ± 5% (dashed black).
Figure S8. Comparison of GC content of compositional domains in the L. humile, A. mellifera, N. vitripennis and D. melanogaster. Cumulative distributions show the fraction of nucleotides in compositional domains containing genes (thick lines) or all genomic compositional domains (thin lines) (< x GC%). Similar to the other hymenopterans, L. humile genes tend to occur in the AT-rich parts of the genome.

63
Figure S9. Distribution of GC content in compositional domains, introns and coding exons of A. mellifera, L. humile and N. vitripennis.

64
Figure S10. Distribution of CpG(O/E) in compositional domains, introns and coding exons of A. mellifera, L. humile and N. vitripennis.

65
MicroRNAs To identify miRNAs within the genome of L. humile we employed two strategies. The
first strategy used previously identified miRNAs to identify conserved homologs in the
ant. To do this, we queried the L. humile genome with known miRNAs from miRBase
release 14.0 (65-67) using BLASTN with a word size of 7 and and e-value threshold <
0.001. This query yielded 81 sequences with some degree of sequence similarity to
conserved miRNAs from other species. L. humile sequence was extracted and included
approximately 15 nucleotides of flanking sequence. To assess homology, PRSS (68) was
used with 1000 shuffles. This step eliminated several sequences with similarity to murine
and plant miRNAs. This is not surprising as these miRNAs are composed of simple
sequences. Nucleotide sequence alignments were performed using ClustalW (69),
aligning the putative miRNA sequence with known miRNAs from the genome sequences
of A. mellifera, N. vitripennis, and D. melanogaster. The putative L. humile miRNAs
were trimmed to retain the most likely pre-miRNA sequence. RNAfold (70) was finally
used to score the folding energy (minimum 20 Kcal/mol) and assess the structure of the
pre-miRNA candidates. Our analysis resulted in the identification of 71 conserved L.
humile miRNAs.
The second strategy for miRNA identification uses three-way genome comparison
between L. humile, A. mellifera, and N. vitripennis, for the identification of micro-
conserved sequence elements (MCEs). MCEs are typically 20–29 nt in length and have
previously been exploited to identify miRNAs (71, 72). The identification of three-way
genome intersections results in hundreds of thousands of MCEs across a rather large
evolutionary distance (approximately 190 million years). MCEs representing simple
sequence repeats were excluded and the remaining sequences were clustered to reduce

66
redundancy before being mapped back to the genome. Approximately 75 nucleotides of
sequence flanking the MCEs were extracted. We mapped the extended L. humile
sequences to the N. vitripennis and A. mellifera genomes and retained only those
sequences with identifiable homology. With approximately 10,000 sequences remaining
in our study, we expect to identify additional miRNA candidates by scoring, and folding
the extended sequences, similar to the methods described above.
RNAi RNA interference (RNAi) is a double-stranded RNA (dsRNA)-mediated gene silencing
mechanism through target mRNA cleavage and/or translational repression (41). We
annotated 30 genes in the L. humile genome that are associated with the RNAi pathway,
including all the genes potentially involved in biogenesis and biological function of
miRNAs, siRNAs and piRNAs (Table S2, Fig. S16). Interestingly, all of these genes
appear as single copies except loquacious (loqs), which is duplicated in the L. humile
genome. Domain analysis by InterProScan shows that L. humile Loquacious 1 and 2 have
three and two double stranded RNA binding domains (RBD), respectively. The dsRBD3
of L. humile Loquacious is noncanonical (Fig. S16B), consistent with its homolog in D.
melanogaster (42, 43).

67
A)
Figure S16. RNAi genes. A) Reference D. melanogaster genes for RNA interference pathways were used to manually annotate L. humile genes. The percent protein similarity (bold numbers) and length of annotated orthologs (unbolded numbers) are shown for each gene. Genes are classified according to the functional subfamily which they shared similarity to and whether they function primarily in piRNA (black lines), siRNA (blue lines), and miRNA (red lines) pathways. Empty boxes indicate instances where no clear ortholog was found. B) Comparison between L. humile loquacious double stranded RNA binding domain (RBD) and the second RBD of Xlrbpa (Xlrbpa-2). Three regions important for binding dsRNA (23) are highlighted. Regions 1 (red) and 2 (blue) are associated with the interaction between the secondary structures of protein and the dsRNA minor groove, and Region 3 (pink) is involved in the interaction of the C-terminal secondary structure and the dsRNA major groove (23). The invariable histidine (H), which is specifically responsible for recognizing the minor groove, is missing in Region 2 of Lhum_Loq1_RBD3 and Lhum_Loq2_RBD1 suggesting that these two RBDs are noncanonical.
B) Xlrbpa-2 NPVGSLQELAVQKGWRL--PEYTVAQESGPPHK-REFTITCRVE-------TFVETGSGTSKQVAKRVAAEKLLTKFKT Lhum_Loq1_RBD1 TPVSVLQELLSRRGTI---PKYELVQIEGAIHE-PTFRYRVTVADVVEADPIVSAMGTGRSKKEAKHAAAKAVLDKLIG Lhum_Loq1_RBD2 NPIGALQEMCMSRHWPP--PKYTMEGEEGLPHE-RQFTIVCTIL-------KYREIGQGKSKKVAKRHAAHKMWQALHD Lhum_Loq1_RBD3 NLVQFLQEIASEQQFE---VTYVDIEEKSISGKFQCLVQLSTL-------PVAVCYGCGVTSKDAQASAAQNALEYLKI Lhum_Loq2_RBD1 -PISFLQEFAIKQGYV---PMY-DFKIMNPN-----------G-------NNLSTDGTGNSKKEAKQKAAENMLLLLGQ Lhum_Loq2_RBD2 NYIGVLQELCVRQKLSPRDISYKVIGESGPSHM-RCFIIEVSVK-------SLRAHGTAQSKKIAKQEAAKNLLHDLGL

68
Wing and reproductive system development Wing polyphenism and reproductive division of labor between queens and workers are
two major and universal features of eusociality in ants (73). Both of these features
evolved approximately 150 million years ago (74, 75), and have been key to their
amazing evolutionary success – wing polyphenism was key for allowing ants to colonize
the ground, while reproductive division of labor was key for their organization into
eusocial colonies (73). The gene networks that underlie wing polyphenism and
reproductive system development are generally conserved between ants and D.
melanogaster (76, 77). In ants, however, these networks have evolved to be differentially
expressed between winged reproductive castes and wingless sterile worker castes in
response to either environmental or genetic factors (76, 77). In response to these factors,
these networks must simultaneously produce fully functional wings and reproductive
organs in the queen and male castes, but interrupt the expression of specific genes in the
network to halt the development of wings and constrain reproduction in worker castes.
While some candidate genes that are differentially expressed between queens and
workers have been cloned and identified (76, 77), our ability to understand the
evolutionary and developmental dynamics of these genes both within and between
species has been limited by the absence of an ant genome.
The unicolonial colony structure of introduced L. humile populations may have
been facilitated by changes in wing polyphenism and reproductive division of labor. The
multiple queens of L. humile colonies still produce wings, but these queens do not fly,
and existing colonies grow primarily through colony budding (78). Workers, which still
possess reproductive organs, are functionally sterile (79).

69
Figure S11. CpG(OE) for wing development, reproduction, and apoptosis genes in A) L. humile and B) D. melanogaster. The observed mean for genes in the networks underlying wing polyphenism (red line), reproductive division of labour (green line), and apoptosis (blue line) are plotted relative to the distribution of CpG(O/E) values for all genes in the genome.
Figure S11. CpG(OE) for wing development, reproduction, and apoptosis genes in A) L. humile and B) D. melanogaster. The observed mean for genes in the networks underlying wing polyphenism (red line), reproductive division of labour (green line), and apoptosis (blue line) are plotted relative to the distribution of CpG(O/E) values for all genes in the genome.
We followed the method of
Elango et al. (80) to assess whether
or not the genes we annotated
show signatures of putative
methylation relative to the rest of
the L. humile genome. For each
annotated gene, we calculated the
frequency of the observed number
of CG dinucleotides for the coding
region (exons and introns), as well
as promoter regions
(approximately 5kb upstream of
the start codon) using a custom
Perl script. For both regions of
each gene, we calculated the mean
CpG(O/E) values for three sets of
genes: genes underlying wing
polyphenism, genes involved in
reproductive system development,
and genes known to control
apoptosis. We included genes that
control apoptosis in our analysis because they are intimately linked to the networks that
control wing development (81, 82) and oogenesis (83).

70
To compare the mean CpG(O/E) values for these three sets of genes (coding and
promoter regions) to a genome-wide mean CpG(O/E), we segmented the scaffolds from
the draft assembly of the L. humile genome into 1kb, non-overlapping, fragments using
custom Perl scripts. We measured the frequency of CG dinucleotides and calculated the
CpG(O/E) values for each 1kb fragment using custom Perl scripts based on the same
equation as above. We then calculated a genome-wide mean CpG(O/E) by taking the
mean CpG(O/E) of all 1kb fragments. Although there are alternative methods for
generating a genome-wide mean CpG(O/E), we used this specific method because it was
the only way we could perform the equivalent analyses in and compare them to
Drosophila, an insect species which lacks a CpG methylation system.
To test whether or not there are any significant differences in the mean CpG(O/E)
values between the three sets of genes that we annotated and the genome-wide mean
CpG(O/E), we performed a statistical randomization procedure as follows: first, we
generated a random distribution of CpG(O/E) values by randomly selecting 50 CpG(O/E)
values from the genome-wide distribution. We selected 50 because this is approximately
the same number of genes as that contained within each of the three sets of genes we
manually annotated. We then calculated the mean CpG(O/E) for this random distribution.
Second, we repeated this first step 10,000 times, and then ploted all 10,000 randomly
generated mean CpG(O/E) values (x-axis representing the mean CpG(O/E) values and y-
axis representing the frequency). Third, we determined where the observed mean
CpG(O/E) for each of the three sets of genes we annotated fell with respect the randomly
generated mean CpG (O/E) values. If it fell within the top or bottom 5% of the
distribution of randomly generated mean CpG(O/E) values, then the observed mean

71
CpG(O/E) values were significantly different than the genome-wide mean CpG(O/E). We
performed the same statistical analyses in Drosophila using Drosophila orthologs of the
genes we annotated in L. humile (Figs. 2, S11).
We discovered that the mean CpG(O/E) for genes (coding regions) in the network
underlying reproductive division of labor (n=38; Mean = 1.21; p < 0.00) and apoptosis
(n=18; Mean = 1.22; p < 0.00) are significantly less (Figure S11) than the genome-wide
mean CpG(O/E) (Mean = 1.63). The genes (coding regions) in the network underlying
wing polyphenism is not (Figure S11) significantly different than the genome-wide mean
CpG(O/E) (n=37; Mean = 1.50; p = 0.4865). The mean CpG(O/E) of the Drosophila
orthologs (coding regions) that underlie wing development (Mean = 0.95; p = 0.86),
reproduction (Mean = 0.98; p= 0.98), and apoptosis (Mean = 1.00; p= 0.99) are not
significantly different (Figure S11) than the genome-wide mean CpG(O/E). Together,
these results indicate that developmental genes in the network underlying reproductive
division of labor and apoptosis have a distinct methylation signature relative to the rest of
the L. humile genome, while genes in the network underlying wing polyphenism in ants.
According to Elango et al. (80), genes that are methylated in the germline should
exhibit a mean CpG(O/E) that is under 1.0. The fact that mean CpG(O/E) values of the
three sets of developmental genes are greater than 1.0, but significantly less than the
genome-wide mean CpG(O/E), may indicate that they are still methylated but have a
different methylation signature than the rest of the genes in the genome. The high level of
significance for genes underlying reproductive system development and apoptosis may be
due to their markedly different regulation between the two castes. This differential
regulation may be due to the fact that many of the genes underlying reproductive division

72
of labor are these genes are germline specific, and because apoptosis is a major
mechanism to differentiate castes during development. The majority of genes in the
network underlying wing polyphenism are not specific to wing development, and many
of them are used so broadly, and in so many different structures, that they maybe require
a different methylation signature. Although these intriguing results await empirical
validation, they open many avenues for future research.
Chemoreception (Grs, OBPs, Ors, Irs) Gustatory receptors (Grs). The ant chemosensory gene families were manually annotated
(OBPs, Grs, and Ors), essentially as described earlier (84). One difficulty was that a few
genes had single apparent frameshifts, but upon examination of the raw reads from both
454 and Illumina contributing to these regions, it was apparent that these might be
persistent 454 homopolymer sequencing errors because not all reads contained the same
number of homopolymer bases as the assembly, and they were accordingly fixed. Several
more gene models had gaps in the assembly, and we also attempted to repair these using
raw reads to extend into the gap. Missing parts of these genes were sometimes found
amongst a small number of unassembled contigs, in which case the most appropriate
contig was joined to the gene model to complete it. Supplementary Table S10 provides
details of the GR family genes and encoded proteins, and the encoded proteins are
provided in FASTA format as a supplementary file. Only three genes were already
perfectly built, another 20 existing automated gene models correspond to some of these
genes, but with many changes required, including fusions and splits of models. Twenty of
the 116 LhGr models are pseudogenes (compared to 50-60 Gr pseudogenes in Apis, and
11 in Nasonia), and 14 required repair of the genome assembly, so these could not have

73
been automatically annotated perfectly anyway. The remainder are all new gene models.
We attempted to name these genes in a concordant way with the existing AmGr and
NvGr names, but this is difficult because of gene losses and duplications in different
lineages. For example, the two candidate sugar receptors, Gr1 and 2, were apparently
duplicated as a block, and then one duplicate in each block degenerated to a pseudogene.
To preserve the gene numbering for the remainder of the “orthologous” Grs, we named
these LhGr1.1, 1.2, and 2.1 and 2.2 (LhGr1.3 is yet another pseudogene duplicate).
Similarly, LhGr9 was duplicated, yielding a new pseudogene, hence the names 9.1 and
9.2. Finally, no gene was given the LhGr5 name.
We constructed a corrected distance tree depicting the relationship among the
hymenopteran Grs as in Robertson et al. (84). The two candidate sugar receptor lineages
were defined as the outgroup to root the tree, based on the highly divergent sequence and
gene structure of this gene subfamily (85, 86). The Nasonia, Apis, and Linepithema
gene/protein names are highlighted in blue, amber, and green, respectively, as are the
branches leading to them to emphasize gene lineages. Numbers above branches are
percentage support from 10000 bootstrap replications of uncorrected distance analysis.
Double thickness branches indicate inferred independent GR lineages. Comments on
each gene lineage are on the right. Suffixes after the gene/protein names are: PSE –
pseudogene; CTE – C-terminus missing; INT – internal sequence missing; FIX –
sequence fixed with raw reads; JOIN – gene model joined across scaffolds (combined
suffixes are abbreviated).

74
Odorant binding proteins (OBPs). We identified 12 genes in the L. humile genome
encoding odorant binding proteins (OBPs), which are short secreted proteins typically
containing 6 highly conserved cysteines that form three disufide bonds (although some
have lost two of these cysteines, in this set only LhOBP2 and 3) (e.g. 87). The genes and
their encoded proteins are summarized in Table S15. There were at least partial
automated gene models for all 12 OBPs. Seven of these were perfect, with others
requiring fixes of assembly gaps, correction of frameshifting homopolymers, or addition
of missing exons. Only one gene could not be fully built, that for OBP9 is missing the
expected N-terminal exon that typically encodes the signal sequence at the start of these
secreted proteins, and unfortunately there are no ESTs for it. Like OBPs in other insects,
most of these genes are highly expressed enough to have ESTs in whole body EST
projects like that undertaken for this ant. These ranged from zero ESTs for two genes, to
fewer than 10 for four more, and up to around 113 for OBP4.
There are simple apparent orthologs for a subset of the 21 OBPs known from the
honey bee genome, some of which are conserved throughout endopterygote insects (87).
These are AmOBPs 1, 5, 6/8, 9, 10, and 11. The apparently orthologous ant OBPs were
given the same names. This ant also has a small expansion of OBPs distantly related to
AmOBPs 7 and 12, given the numbers 2, 3, 4, 8, 12. There are no obvious ant relatives of
the AmOBPs 2, 3, 4 and 7. Finally, this ant has a single OBP7 with a possible
relationship to the bee OBP expansion of 13-21. Thus ants and bees share a core set of six
conserved OBPs that are probably involved in multiple functions, some not even related
to odorant binding, given their expression in other tissues (87). On the other hand, they
have differentially expanded different lineages of species-specific OBPs, which are more

75
likely to be involved in olfaction. One of these is the fire ant Solenopsis invicta gp-9
protein, which is an OBP implicated in regulation of queen numbers in colonies (88),
however there is no particularly closely related OBP in L. humile.
Odorant receptors (Ors). The odorant receptor (Or) family of seven-transmembrane
proteins in insects mediates most of insect olfaction (e.g. 89, 90), with additional
contributions from a subset of the distantly related gustatory receptor (Gr) family, for
example, the carbon dioxide receptors in flies (91-93), and a subset of the recently
described and unrelated Ionotropic Receptors (IRs) (94). The Or family ranges in size
from a low of 10 genes in the human body louse (95), to 50-100 receptors in Drosophila
(85, 96), mosquitoes (97, 98), the silk moth Bombyx mori (99, 100), and the pea aphid
Acyrthosiphon pisum (e.g. 101), and from 100-300 in the beetle Tribolium castaneum
(102), the honey bee (103), and Nasonia wasps (84). Although most genes in Drosophila
are scattered around the genome, with only a few in small tandem arrays, tandem arrays
are more typical of the other species, especially those with large repertoires, from which
it is inferred that these larger repertoires may result, in part, from the retention of gene
duplicates that are generated in these tandem arrays by unequal crossing over.
Ants are expected to have a large Or gene family. Their sensory ecology and
social behavior are largely dependent on chemical information, and several species have
been shown to have ~400 glomeruli in the antennal lobes of their brains (e.g. 104, 105).
Assuming that ants are like flies in usually having one specific Or (plus the obligate
heterodimer DmOr83b ortholog) per neuron type, with all neurons that express a
particular Or converging on a single glomerulus in the antennal lobe, the so-called “one

76
receptor - one neuron - one glomerulus” hypothesis, we anticipated approximately 400
Ors. This assumes that an unknown subset of the 116 Grs and the 32 IRs in L. humile are
also expressed in discrete olfactory sensory neurons that send axons to glomeruli in the
antennal lobe.
The Or family was manually annotated using methods previously employed for
the Drosophila, mosquito, moth, beetle, bee, wasp, aphid, and louse genomes. Briefly,
TBLASTN searches were performed using bee, and sometimes wasp, Ors as queries, and
gene models were manually assembled in the text editor of PAUP*v4.0b10 (106), using
the gene structures of the bee and wasp relatives to inform the ant genes. Iterative
searches were also conducted with each new ant protein as query until no new genes were
identified in each major subfamily or lineage. Occasionally the gene structures of ant
genes were useful in informing improved gene models for some bee genes, specifically
the 9-exon subfamily which is highly expanded in ants and wasps. The bee relatives are
scattered throughout the AmOr naming system, because their relationship was not
properly understood when they were annotated. A short exon was missed from several of
them, specifically AmOr122-139. In addition, recognition of the conserved 9-exon
structure of these genes allowed refinement of the AmOr172-174 genes, which were only
recognized in light of the NvOr genes, but could not be completely built at that time (84).
In addition, AmOr175-177 were newly built in this large subfamily, and there are
additional fragments of related genes in the poorly assembled AT-rich regions of the bee
genome that might represent additional genes. All of the LhOr genes and encoded
proteins are detailed in Table S11. LhOr and AmOr proteins are available as FASTA
format text files.

77
The L. humile genome assembly suffers from an unusual minor problem of bases
in the assembly that are not in any of the raw reads, causing frameshifts when they occur
in exons. These are not obviously caused by homopolymer length errors in the 454 reads,
and their origin is unclear. Therefore each instance of a simple single-base frameshift was
checked in both the 454 and ILLUMINA raw reads. In these cases the assembled
sequence was fixed and these problems are noted in Table S11. In addition, as is typical
of draft genome assemblies, gaps between contigs often interrupt gene models, especially
when very similar genes are found in tandem arrays. These were repaired as best possible
using the raw reads and are similarly noted in Table S11. There were several gene
fragments resulting from assembly gaps that encode less than half the typical length of an
insect Or (200 amino acids), and these were not included in the analysis, although they
likely represent intact genes. Pseudogenes were translated as best possible to provide an
encoded protein that could be aligned with the intact proteins for phylogenetic analysis,
and particular attention was paid to the precise number of pseudogenizing mutations in
each pseudogene. Again a 200 amino acid minimum was enforced for including
pseudogenes in the analysis. All ant, bee, and wasp Ors were aligned in CLUSTALX
v2.0 (69) using default settings, and problematic gene models and pseudogenes were
refined in light of these alignments.
For phylogenetic analysis, the poorly aligned and variable length N-terminal and
C-terminal regions were excluded (specifically before the conserved GhWP motif in the
N-terminus and after the conserved SYFT motif in the C-terminus), as were major
internal regions of length differences, especially a long length difference region between
the longer DmOr83b orthologs (PbOr1, AmOr2, and NvOr1) and most of the other Ors.

78
Other regions of potentially uncertain alignment between these highly divergent proteins
were retained because, while potentially misleading for relationships of the subfamilies
(which are poorly supported), they provide important information for relationships within
subfamilies.
Phylogenetic analysis of this large set of 844 proteins is difficult, but was
successfully carried out in the same fashion as for previous Or analyses (e.g. 84, 103).
This involved a combination of model-based correction of distances between each pair of
proteins, and distance-based phylogenetic tree building. Pairwise distances were
corrected for multiple changes in the past using the BLOSUM62 amino acid exchange
matrix in the maximum likelihood phylogenetic program TREEPUZZLE v5.2 (107).
These corrected distances were fed into PAUP*v4.0b10 where a full heuristic distance
search was conducted with tree-bisection-and-reconnection branch swapping to search
for the shortest tree. Given the large number of proteins, this search was unlikely to end
and was terminated after two days with ~12 million trees examined. The resultant tree is
shown in Figure S12. Unfortunately this large number of proteins precludes distance-
based bootstrap analysis to assess the confidence of major branches in the tree, but likely
orthologs and obvious gene losses and subfamily expansions are noted on the right
margin of the tree. Unlike previous large Or trees which were split into multiple page-
sized images, it is presented as a single image.
The LhOr gene set herein consists of 367 models. Thirty of these (8.2%) are
apparent pseudogenes, 19 frameshifts were corrected, and 20 gene models required repair
of assembly gaps. The result is 337 apparently intact Or proteins, although six of these
are still missing N-terminal, C-terminal, or internal regions, so their functionality remains

79
uncertain (excluding the sets of Or60-70 and Or171-203 which have short N-terminal
exons that are difficult to recognize with confidence). Less obvious pseudogenes (for
example with small in-frame deletions or insertions, crucial amino acids changes, or
promoter defects) would not be recognized, so this total might be high. A few gene
fragments remain so short and incomplete that they were not included, but some might
represent intact genes.
The automated gene modeling process had access to all available AmOrs and
NvOrs, as well as other insect Ors in GenBank, for comparative information, and
succeeded in building at least partial gene models for 201 of these 367 genes. However,
as has been true for most other insect genome projects, just five of these are precisely
correct. Most others require multiple changes, while many instances of concatenated gene
models were observed (Table S11), resulting in a total of 140 automated models
representing these 367 Ors (the most extreme was LH22493, which includes parts of
eight genes and spans 20 kb on scaffold 7180001005020). Unfortunately because these
genes are typically expressed at very low levels in only a few cells, they are seldom
represented by ESTs in the whole body 454-sequencing project, as was employed for this
genome, indeed just seven genes had one or two useful ESTs representing them (Table
S11), hence there is little experimental support for most gene models. Nevertheless, there
is EST support for representatives of most NvOr subfamilies and many AmOr
subfamilies (84) so these manually built gene models are of high confidence. This
situation again reveals the importance of manual annotation for these rapidly evolving
and highly divergent genes. Manual annotation was also obviously essential for detailed
analysis of pseudogenes.

80
As expected, there is a single highly conserved ortholog of the DmOr83b protein,
named LhOr1 in hopes of encouraging this convention for this gene and protein in other
species. It shares 77% amino acid identity with AmOr2, 76% with NvOr1, and 61% with
DmOr83b. Unfortunately this gene region has suffered an assembly problem in v4 (but is
intact in v3), and is now split across two scaffolds, but not at the ends of these scaffolds
(similar aberrant assembly problems occurred with Or211 and 233). Only two other
possible examples of relatively simple orthology across these three hymenopteran
genomes were observed, those of LhOr204PSE (which is a severely damaged pseudogene
with 10 major problems) with AmOr161 and NvOr296 (and 297PSE), and LhOr2/3,
which are clearly orthologous to AmOr1/3 and NvOr2 at the base of a large expansion in
both bees and ants which include several complicated relationships as well as the only
hymenopteran Or whose ligand is known, AmOr11 perceiving the major queen
pheromone 9-ODA in bees (108).
There are many instances of differential gene lineage or subfamily expansions, as
previously seen for the bee/wasp comparison (84), including differential expansions in
the ant, for example an expansion of 33 ant genes related to AmOr121 (at the top of the
Fig. S12). The largest ant gene subfamily expansions, however, have occurred in a
subfamily of 9-exon genes in the middle of the tree. This subfamily consists of several
discrete lineages in the bee totaling 43 genes, including AmOr98-105, 106-113, 122-139,
140, 159, 162, 172-174, and 175-177. This subfamily is expanded in Nasonia, where it
consists of 90 genes (NvOr129-217 and 301). This distinctive subfamily consists of 136
genes in the Argentine ant, and is of particular interest as it may include candidates for
the cuticular hydrocarbon receptors. The details have only been established for one ant,

81
Campanotus japonicus (105, 109), in which females have a distinctive set of sensilla that
house 150-200 neurons, each of which is presumed to express a particular Or, sending
their neurons to a distinctive set of 150-200 glomeruli in the antennal lobe. Cuticular
hydrocarbons are long non-volatile chemicals of enormous variety (e.g 110) that regulate
important behavioral interactions (such as colonymate recognition), and it has not been
obvious which receptors are used to perceive them. In Drosophila melanogaster two
related lineages of gustatory receptors or Grs have been implicated in the perception of
female cuticular hydrocarbons by males, but the exact ligand-receptor identification has
yet to be made, these are expressed in contact chemosensilla on the male foretarsi, and
their neurons send axons to the sub-oesophageal ganglion instead of the antennal lobe
(111, 112). As described above, L. humile has two expansions of Grs, but neither is large
enough to encode such a repertoire of CHC receptors, and at least one is likely to encode
receptors for bitter plant defensive chemicals. Therefore, this expansion of 9-exon Or
genes appears to be the strongest candidate for contaning CHC receptors.
These species-specific expansions have typically occurred in large tandem arrays,
some of which are evidently very old because they are shared with bee and even wasp,
and commonly the genes within an array are so divergent they barely find each other in
TBLASTN searches. For example, LhOr2-46 is a 45-gene tandem array that spans 164 kb
on the reverse strand of the 5’ end of 170kb scaffold 7180001005020 and continuing on
the reverse strand of the 3’ end of 254kb scaffold 7180001004633 (Table S11). This
feature is related to a 60-gene tandem array in A. mellifera, which is described in detail in
Robertson and Wanner (103), although the nine related genes in the wasp, N. vitripennis,
(NvOr2-10) are split across three scaffolds (84). Indeed the first and/or second gene in

82
this array appears to be orthologous (noted above – LhOr2/3, AmOr1/3, and NvOr2),
while the remainder form multiple species-specific gene lineage expansions (Figure S12).
LhOr71-116 is another large tandem array of 46 genes spanning 157kb on 1.591Mb
scaffold 7180001004912.
Finally, the Or family reveals many instances of apparent gene loss, with some
lineages completely absent from one or more of these three hymenopterans. In the
abscence of bootstrap analysis the numbers of these losses in each species cannot be
confidently determined, and the uncertain orthology of several subfamily lineages also
makes it difficult to determine the number of losses, but obvious examples are noted in
Figure S12. Separate subfamily tree analysis confirms all of these, and adds several more,
confirming the dynamic gene family evolution known already from comparisons of other
species Or repertoires.
Figure S12 (separate file). Phylogenetic tree of the hymenopteran Ors. This is a corrected distance tree generated. The DmOr83b orthologs LhOr1, AmOr2, and NvOr1 were declared as the outgroup to root the tree, based on the basal position of this gene in the Or family in analysis of the entire chemoreceptor superfamily in Drosophila melanogaster (85). The Nasonia, Apis, and Linepithema gene/protein names are highlighted in blue, amber, and green, respectively, as are the branches leading to them to emphasize gene lineages. Double thickness branches indicate inferred independent Or lineages. Comments on each gene lineage are on the right. Suffixes after the gene/protein names are: PSE – pseudogene; NTE – N-terminus missing; CTE – C-terminus missing; INT – internal sequence missing; FIX – sequence fixed with raw reads; JOI – gene model joined across scaffolds; multiple suffixes are abbreviated to single letters. Table S10. Details of LhGr family genes and proteins. Columns are: Gene – the gene and protein name we are assigning; OGS – the official gene number; Scaffold# – the V4 genome assembly scaffold ID (preceded by scf18000100 in full name); Coordinates – the nucleotide range from the first position of the start codon to the last position of the stop codon in the scaffold; Strand – + is forward and - is reverse; Introns – number of introns; AAs – number of encoded amino acids in the protein; ESTs – number of ESTs (amongst 532,809 454 reads, * indicates aberrantly spliced); Comments – comments on the OGS gene model, repairs to the genome assembly, and pseudogene status (numbers in

83
parentheses are the number of pseudogenizing mutations). Suffixes after the gene/protein names are: PSE – pseudogene; CTE – C-terminus missing; INT – internal sequence missing; FIX – sequence fixed with raw reads; JOIN – gene model joined across scaffolds (combined suffixes are abbreviated).
Gene OGS Scaffold# Coordinates Strand Introns AAs ESTs Comments Gr1.1 LH14807 4828 74106-108737 - 10 459 - Multiple changes
Gr1.2PI LH13968 4748 51542-71539 + 9 354 - Pseudogene (2); has gap
Gr1.3PJ LH12478 4608 10048-26232 - 10 442 - Pseudogene (1) joined
3431 1239-1787 - across two scaffolds
Gr2.1PSE LH14798 4828 64675-67419 + 5 212 - Pseudogene (1)
Gr2.2 LH14676/5 4807 6885-24895 - 8 473 1 Join gene models
Gr3 LH19341 4967 83594-86853 - 8 538 1* Multiple changes
Gr4 LH11242 4450 22954-24621 + 3 457 - Fine as is
Gr6 LH21487 5009 652146-656146 + 5 391 1 Fine as is
Gr7FIX LH19885 4974 44323-48477 - 6 428 - Fix frameshift
Gr8 LH13821 4715 6008073-6009590 - 4 371 1 Part of large gene model
Gr9.1 LH13821 4715 6005287-6006803 - 4 364 - Part of large gene model
Gr9.2PSE LH13821 4715 6001485-6002981 - 4 358 - Part of model; Pseudogene (1)
Gr10 LH19939 4979 84660-97730 - 5 363 - Fine as is
Gr11 LH21303 5005 2838498-2840486 - 2 430 1 Second half missing
Gr12 - 5013 2768-5020 - 4 377 - New gene model
Gr13 - 5018 2245014-2246416 - 2 414 - New gene model
Gr14 - 5018 755164-756641 + 2 415 - New gene model
Gr15PSE - 5018 761347-763072 + 2 420 - Pseudogene (1)
Gr16 - 5018 764333-765842 + 2 422 - New gene model
Gr17 - 5018 767066-768565 + 2 417 - New gene model
Gr18 - 5018 769831-771330 + 2 422 - New gene model
Gr19 LH19887 4974 50648-53593 - 6 406 - Multiple changes
Gr20 LH10133 2461 100167-102910 + 6 408 - Multiple changes
Gr21 - 2461 104060-106547 + 6 408 - New gene model
Gr22PSE - 2461 107105-108998 + 4 320 - Pseudogene (6)
Gr23 - 2461 109340-111809 + 6 409 - New gene model
Gr24PSE - 2461 112327-114201 + 4 314 - Pseudogene (13)
Gr25 - 2461 115110-117567 + 6 408 - New gene model
Gr26 - 2461 118086-120716 + 6 407 - New gene model
Gr27 LH10136 2461 121216-124072 + 6 411 - First 1/2 of gene model
Gr28PSE LH10136 2461 124705-126863 + 6 397 - Second 1/2; Pseudogene (1)
Gr29FIX - 2461 127508-128817 + 6 396 - Fix assembly gap
Gr30 - 2461 129677-132618 + 6 384 - New gene model
Gr31 - 2461 133514-135509 + 6 396 - New gene model
Gr32FIX - 2461 136377-138246 + 6 393 - Fix assembly gap

84
Gr33 LH10134 2461 139146-141321 + 6 402 - Multiple changes
Gr34 - 2461 142088-144495 + 6 393 - New gene model
Gr35FIX - 2461 146592-149078 + 6 396 - Fix frameshift
Gr36 - 2461 150692-153515 + 6 392 - New gene model
Gr37 - 2461 154369-156965 + 6 397 - New gene model
Gr38 - 2461 157687-159966 + 6 386 - New gene model
Gr39 - 2461 161247-163572 + 6 377 - New gene model
Gr40PF - 2461 164888->165553 + 6 411 - Fix gap; pseudogene (1)
Gr41CTE - 2461 168688->170350 + 6 325 - C-terminus missing
Gr42 LH22029 5018 516-3147 + 6 382 - Part of large gene model
Gr43 - 5018 4344-6901 + 6 392 - New gene model
Gr44 LH22029 5018 7935-10872 + 6 395 - Part of large gene model
Gr45 LH22029 5018 11233-13986 + 6 398 - Part of large gene model
Gr46 LH22029 5018 14738-18673 + 6 397 - Part of large gene model
Gr47 - 5018 19034-21774 + 6 397 - New gene model
Gr48PSE LH22028 5018 22532-24684 + 6 356 - Pseudogene (7)
Gr49 - 5018 26012-28169 + 6 396 - New gene model
Gr50 - 5018 28859-31033 + 6 396 - New gene model
Gr51FIX - 5018 32493-34590 + 6 396 - Fix assembly gap
Gr52PSE - 5018 35969-38870 + 6 383 - Pseudogene (2)
Gr53 - 5018 39572-42186 + 6 389 - New gene model
Gr54 - 5018 42654-44687 + 6 388 - New gene model
Gr55 - 5018 45414-48282 + 6 391 - New gene model
Gr56 - 5018 50233-52120 + 6 397 - New gene model
Gr57 - 5018 52978-55148 + 6 397 - New gene model
Gr58 - 5018 55788-57965 + 6 389 - New gene model
Gr59PSE - 5018 58989-61164 + 6 397 - Pseudogene (2)
Gr60FP - 5018 <61480-63340 + 6 434 - Fix gap; pseudogene (5)
Gr61 - 5018 64118-66290 + 6 395 - New gene model
Gr62 - 5018 66742-68931 + 6 395 - New gene model
Gr63PSE - 5018 69895-72074 + 6 389 - Pseudogene (6)
Gr64 - 5018 74382-76560 + 6 395 - New gene model
Gr65 - 5018 77020-79207 + 6 394 - New gene model
Gr66 - 5018 79693-81862 + 6 390 - New gene model
Gr67FIX - 5018 84168-86845 + 6 394 - Fix assembly gap
Gr68PSE - 5018 87331-89514 + 6 389 - Pseudogene (2)
Gr69FP - 5018 90544->93088 + 6 388 - Fix gap; pseudogene (3)
Gr70FIX - 5018 <94170-96200 + 6 390 - Fix assembly gaps
Gr71 - 5018 98532-101533 + 6 393 - New gene model
Gr72 - 5018 102616-106230 + 6 389 - New gene model
Gr73 - 5018 106853-109006 + 6 394 - New gene model

85
Gr74CTE - 5018 109888->112823 + 6 397 - Fix assembly gap
Gr75 - 5018 113372-116116 + 6 391 - New gene model
Gr76PSE - 5018 116614-119360 + 6 392 - Pseudogene (1)
Gr77 - 5018 119767-122613 + 6 398 - New gene model
Gr78 - 5018 122998-125880 + 6 391 - New gene model
Gr79 - 5018 126377-129200 + 6 395 - New gene model
Gr80 - 5018 129654-132607 + 6 395 - New gene model
Gr81 - 5018 133063-135916 + 6 392 - New gene model
Gr82 - 5018 137000-139100 + 6 403 - New gene model
Gr83 - 5018 139865-141999 + 6 389 - New gene model
Gr84 - 4985 1994747-1997275 + 6 396 - New gene model
Gr85 - 4985 1998234-2000866 + 6 392 - New gene model
Gr86 - 4985 2002272-2004901 + 6 392 - New gene model
Gr87 - 4985 2005927-2008474 + 6 391 - New gene model
Gr88 - 4985 2009559-2012080 + 6 396 - New gene model
Gr89PSE - 4985 2013204-2015808 + 6 396 - Pseudogene (5)
Gr90 - 4985 2016791-2019367 + 6 394 - New gene model
Gr91 - 4985 2021453-2024016 + 6 398 - New gene model
Gr92 LH20185 4985 2025125-2027700 + 6 402 - Multiple changes
Gr93 - 4985 2030013-2032601 + 6 402 - New gene model
Gr94 LH20184 4985 2033094-2035730 + 6 420 - First part of model
Gr95 LH20184 4985 2036168-2039332 + 6 402 - Second part of model
Gr96 LH20186 4985 2039837-2042487 + 6 398 - First part of model
Gr97 LH20186 4985 2043004-2045399 + 6 394 - Second part of model
Gr98 - 4985 2046134-2048806 + 6 403 - New gene model
Gr99 - 4985 2049957-2052760 + 6 405 - New gene model
Gr100 - 4985 2053920-2057216 + 6 406 - New gene model
Gr101PSE - 4985 2058443-2061142 + 6 405 - Pseudogene (1)
Gr102 - 4985 2062677-2065778 + 6 402 - New gene model
Gr103FIX - 4985 2067579-2070567 + 6 400 - Fix frameshift and stop codon
Gr104 - 4985 2071876-2075542 + 6 403 - New gene model
Gr105FIX - 4985 2076825-2079996 + 6 394 - Fix assembly gap
Gr106FIX - 4985 2081509-2084186 + 6 398 - Fix assembly gap
Gr107 - 4985 2085098-2087820 + 6 397 - New gene model
Gr108INT - 4985 2091454-2094263 + 6 399 - Fix assembly gap
Gr109 - 4985 2095436-2098097 + 6 396 - New gene model
Gr110FIX - 4985 2099310-2101152 + 6 398 - Fix assembly gap
Gr111 - 4940 1732466-1735058 + 6 394 - New gene model
Gr112PSE - 4940 1735556-1738101 + 6 400 - Pseudogene (1)
Gr113 LH18148 4940 1739673-1742228 + 6 391 - Multiple changes
Gr114 - 3999 23409-25655 + 6 397 - New gene model

86
Table S15. Details of LhOBP family genes and proteins. Columns are: Gene – the gene and protein name we are assigning (suffixes are: NTE – N-terminus missing; FIX – assembly was repaired) ; OGS – the official gene number in the 16,177 proteins in OGS1.1; Scaffold – the V4 genome assembly scaffold ID (preceded by scf18000100 in full name); Coordinates – the nucleotide range from the first position of the start codon to the last position of the stop codon in the scaffold; Strand – + is forward and - is reverse; Introns – number of introns; AAs – number of encoded amino acids in the protein; ESTs – number of ESTs (amongst 532,809 454 reads); Isotig – isotig number in EST assembly; Comments – comments on the OGS gene model and repairs to the genome assembly. Gene OGS Scaffold Coordinates Strand Introns AAs ESTs Isotig Comments OBP1 LH21629 5010 285632-287032 + 5 139 25 04013 Needs C-terminus OBP2FIX LH12959 4659 219626-222285 - 4 156 13 03709 Fix frameshift OBP3 LH12963 4659 214403-218242 - 4 155 0 - Fine as is OBP4 LH12958 4659 211309-213197 - 4 149 113 03012 Fine as is OBP5 LH12960 4659 233686-235630 - 4 144 8 01909 Fine as is OBP6 LH12962 4659 229707-231961 - 5 146 4 - Fine as is OBP7 LH23112 5043 21919-23275 + 4 133 33 03397 Fine as is OBP8 LH12961 4659 205438-207142 - 4 156 3 - Fine as is OBP9NTE LH16671 4922 26398-27214 - 3 120 0 - N-terminus missing OBP10 LH15020 4838 1117240-1119148 + 5 146 27 03482 Fine as is OBP11FIX LH15023 4838 1120846-1121901 + 5 146 4 - Fix assembly gap OBP12 LH19059 4958 850368-851920 - 5 173 15 03490 Needs N-terminus
Table S11. Details of LhOr family genes and proteins. Columns are: Gene – the gene and protein name we are assigning (suffixes are: PSE – pseudogene; NTE – N-terminus missing; CTE – C-terminus missing; INT – internal region missing; FIX – assembly was repaired; JOIN – gene model spans scaffolds; multiple suffixes are abbreviated) ; OGS – the official gene number in the 16,177 proteins in OGS1.1; Scaffold – the V4 genome assembly scaffold ID (preceded by scf718000100 in full name); Coordinates – the nucleotide range from the first position of the start codon to the last position of the stop codon in the scaffold; Strand – + is forward and - is reverse; Introns – number of introns; AAs – number of encoded amino acids in the protein; ESTs – number of ESTs (amongst 532,810 Roche/454 reads); Comments – comments on the OGS gene model, repairs to the genome assembly, and pseudogene status (numbers in parentheses are the number of pseudogenizing mutations). Superscript a – this gene lost one intron and gained another relative to the other 46 genes in this subfamily. Superscriptb – these two genes have an additional intron shared with orthologous genes in Nasonia and Apis. Note that Or60-70 and Or171-203 have short first exons that cannot be confidently identified in the absence of EST evidence, therefore they are all NTE, and coordinates start from the start of the first codon after a phase 1 intron (and this intron is included in the intron count even though it is not in the range coordinates of the CDS). Gene OGS Scaffold Coordinates Strand Introns AAs ESTs Comments Or1JF LH19204 4964 533215-536431 - 7 480 - Join across two scaffolds; LH11309 4453 170456-172130 - fix frameshift Or2 LH25976 5020 110477-112233 - 4 405 - Part of long model Or3 LH25976 5020 107251-109112 - 4 406 - Part of long model Or4 LH25976 5020 103453-105313 - 4a 404 - Part of long model Or5 - 5020 100481-102698 - 4 397 - New gene model Or6 - 5020 98184-99899 - 4 409 - New gene model Or7 LH22493 5020 91596-93866 - 4 400 - Part of long model

87
Or8 LH22493 5020 87345-89634 - 4 396 - Part of long model Or9 LH22493 5020 82824-86499 - 4 399 - Part of long model Or10 LH22493 5020 79304-81300 - 4 399 - Part of long model Or11 LH22493 5020 76185-77967 - 4 399 - Part of long model Or12 LH22493 5020 72178-73850 - 4 409 - Part of long model Or13 LH22493 5020 68896-71197 - 4 399 - Part of long model Or14FIX LH22493 5020 65770->67903 - 4 400 - Fix assembly gap Or15 LH25980 5020 62073-65077 - 4 400 - First half of model Or16 LH25980 5020 59604-61360 - 4 399 - Second half of model Or17 - 5020 57484-59072 - 4 400 - New gene model Or18 - 5020 51309-53188 - 4 409 - New gene model Or19 LH22492 5020 47177-49471 - 4 408 - Multiple changes Or20 - 5020 43752-45471 - 4 407 - New gene model Or21 - 5020 39525-41775 - 4 415 - New gene model Or22PSE - 5020 34590-35808 - 2 301 - Pseudogene (3) Or23 - 5020 32093-33886 - 4 406 - New gene model Or24PSE - 5020 30072-31435 - 2 281 - Pseudogene (2) Or25 LH25978 5020 26693-28486 - 4 406 - Multiple changes Or26 - 5020 23515-26092 - 4 407 - New gene model Or27 - 5020 20967-22987 - 4 403 - New gene model Or28PSE - 5020 15793-17635 - 4 370 - Pseudogene (11) Or29 - 5020 13718-15569 - 4 407 - New gene model Or30 - 5020 10481-12404 - 4 402 - New gene model Or31PSE LH25977 5020 1753-3539 - 4 292 - Pseudogene (1) Or32 LH25400 4633 242188-244333 - 4 414 - Part of long model Or33 LH25400 4633 237193-239341 - 4 412 2 Part of long model Or34 LH25400 4633 232737-234730 - 4 410 - Part of long model Or35 - 4633 226424-228518 - 4 406 - New gene model Or36PSE - 4633 224002-225997 - 4 408 - Pseudogene (3) Or37 LH25400 4633 221387-223511 - 4 409 - Part of long model Or38 LH25401 4633 217472-219484 - 4 403 - Multiple changes Or39 - 4633 213972-215937 - 4 427 - New gene model Or40FIX - 4633 210785-212699 - 4 411 - Fix frameshift Or41 - 4633 205894-207912 - 4 410 - New gene model Or42 LH12715 4633 201840-204335 - 4 411 - Multiple changes Or43 LH12714 4633 198657-201324 - 4 400 - Multiple changes Or44PSE - 4633 194452-196107 - 4 371 - Pseudogene (8) Or45 LH12711 4633 190992-193463 - 5b 406 - Fine as is Or46 LH12712 4633 187141-190462 - 5b 406 - Different final exon Or47FIX - 5082 797933-800054 + 4 394 - Fix frameshift Or48 - 5082 801408-803265 + 4 400 - New gene model Or49 - 5082 808411-810316 + 4 399 - New gene model Or50 - 5082 812264-814336 + 4 392 - New gene model Or51 - 5082 816066-818143 + 4 394 - New gene model Or52 - 5082 820197-822168 + 4 398 - New gene model Or53PSE - 5082 823913-825877 + 4 397 - Pseudogene (2) Or54 LH26112 5082 827276-829195 + 4 398 - Part of long model Or55 LH26112 5082 830852-832813 + 4 399 - Part of long model Or56 LH26112 5082 834250-836133 + 4 395 - Part of long model Or57 LH24938 5082 837963-840334 + 4 402 - First half of model Or58 LH24938 5082 841401-843460 + 4 398 - Second half of model Or59 LH26113 5082 845883-848519 + 4 399 - Multiple changes Or60NTE - 4955 118033-120675 + 6 392 - New gene model Or61NTE - 4955 122500-124586 + 6 392 - New gene model Or62NP - 4955 130515-133155 + 6 392 - Pseudogene (1) Or63NTE - 4955 134974-137065 + 6 392 - New gene model Or64NTE - 4955 143488-145641 + 6 392 - New gene model Or65NP - 4955 150320-153703 + 6 393 - Pseudogene (4) Or66NTE - 4955 156018-158117 + 6 393 - New gene model Or67NP - 4955 174009-176235 + 6 392 - Pseudogene (2) Or68NTE - 4955 179558-181789 + 6 393 1 New gene model Or69NTE - 4955 187483-190513 + 6 399 - New gene model Or70NTE - 4955 192632-195896 + 6 386 - New gene model Or71 LH16353 4912 359883-361915 - 5 386 - One exon missing Or72 LH25609 4912 357098-358951 - 5 387 - Multiple changes Or73 LH25606 4912 351613-356208 - 5 376 - Multiple changes

88
Or74 LH16358 4912 347629-350556 - 5 394 - First half of model Or75 LH16358 4912 344957-346862 - 5 393 - Second half of model Or76 - 4912 342301-344206 - 5 395 - New gene model Or77 - 4912 336581-338420 - 5 387 - New gene model Or78 - 4912 333600-335554 - 5 378 1* New gene model Or79 LH25607 4912 330692-332832 - 5 377 - Multiple changes Or80 LH25605 4912 327495-329656 - 5 381 - Multiple changes Or81 LH16362 4912 324338-326378 - 5 386 - Part of long model Or82 LH16362 4912 319111-321197 - 5 385 - Part of long model Or83 LH16362 4912 315873-318204 - 5 385 - Part of long model Or84 LH16362 4912 311006-313142 - 5 385 - Part of long model Or85 LH16360 4912 307780-310128 - 5 382 - Part of long model Or86 LH16360 4912 304727-306893 - 5 384 - Part of long model Or87 LH16360 4912 301614-303679 - 5 386 - Part of long model Or88PSE LH16360 4912 299196-300662 - 4 315 - Pseudogene (9) Or89 LH16360 4912 295780-298063 - 5 385 - Fix sequence error Or90PSE LH16360 4912 292260-294781 - 5 382 - Pseudogene (2) Or91 LH16360 4912 288873-291222 - 5 386 - Part of long model Or92 LH16360 4912 285885-287918 - 5 387 - Part of long model Or93PSE - 4912 279773-284881 - 5 387 - Pseudogene (6) Or94 LH25610 4912 276779-278823 - 5 384 - Multiple changes Or95 - 4912 273792-275848 - 5 387 - New gene model Or96 LH16352 4912 269853-272829 - 5 388 - Multiple changes Or97 LH25598 4912 267035-268898 - 5 385 - Multiple changes Or98 LH25597 4912 263352-265925 - 5 381 - Multiple changes Or99 LH25596 4912 259949-262145 - 5 385 - Multiple changes Or100 - 4912 256657-258770 - 5 384 - New gene model Or101 - 4912 253185-255497 - 5 385 - New gene model Or102 LH16356 4912 250070-252441 - 5 387 - Multiple changes Or103 LH25603 4912 246289-248157 - 5 380 - Multiple changes Or104 LH25611 4912 241017-242914 - 5 389 - Multiple changes Or105FIX - 4912 236946-239186 - 5 386 - Fix frameshift Or106FIX - 4912 <234924-236241 - 5 386 - Fix assembly gap Or107FIX - 4912 233332-236241 - 5 386 - Fix assembly gap Or108 LH16357 4912 230197-232323 - 5 386 - Multiple changes Or109 - 4912 226817-229070 - 5 386 1 New gene model Or110 LH16363 4912 223676-225988 - 5 386 - Multiple changes Or111 LH16359 4912 220465-222753 - 5 387 - Needs earlier start Or112 LH16361 4912 217437-219758 - 5 385 - First half of model Or113 LH16361 4912 214429-216498 - 5 394 - Second half of model Or114 LH16365 4912 211642-213719 - 5 396 1* Needs earlier start Or115 LH25604 4912 208861-210936 - 5 396 - Needs earlier start Or116 LH16368 4912 205263-207897 - 5 386 - Multiple changes Or117 LH21671 5011 29975-32006 - 4 370 - Multiple changes Or118 LH25955 5011 26858-29009 - 4 373 - Multiple changes Or119 LH25956 5011 23654-25896 - 4 374 - Multiple changes Or120FIX LH21668 5011 13777-15606 - 4 368 - Fix frameshift Or121 LH21670 5011 10319-12352 - 4 370 - Multiple changes Or122 LH21669 5011 7492-9358 - 4 368 - Multiple changes Or123FIX - 5011 4077-6550 - 4 379 - Fix assembly gap Or124 - 5011 695-2591 - 4 369 - New gene model Or125 - 2461 15-1902 + 4 362 - New gene model Or126 LH10129 2461 3173-5141 + 4 369 - First half of model Or127 LH10129 2461 6473-8227 + 4 370 - Second half of model Or128 - 2461 9407-11138 + 4 366 - New gene model Or129 - 2461 12144-14190 + 4 370 - New gene model Or130 - 2461 15241-17360 + 4 370 - New gene model Or131 - 2461 18430-20985 + 4 367 - New gene model Or132 - 2461 22133-24258 + 4 372 - New gene model Or133 - 2461 25587-27983 + 4 368 - New gene model Or134FIX - 2461 29445-31440 + 4 368 - Fix assembly gap Or135 - 2461 32441-34492 + 4 368 - New gene model Or136 - 2461 36463-38194 + 4 369 - New gene model Or137 LH18458 4949 134810-136258 + 4 384 - New gene model Or138 LH18459 4949 138197-141767 + 4 382 - Different C-terminus Or139 LH25728 4949 176458-178148 - 4 383 - Multiple changes

89
Or140FIX LH25730 4949 171052-175190 - 4 381 - Fix frameshift Or141 LH25730 4949 167683-169647 - 4 382 - Second half of model Or142 - 4949 163826-165836 - 4 382 - New gene model Or143 LH18464 4949 160306-162494 - 4 380 - Part of long model Or144 LH18464 4949 156408-158667 - 4 385 - Part of long model Or145 LH18464 4949 152289-154977 - 4 380 - Part of long model Or146 LH25711 4940 3541813-3545045 + 2 382 - Multiple changes Or147 LH25713 4940 3546152-3549378 + 2 398 - Needs C-terminus Or148PSE - 4940 3550363-3551822 + 2 367 - Pseudogene (12) Or149 LH25716 4940 3553310-3555054 + 3 402 - Different C-terminus Or150 LH18292 4940 3556356-3558239 + 2 396 - Different C-terminus Or151 - 4940 3559106-3561273 + 3 397 - New gene model Or152 LH25712 4940 3561859-3563873 + 3 396 - Multiple changes Or153 LH25717 4940 3565417-3567456 + 3 396 - Multiple changes Or154 LH25718 4940 3570241-3572758 + 3 396 - Multiple changes Or155 - 4940 3575226-3577207 + 3 396 - New gene model Or156 - 4940 3578108-3581091 + 2 391 - New gene model Or157 LH18291 4940 3583053-3585281 + 3 395 1* First half of model Or158 LH18291 4940 3586321-3588009 + 2 403 - Second half of model Or159 LH18288 4940 3588544-3591573 + 3 398 - Multiple changes Or160 LH18289 4940 3593820-3596738 + 3 391 - Internal exon missing Or161 LH25648 4926 2390040-2392769 + 3 392 - Multiple changes Or162 LH25649 4926 2393694-2395798 + 3 392 - Internal exon needed Or163 LH25651 4926 2396458-2398610 + 3 392 - Multiple changes Or164PSE - 4926 2400386-2402130 + 3 389 - Pseudogene (13) Or165 LH25644 4926 2402660-2404541 + 3 392 - Internal exon needed Or166PSE - 4926 2405109-2406946 + 3 318 - Pseudogene (5) Or167 LH25652 4926 2408094-2410470 + 3 396 - Part of long model Or168 LH25652 4926 2412430-2414567 + 3 397 - Part of long model Or169PSE LH25652 4926 2416771-2418631 + 3 378 - Pseudogene (2) Or170 LH25652 4926 2419700-2421337 + 3 392 - Part of long model Or171NP LH17512 4929 <935128-939745 + 6 390 - Pseudogene (3) Or172NTE LH17511 4929 <941424-943717 + 6 389 - Multiple changes Or173NTE LH11296 4452 <171937-174311 + 6 389 - First half of model Or174NTE LH11296 4452 <175936-177891 + 6 389 - Second half of model Or175NTE - 4452 <179243-181435 + 6 389 - New gene model Or176NTE - 4452 <182850-186350 + 6 391 - New gene model Or177NTE - 4452 <188590-191353 + 6 391 - New gene model Or178FN - 4452 <192805-195239 + 6 391 - Fix assembly gap Or179JFN - 4452 <197237->200640 + 6 391 - Join across two scaffolds; 4923 <1->1156 + 6 fix assembly gap Or180FN LH25636 4923 <4718-8245 + 6 391 - Fix frameshift Or181NTE LH25636 4923 <9989-12608 + 6 391 - Part of long model Or182NTE LH25636 4923 <14005-16496 + 6 388 - Part of long model Or183NTE LH25633 4923 <18307-20886 + 6 390 - Multiple changes Or184NTE - 4923 <22562-24957 + 6 389 - New gene model Or185NTE - 4923 <26035-28104 + 6 387 - New gene model Or186NTE - 4923 <29261-31275 + 6 387 - New gene model Or187FN - 4923 <32617-35067 + 6 388 - Fix frameshift Or188PSE - 4923 <35558-37114 + 5 297 - Pseudogene (5) Or189NP - 4923 <38213-40758 + 6 388 - Pseudogene (1) Or190PSE LH10470 4923 <41240-42762 + 5 297 - Pseudogene (5) Or191FN - 4923 <43902-46044 + 6 389 - Fix assembly gap Or192NTE - 4923 <48941-50970 + 6 390 - New gene model Or193NTE - 4923 <52302-54821 + 6 389 - New gene model Or194NTE LH25635 4923 <56088-58153 + 6 389 - First half of model Or195NTE LH25635 4923 <59550-61791 + 6 387 - Second half of model Or196NTE LH25637 4923 <62853-66150 + 6 387 - Multiple changes Or197FNC - 4923 <68391->70673 + 6 371 - Partially fix assembly gap Or198FN - 4923 <72508-75897 + 6 387 - Fix assembly gap Or199FN LH25634 4923 <78150-81002 + 6 388 - Fix assembly gap Or200NTE LH25632 4923 <82501-85235 + 6 387 - Multiple changes Or201NTE - 4923 <87449-90341 + 6 388 - New gene model Or202NTE LH16750 4923 <95442-98926 + 6 388 - Multiple changes Or203NTE LH13656 4923 <2419045-2421433 + 6 388 - Multiple changes Or204PSE - 4909 664407-667584 - 6 333 - Pseudogene (12)

90
Or205 LH23982 5070 27167-34800 - 5 387 - Fuse two gene models; LH23984 across a 5 kb intron Or206NTE LH19170 4964 320440-323154 + 6 384 - N-terminal exon unidentified Or207 LH19170 4964 325502-329195 + 6 389 - Part of long model Or208 LH19170 4964 330187-334399 + 6 393 - Part of long model Or209 LH22725 5033 101866-109632 + 7 399 1* Multiple changes Or210 LH23858 5066 863837-867843 + 5 438 - Fine as is Or211JOI LH20522 4989 <1-1197 - 4 401 - Join across two scaffolds; 4923 152493-153827 - assembly problem? Or212 LH12905 4653 737578-739768 - 5 402 - First half of model Or213 LH12905 4653 731987-734515 - 5 403 - Second half of model Or214 LH25733 4950 40394-42536 - 4 408 - Multiple changes Or215 LH23980 5070 76078-176164 - 5 376 - Needs a C-terminus Or216 LH18732 4956 20162-22703 - 5 379 - Multiple changes Or217FIX LH18727 4956 <25380-28349 + 6 373 - Fix assembly gap Or218 LH21199 5005 1587704-1592738 - 5 378 - Multiple changes Or219FIX - 5005 1579650-1584773 - 5 378 - Fix assembly gap Or220 LH11487 4465 9057-84984 + 5 380 - Multiple changes Or221IC LH23895 5068 <60692-107121 - 5 322 - Exons 3 and 6 missing Or222 LH19011 4958 263992-268751 - 5 372 - Fine as is Or223JOI LH15447 4861 4635->25360 + 5 370 - Join across three scaffolds; LH15442 4963 <1->33715 + awkward because implies 4843 93514->105292 - assembly problem in 4861 Or224 LH15148 4856 233563-236416 + 5 402 2 Fine as is Or225 LH24139 5073 44540-46128 - 4 387 - Fine as is Or226 LH11096 4431 80014-83806 + 4 388 - Needs a different C-terminus Or227 - 5018 2294078-2296134 - 5 386 - New gene model Or228 LH22142 5018 2287166-2288982 - 4 376 - First part of model Or229 LH22142 5018 2283805-2286406 - 5 384 - Second part of model Or230 LH22143 5018 2281480-2283208 - 5 380 - Multiple changes Or231 LH22141 5018 2277756-2280176 - 5 381 - Needs a N-terminus Or232 LH23776 5065 608871-611426 + 8 400 - Multiple changes Or233 LH23496 5057 215473-218709 + 8 389 - Multiple changes Or234 LH26046 5057 219045-221760 - 8 400 - Second part of model Or235 LH26046 5057 222750-225624 - 8 401 - First part of model Or236PSE - 5057 226670-229312 - 8 318 - Pseudogene (8) Or237PSE LH26038 5057 230035-232201 - 8 383 - Pseudogene (1) Or238 LH26038 5057 232736-235196 - 8 395 - First part of model Or239 - 5057 237949-240493 + 8 413 - New gene model Or240 LH23495 5057 244925-247502 + 8 415 - Multiple changes Or241 LH24047 5057 248687-251094 - 8 398 - Multiple changes Or242 LH26045 5057 252884-255224 - 8 400 - Second part of model Or243 LH26045 5057 256193-258665 - 8 403 - First part of model Or244 LH26048 5057 261164-263610 - 8 402 - Multiple changes Or245 LH23507 5057 268035-270962 + 8 407 - Part of long model Or246 LH23507 5057 271874-274568 + 8 408 - Part of long model Or247PSE LH23507 5057 277157-279514 + 8 415 - Pseudogene (2) Or248PSE LH23507 5057 280606-283007 + 8 404 - Pseudogene (1) Or249 LH23507 5057 283796-286444 + 8 398 - Part of long model Or250 - 5057 288418-290845 + 8 392 - New gene model Or251PSE LH26052 5057 291690-294483 + 8 411 - Pseudogene (3) Or252 - 5057 296590-299137 + 8 390 - New gene model Or253 LH23505 5057 301113-303729 + 8 388 - Multiple changes Or254FIX - 5057 305338-307469 + 8 398 - Fix two frameshifts Or255 - 5057 308634-311124 + 8 400 - New gene model Or256 LH23506 5057 313127-315644 + 8 397 - Multiple changes Or257 LH26051 5057 316253-318934 + 8 397 - Multiple changes Or258IP - 5057 320217-322372 + 8 361 - Pseudogene (3) with gap Or259 LH26050 5057 324472-326878 + 8 403 - Part of long model Or260FIX LH26050 5057 332210-334589 + 8 402 - Fix frameshift and stop Or261 LH26050 5057 336289-338710 + 8 403 - Part of long model Or262 LH23509 5057 339869-343193 - 8 395 - Multiple changes Or263 LH23511 5057 343991-346895 - 8 388 - Multiple changes Or264 - 5057 56423-59089 - 8 395 - New gene model Or265FPC - 5057 52757-54376 - 5 281 - Pseudogene (3); partial fix Or266FIX - 5057 46495-50025 - 8 390 1 Fix assembly gap

91
Or267 - 5057 37221-40640 - 8 386 - New gene model Or268 - 5057 32512-36018 - 8 390 - New gene model Or269 - 5057 27865-31313 - 8 390 - New gene model Or270JC - 5057 23590-26617 - 8 376 - Join across two scaffolds; 4638 7249-7787 + final exon still missing Or271 - 5057 13165-22039 - 8 392 - New gene model Or272 - 5057 8640-12102 - 8 390 - New gene model Or273 - 5057 3706-6628 - 8 391 - New gene model Or274FIX - 5057 <1-2515 - 8 392 1 Extend scaffold Or275 - 4662 1202-7933 - 8 391 - New gene model Or276FIX - 4929 1946592->1953169 - 8 393 - Extend scaffold Or277 - 4929 1941424-1944919 - 8 391 - New gene model Or278 - 4929 1936681-1939788 - 8 391 - New gene model Or279 - 4929 1931553-1935324 - 8 391 - New gene model Or280 - 4929 446258-449028 + 8 395 - New gene model Or281 - 5009 149207-151964 - 8 393 - New gene model Or282 - 5009 145337-148253 - 8 392 - New gene model Or283NTE - 5009 140198->142633 - 8 344 - First exon missing in gap Or284 - 5009 136062-138799 - 8 391 - New gene model Or285 - 5009 131750-135255 - 8 393 - New gene model Or286 - 5009 126818-129918 - 8 394 - New gene model Or287PSE - 5009 118037-121437 - 8 385 - Pseudogene (3) Or288FIX - 5009 112610-115680 - 8 395 - Fix frameshift Or289FIX - 5009 108623-111706 - 8 393 - Fix frameshift Or290FIX - 5009 104623-107823 - 8 393 - Fix frameshift Or291 - 5009 100326-103828 - 8 393 - New gene model Or292 - 5009 95481-99527 - 8 393 - New gene model Or293 - 5009 91624-94594 - 8 392 - New gene model Or294PSE - 5009 85329-89059 - 8 388 - Pseudogene (5) Or295PSE - 5009 82701-84535 - 6 254 - Pseudogene (2) Or296 - 5009 78929-81758 - 8 392 - New gene model Or297 - 5009 75500-78334 - 8 395 - New gene model Or298 - 5009 72059-74920 - 8 393 - New gene model Or299PSE - 5009 67244-70407 - 8 394 - Pseudogene (1) Or300 - 5009 62860-65850 - 8 393 - New gene model Or301 - 5009 55954-59354 - 8 389 - New gene model Or302 - 5009 47774-51801 - 8 391 - New gene model Or303FIX - 5009 40472-42833 - 8 392 - Fix assembly gap Or304 - 5009 36353-38951 - 8 393 - New gene model Or305 - 5009 32857-35268 - 8 395 - New gene model Or306 - 5009 29824-32239 - 8 396 - New gene model Or307 - 5009 26845-29211 - 8 396 - New gene model Or308 - 5009 23409-26247 - 8 394 - New gene model Or309 - 5009 16837-19690 - 8 394 - New gene model Or310 - 5009 10813-14257 - 8 391 - New gene model Or311 - 5009 7339-9966 - 8 394 - New gene model Or312 - 5009 3218-5985 - 8 390 - New gene model Or313 - 4834 802002-804791 + 8 392 - New gene model Or314 - 4834 805822-809087 + 8 385 - New gene model Or315 - 4834 809874-812579 + 8 390 - New gene model Or316 - 4834 813276-815887 + 8 394 - New gene model Or317 - 4834 817365-819805 + 8 393 - New gene model Or318 - 4834 824259-827620 + 8 393 - New gene model Or319 - 4834 829215-832227 + 8 392 1 New gene model Or320 - 4834 833252-835944 + 8 401 - New gene model Or321PSE - 4834 837085-840541 + 8 392 - Pseudogene (1) Or322 - 4834 845792-848693 + 8 400 - New gene model Or323 - 4834 852461-854980 + 8 387 - New gene model Or324 LH14860 4834 856325-859263 + 8 393 - Part of long model Or325 LH14860 4834 860022-863192 + 8 394 - Part of long model Or326 LH14860 4834 865887-868954 + 8 395 - Part of long model Or327 - 4834 871234-874432 + 8 392 - New gene model Or328 - 4834 875452-878103 + 8 391 - New gene model Or329 - 4834 879383-882352 + 8 393 - New gene model Or330 - 4834 883786-886665 + 8 392 - New gene model Or331 - 4834 888406-891218 + 8 394 - New gene model

92
Or332 - 4834 892015-894763 + 8 393 - New gene model Or333 - 4834 895693-898387 + 8 397 - New gene model Or334 - 4834 900226-902455 + 8 394 - New gene model Or335PSE - 4834 904449-906702 + 8 378 - Pseudogene (4) Or336 - 4834 907637-910019 + 8 398 - New gene model Or337 LH14219 4756 10772-13560 - 8 391 - Multiple changes Or338 LH22780 5036 13642-15694 - 8 395 - Multiple changes Or339FIX LH19029 4958 437869->443156 + 8 392 - Fix frameshift and gap Or340FIX - 4958 444610->446886 + 8 392 - Fix two assembly gaps Or341 LH19031 4958 451425-453999 + 8 391 - Multiple changes Or342 LH20416 4985 4586498-4588513 + 8 392 - Multiple changes Or343 LH24326 5077 127035-129001 + 8 391 - Multiple changes Or344PSE LH17565 4930 35250-37618 + 8 390 - Pseudogene (1) Or345 LH18671 4953 564223-566505 + 8 402 - First half of model Or346 LH18671 4953 567889-570720 + 8 402 - Second half of model Or347 LH18672 4953 571637-574299 + 8 399 - Multiple changes Or348 LH18673 4953 575619-578012 + 8 399 - Multiple changes Or349 LH18722 4956 29253-33422 + 8 396 - First part of large model Or350 LH26058 5065 721047-717277 - 8 394 - Multiple changes Or351FP - 4938 334243->336846 + 8 397 - Pseudogene (3) Or352FN - 4938 <337671-339474 + 8 344 - Fix gap; first exon missing Or353JP LH24060 4938 340465->342740 + 8 399 - Join across two scaffolds; 5071 1760818->1765287 - pseudogene (2) Or354 LH24060 5071 1757467-1759776 - 8 398 - Second half of model Or355 LH20606 4989 1352963-1355444 - 8 406 - Multiple changes Or356 LH20597 4989 1356329-1358794 + 8 403 - Multiple changes Or357 LH20607 4989 1362107-1364546 - 8 406 - Part of long model Or358 LH20607 4989 1368393-1370801 - 8 406 - Part of long model Or359PSE LH20607 4989 1380313-1382798 - 8 407 - Pseudogene (1) Or360FIX LH25885 4989 1383695-1386154 + 8 401 - Fix frameshift Or361 LH25885 4989 1387893-1390055 + 8 403 - Second part of model Or362FIX LH20614 4989 1391714-1394069 + 8 402 - Fix three frameshifts Or363 LH20614 4989 1395227-1398138 + 8 404 - Second part of model Or364FIX - 4989 1417400-1423818 + 8 402 - Fix two assembly gaps Or365 LH18177 4940 1935928-1938616 + 8 403 - First part of model Or366 LH18177 4940 1939585-1942816 + 8 402 - Second part of model Or367 LH10827 4321 201492-203583 - 8 371 - Multiple changes Ionotropic Receptors (IRs). We annotated 32 Ionotropic Receptors in L. humile (Table
S12). Phylogenetic tree of L. humile (blue), A. mellifera (green) and N. vitripennis (red)
iGluRs and IRs, as well as representative fruit fly (D. melanogaster, black) orthologs
(113). Two ant-specific expansions of IRs are highlighted with a blue vertical line.
Protein sequences were aligned with PROBCONS, and the tree was built with RaxML
under the WAG model of substitution with 1000 bootstrap replicates. Bootstrap values
for each branch are indicated on the tree. The scale bar represents the number of
substitutions per site. IR8a and IR25a have been proposed to derive from a non-NMDA
iGluR, but in this tree these IR clades group with NMDA receptors with low bootstrap
values, most likely due to the number of sequences analyzed.
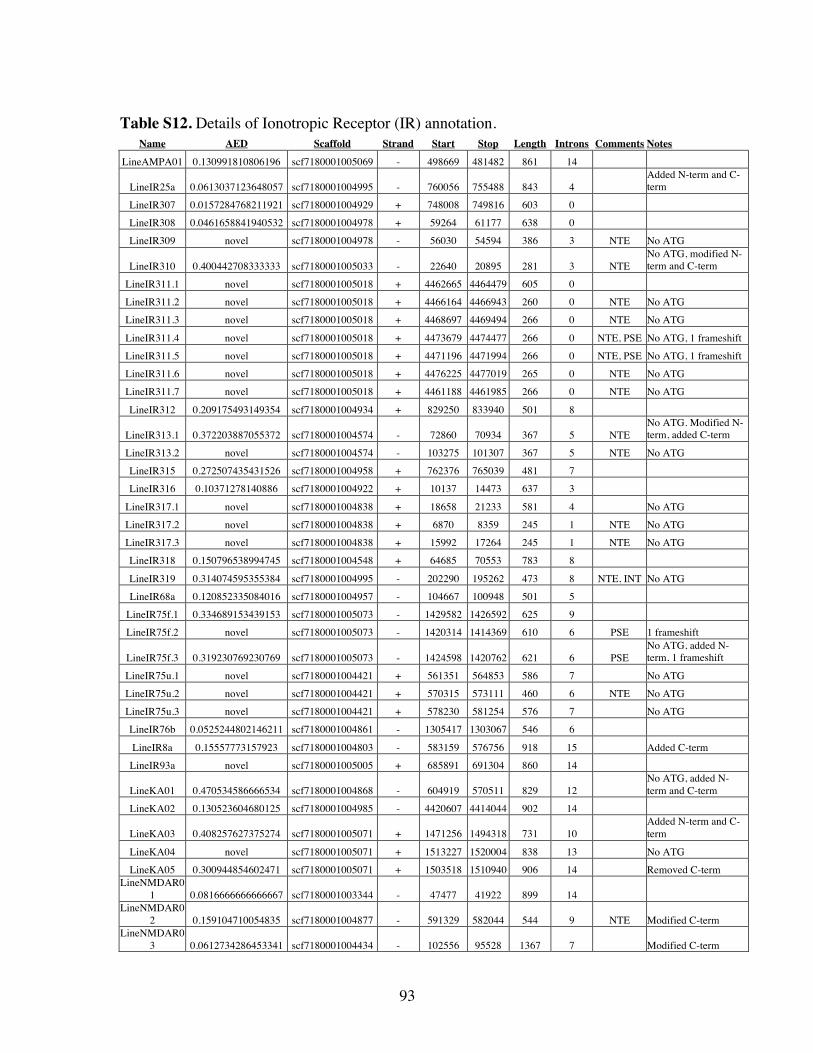
93
Table S12. Details of Ionotropic Receptor (IR) annotation.
Name AED Scaffold Strand Start Stop Length Introns Comments Notes LineAMPA01 0.130991810806196 scf7180001005069 - 498669 481482 861 14
LineIR25a 0.0613037123648057 scf7180001004995 - 760056 755488 843 4 Added N-term and C-term
LineIR307 0.0157284768211921 scf7180001004929 + 748008 749816 603 0
LineIR308 0.0461658841940532 scf7180001004978 + 59264 61177 638 0
LineIR309 novel scf7180001004978 - 56030 54594 386 3 NTE No ATG
LineIR310 0.400442708333333 scf7180001005033 - 22640 20895 281 3 NTE No ATG, modified N-term and C-term
LineIR311.1 novel scf7180001005018 + 4462665 4464479 605 0
LineIR311.2 novel scf7180001005018 + 4466164 4466943 260 0 NTE No ATG
LineIR311.3 novel scf7180001005018 + 4468697 4469494 266 0 NTE No ATG
LineIR311.4 novel scf7180001005018 + 4473679 4474477 266 0 NTE, PSE No ATG, 1 frameshift
LineIR311.5 novel scf7180001005018 + 4471196 4471994 266 0 NTE, PSE No ATG, 1 frameshift
LineIR311.6 novel scf7180001005018 + 4476225 4477019 265 0 NTE No ATG
LineIR311.7 novel scf7180001005018 + 4461188 4461985 266 0 NTE No ATG
LineIR312 0.209175493149354 scf7180001004934 + 829250 833940 501 8
LineIR313.1 0.372203887055372 scf7180001004574 - 72860 70934 367 5 NTE No ATG. Modified N-term, added C-term
LineIR313.2 novel scf7180001004574 - 103275 101307 367 5 NTE No ATG
LineIR315 0.272507435431526 scf7180001004958 + 762376 765039 481 7
LineIR316 0.10371278140886 scf7180001004922 + 10137 14473 637 3
LineIR317.1 novel scf7180001004838 + 18658 21233 581 4 No ATG
LineIR317.2 novel scf7180001004838 + 6870 8359 245 1 NTE No ATG
LineIR317.3 novel scf7180001004838 + 15992 17264 245 1 NTE No ATG
LineIR318 0.150796538994745 scf7180001004548 + 64685 70553 783 8
LineIR319 0.314074595355384 scf7180001004995 - 202290 195262 473 8 NTE, INT No ATG
LineIR68a 0.120852335084016 scf7180001004957 - 104667 100948 501 5
LineIR75f.1 0.334689153439153 scf7180001005073 - 1429582 1426592 625 9
LineIR75f.2 novel scf7180001005073 - 1420314 1414369 610 6 PSE 1 frameshift
LineIR75f.3 0.319230769230769 scf7180001005073 - 1424598 1420762 621 6 PSE No ATG, added N-term, 1 frameshift
LineIR75u.1 novel scf7180001004421 + 561351 564853 586 7 No ATG
LineIR75u.2 novel scf7180001004421 + 570315 573111 460 6 NTE No ATG
LineIR75u.3 novel scf7180001004421 + 578230 581254 576 7 No ATG
LineIR76b 0.0525244802146211 scf7180001004861 - 1305417 1303067 546 6
LineIR8a 0.15557773157923 scf7180001004803 - 583159 576756 918 15 Added C-term
LineIR93a novel scf7180001005005 + 685891 691304 860 14
LineKA01 0.470534586666534 scf7180001004868 - 604919 570511 829 12 No ATG, added N-term and C-term
LineKA02 0.130523604680125 scf7180001004985 - 4420607 4414044 902 14
LineKA03 0.408257627375274 scf7180001005071 + 1471256 1494318 731 10 Added N-term and C-term
LineKA04 novel scf7180001005071 + 1513227 1520004 838 13 No ATG
LineKA05 0.300944854602471 scf7180001005071 + 1503518 1510940 906 14 Removed C-term LineNMDAR0
1 0.0816666666666667 scf7180001003344 - 47477 41922 899 14 LineNMDAR0
2 0.159104710054835 scf7180001004877 - 591329 582044 544 9 NTE Modified C-term LineNMDAR0
3 0.0612734286453341 scf7180001004434 - 102556 95528 1367 7 Modified C-term

94
IRs 32 NTE Missing N-terminal end AMPA 1 CTE Missing C-terminal end NMDA 3 INT Internal gap Kainate 5 PSE Pseudogene TOTAL 41
Delta-9 Desaturase Genes An intricate system of communication is a distinct feature of social insects, indeed all
social animals exhibit complex communicative behaviors through a variety methods and
mediums. In social insects, colony recognition is an essential aspect of communication,
which allows individuals to distinguish colony members from non-members in order to
deter foreigners from entering another nest (73, 114, 115). In L. humile and other ant
species, there is abundant evidence that colony recognition cues are largely based on
cuticular hydrocarbons (CHC) (116-118). CHCs are produced by the queen and workers
and can be influenced by the environment, resulting in a Gestalt odor for the colony
(119).
Approximately 1,000 CHC compounds have been described in the 78 species of
ants studied (120). Studies of CHC components in D. melanogaster show that
carboxylases, elongases and desaturases each influence CHC biosynthesis (121). The
desaturases (desat1, desat2, and desatF (syn. Fad2)), which are the best studied among
these, insert carbon-carbon double bonds into n-alkanes to form monoenes and dienes
(122, 123). These three desaturase genes have been shown to contribute to CHC alkene
variability in Drosophila and affect mate recognition behavior (124). In L. humile, queens
and workers produce variable amounts of four CHC alkenes (125), thus making the three
desaturase genes, D. melanogaster desat1, desat2, and desatF, choice genome query
candidates for determining genes for L. humile alkene synthesis.

95
Figure S15. Summary of desaturase gene annotations. Arrangement of the sixteen ∆9 desaturase genes and seventeen partial/fragmentary ∆9 desaturase genes found in L. humile, which are dispersed among fifteen scaffolds of the genome (a.i-xv). The seven ∆9 desaturase genes of D. melanogaster are also distributed across multiple regions, but are situated on one chromosome (b). Note the D. melanogaster chromosome is drawn to a different scale. Predicted genes are indicated by boxes with points representing direction of transcription and span of the genome, and are color coded according to the size of the gene model based on amino acid sequence length found. Asterisks next to L. humile gene names signify genes with EST evidence.
For all three D.
melanogaster desat1, desat2,
and desatF query genes, we
found the same thirty-three
predicted desaturase
genes/partial genes (Main
Text, Figs. 3D and S15).
These thirty-three ∆9
desaturase genes were
distributed across fifteen
scaffold regions, with no
more than four predicted
genes grouping in one
scaffold (Fig. S15). This
arrangement appears to be
somewhat similar to the
distribution of the seven ∆9
desaturase genes in D.
melanogaster, although in D.
melanogaster they are all grouped on the third chromosome (Fig. S15). Reciprocal
BLAST analyses of the L. humile ∆9 desaturase genes against D. melanogaster found
that eleven were most similar to the D. melanogaster desat1 gene, twenty to the D.
melanogaster gene CG9747, one to the D. melanogaster gene CG9743, one to the D.

96
melanogaster gene CG15531, and none were found to be most similar to D.
melanogaster desat2, desatF or CG8630.
To better elucidate the relationships between the desaturase genes of L. humile
and several other insects, we performed a phylogenetic analysis using most of the ∆9
desaturase genes found in L. humile and six other insect taxa with completed genome
sequences. Because of the relatively small size of the nine fragmentary fragmentary ∆9
genes in L. humile, these genes, as well as two partial A. mellifera desaturase genes, one
similar to CG15531 and another to CG8630, were excluded from the analysis. Given this,
the amino acid sequences of 85 homologous genes were aligned using the L-INS-i
algorithm implemented in MAFFT v6 (12). Gblocks (126) was then used with low
stringency parameter settings in order to eliminate positions that were poorly aligned.
This resulted in a final trimmed dataset comprising 227 amino acid positions. CpREV+G,
was found to be the best evolutionary model for the dataset as determined by ProtTest
(127) according to the Akaike Information Criterion corrected for small sample size (we
did not consider the LG model since it is not implemented in the phylogenetic software
used). According to the best model, a maximum likelihood tree was reconstructed using
RAxML v7.0.4 (128), and nodal support values were obtained by a 500-replicate rapid
bootstrap analysis (BS).
Our phylogenetic analysis shows the existence of five major clades within the
gene family of Δ9 desaturases in insects (Fig. 3D). Two clades, clade D and clade E, are
each strongly supported (BS=100) and are comprised of single-copy genes, although
losses appear to have occurred in some lineages. Clade C, moderately supported (BS =
72), is distinguished by a gene expansion in N. vitripennis, but is absent in the aculeates,

97
L. humile and A. mellifera. Furthermore, since the respective gene is also missing in D.
melanogaster, reciprocal BLAST searches based on this taxon incorrectly identify
members of this clade as orthologs of various other D. melanogaster genes, which shows
that this method alone can be misleading when evaluating homology relations. In clade
B, all CG9747 desaturases form a well-supported (BS = 98) monophyletic group, which
shows several gene expansion events in L. humile and N. vitripennis, and seem to have
occurred both before and after the split of these lineages. Notably, A. mellifera genes are
not found in this clade. The remainder of the Δ9 desaturases are represented in clade A, a
large and weakly supported (BS=50) group that is reduced in internal resolution and
contains multiple genes in all represented taxa. However, it appears to be split into two
sub-clades that include D. melanogaster CG8630 and desatF on the one hand, and desat1
and desat2 on the other. Homology relations between L. humile and D. melanogaster
CG8630 and desatF cannot be identified reliably, and with the exception of two A. pisum
and one T. castaneum gene, all other genes that are more closely related to CG8630
according to the phylogenetic reconstruction are deemed orthologous to desat1 according
to the best reciprocal BLAST criterion. For four L. humile genes this inconsistency also
applies. Finally, two L. humile genes, Lhum_desat1_a and Lhum_desat1_b, can be
considered orthologs of the D. melanogaster desat1 according to both the phylogenetic
and reciprocal BLAST analysis, and would be excellent candidate genes for experimental
study of L. humile CHC alkenes.

98
Cytochrome P450s
We deduced P450 amino acid sequences for N. vitripennis, A. mellifera, D. melanogaster,
and T. castaneum (http://drnelson.utmem.edu/CytochromeP450.html) and aligned the
with L. humile P450s using CLUSTALW Version 2.0.10 (129) after removal of
pseudogenes and sequences less than 50% complete. A neighbor joining tree was created
using PHYLIP (Version 3.68) with 100 bootstrap replicates (Fig S13). Distances were
corrected for multiple substitutions using TREE-PUZZLE Version 5.2 with the
BLOSUM62 matrix as the model of substitution (107).
Figure S13. Neighbor-joining tree with four P450 clades highlighted and rooted with P450cam from Pseudomonas putida. All putatively functional P450 genes from L. humile (Lh, blue), N. vitripennis (Nv), A. mellifera (Am), T. castaneum (Tc), and D. melanogaster (Dm) are included as well as CYP3A4 and CYP2J2 from Homo sapiens (Hs). Species-specific gene radiations were collapsed into triangles with the number of P450s and family name listed. Nodes with greater than 50% support in 100 bootstrap replications is indicated (*).

99
Hox genes Hox genes are homeodomain-containing transcription factors, very conserved in
sequence and expression across arthropods and other animals (130). They play an
important role in cell-fate determination and embryonic development, have been
identified in all bilateral animal phyla examined to date and are known to determine the
positional specification of the anterior-posterior axis (131). Mutations in Hox genes lead
to transformations in body-segments and organ identities along this axis and are known
as homeotic mutations. This homeotic capability is conserved among arthropods and
vertebrates, which diverged more than 600 million years ago (131).
It is speculated that the Early Cambrian ancestor of present-day arthropod groups
had a complex containing ten Hox genes (130), which are expressed in Hox-like patterns
in chelicerates and myriapods. In the insects, however, homologs of Hox3 (zerknullt –zen,
zerknullt2 – zen2, bicoid – bcd) and of Hox6 (fushi tarazu – ftz) do not play a Hox-like
role in determining segmental identity.
Hox genes are found in single clusters in a number of invertebrates including
amphioxus, sea urchins, and several insects such as mosquitoes, beetles and locusts. In D.
melanogaster, the cluster is divided in two sections. The Antennapedia Complex (ANT-
C) contains genes required for the development of the mouth, head and thoracic segments
– labial (lab), proboscipedia (pb), deformed (dfd), Sex combs reduced (Scr), and
Antennapedia (Antp) –, and the genes in the Ultrabithorax Complex (BX-C),
Ultrabithorax (Ubx), Abdominal-A (abd-A), and Abdominal-B (abd-B), are responsible
for the development of the fly’s abdomen and telson. These portions are separated by
approximately 7.5Mb, and the split is thought to be fairly recent in origin. In addition to

100
Figure S18. L. humile HOX genes, compared to D. melanogaster, and A. mellifera. L. humile HOX genes, compared to D. melanogaster, and A. mellifera. Figure modeled after Dearden et al (2006). The complex spans approximately 0.8Mb (ruler for intergenic distances is not drawn to scale). *The sequence of the L. humile Hox cluster is split across scaffolds 7180001004429 and 7180001004972.
the eight genes with traditional Hox-like function, zen, zen2, bcd and ftz, the D.
melanogaster cluster also inlcudes eight cuticle genes, five lysine tRNA genes, and
amalgam (Ama, member of the immunoglobulin superfamily). All other insect genomes
studied to date, e.g: Anopheles gambiae, T. castaneum, A. mellifera and N. vitripennis,
have a contiguous cluster of Hox genes.
The L. humile genome has one single gene associated with each of the ten Hox
groups of orthology mentioned above, constituting a single Hox cluster in which all
transcription occurs in the same direction (Fig. S18; Table S2). The cluster is found in
two separate scaffolds (7180001004429 and 7180001004972) of the current assembly.
Because of this, it is difficult to assess whether the cluster has been divided in two
complexes as it occurs in D. melanogaster, or remains a compact cluster of genes. Given
that Hox genes are arranged in compact, single clusters in all other hymenopteran
genomes studied to date (132) it is possible to assume that the L. humile cluster is also
found as a single, compact group of genes. Further analyses are necessary to test this

101
assumption.
We identified two microRNAs within the L. humile Hox cluster (Fig. S18). miR-
iab-4 is located in a conserved position compared to A. mellifera and D. melanogaster
(132). The location of miR-993 is conserved relative to A. mellifera and N. vitripennis
(42) and has not been identified in other Arthropod Hox clusters. A third miRNA
conserved throughout currently sequenced Hymenoptera, mir-10 (42, 132) was not found
within the L. humile cluster. This could be due to he fact that the current sequence
assembly split the cluster in two different scaffolds in the area comprised between genes
dfd and Scr, where mir-10 is located in other insects where it has been described. No
additional gene models were identified within the L. humile Hox cluster.The partition of
the cluster onto two scaffolds also affects the estimated total size of the cluster. The
distance from Scr to the end of scf7180001004429 is approximately 44Kb, and the
distance from dfd to the end of scf7180001004972 is approx. 24Kb. Thus, the estimated
distance between the two genes according to the current assembly is about 68Kb. We
then estimate the total size of the L. humile cluster at approximately 0.8Mb, which is
comparable to that of D. melanogaster and T. castaneum (approx. 0.7Mb), and about half
the size of the clusters in the other two hymenopterans sequenced to date (1.68Mb for N.
vitripennis and 1.37 Mb in A. mellifera). Intergenic distances are comparatively smaller
than those of N. vitripennis and A. mellifera (132).
Immune response
Insect humoral immune responses include several signaling pathways that produce
effector proteins for the elimination infectious microbes. Genome-wide characterization
of insect immune genes has indicated that these pathways are conserved in most insects,

102
and differences between genomes stem from differences in gene family sizes (Table
S16). For example, the honeybee and Nasonia have significantly fewer immune genes
than D. melanogaster and Anopheles gambiae (42, 133-135). In honeybees this finding
contrasts with the expectations since the characteristics of sociality (e.g. living in colonies
and cooperation) presumably expose them to increased pathogen transmission. However,
honeybees also have multitude of social defenses (136) and these may play a more
important role than the innate immune responses (133).
Table S16. L. humile immune genes. Apis-blast
Droso-blast
Nasonia-blast
Other copies ANNOTATED NOTE
Flybase ID/Apis ID
Gene name in Drosophila/Apis Symbol
1 lhum_18w GB15177 18-wheeler 18-w 1 lhum_armi FBgn0041164 armitage armi 1 lhum_Ago2 Argonaute-2
1 lhum_aub FBgn0000146 aubergine aub
1 lhum_Atg5 Fbgn0029943 Autophagy-specific gene 5 Atg5
1 lhum_Atg7 FBgn0034366 Autophagy-specific gene 7 Atg7
1 lhum_Atg12 Fbgn0036255 Autophagy-specific gene 12 Atg12
1 lhum_cactin Fbgn0031114 cactin cactin
1 lhum_cact1a CG:02184972 GB10655 NF-kappa-B inhibitor cactus 1 cact1a
1 lhum_cact1b CG:02184980 GB10655 NF-kappa-B inhibitor cactus 1 cact1b
1 lhum_casp Fbgn0034068 caspar casp 1 lhum_Dcr-2 Fbgn0034246 Dicer-2 Dcr-2
1 lhum_dredd Fbgn0020381
death related ced-3/Nedd2-like protein Dredd
1 lhum_def Fbgn0010385 defensin Def 1 lhum_dome FBgn0043903 domeless dome
1 lhum_dl Fbgn0260632 dorsal dl 1 lhum_Duox FBgn0031464 dual oxidase Duox 1 lhum_egr Fbgn0033483 eiger egr 1 lhum_FADD FBgn0038928 FADD FADD
1 lhum_galectin1 GB10026 Galectin 1 galectin1 1 lhum_galectin2 GB18324 Galectin 2 galectin2 1 lhum_galectin CG11372 Galectin galectin
1 lhum_GNBP1-1 CG:02183786,
Fbgn0040323, GB19961
Gram-negative bacteria-binding protein 1 GNBP1-1
1
lhum_GNBP1-2_like1
shorter than others; no functional domain; still has EST support.
Fbgn0040323, GB19961
Gram-negative bacteria-binding protein 1-2
GNBP1-2_like1
1 lhum_GNBP1-2 CG:02183974
Fbgn0040323, GB19961
Gram-negative bacteria-binding protein 1-2 GNBP1-2
1 lhum_GNBP1- shorter than Fbgn0040323, Gram-negative GNBP1-

103
2_like2 others; no functional domain; still has EST support.
GB19961 bacteria-binding protein 1-2
2_like2
1 lhum_Hisnavicin-3 XP_001607730 Hisnavicin-3 Hisnavicin-3
1 lhum_hop Fbgn0004864 hopscotch hop
1 lhum_hymenoptaecin GB17538-PA
hymenoptaecin preproprotein LOC406142
1 lhum_imd FBgn0013983 immune deficiency imd
1 lhum_Iap2 Fbgn0015247 inhibitor of apoptosis 2 Iap2
1 lhum_IKKgamma
poor blast match GB17106-PA
inhibitor of kappaB kinase gamma IKKgamma
1 lhum_bsk GB16401-PA JNK MAP kinase basket bsk
1 lhum_Jra GB12004-PA Jun-related antigen Jra 1 lhum_kay Fbgn0001297 kayak kay 1 lhum_Lys-3 GB19988-PA Lysozyme 3 Lys-3 1 lhum_Lys-2 GB15106 Lysozyme-2 Lys-2
1
lhum_MyD88 CG:02184700 GB12344-PA
myeloid differentiation primary response factor 88 Myd88
1 lhum_Rel GB13742-PA
NF-kappaB transcription factor relish Rel
1 lhum_Naickin-1 XP_001600083 Naickin-1 Naickin-1 1 lhum_Naickin-2a XP_001599718 Naickin-2 Naickin-2a 1 lhum_Naickin-2b XP_001599718 Naickin-2 Naickin-2b
1 lhum_NimA GB12883-PA nimrod A NimA
1 lhum_Atg7 FBgn0034366 Autophagy-specific gene 7 Atg7
1 lhum_NimC GB14645-PA nimrod C1 NimC1
1 lhum_NOS GB18010-PA nitric oxide synthase NOS
1 lhum_Pli Fbgn0025574 Pellino Pli
1 lhum_PGRP-LC GB17188-PA
Peptidoglycan recognition protein LC PGRP-LC
1 lhum_PGRP-S2a GB19301
peptidoglycan recognition protein S2 PGRP-S2a
1 lhum_PGRP-S2b GB19301
peptidoglycan recognition protein S2 PGRP-S2b
1 lhum_PGRP-S1 GB15371
peptidoglycan recognition protein S1 PGRP-S1
1 lhum_PGRP-LC_like GB17188-PA
peptidoglycan-recognition protein LC
PGRP-LC_like
1 lhum_PGRP-SA GB17879-PA
peptidoglycan-recognition protein SA PGRP-SA
1 lhum_PPO GB18313-PA prophenoloxidase PPO
1 lhum_Rpn3 GB12827-PA regulatory particle non-ATPase 3 Rpn3
1 lhum_SCR-B10 GB19683 scavenger receptor class B, type 10 SCR-B10
1 lhum_SCR-B2 GB11743-PA scavenger receptor class B, type 2 SCR-B2
1 lhum_SCR-B5 GB13813-PA scavenger receptor class B, type 5 SCR-B5
1 lhum_SCR-B9 GB19916 scavenger receptor class B, type 9 SCR-B9
1 lhum_SCR-C Missing 5’ GB19925-PA scavenger receptor SCR-C

104
end class C 1 lhum_SP14 GB14044-PA serine protease 14 SP14 1 lhum_SP1b GB16147 serine protease 1 SP1 1 lhum_SP1a GB16147 serine protease 1 SP1
1 lhum_SP2 GB14247 serine protease 2 SP2 1 lhum_SP30 GB19649-PA serine protease 30 SP30 1 lhum_SP46 GB16367-PA serine protease 46 SP46 1 lhum_SP49 GB15317-PA serine protease 49 SP49
1 lhum_Serpin-1 GB17012-PA serine protease inhibitor 1 serpin-1
1 lhum_Serpin-3 GB30307-PA serine protease inhibitor 3 Serpin-3
1 lhum_Serpin-5 GB19582-PA serine protease inhibitor 5 serpin-5
1 lhum_Serpin-4 FBgn0028985 serine protease inhibitor 4 serpin-4
1 lhum_pll GB16397-PA serine/threonine-protein kinase pelle pll
1
lhum_Stat92E Fbgn0016917
Signal-transducer and activator of transcription protein at 92E Stat92E
1 lhum_spz1 Fbgn0003495 Spatzle 1 spz1 lhum_spz2 Fbgn0261526 Spatzle 2 spz2 lhum_spz4 FBgn0032362 Spatzle 4 spz4 lhum_spz5 Fbgn0035379 Spatzle 5 spz5 lhum_spz6 Fbgn0035056 Spatzle 6 spz6
1 lhum_Tab2 FBgn0086358 Tak1-associated binding protein 2 Tab2
1 lhum_Tak1 GB14664 TGF-beta activated kinase 1 Tak1
1 lhum_TepIII Fbgn0041181 thiolester containing protein III TepIII
1 lhum_TEP7 GB12605-PA thiolester-containing protein 7 TEP7
1 lhum_TEPA GB18789-PA
thiolester-containing protein A TEPA
1 lhum_Traf6 GB10539-PA TNF-receptor-associated factor 6 Traf6
1 lhum_Traf1 GB10394 TNF-receptor-associated factor 1 Traf1
1 lhum_Toll-1a GB18520 toll like receptor 1 Toll-1a 1 lhum_Toll-1b GB18520 toll like receptor 1 Toll-1b
1 lhum_Toll-1_like1 no start codon GB18520 toll like receptor 1 Toll-1_like1
1 lhum_Toll-1_like2 GB18520 toll like receptor 1 Toll-1_like2
1 lhum_Toll-1d GB18520 toll like receptor 1 Toll-1d 1 lhum_Toll-10 GB16299 toll like receptor 10 Toll-10 1 lhum_Toll-6 GB17781 toll like receptor 6 Toll-6 1 lhum_Toll-8 GB10640-PA toll like receptor 8 Toll-8 1 lhum_tub Fbgn0003882 tube tub
67 8 4 11 lhum_GNBP Pseudogene? lhum_Toll-1 Pseudogene?
Opsins Opsins are transmembrane, G-protein coupled receptors that, when coupled with a
chromophore, form visual pigments. In insects, the number of opsin genes varies from

105
two, in Tribolium, to seven, in D. melanogaster, and in some cases the number of opsins
has evolved in tandem with distinctive wing coloration. Although Argentine ants are less
visually-oriented foragers than honeybees, they have still retained the same four visual
opsins that are present in the honeybee genome: ultraviolet, blue, long wavelength opsin
1 and long wavelength opsin 2 (Table S2). The Argentine ant genome also contains a
pteropsin-like non-visual opsin, as has been reported for A. mellifera.
Behavior The unusual unicolonial social structure of introduced Argentine ant populations has
made them an attractive model system for studies of colonymate recognition and social
behaviors. We manually annotated >75 genes associated with important behaviors that
are related to Argentine ant sociality, including genes implicated in learning, memory,
aggression, and circadian cycles. The ability to distinguish between colonymates and ants
from foreign colonies requires the production of colony-specific labels, the ability to
recognize these labels, and elements of learning and memory.
Learning and memory. Many animals possess the ability to gain and process information
about the environment (learning) and store and retrieve information over time (memory).
Insects, in particular, often rely on olfaction for a variety of behaviors such as foraging,
mating, and predator avoidance (137-139). Candidate genes implicated in learning and
memory have been most well studied in Drosophila, and this functional group includes a
diverse array of genes, including some involved in neurotransmitter production (140-
142), cell adhesion molecules (143, 144), cAMP signaling cascade molecules (145, 146),
CaMKII proteins (147-149), and RNA transport and translation molecules (150).

106
Drosophila melanogaster and A. mellifera have been well studied in the last four
decades, becoming widely used models for studying olfactory learning and memory. The
learning and memory functional group is composed genes that when absent or altered are
known to affect learning and memory.
Most of the insect genes that have been implicated in olfactory learning and
memory have been described and studied in D. melanogaster. We selected genes for
annotation based on the gene ontology terms "learning or memory" in D. melanogaster.
We found 106 genes, investigated the 69 genes with annotation records in other species,
and manually annotated the 59 found in Argentine ants (Table S2). Only two of these
genes were found in L. humile, but not N. vitripennis or A. mellifera. Social insects, like
L. humile, rely heavily on olfactory learning and memory for activities such as nest mate
recognition. This data set will provide a rich resource for further studies in learning and
memory within ant species.
Aggression. As with most ants, nestmate recognition in Argentine ants has often been
studied by examining the behavior of workers towards non-colonymates (151-153).
Aggression involves the direct action, interaction and regulation of several genes that
results in a complex behavioral phenotype.
Several studies on the genetics of aggression in mammals and invertebrates have
focused on bioamines, major chemical substances involved in the neurobiology of
animals that appear to have clear effects on the aggression (154, 155). However, recent
studies in D. melanogaster suggest that genes involved in basic biological and molecular
functions also play a role in aggression (156-158). These include genes involved in

107
processes such as cell communication, metabolic processes and electron transport. While
the role of these genes in aggression have been discovered in the context of intraspecific
male aggression in D. melanogaster, similar gene categories have also been implicated in
the honey bee colony defense (159). Moreover, some of the genes involved in aggressive
behavior in fruit flies appear to have evolutionary conserved orthologous also found in
humans (160).
Animals display both intraspecific and interspecific aggression in a variety of
different contexts. Aggression is particularly common in ants, often because colonies
must defend local resources from neighboring ant colonies. We identified five genes in L.
humile that are similar to those associated with interspecific male aggression in D.
melanogaster including ade5, eclair, echinoid, no occelli, and sugarless (Table S2). The
ontology of these genes varies from cell communication and intracellular protein
transport to sensory organ development. Additionally, all five of these genes appear to
have pleiotropic effects on other male D. melanogaster phenotypes including number of
sensory bristles, sleep patterns, and starvation stress resistance (158). All five aggression
genes in L. humile had significant matches to A. mellifera indicating possible orthology
while only two such gene similarities were found in N. vitripennis.
Circadian rhythms. In insects, daily cycles of activity are controlled by one of three
different transcriptional regulation systems: those governed by the expression of
cryptochrome 1 (cry1), those driven by the expression of cryptochrome 2 (cry2), and
those in which both cry1 and cry2 are present. Butterflies and mosquitoes possess both
cry1and cry2; Drosophila only has cry1. Unlike many other insects, L. humile does not

108
Figure S14. Major royal jelly protein genes in the three Hymenoptera with sequenced genomes, L. humile (green), N. vitripennis (blue), and A. mellifera (red).
exhibit a strong daily activity pattern. Instead, workers typically forage during both the
day and night, often along enormous foraging trails. Argentine ants, like Apis and
Tribolium, do not possess a copy of the cry1 gene (Table S2).
Model for human disease. Insect models, particularly D. melanogaster, have been
invaluable systems for studies of human processes and diseases. Recent studies suggest
that social insects may also prove to be useful for as model systems for some human
diseases. A. mellifera, for example, exibits a behavioral response to cocaine that is similar
to that of humans (161), raising the intriguing possibility that ant genomes could be also
be a useful invertebrate models of
human behavioral diseases. Indeed, our
KEGG and OrthoMCL analysis of the
L. humile genome identified over 1400
genes involved in over 30 pathways
implicated in human diseases ranging
from diabetes, to multiple cancers, to
neurological disorders such as
Alzheimer’s, Parkinson’s disease, and
William’s Beuren Syndrome (Table
S5).
Yellow/Major royal jelly proteins To identify and retrieve genes
belonging to the yellow and major

109
royal jelly protein (MRJP) gene family in L. humile, we employed a standardized BLAST
strategy. The members of the focal gene family in D. melanogaster were selected from
FlyBase (http://flybase.org) and served as reference genes; in the case of the major royal
jelly protein and major royal jelly protein-like genes, reference sequences were retrieved
from the A. mellifera and N. vitripennis assemblies of the Hymenopteran Genome
Database (http://genomes.arc.georgetown.edu/drupal/). The BLAST package (133) was
then used to identify regions and gene models from the L. humile OGS v1.1 produced by
MAKER.
To understand the evolutionary history and homology relations of
the yellow/MRJP gene family in the Argentine ant, we performed two phylogenetic
analyses: The first analysis included all yellow and MRJP genes of the focal taxa
mentioned above and Tribolium castaneum. The amino acid sequences of these 94 genes
were aligned with MAFFT v6 and the L-INS-i algorithm (30). Positions that were aligned
ambiguously were removed using Gblocks (96) with low stringency parameters. This
resulted in a final dataset containing 169 amino acid positions. The evolutionary model
with the best fit to this dataset, LG+G, was determined by ProtTest (97) according to the
Akaike Information Criterion corrected for small sample size. Based on this model, a
maximum likelihood tree was reconstructed using RAxML version 7.2.6 (98). Nodal
support values were obtained by the rapid bootstrap algorithm as implemented in
RAxML (500 replicates). A yellow gene from the bacterium Dienococus
radiodurans was used as the outgroup for the analysis.
The maximum likelihood tree of this analysis reveals six clades, here
termed yellow g and g2, yellow x1, yellow core group (b/c/f/h/y), yellow e, yellow

110
e3/x2 and MRJP (includes MRJP-like) (Fig. 3 C). Several of these clades provide strong
support for orthologous relationships between L. humile genes and those of similarly
named genes from the other four focal taxa (see clades yellow g and g2, x1, e,
and e3/x2, Fig. 3C). The yellow core group (named because it contains the originally
described yellow-y of D. melanogaster) contains well-supported yellow b and y groups
but the relationships of the yellow-h, -c, and -f genes are less resolved in this analysis.
The second analysis focused exclusively on the 29 members of the MRJP gene
subfamily retrieved from the hymenopteran taxa, as well as 3 hymenopteran yellow-
e3 genes which comprised the outgroup (Fig. S14). Except for the alignment algorithm,
which was E-INS-i, the same methods were used as described above. After removing
ambiguously aligned positions, the dataset encompassed 284 positions, which indicates
that a larger amount of informative sites were retained due to decreased sequence
diversity in the dataset. Consequently, higher confidence values support this tree, which
is topologically identical to the comprehensive tree with respect to the MRJP gene
subfamily. The topology strongly indicates that the radiation of the MRJP genes in each
taxon took place after the evolutionary split of their respective lineages (see main text).
Except for the production of royal jelly in Apis, the functions of these genes are unknown
but may share similarities between Nasonia, Apis and L. humile and may have evolved in
response to similar selective pressures.
Insulin signaling The insulin signaling pathway is highly conserved among animals and is a major
regulator of growth, reproduction, and aging (162). In A. mellifera, it is also known to be
involved in developmental differentiation of the queen and worker castes (163-167).
111
Appropriate allocation of carbohydrates to lipids is an important process in social insects
as stored lipids are a stored “communal resource” that can be tapped into if incoming
food supplies decrease (168). Ants with high carbohydrate intake, such as those feeding
on homopteran honeydew, may face challenges in coping with such high carbohydrate
intake. Interestingly, introduced populations of L. humile commonly tend Homoptera,
and thus occupy a lower trophic position than the more carnivorous populations in the
native range (169), suggesting that there may be associated differences in insulin
signaling between the two ranges.
We annotated a complete and apparently functional insulin signaling pathway (22
genes annotated) in the Argentine ant (Table S2). ). Initiation of cell growth is likely
induced by this pathway, with the detection of growth factor receptors by the Pi3K
complex (Lhum_Pi3K21B, Lhum_Pi3K59F, Lhum_Pi3K68D, and Lhum_Pi3K92E)
which activates PDK-1 and AKT (Lhum_PDK1; Lhum_AKT). AKT can then
phosphorylate mTor (Lhum_TOR), which in turn can phosphorylate 4EBP (Lhum_4EBP),
leading to the downstream activation of EIF-4B (Lhum_EIF4B) and RPS6 (Lhum_RPS6).
This can result in the initiation of translation and contributes to overall cell growth. Most
of the proteins in this pathway are highly conserved and have only minor variation
compared to even mammalian orthologs (e.g., target of rapamycin, Lhum_Tor, has 61%
identity to its ortholog in humans, mTor, across 2538 amino acid positions). The general
exceptions to sequence conservation are the insulin-like peptides (Ilp, also referred to as
insulin related peptides, Irp), which are short, ~100 a.a., and have few highly conserved
residues (162). Furthermore, the number of insulin-like peptides varies across taxa;
Drosophila melanogaster has seven Ilp genes while A. mellifera only two (one of which

112
is described as an Insulin-like growth factor peptide, Igf). Similarly, the number of
insulin receptor genes (InR) varies across taxa, with D. melanogaster having only one
while A. mellifera two. In L. humile we found two Ilp and two InR genes. One of the L.
humile insulin peptides is more similar to typical insect Ilp (Lhum_Ilp1) while the other
to insulin growth factor (Lhum_Ilp2). A search of the Lhum_InR1-2 predicted proteins in
NCBI is similarly complicated with hits of both insulin receptors and insulin-like growth
factor receptors. Thus, it is currently unclear whether there is a one to one relationship of
the peptides and receptors, and in mammals both peptides bind to both receptors, but with
differing affinities.
Relative Evolutionary Rates Analysis To analyze the rate of evolution of L. humile, we compared the amino acid composition
of Argentine ant OGS1.1 proteins and their predicted orthologs in Apis mellifera,
Nasonia vitripennis, and Drosophila melanogaster. Evolutionary comparisons between
distantly related species can be skewed if more than one mutation, on average, occurs per
synonymous codon site. Since Diptera and Hymenoptera are separated by >300MYA, we
focused on non-synonymous substitutions in highly conserved regions of orthologous
proteins.
Predicted orthologs were identified with OrthoMCL (53) to group annotated
proteins into putative orthologous sets. Each set was required to have a single gene copy
from each species with no species being unrepresented in the set. Proteins from of each
set were aligned to each other using Clustalw (170) and further processed using Gblocks
(126) to extract only conserved blocks found in all four species. The final alignments
were measured to estimate the distribution of amino acid substitution rates. We then

113
concatenated the multiple alignments from each orthologous set together to estimate the
average substitution rate for the coding portion of he genome using the program PROML
(http://evolution.genetics.washington.edu/phylip.html). PROML was constrained by the
tree topology corresponding to the known phylogenic relationship of the species studied.
Branch lengths were allowed to vary to best fit the multiple alignments to the constrained
tree topology. The branch lengths produced by PROML are proportional to the expected
amino acid substitutions, and provides a simple means to calculate the substitution rates
between different nodes of the tree. Each tree was rooted using D. melanogaster as the
out-group, which allowed us to calculate the number of amino acid substitutions per site
occurring in the remaining three species relative to their last shared common ancestor
(Figure S19).

114
Figure S19. A tree of the phylogenetic relationships for different species of insects related to L. humile. Amino acid substitution rates in orthologous proteins were estimated for organisms in the orange box (A). The average number of amino acid substitutions estimated to have occurred per site in a concatenated, multiple seqence alignment of orthologous proteins compared to the last common ancestor of the organisms from (A) and D. melanogaster is shown (B). The distribution of substitution rates for all orthologous protein sets when calculated independently, rather than as part of the concatenated alignments are indicated for L. humile (red), N. vitripennis (green), and A. mellifera (blue) (C).
Foraging Gene qPCR The resources presented here will accelerate and facilitate molecular studies of Argentine
ants. Using the transcriptome and genomic data presented here, we annotated the
foraging gene (LH17994/LH24060), designed primers for quantitiative PCR, and
quantified expression levels of this gene across several developmental stages.
Using the L. humile transcriptome dataset we matched contigs to the foraging
gene sequence of D. melanogaster, A. mellifera, N. vitripennis, and P. barbatus. We
selected primers using Primer3 (171) then purchased them from Elim
Biopharmaceuticals, Inc. (Hayward, CA). We extracted RNA from workers, larvae and

115
pupae raised in the lab and gathered in the field using Qiagen RNeasy Mini kit (Catalog
#74104). Residual DNA was removed using Turbo DNAse from Ambion (AM2238).
cDNA was made using the Invitrogen SuperScript III First-Strand Synthesis System for
RT-PCR kit (Catalog Number 18080-051) using oligo d(T).
Quantitative reverse-transcriptase real-time PCR was performed using the
Invitrogen kit, SYBR GreenER qPCR SuperMix Universal (Catalog number 11762-100).
Each sample was diluted to contain the same volume of starting RNA and run in
triplicate. The average of the CT value as well as the standard deviations were calculated.
The housekeeping gene glyceraldehyde 3-phosphate dehydrogenase (GAPDH) was used
as the reference gene and the primers were tailored to the Argentine ant by using the EST
dataset.
During the larval stage, expression is similar to that of the workers however, the
pupae stage increases almost 6 fold higher than both the larval and worker stages (Fig.
S20). We standardized all of the data to values obtained from samples of workers giving
the following results for fold change: 1, 6.39, 2.23 for worker, pupae and larvae,
respectively. The following results are fold changes for field samples: 1, 6.14, 1.39 for
worker, pupae and larvae, respectively. The fold changes for lab samples: 1, 6.68, 2.00
for worker pupae and larvae, respectively. Our data compares gene expression of a
section of the 3’ end of the foraging gene in developmental stages of the Argentine ant.
We looked at larvae, pupae, and workers. We compared samples that were taken directly
from the field and samples that had been reared in the laboratory colonies to confirm that
there is no variation in gene expression between these two environments (Fig. S20). We
used GAPDH as a control gene for every sample taken to insure uniformity across

116
Figure S20. Quantitative PCR data of the foraging gene. A comparison between larva, pupae, and adult workers from lab and field samples. Results are normalized to worker expression, which is set at 1.
samples and no contaminates or variants were present. There is no significant difference
between field and lab samples, with only a slight increase in expression of the foraging
gene in the field samples (Fig. S20). In comparison to other organisms we see that
expression increasing in developmental stages but in the harvester ant regulation is down
regulated. Importantly, the
harvester ant data was taken
only from callows and workers
while our data was taken from
early developmental stages
(larvae and pupae) as well as
workers. The differences seen
in regulation of the foraging
gene between these two
organisms could be due to the
limited developmental stages
tested.
Annotation of the L. humile genome as a teaching tool The undergraduate Evolutionary Genomics class at Earlham College (students: H. Albers,
M. Bahnick, T. Carter, K. Clay, P. Hallowell, J. Hood, S. McGuire, A. Miller, M.
Naughton, K. O’Rourke-Owens, K. Paine, J. Pillow, P. Raines, and C. Wertman) used the
L. humile genome as a tool for students to learn gene structure, orthology, and annotation.
Each student in the class chose five genes to annotate. The choice of genes varied from
those involved in basic cellular processes (e.g., the cell cycle) to heat shock proteins, but

117
was entirely student driven. More than 50 genes were annotated by the class. After
selecting their genes, students researched the literature on the genes and found gene
models in insects (principally D. melanogaster and A. mellifera). Students identified the
location of genes in the L. humile genome, and used basic BLAST tools to assess whether
the ab initio gene predictors used by Maker had computationally predicted a gene. Using
all available evidence the students reviewed the gene models and, in the process, learned
basic elements of gene structure (intron/exon boundaries, conserved domains, etc.) and
the process of refining gene models. As a quality control step, the students turned in their
revised gene model and detailed evidence for any changes they made to the ab initio
prediction; once approved the students uploaded their revisions to the genome server. At
the conclusion of the course students responded very positively (4.7 on a 1-5 scale) in a
survey about how influential working on a real, unpublished genome was in the material
learned in the course.
ACKNOWLEDGEMENTS
We thank G. Anderson for providing the ants used in this project, A. Smith for assistance
with transcriptome sequencing, L. Tonkin and the V. Coates Genomic Sequencing
Facility (UC Berkeley) and the Center for High Performance Computing (University of
Utah) for assistance and use of facilities, G. Robinson for support, M. Wong for script
support, M. Goodisman for valuable discussion, B. Hunt and S. Yi for generously sharing
useful data, and B. Moore for assistance with SNP analysis. Infrastructure for this work
was supported in part by NHGRI NIH grant 1R01HG004694 (MY) , NIMH NIH grant
5SC2MH086071 (CDS) and the UIUC Romano Professorial Scholarship (HMR).

118
REFERENCES
1. van Wilgenburg E, Torres CW, & Tsutsui ND (2010) The global expansion of a single ant supercolony. Evolutionary Applications 3(2):136-143.
2. Krieger MJB & Keller L (1997) Polymorphism at dinucleotide microsatellite loci in fire ant Solenopsis invicta populations. Molecular Ecology 6:997-999.
3. Suarez AV, Tsutsui ND, Holway DA, & Case TJ (1999) Behavioral and genetic differentiation between native and introduced populations of the Argentine ant. Biological Invasions 1(1):43-53.
4. Tsutsui ND, Suarez AV, Holway DA, & Case TJ (2000) Reduced genetic variation and the success of an invasive species. Proceedings of the National Academy of Sciences of the United States of America 97(11):5948-5953.
5. Nei M (1987) Molecular evolutionary genetics (Columbia University Press, New York).
6. Suarez AV, Holway DA, Liang D, Tsutsui ND, & Case TJ (2002) Spatiotemporal patterns of intraspecific aggression in the invasive Argentine ant. Animal Behaviour 64:697-708.
7. Miller JR, et al. (2008) Aggressive assembly of pyrosequencing reads with mates. Bioinformatics 24(24):2818-2824.
8. Cantarel BL, et al. (2008) MAKER: An easy-to-use annotation pipeline designed for emerging model organism genomes. Genome Res 18(1):188-196.
9. Edgar RC & Myers EW (2005) PILER: identification and classification of genomic repeats. Bioinformatics 21 Suppl 1:i152-158.
10. Korf I, Yandell M, & Bedell J (2003) BLAST (O'Reilly Media, Sebastopol, CA) p 368.
11. Slater GS & Birney E (2005) Automated generation of heuristics for biological sequence comparison. Bmc Bioinformatics 6:31.
12. Benson DA, Karsch-Mizrachi I, Lipman DJ, Ostell J, & Wheeler DL (2005) GenBank. Nucleic Acids Res 33(Database issue):D34-38.
13. Anonymous (The Universal Protein Resource (UniProt) in 2010. Nucleic Acids Res 38(Database issue):D142-148.
14. Korf I (2004) Gene finding in novel genomes. Bmc Bioinformatics 5:-. 15. Stanke M, Tzvetkova A, & Morgenstern B (2006) AUGUSTUS at EGASP: using
EST, protein and genomic alignments for improved gene prediction in the human genome. Genome Biol 7 Suppl 1:S11 11-18.
16. Lukashin AV & Borodovsky M (1998) GeneMark.hmm: new solutions for gene finding. Nucleic Acids Res 26(4):1107-1115.
17. Eilbeck K, Moore B, Holt C, & Yandell M (2009) Quantitative measures for the management and comparison of annotated genomes. Bmc Bioinformatics 10:67.
18. Quevillon E, et al. (2005) InterProScan: protein domains identifier. Nucleic Acids Research 33:W116-W120.
19. Smith CD, et al. (2007) Improved repeat identification and masking in Dipterans. Gene 389(1):1-9.
20. Mungall CJ & Emmert DB (2007) A Chado case study: an ontology-based modular schema for representing genome-associated biological information. Bioinformatics 23(13):i337-346.

119
21. Lewis SE, et al. (2002) Apollo: a sequence annotation editor. Genome Biol 3(12):RESEARCH0082.
22. Waterhouse AM, Procter JB, Martin DM, Clamp M, & Barton GJ (2009) Jalview Version 2--a multiple sequence alignment editor and analysis workbench. Bioinformatics 25(9):1189-1191.
23. Ryter JM & Schultz SC (1998) Molecular basis of double-stranded RNA-protein interactions: structure of a dsRNA-binding domain complexed with dsRNA. Embo J 17(24):7505-7513.
24. Kenmochi N, et al. (1998) A map of 75 human ribosomal protein genes. Genome Res 8(5):509-523.
25. Brodersen DE & Nissen P (2005) The social life of ribosomal proteins. Febs J 272(9):2098-2108.
26. Sengupta J, et al. (2004) Identification of the versatile scaffold protein RACK1 on the eukaryotic ribosome by cryo-EM. Nat Struct Mol Biol 11(10):957-962.
27. Nilsson J, Sengupta J, Frank J, & Nissen P (2004) Regulation of eukaryotic translation by the RACK1 protein: a platform for signalling molecules on the ribosome. EMBO Rep 5(12):1137-1141.
28. Wool IG, Chan YL, & Gluck A (1995) Structure and evolution of mammalian ribosomal proteins. Biochem Cell Biol 73(11-12):933-947.
29. Marygold SJ, et al. (2007) The ribosomal protein genes and minute loci of Drosophila melanogaster. Genome Biol 8(10):R216.
30. Zhang Z, Harrison P, & Gerstein M (2002) Identification and analysis of over 2000 ribosomal protein pseudogenes in the human genome. Genome Res 12(10):1466-1482.
31. Uechi T, Tanaka T, & Kenmochi N (2001) A complete map of the human ribosomal protein genes: assignment of 80 genes to the cytogenetic map and implications for human disorders. Genomics 72(3):223-230.
32. Katoh K, Misawa K, Kuma K, & Miyata T (2002) MAFFT: a novel method for rapid multiple sequence alignment based on fast Fourier transform. Nucleic Acids Res 30(14):3059-3066.
33. Wall DP, Fraser HB, & Hirsh AE (2003) Detecting putative orthologs. Bioinformatics 19(13):1710-1711.
34. Porcelli D, Barsanti P, Pesole G, & Caggese C (2007) The nuclear OXPHOS genes in insecta: a common evolutionary origin, a common cis-regulatory motif, a common destiny for gene duplicates. Bmc Evol Biol 7:215.
35. Rand DM, Haney RA, & Fry AJ (2004) Cytonuclear coevolution: the genomics of cooperation. Trends in Ecology & Evolution 19(12):645-653.
36. D'Elia D, et al. (2006) The MitoDrome database annotates and compares the OXPHOS nuclear genes of Drosophila melanogaster, Drosophila pseudoobscura and Anopheles gambiae. Mitochondrion 6(5):252-257.
37. Smit AFA, Hubley R, & Green P (1996-2004) Repeatmasker open-3.0). 38. Bao Z & Eddy SR (2002) Automated de novo identification of repeat sequence
families in sequenced genomes. Genome Res 12(8):1269-1276. 39. Benson G (1999) Tandem repeats finder: a program to analyze DNA sequences.
Nucleic Acids Research 27(2):573-580. 40. Price AL, Jones NC, & Pevzner PA (2005) De novo identification of repeat
120
families in large genomes. Bioinformatics 21 Suppl 1:i351-358. 41. Weinstock GM, et al. (2006) Insights into social insects from the genome of the
honeybee Apis mellifera. Nature 443(7114):931-949. 42. Werren JH, et al. (2010) Functional and evolutionary insights from the genomes
of three parasitoid Nasonia species. Science 327(5963):343-348. 43. Robertson HM (1993) The mariner transposable element is widespread in insects.
Nature 362(6417):241-245. 44. Kojima KK & Fujiwara H (2005) Long-term inheritance of the 28S rDNA-
specific retrotransposon R2. Mol Biol Evol 22(11):2157-2165. 45. Valles SM, et al. (2004) A picorna-like virus from the red imported fire ant,
Solenopsis invicta: initial discovery, genome sequence, and characterization. Virology 328(1):151-157.
46. Valles SM, Strong CA, & Hashimoto Y (2007) A new positive-strand RNA virus with unique genome characteristics from the red imported fire ant, Solenopsis invicta. Virology 365(2):457-463.
47. Genersch E & Aubert M (2010) Emerging and re-emerging viruses of the honey bee (Apis mellifera L.). Vet Res 41(6):54.
48. Durbin R, Eddy S, Krogh A, & Mitchison G (1998) Biological sequence analysis: probabilistic models of proteins and nucleic acids (Cambridge University Press).
49. Zdobnov EM & Apweiler R (2001) InterProScan--an integration platform for the signature-recognition methods in InterPro. Bioinformatics 17(9):847-848.
50. Moriya Y, Itoh M, Okuda S, Yoshizawa AC, & Kanehisa M (2007) KAAS: an automatic genome annotation and pathway reconstruction server. Nucleic Acids Research 35:W182-W185.
51. Boyle EI, et al. (2004) GO::TermFinder--open source software for accessing Gene Ontology information and finding significantly enriched Gene Ontology terms associated with a list of genes. Bioinformatics 20(18):3710-3715.
52. Ashburner M, et al. (2000) Gene ontology: tool for the unification of biology. Nat Genet 25(1):25-29.
53. Li L, Stoeckert CJ, Jr., & Roos DS (2003) OrthoMCL: identification of ortholog groups for eukaryotic genomes. Genome Res 13(9):2178-2189.
54. Tweedie S, et al. (2009) FlyBase: enhancing Drosophila gene ontology annotations. Nucleic Acids Res 37(Database issue):D555-559.
55. Boore JL (1999) Animal mitochondrial genomes. Nucleic Acids Research 27(8):1767-1780.
56. Crozier RH & Crozier YC (1993) The mitochondrial genome of the honeybee Apis mellifera complete sequence and genome organization. Genetics 133(1):97-117.
57. Oliveira DCSG, Raychoudhury R, Lavrov DV, & Werren JH (2008) Rapidly evolving mitochondrial genome and directional selection in mitochondrial genes in the parasitic wasp Nasonia (Hymenoptera : Pteromalidae). Molecular Biology and Evolution 25(10):2167-2180.
58. Bernardi G (2000) Isochores and the evolutionary genomics of vertebrates. Gene 241(1):3-17.
59. Lander ES, et al. (2001) Initial sequencing and analysis of the human genome. Nature 409(6822):860-921.

121
60. Elhaik E, Graur D, & Josi K (2010) Identifying compositionally homogeneous and nonhomogeneous domains within the human genome using a novel segmentation algorithm. Nucleic Acids Research in press.
61. Cohen N, Dagan T, Stone L, & Graur D (2005) GC composition of the human genome: in search of isochores. Mol Biol Evol 22(5):1260-1272.
62. Elhaik E, Graur D, & Josic K (2010) Comparative testing of DNA segmentation algorithms using benchmark simulations. Mol Biol Evol 27(5):1015-1024.
63. Clauset A, Shalizi CR, & Newman MEJ (2007) Power-law distributions in empirical data.).
64. Sokal RR & Rohlf FJ (1995) Biometry: the principles and practice of statistics in biological research (W. H. Freeman and Company, New York) 3rd edition Ed.
65. Griffiths-Jones S (2004) The microRNA Registry. Nucleic Acids Res 32(Database issue):D109-111.
66. Griffiths-Jones S, Grocock RJ, van Dongen S, Bateman A, & Enright AJ (2006) miRBase: microRNA sequences, targets and gene nomenclature. Nucleic Acids Res 34(Database issue):D140-144.
67. Griffiths-Jones S, Saini HK, van Dongen S, & Enright AJ (2008) miRBase: tools for microRNA genomics. Nucleic Acids Res 36(Database issue):D154-158.
68. Pearson WR (1990) Rapid and sensitive sequence comparison with FASTP and FASTA. Methods Enzymol 183:63-98.
69. Larkin MA, et al. (2007) Clustal W and clustal X version 2.0. Bioinformatics 23(21):2947-2948.
70. Hofacker IL, et al. (1994) Fast folding and comparison of RNA secondary structures. Monatshefte f. Chemie 125:167-188.
71. Weaver DB, et al. (2007) Computational and transcriptional evidence for microRNAs in the honey bee genome. Genome Biol 8(6):R97.
72. Tran T, Havlak P, & Miller J (2006) MicroRNA enrichment among short 'ultraconserved' sequences in insects. Nucleic Acids Res 34(9):e65.
73. Hölldobler B & Wilson EO (1990) The ants (Belknap Press, Cambridge, Massachusetts) p 733.
74. Moreau CS, Bell CD, Vila R, Archibald SB, & Pierce NE (2006) Phylogeny of the ants: Diversification in the age of angiosperms. Science 312(5770):101-104.
75. Brady SG, Schultz TR, Fisher BL, & Ward PS (2006) Evaluating alternative hypotheses for the early evolution and diversification of ants. Proceedings of the National Academy of Sciences, USA 103:18172-18177.
76. Abouheif E & Wray GA (2002) Evolution of the gene network underlying wing polyphenism in ants. Science 297(5579):249-252.
77. Khila A & Abouheif E (2008) Reproductive constraint is a developmental mechanism that maintains social harmony in advanced ant societies. Proceedings of the National Academy of Sciences of the United States of America 105(46):17884-17889.
78. Tsutsui ND & Suarez AV (2003) The colony structure and population biology of invasive ants. Conservation Biology 17(1):48-58.
79. Passera L, Keller L, & Suzzoni JP (1988) Control of brood male production in the Argentine ant Iridomyrmex humilis (Mayr). Insectes Sociaux 35(1):19-33.
80. Elango N, Hunt BG, Goodisman MAD, & Yi SV (2009) DNA methylation is

122
widespread and associated with differential gene expression in castes of the honeybee, Apis mellifera. Proceedings of the National Academy of Sciences of the United States of America 106(27):11206-11211.
81. Sameshima S, Miura T, & Matsumoto T (2004) Wing disc development during caste differentiation in the ant Pheidole megacephala (Hymenoptera: Formicidae). Evolution and Development 6:336-341.
82. Gibson MC & Perrimon N (2005) Extrusion and death of DPP/BMP-compromised epithelial cells in the developing Drosophila wing. Science 307(5716):1785-1789.
83. Klattenhoff C, et al. (2007) Drosophila rasiRNA pathway mutations disrupt embryonic axis specification through activation of an ATR/Chk2 DNA damage response. Dev Cell 12(1):45-55.
84. Robertson HM, Gadau J, & Wanner KW (2010) The insect chemoreceptor superfamily of the parasitoid jewel wasp Nasonia vitripennis. Insect Molecular Biology 19:121-136.
85. Robertson HM, Warr CG, & Carlson JR (2003) Molecular evolution of the insect chemoreceptor gene superfamily in Drosophila melanogaster. Proceedings of the National Academy of Sciences of the United States of America 100:14537-14542.
86. Kent LB, Walden KK, & Robertson HM (2008) The Gr family of candidate gustatory and olfactory receptors in the yellow-fever mosquito Aedes aegypti. Chem Senses 33(1):79-93.
87. Foret S & Maleszka R (2006) Function and evolution of a gene family encoding odorant binding-like proteins in a social insect, the honey bee (Apis mellifera). Genome Res 16(11):1404-1413.
88. Gotzek D & Ross KG (2009) Current status of a model system: the gene Gp-9 and its association with social organization in fire ants. PLoS One 4(11):e7713.
89. Su CY, Menuz K, & Carlson JR (2009) Olfactory perception: receptors, cells, and circuits. Cell 139(1):45-59.
90. Touhara K & Vosshall LB (2009) Sensing odorants and pheromones with chemosensory receptors. Annu Rev Physiol 71:307-332.
91. Jones WD, Cayirlioglu P, Kadow IG, & Vosshall LB (2007) Two chemosensory receptors together mediate carbon dioxide detection in Drosophila. Nature 445(7123):86-90.
92. Kwon JY, Dahanukar A, Weiss LA, & Carlson JR (2007) The molecular basis of CO2 reception in Drosophila. Proc Natl Acad Sci U S A 104(9):3574-3578.
93. Lu T, et al. (2007) Odor coding in the maxillary palp of the malaria vector mosquito Anopheles gambiae. Curr Biol 17(18):1533-1544.
94. Benton R, Vannice KS, Gomez-Diaz C, & Vosshall LB (2009) Variant ionotropic glutamate receptors as chemosensory receptors in Drosophila. Cell 136(1):149-162.
95. Kirkness EF, et al. (2010) Genome sequences of the human body louse and its primary endosymbiont provide insights into the permanent parasitic lifestyle. Proc Natl Acad Sci U S A 107(27):12168-12173.
96. Nozawa M & Nei M (2007) Evolutionary dynamics of olfactory receptor genes in Drosophila species. Proc Natl Acad Sci U S A 104(17):7122-7127.
97. Hill CA, et al. (2002) G protein coupled receptors in Anopheles gambiae. Science
123
298(5591):176-178. 98. Bohbot J, et al. (2007) Molecular characterization of the Aedes aegypti odorant
receptor gene family. Insect Mol Biol 16(5):525-537. 99. Wanner KW, et al. (2007) Female-biased expression of odourant receptor genes
in the adult antennae of the silkworm, Bombyx mori. Insect Mol Biol 16(1):107-119.
100. Tanaka K, et al. (2009) Highly selective tuning of a silkworm olfactory receptor to a key mulberry leaf volatile. Curr Biol 19(11):881-890.
101. Smadja C, Shi P, Butlin RK, & Robertson HM (2009) Large gene family expansions and adaptive evolution for odorant and gustatory receptors in the pea aphid, Acyrthosiphon pisum. Mol Biol Evol 26(9):2073-2086.
102. Engsontia P, et al. (2008) The red flour beetle's large nose: an expanded odorant receptor gene family in Tribolium castaneum. Insect Biochem Mol Biol 38(4):387-397.
103. Robertson HM & Wanner KW (2006) The chemoreceptor superfamily in the honey bee, Apis mellifera: Expansion of the odorant, but not gustatory, receptor family. Genome Res 16(11):1395-1403.
104. Kelber C, Rossler W, & Kleineidam CJ (2006) Multiple olfactory receptor neurons and their axonal projections in the antennal lobe of the honeybee Apis mellifera. J Comp Neurol 496(3):395-405.
105. Nakanishi A, Nishino H, Watanabe H, Yokohari F, & Nishikawa M (2010) Sex-specific antennal sensory system in the ant Camponotus japonicus: glomerular organizations of antennal lobes. J Comp Neurol 518(12):2186-2201.
106. Swofford DL (2003) PAUP*. Phylogenetic Analysis Using Parsimony (*and other methods). Version 4. (Sinauer Associates, Sunderland, Massachusetts).
107. Schmidt HA, Strimmer K, Vingron M, & von Haeseler A (2002) TREE-PUZZLE: maximum likelihood phylogenetic analysis using quartets and parallel computing. Bioinformatics 18(3):502-504.
108. Wanner KW, et al. (2007) A honey bee odorant receptor for the queen substance 9-oxo-2-decenoic acid. Proc Natl Acad Sci U S A 104(36):14383-14388.
109. Ozaki M, et al. (2005) Ant nestmate and non-nestmate discrimination by a chemosensory sensillum. Science 309(5732):311-314.
110. Brandt M, van Wilgenburg E, Sulc R, Shea KJ, & Tsutsui ND (2009) The scent of supercolonies: the discovery, synthesis and behavioural verification of ant colony recognition cues. Bmc Biology 7:-.
111. Bray S & Amrein H (2003) A putative Drosophila pheromone receptor expressed in male-specific taste neurons is required for efficient courtship. Neuron 39(6):1019-1029.
112. Ebbs ML & Amrein H (2007) Taste and pheromone perception in the fruit fly Drosophila melanogaster. Pflugers Arch 454(5):735-747.
113. Croset V, et al. (2010) Ancient protostome origin of chemosensory ionotropic glutamate receptors and the evolution of insect taste and olfaction. Plos Genet 6(8):e1001064.
114. Tsutsui ND (2004) Scents of self: The expression component of self/nonself recognition systems. Ann Zool Fenn 41(6):713-727.
115. Payne CM, Tillberg CV, & Suarez AV (2004) Recognition systems and biological

124
invasions. Ann Zool Fenn 41(6):843-858. 116. Hefetz A, Errard C, Chambris A, & LeNegrate A (1996) Postpharyngeal gland
secretion as a modifier of aggressive behavior in the myrmicine ant Manica rubida. Journal of Insect Behavior 9(5):709-717.
117. Torres CW, Brandt M, & Tsutsui ND (2007) The role of cuticular hydrocarbons as chemical cues for nestmate recognition in the invasive Argentine ant (Linepithema humile). Insectes Sociaux 54(4):363-373.
118. Lahav S, Soroker V, Hefetz A, & Vander Meer RK (1999) Direct behavioral evidence for hydrocarbons as ant recognition discriminators. Naturwissenschaften 86(5):246-249.
119. Carlin NF & Hölldobler B (1986) The kin recognition system of carpenter ants (Camponotus spp.) I. Hierarchical cues in small colonies. Behavioral Ecology and Sociobiology 19:123-134.
120. Martin S & Drijfhout F (2009) A review of ant cuticular hydrocarbons. Journal of Chemical Ecology 35(10):1151-1161.
121. Gleason JM, Jallon JM, Rouault JD, & Ritchie MG (2005) Quantitative trait loci for cuticular hydrocarbons associated with sexual isolation between Drosophila simulans and D. sechellia. Genetics 171(4):1789-1798.
122. Dallerac R, et al. (2000) A Delta 9 desaturase gene with a different substrate specificity is responsible for the cuticular diene hydrocarbon polymorphism in Drosophila melanogaster. Proceedings of the National Academy of Sciences of the United States of America 97(17):9449-9454.
123. Lemieux C, Otis C, & Turmel M (2000) Ancestral chloroplast genome in Mesostigma viride reveals an early branch of green plant evolution. Nature 403:649-652.
124. Legendre A, Miao XX, Da Lage JL, & Wicker-Thomas C (2008) Evolution of a desaturase involved in female pheromonal cuticular hydrocarbon biosynthesis and courtship behavior in Drosophila. Insect Biochemistry and Molecular Biology 38(2):244-255.
125. Liang D (2001) Hydrocarbon-released nestmate aggression in the Argentine ant, Linepithema humile, following encounters with insect prey. Comparative Biochemistry and Physiology Part B 129:871-882.
126. Castresana J (2000) Selection of conserved blocks from multiple alignments for their use in phylogenetic analysis. Mol Biol Evol 17(4):540-552.
127. Abascal F, Zardoya R, & Posada D (2005) ProtTest: selection of best-fit models of protein evolution. Bioinformatics 21(9):2104-2105.
128. Stamatakis A (2006) RAxML-VI-HPC: maximum likelihood-based phylogenetic analyses with thousands of taxa and mixed models. Bioinformatics 22(21):2688-2690.
129. Thompson JD, Higgins DG, & Gibson TJ (1994) CLUSTAL W: improving the sensitivity of progressive multiple sequence alignment through sequence weighting, position-specific gap penalties and weight matrix choice. Nucleic Acids Res 22(22):4673-4680.
130. Hughes CL & Kaufman TC (2002) Hox genes and the evolution of the arthropod body plan. Evol Dev 4(6):459-499.
131. Lemons D & McGinnis W (2006) Genomic evolution of Hox gene clusters.

125
Science 313(5795):1918-1922. 132. Dearden PK, et al. (2006) Patterns of conservation and change in honey bee
developmental genes. Genome Res 16(11):1376-1384. 133. Evans JD, et al. (2006) Immune pathways and defence mechanisms in honey bees
Apis mellifera. Insect Molecular Biology 15(5):645-656. 134. Christophides GK, et al. (2002) Immunity-related genes and gene families in
Anopheles gambiae. Science 298(5591):159-165. 135. Sackton TB, et al. (2007) Dynamic evolution of the innate immune system in
Drosophila. Nat Genet 39(12):1461-1468. 136. Cremer S, Armitage SAO, & Schmid-Hempel P (2007) Social immunity. Current
Biology 17(16):R693-R702. 137. Dukas R (2008) Evolutionary biology of insect learning. Annual Review of
Entomology 53:145-160. 138. Skoulakis EMC & Grammenoudi S (2006) Dunces and da Vincis: The genetics of
learning and memory in Drosophila. Cell Mol Life Sci 63(9):975-988. 139. Liu X & Davis RL (2006) Insect olfactory memory in time and space. Curr Opin
Neurobiol 16(6):679-685. 140. Waddell S & Quinn WG (2001) Flies, genes, and learning. Annu Rev Neurosci
24:1283-1309. 141. Schwaerzel M, et al. (2003) Dopamine and octopamine differentiate between
aversive and appetitive olfactory memories in Drosophila. J Neurosci 23(33):10495-10502.
142. Tempel BL, Livingstone MS, & Quinn WG (1984) Mutations in the dopa decarboxylase gene affect learning in Drosophila. P Natl Acad Sci-Biol 81(11):3577-3581.
143. Grotewiel MS, Beck CDO, Wu KH, Zhu XR, & Davis RL (1998) Integrin-mediated short-term memory in Drosophila. Nature 391(6666):455-460.
144. Cheng YZ, et al. (2001) Drosophila fasciclin II is required for the formation of odor memories and for normal sensitivity to alcohol. Cell 105(6):757-768.
145. Dudai Y, Jan YN, Byers D, Quinn WG, & Benzer S (1976) Dunce, a mutant of Drosophila deficient in learning. Proceedings of the National Academy of Sciences of the United States of America 73(5):1684-1688.
146. Acevespina EO, et al. (1983) Learning and memory in Drosophila, studied with mutants. Cold Spring Harb Sym 48:831-840.
147. Griffith LC, et al. (1993) Inhibition of calcium calmodulin-dependent protein-kinase in Drosophila disrupts behavioral plasticity. Neuron 10(3):501-509.
148. Joiner MLA & Griffith LC (1997) CaM kinase II and visual input modulate memory formation in the neuronal circuit controlling courtship conditioning. J Neurosci 17(23):9384-9391.
149. Mehren JE & Griffith LC (2004) Calcium-independent calcium/calmodulin-dependent protein kinase II in the adult Drosophila CNS enhances the training of pheromonal cues. J Neurosci 24(47):10584-10593.
150. Dubnau J, et al. (2003) The staufen/pumilio pathway is involved in Drosophila long-term memory. Current Biology 13(4):286-296.
151. Thomas ML, Payne-Makrisa CM, Suarez AV, Tsutsui ND, & Holway DA (2006) When supercolonies collide: territorial aggression in an invasive and unicolonial

126
social insect. Molecular Ecology 15(14):4303-4315. 152. Tsutsui ND, Suarez AV, & Grosberg RK (2003) Genetic diversity, asymmetrical
aggression, and recognition in a widespread invasive species. Proceedings of the National Academy of Sciences of the United States of America 100:1078-1083.
153. Holway DA, Suarez AV, & Case TJ (1998) Loss of intraspecific aggression in the success of a widespread invasive social insect. Science (Washington D C) 283(5390):949-952.
154. Nelson RJ (2006) Biology of Aggression (Oxford University Press, New York). 155. Edwards AC & Mackay TF (2009) Quantitative trait loci for aggressive behavior
in Drosophila melanogaster. Genetics 182(3):889-897. 156. Dierick HA & Greenspan RJ (2006) Molecular analysis of flies selected for
aggressive behavior. Nat Genet 38(9):1023-1031. 157. Edwards AC, et al. (2009) A transcriptional network associated with natural
variation in Drosophila aggressive behavior. Genome Biol 10(7):R76. 158. Edwards AC, Zwarts L, Yamamoto A, Callaerts P, & Mackay TF (2009)
Mutations in many genes affect aggressive behavior in Drosophila melanogaster. BMC Biol 7:29.
159. Alaux C, et al. (2009) Honey bee aggression supports a link between gene regulation and behavioral evolution. Proc Natl Acad Sci U S A 106(36):15400-15405.
160. Edwards AC, Rollmann SM, Morgan TJ, & Mackay TFC (2006) Quantitative genomics of aggressive behavior in Drosophila melanogaster. Plos Genet 2(9):1386-1395.
161. Barron AB, Maleszka R, Helliwell PG, & Robinson GE (2009) Effects of cocaine on honey bee dance behaviour. J Exp Biol 212(Pt 2):163-168.
162. Claeys I, et al. (2002) Insulin-related peptides and their conserved signal transduction pathway. Peptides 23(4):807-816.
163. Wheeler DE, Buck N, & Evans JD (2006) Expression of insulin pathway genes during the period of caste determination in the honey bee, Apis mellifera. Insect Molecular Biology 15(5):597-602.
164. Evans JD & Wheeler DE (1999) Differential gene expression between developing queens and workers in the honey bee, Apis mellifera. Proceedings of the National Academy of Sciences of the United States of America 96(10):5575-5580.
165. Patel A, et al. (2007) The making of a queen: TOR pathway Is a key player in diphenic caste development. Plos One 2(6):-.
166. de Azevedo SV & Hartfelder K (2008) The insulin signaling pathway in honey bee (Apis mellifera) caste development - differential expression of insulin-like peptides and insulin receptors in queen and worker larvae. J Insect Physiol 54(6):1064-1071.
167. Smith CR, Toth AL, Suarez AV, & Robinson GE (2008) Genetic and genomic analyses of the division of labour in insect societies. Nat Rev Genet 9(10):735-748.
168. Smith CR (2007) Energy use and allocation in the Florida harvester ant, Pogonomyrmex badius: are stored seeds a buffer? Behavioral Ecology and Sociobiology 61(9):1479-1487.
169. Tillberg CV, Holway DA, Lebrun EG, & Suarez AV (2007) Trophic ecology of

127
invasive Argentine ants in their native and introduced ranges. Proc Natl Acad Sci U S A 104(52):20856-20861.
170. Chenna R, et al. (2003) Multiple sequence alignment with the Clustal series of programs. Nucleic Acids Res 31(13):3497-3500.
171. Rozen S & Skaleysky HJ (2000) Primer3 on the WWW for general users and for biologist programmers. Bioinformatics Methods and Protocols: Methods in Molecular Biology, eds Krawetz S & Misener S (Humana Press, Totowa, NJ), pp 365-386.