supplement materials for changes in hepatitis c burden and
TRANSCRIPT

1
Supplement Materials for
Changes in Hepatitis C Burden and Treatment Trends in Europe During the Era of Direct-Acting Antivirals: A Modeling Study
Qiushi Chen, PhD,1,2,3 Turgay Ayer, PhD,4 Emily D. Bethea, MD,1,2,5 Fasiha Kanwal, MD, MSHS,5,6 Xiaojie Wang, MS,8 Mark S. Roberts, MD, MPP,9 Yueran Zhuo, MS,1 Stefano Fagiuoli, MD,10 Jorg Petersen, MD, PhD,11 Jagpreet Chhatwal, PhD1,2,5 1 Institute for Technology Assessment, Massachusetts General Hospital, Boston, MA 2 Harvard Medical School, Boston, USA 3 Harold and Inge Marcus Department of Industrial and Manufacturing Engineering, The Pennsylvania State University, University Park, PA, 4 H. Milton Stewart School of Industrial and Systems Engineering, Georgia Institute of Technology, Atlanta, USA 5 Liver Center and Gastrointestinal Division, Massachusetts General Hospital, Boston, USA
6 Houston Veterans Affairs Health Services Research and Development Center of Excellence, Michael E. DeBakey Veterans Affairs Medical Center, USA 7 Department of Medicine, Gastroenterology and Hepatology, Baylor College of Medicine, Houston, TX USA 8 Department of Industrial and Systems Engineering, University of Florida, Gainesville, FL 9 Department of Health Policy and Management, University of Pittsburgh, Pittsburgh, USA 10 U.S.C. Gastroenterologia Epatologia e Trapiantologia, Dipartimento di Medicina Specialistica e dei Trapianti, Azienda Socio Sanitaria Territoriale (ASST) Papa Giovanni XXIII, Italy 11 IFI Institute at the Asklepios Klinik St Georg Hamburg, Germany Corresponding Author: Jagpreet Chhatwal PhD Assistant Professor, Harvard Medical School Senior Scientist, Institute for Technology Assessment, Massachusetts General Hospital Email: [email protected] MGH Institute for Technology Assessment 101 Merrimac Street, FL 10 Boston, MA 02114
2
Supplement S1. HEP-SIM Model Details and Model Input
We extended a previously validated individual-level state-transition model [1], Hepatitis C Disease Burden Simulation model (HEP-SIM), to adapt to the hepatitis C virus (HCV) disease population in five representative European countries including France, Germany, Spain, Italy, and UK. The model simulates the chronic hepatitis C virus (HCV)-infected population from 1995 to 2030 (including the warm-up period before 2000) in each of the five countries. HEP-SIM was developed using C++, a general-purpose programming language, to make computational simulation experiments efficient. More model details can be found elsewhere [1]. In this appendix, we summarize the key model parameters and assumptions.
Population characteristics of HCV infection
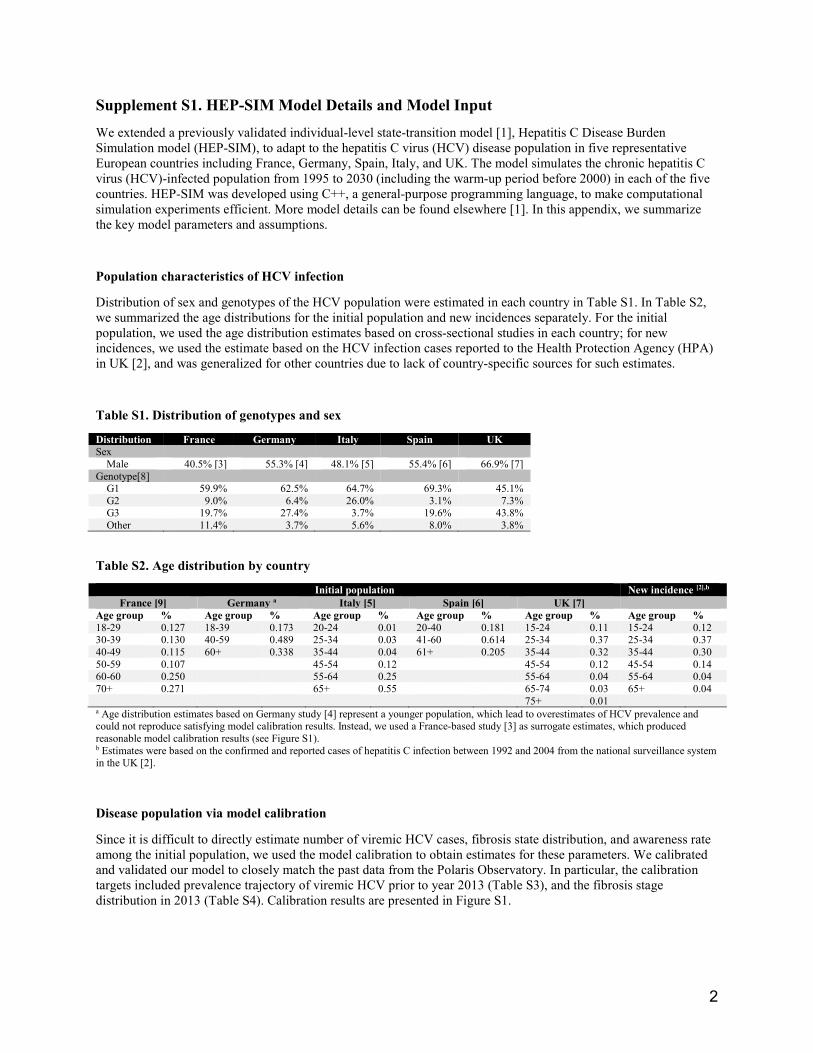
Distribution of sex and genotypes of the HCV population were estimated in each country in Table S1. In Table S2, we summarized the age distributions for the initial population and new incidences separately. For the initial population, we used the age distribution estimates based on cross-sectional studies in each country; for new incidences, we used the estimate based on the HCV infection cases reported to the Health Protection Agency (HPA) in UK [2], and was generalized for other countries due to lack of country-specific sources for such estimates.
Table S1. Distribution of genotypes and sex
Distribution France Germany Italy Spain UK Sex Male 40.5% [3] 55.3% [4] 48.1% [5] 55.4% [6] 66.9% [7] Genotype[8] G1 59.9% 62.5% 64.7% 69.3% 45.1% G2 9.0% 6.4% 26.0% 3.1% 7.3% G3 19.7% 27.4% 3.7% 19.6% 43.8% Other 11.4% 3.7% 5.6% 8.0% 3.8%
Table S2. Age distribution by country
Initial population New incidence [2],b
France [9] Germany a Italy [5] Spain [6] UK [7] Age group % Age group % Age group % Age group % Age group % Age group % 18-29 0.127 18-39 0.173 20-24 0.01 20-40 0.181 15-24 0.11 15-24 0.12 30-39 0.130 40-59 0.489 25-34 0.03 41-60 0.614 25-34 0.37 25-34 0.37 40-49 0.115 60+ 0.338 35-44 0.04 61+ 0.205 35-44 0.32 35-44 0.30 50-59 0.107 45-54 0.12 45-54 0.12 45-54 0.14 60-60 0.250 55-64 0.25 55-64 0.04 55-64 0.04 70+ 0.271 65+ 0.55 65-74 0.03 65+ 0.04 75+ 0.01 a Age distribution estimates based on Germany study [4] represent a younger population, which lead to overestimates of HCV prevalence and could not reproduce satisfying model calibration results. Instead, we used a France-based study [3] as surrogate estimates, which produced reasonable model calibration results (see Figure S1). b Estimates were based on the confirmed and reported cases of hepatitis C infection between 1992 and 2004 from the national surveillance system in the UK [2].
Disease population via model calibration
Since it is difficult to directly estimate number of viremic HCV cases, fibrosis state distribution, and awareness rate among the initial population, we used the model calibration to obtain estimates for these parameters. We calibrated and validated our model to closely match the past data from the Polaris Observatory. In particular, the calibration targets included prevalence trajectory of viremic HCV prior to year 2013 (Table S3), and the fibrosis stage distribution in 2013 (Table S4). Calibration results are presented in Figure S1.

3
Table S3. Number of viremic HCV infections up to year 2013.
Category France Germany Italy Spain UK 1995 327,617 267,077 1,118,138 371,574 146,774 1996 331,493 275,647 1,142,515 384,837 150,257 1997 333,144 283,835 1,159,536 397,340 153,698 1998 333,873 291,589 1,168,326 408,998 159,434 1999 334,050 298,821 1,169,137 419,480 165,592 2000 329,807 305,545 1,164,282 428,570 170,182 2001 324,852 311,968 1,155,648 436,286 174,677 2002 319,236 317,987 1,144,334 442,535 179,014 2003 312,988 323,491 1,131,411 447,356 182,774 2004 306,227 321,434 1,108,625 446,925 186,057 2005 298,919 317,726 1,087,704 445,317 188,315 2006 290,956 313,772 1,066,215 442,599 189,273 2007 283,043 309,116 1,045,841 439,567 189,698 2008 275,888 303,618 1,025,216 434,697 189,130 2009 269,647 297,346 1,004,278 429,497 187,996 2010 264,036 290,860 983,799 423,942 186,720 2011 258,373 283,561 962,767 417,625 185,117 2012 252,760 274,234 941,409 410,157 182,174 2013 248,084 266,554 919,673 402,542 179,391
Source: Viremic HCV infections from the Polaris Observatory (accessed in July 2017).
Table S4. Distribution of fibrosis stages among HCV viremic cases in 2013.
Fibrosis distribution
France Germany Italy Spain UK
Reference Model Reference Model Reference Model Referencea Model Reference Model F0 – F2 67.2% 66.1% 67.2% 68.1% 64.8% 64.8% 64.8% 64.6% 80.1% 79.4%
F3 16.4% 16.8% 16.7% 14.7% 18.6% 18.7% 18.6% 18.3% 11.8% 12.5% Cirrhotic 15.7% 16.5% 15.3% 16.6% 15.8% 15.9% 15.8% 16.5% 7.7% 7.8%
HCC 0.8% 0.6% 0.8% 0.7% 0.8% 0.6% 0.8% 0.6% 0.4% 0.3% Source of reference values: Disease stage distribution from the Polaris Observatory [10] (accessed in July 2017). a Data are not available for Spain. We assume the fibrosis distribution for Spain the same as that for Italy.
Figure S1. Results of model calibration by country
(A) France
(A-1) Calibration of viremic HCV infections. (A-2) Fibrosis distribution

4
(B) Germany
(B-1) Calibration of viremic HCV infections. (B-2) Fibrosis distribution
(C) Italy
(C-1) Calibration of viremic HCV infections. (C-2) Fibrosis distribution
(D) Spain
(D-1) Calibration of viremic HCV infections. (D-2) Fibrosis distribution

5
(E) UK
(E-1) Calibration of viremic HCV infections. (E-2) Fibrosis distribution
New HCV incidences
Tables S5 summarizes the annual incidences of new HCV infections in each country based on data from The Polaris Observatory [10]. Among the new infections, about 78% further developed chronic HCV (considered as viremic HCV infections) while among the rest the virus was spontaneously cleared [11].
Table S5. New HCV infections by country and year
Country France Germany Italy Spain UK 1995 12,500 15,800 65,100 20,600 4,400 1996 10,300 15,600 58,700 20,000 5,500 1997 8,900 15,300 50,400 19,200 5,500 1998 8,100 15,100 41,100 18,100 8,400 1999 7,600 14,800 32,000 16,800 9,000 2000 7,300 14,400 24,600 15,200 8,700 2001 7,000 14,300 19,100 13,600 8,700 2002 6,900 13,900 15,500 12,000 8,600 2003 6,700 13,400 13,300 10,400 7,900 2004 6,600 12,800 12,000 9,000 7,400 2005 6,500 12,100 11,200 7,900 6,900 2006 6,400 11,200 10,500 6,900 5,700 2007 6,300 10,300 9,600 6,000 5,400 2008 6,200 9,400 8,900 5,100 4,900 2009 6,000 8,400 8,300 4,300 4,700 2010 5,900 7,400 7,900 3,400 4,800 2011 5,800 6,500 7,500 2,500 4,300 2012 5,700 5,600 7,200 2,200 4,300 2013 5,600 5,600 6,900 2,200 4,300 2014 5,500 5,600 6,700 2,200 4,300 2015 5,400 5,600 6,700 2,200 4,300 2016 5,300 5,600 6,700 2,200 4,300 2017 5,200 5,600 6,700 2,200 4,200 2018 5,100 5,500 6,700 2,200 4,100 2019 5,000 5,500 6,700 2,200 4,100 2020 5,000 5,500 6,700 2,200 4,000 2021 4,900 5,400 6,700 2,200 4,000 2022 4,900 5,400 6,700 2,200 4,000 2023 4,800 5,400 6,700 2,200 3,900 2024 4,800 5,400 6,700 2,200 3,900 2025 4,800 5,400 6,700 2,200 3,900 2026 4,700 5,400 6,700 2,200 3,900 2027 4,700 5,400 6,700 2,200 3,800 2028 4,700 5,400 6,700 2,200 3,800 2029 4,700 5,400 6,700 2,200 3,800 2030 4,700 5,400 6,700 2,200 3,800 2031 4,700 5,400 6,700 2,200 3,800 2032 4,700 5,400 6,700 2,200 3,800
6
2033+ 4,600 5,400 6,700 2,200 3,700
Disease states and transition probabilities
The natural history of HCV was defined using the METVIR scoring system (no fibrosis [F0], portal fibrosis without septa [F1], portal fibrosis with few septa [F2], numerous septa without cirrhosis [F3], or cirrhosis [F4]). Patients could develop the adverse outcomes of decompensated cirrhosis (DC) and/or hepatocellular carcinoma (HCC), could receive a liver transplant (LT), or experience a liver-related death (LRD). Patients who achieved sustained virologic response (SVR) were assumed to transition into normal health status only if they did not have METAVIR stage F4 (cirrhosis). For cirrhotic patients, we assumed that the disease would progress even after achieving SVR, though at a slower rate [12]. State transitions between health states are illustrated in Figure S2. All transition probabilities are presented in Table 1 of main manuscript. The total number of transplant for DC and HCC patients were obtained from the Polaris Observatory data [10] (Table S6). Background mortality for each country was obtained from the Global Health Observatory data repository by World Health Organization [13] (Table S7).
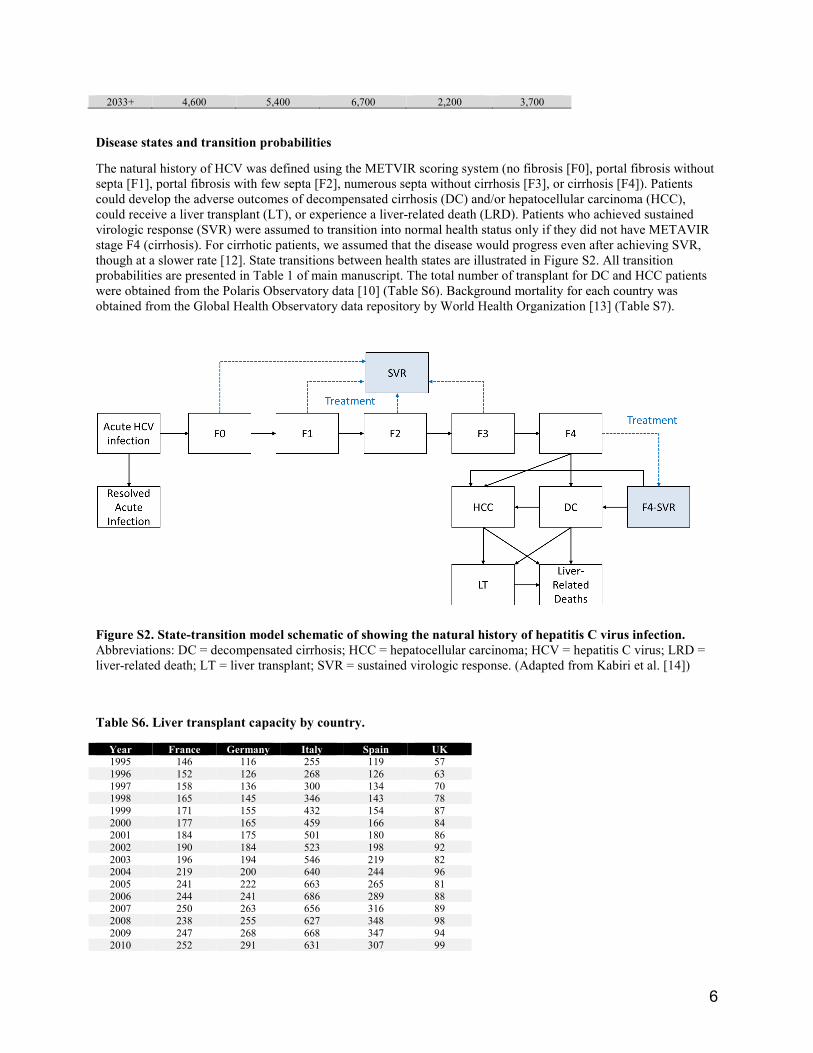
Figure S2. State-transition model schematic of showing the natural history of hepatitis C virus infection. Abbreviations: DC = decompensated cirrhosis; HCC = hepatocellular carcinoma; HCV = hepatitis C virus; LRD = liver-related death; LT = liver transplant; SVR = sustained virologic response. (Adapted from Kabiri et al. [14])
Table S6. Liver transplant capacity by country.
Year France Germany Italy Spain UK 1995 146 116 255 119 57 1996 152 126 268 126 63 1997 158 136 300 134 70 1998 165 145 346 143 78 1999 171 155 432 154 87 2000 177 165 459 166 84 2001 184 175 501 180 86 2002 190 184 523 198 92 2003 196 194 546 219 82 2004 219 200 640 244 96 2005 241 222 663 265 81 2006 244 241 686 289 88 2007 250 263 656 316 89 2008 238 255 627 348 98 2009 247 268 668 347 94 2010 252 291 631 307 99

7
Source: Polaris Observatory data (accessed in June 2017).
Table S7. Life table by country
UK Germany Spain France Italy Age group Female Male Female Male Female Male Female Male Female Male
<1 year 0.003 0.004 0.003 0.003 0.003 0.004 0.003 0.004 0.003 0.003 1-4 years 0.001 0.001 0.001 0.001 0.001 0.001 0.001 0.001 0.001 0.001 5-9 years 0 0 0 0 0 0 0 0 0 0
10-14 years 0 0.001 0 0 0 0 0 0 0 0 15-19 years 0.001 0.001 0.001 0.001 0.001 0.001 0.001 0.002 0.001 0.002 20-24 years 0.001 0.002 0.001 0.002 0.001 0.002 0.001 0.003 0.001 0.003 25-29 years 0.001 0.003 0.001 0.002 0.001 0.002 0.001 0.004 0.001 0.003 30-34 years 0.002 0.004 0.002 0.003 0.001 0.002 0.002 0.004 0.001 0.003 35-39 years 0.003 0.006 0.002 0.004 0.002 0.003 0.003 0.006 0.002 0.004 40-44 years 0.005 0.009 0.004 0.007 0.003 0.006 0.005 0.009 0.004 0.006 45-49 years 0.008 0.012 0.007 0.012 0.006 0.011 0.008 0.015 0.007 0.01 50-54 years 0.013 0.018 0.012 0.021 0.01 0.019 0.013 0.026 0.01 0.016 55-59 years 0.021 0.031 0.019 0.036 0.014 0.03 0.018 0.04 0.015 0.026 60-64 years 0.03 0.046 0.032 0.058 0.02 0.048 0.024 0.052 0.023 0.041 65-69 years 0.047 0.071 0.042 0.076 0.028 0.069 0.034 0.068 0.037 0.067 70-74 years 0.079 0.116 0.068 0.124 0.046 0.101 0.051 0.098 0.062 0.109 75-79 years 0.134 0.184 0.124 0.195 0.095 0.18 0.089 0.159 0.112 0.176 80-84 years 0.24 0.31 0.24 0.329 0.192 0.292 0.172 0.269 0.209 0.294 85-89 years 0.388 0.458 0.417 0.493 0.373 0.476 0.311 0.423 0.358 0.438 90-94 years 0.581 0.629 0.64 0.701 0.59 0.661 0.535 0.639 0.56 0.616 95-99 years 0.771 0.806 0.814 0.838 0.791 0.829 0.759 0.822 0.748 0.773 100+ years 1.000 1.000 1.000 1.000 1.000 1.000 1.000 1.000 1.000 1.000
Source: Global Health Observatory data repository by WHO [13] (accessed in March 2017).
To cross-validate the natural history results of the simulation model, we compared the 10-year cumulative incidence of DC, HCC, and liver-related deaths/liver transplant for cirrhotic patients who achieved/failed SVR between model results and the estimates from a long-term follow-up observational study [15] (Table S8), which showed that our model is well in line with empirical observations.
Table S8. Validation of the natural history outcomes of model
Model results Estimates from observational study Achieved SVR Failed to achieve SVR Achieved SVR Failed to achieve SVR DC 2.6%-3.2% 26.1%-50.1% 2.1% (0-4.5%) 29.9% (24.3%-35.5%) HCC 2.2%-2.8% 17%-35.8% 5.1% (1.3%-8.9%) 21.8% (16.6%-27.0%) LRD or LT 0.3%-0.7% 3.3%-10.6% 1.9% (0-4.1%) 27.4% (22.0%-32.8%)
HCV awareness and diagnosis
We used the awareness rates estimated from the Polaris Observatory for the initial population at the year 2001 by each country. For new viremic HCV infections, we assumed 7.2% of them were aware of their HCV infection based on the percentage of acute HCV cases reported in the US [16].
Each year, unaware individuals could become aware of their HCV infections by screening or usual care. We did not explicitly model the screening policies as they vary significantly by regions; instead, we implemented the diagnosis of HCV by considering an aggregated estimate, diagnosis rate (Table S9), by country to simulate patients’ transitions to awareness status.
Table S9. Awareness rate and newly diagnosis rate per year by country
Parameter Value Reference
Awareness rate at 2001 (Initial awareness rate calibrated to match the estimates at 2001)
2011 230 272 642 359 106 2012 232 272 560 359 114
2013+ 237 272 478 359 127

8
France 35.4% [10] Germany 30.4% [10] Italy 36.5% [10] Spain 20.7% [10] UK 16.0% [10] Newly diagnosis rate (per year) France 4.6% [17] Germany 4.6% Assume the same value as in France. Italy 4.6% Assume the same value as in France. Spain 3.2% [17] UK 3.9% [17]
HCV Treatment Waves
We modeled HCV treatment in different waves reflecting clinical practice. The simulation model starts with peginterferon+ribavirin (PEG+RBV), followed by the launch of first-generation protease inhibitors (PI) for genotype 1 HCV only, boceprevir and telaprevir, in 2011. From 2014, we simulated the availability of non-NS5A inhibitors (denoted by DAA1 non-NS5A) and NS5A inhibitors (denoted by DAA1 NS5A). The DAA treatment landscape and regimens depending on treatment history were presented in Figure S1. The launch year and market share of these DAAs were different by country. For example, non-NS5A and NS5A inhibitors have become available in Germany since 2014, but in other countries since 2015 (see details in Table S10). Note that after the launch of DAAs, old therapeutic options, PEG+RBV/PI were continued to be used for several years. From 2018 onwards, the next generation of NS5A inhibitors (denoted by DAA2 NS5A) became available. Table S10 summarizes the market share of different types of treatment by year and country, which were estimated based on market research data from QuintilesIMS and IPSOS (2015-2016) and projected for future years based on expert opinions. Estimates for year 2014 was calculated based on the following assumptions:
• Genotype 1: We used the same market share value for PI+PR in 2015 and allocated the rest market share for PR in France, Spain, and UK; we assumed 50% PI+PR and 50% PR for Italy (as DAAs were not available yet in these countries). For Germany, we used the same market share in 2016 for PI+PR, and for the rest market share we allocate 1/3 to DAA non-NS5A and 2/3 to DAA NS5A.
• Other genotypes: We assumed 100% PR for France, Italy, Spain, and UK; 1/3 DAA non-NS5A and 2/3 DAA NS5A for Germany.
Table S11 summarizes the SVR rates by treatment, genotype, fibrosis state, and treatment history, which were estimated from multiple clinical trials as well as real-world data from the TRIO and TARGET studies [18].
We further assumed maximum number of treatment for each treatment regimen based on the following rationales: Since PEG-RBV regimen has low SVR rates and is associated with substantial side effects, we assumed that patients would not have more than 2 treatment attempts; we assumed patients to receive first-generation PIs for at most once because the regimen was available only during a short period of time (2012-2013); for DAAs, considering the high SVR rates (>90%) and minimal side effects, there are no major clinical concerns that prevent patients from receiving retreatment after previous treatment failures, and patients could would be very likely to be cured within 3 treatment attempts.

9
Table S10. Market share of different treatment types by country, genotype, and year.
G1 G2 G3 G4 France PI+PR PR DAA-
nonNS5A DAA-NS5A
PR DAA-nonNS5A
DAA-NS5A
PR DAA-nonNS5A
DAA-NS5A
PR DAA-nonNS5A
DAA-NS5A
2014* 1.8% 98.2% - - 100.0% - - 100.0% - - 100.0% - - 2015 1.8%
6.5% 91.7% 9.0% 64.0% 27.0% 2.6% 5.8% 91.7% 4.9% 9.7% 85.4%
2016 0.3%
5.5% 94.2% 4.0% 76.5% 19.5% 2.8% 2.8% 94.4% 1.5% 6.3% 92.2% 2017 -
- 100.0% 10.0% 40.0% 50.0% 100.0% 100.0%
2018+ -
- 100.0% - 10.0% 90.0% 100.0% 100.0% Germany PI+PR PR DAA-
nonNS5A DAA-NS5A
PR DAA-nonNS5A
DAA-NS5A
PR DAA-nonNS5A
DAA-NS5A
PR DAA-nonNS5A
DAA-NS5A
2014 6.5%
31.2% 62.3% 33.3% 66.7%
33.3% 66.7% 0.0% 33.3% 66.7%
2015 6.5%
9.5% 84.0% 22.8% 58.2% 19.0% 5.6% 18.5% 75.8% 4.8% 11.9% 83.3% 2016 6.4%
9.4% 84.2% 26.4% 36.1% 37.5% 8.7% 15.4% 75.9% 5.0% 11.6% 83.5%
2017 -
- 100.0% 12.5% 39.1% 48.4% 20.7% 79.3% 0.0% 100.0% 2018 -
- 100.0% 44.7% 55.3% 20.7% 79.3% 0.0% 100.0%
Italy PI+PR PR DAA-nonNS5A
DAA-NS5A
PR DAA-nonNS5A
DAA-NS5A
PR DAA-nonNS5A
DAA-NS5A
PR DAA-nonNS5A
DAA-NS5A
2014 50.0% 50.0% -
100.0% 100.0% 100.0% 2015 19.6%
19.8% 60.5% 41.9% 41.9% 16.2% 13.5% 23.0% 63.5% 13.9% 20.8% 65.3%
2016 14.4%
11.6% 74.0% 27.6% 41.1% 31.3% 11.4% 13.2% 75.4% 9.9% 12.3% 77.8% 2017 -
- 100.0% 90.0% 10.0% 100.0% 100.0%
2018 -
- 100.0%
90.0% 100.0% 100.0%
Spain PI+PR PR DAA-nonNS5A
DAA-NS5A
PR DAA-nonNS5A
DAA-NS5A
PR DAA-nonNS5A
DAA-NS5A
PR DAA-nonNS5A
DAA-NS5A
2014 3.6% 96.4%
- 100.0% 0.0% 0.0% 100.0% 0.0% 0.0% 100.0%
2015 3.6%
13.7% 82.7% 26.2% 66.7% 7.1% 5.4% 14.4% 80.2% 4.0% 12.1% 83.8% 2016 1.2%
3.6% 95.2% 2.4% 76.2% 21.4% 2.9% 7.2% 89.9% 1.8% 2.6% 95.6%
2017 100.0% 90.0% 10.0% 100.0% 100.0% 2018 100.0%
90.0% 100.0% 100.0%
UK PI+PR PR DAA-nonNS5A
DAA-NS5A
PR DAA-nonNS5A
DAA-NS5A
PR DAA-nonNS5A
DAA-NS5A
PR DAA-nonNS5A
DAA-NS5A
2014 39.8% 60.2%
- 100.0% 0.0% 0.0% 100.0% 0.0% 0.0% 100.0%
2015 39.8%
9.2% 51.0% 59.3% 22.2% 18.5% 39.2% 18.4% 42.5% 38.5% 5.8% 55.8% 2016 20.0%
8.8% 71.2% 40.2% 29.9% 29.9% 34.5% 28.8% 36.7% 22.3% 13.6% 64.1%
2017 100.0% 25.0% 25.0% 50.0% 100.0% 100.0% 2018+ 100.0% 100.0% 100.0% 100.0%

10
Table S11. SVR rates by treatment, genotype, treatment history, and fibrosis states.
Treatment history and fibrosis state GT1 GT2 GT3 GT4–6 PEG+RBV [1, 19-23] Treatment naïve
F0-F3 0.54 0.82 0.70 0.58 F4 0.36 0.64 0.49 0.32 Contraindicated with modifiable reasons F0-F2 - 0.66 0.56 0.46 F3 0.43 0.66 0.56 0.46 F4 0.28 0.51 0.40 0.26 Failed PEG+RBV: relapse
F0-F3 0.27 0.71 0.66 0.31 F4 0.13 0.56 0.52 0.24 Failed PEG+RBV: partial response
F0-F3 0.18 0.69 0.64 0.31 F4 0.10 0.55 0.51 0.24 Failed PEG+RBV: null response
F0-F3 0.10 0.54 0.50 0.31 F4 0.05 0.42 0.39 0.24 BOC/TEL+PEG+RBV (GT1 only)
[1, 24-27]
Treatment naïve
F0-F3 0.75 - - - F4 0.62 - - - Contraindicated with modifiable reasons F0-F2 - - - - F3 0.5 - - - F4 0.36 - - - Failed PEG+RBV: relapse
F0-F2 0.87 - - - F3 0.85 - - - F4 0.84 - - - Failed PEG+RBV: partial response
F0-F2 0.72 - - - F3 0.56 - - - F4 0.56 - - - Failed PEG+RBV: null response
F0-F2 0.41 - - - F3 0.39 - - - F4 0.14 - - - DAA1 non-NS5A1
[28-31]
Treatment naïve
F0-F3 0.9 0.9 0.85 0.9 F4 0.8 0.8 0.6 0.8 Contraindicated with modifiable and non-modifiable reasons F0-F3 0.9 0.9 0.9 0.9 F4 0.7 0.7 0.6 0.7 Failed PEG+RBV: relapse
F0-F3 0.9 0.9 0.85 0.9 F4 0.8 0.7 0.6 0.75 Failed PEG+RBV: partial and null response F0-F3 0.9 0.9 0.85 0.9 F4 0.75 0.7 0.6 0.75 Failed first-generation PI
F0-F3 0.9 - - - F4 0.7 - - - Failed DAA NS5A (during 2015-2018, only for cirrhotic)
F0-F3 - - - - F4 0.8 0.8 0.6 0.8 DAA1 NS5A2
Treatment naïve, contraindicated, failed PEG+RBV, failed BOC/TEL+PEG+RBV (GT1 only), failed DAA non-NS5A, failed DAA nonNS5A
[32-40]
F0-F3 0.95 0.99 0.95 0.99 F4 0.9 0.99 0.9 0.99 DAA2 NS5A (next generation)3 All conditions [41-45] F0-F3 0.95 0.99 0.95 0.99 F4 0.9 0.99 0.9 0.99

11
1DAA1 non-NS5A includes the following drug combinations: SOF+PEG+/-RBV, SOF+/-RBV, SOF+SMV+/-RBV, and SMV+PEG+/-RBV. 2DAA1 NS5A includes the following drug combinations: LDV/SOF+/-RBV, SOF+DCV, DCV+PEG+/-RBV, OBV/PTV/r+DSV+/-RBV, OBV/PTV/r+/-RBV, EBR/GZR, and SOF/VEL. 3DAA2 NS5A includes the next wave of drug combinations such as SOF/VEL/VOX, and glecaprevir/pibrentasivr for selected subgroups. Though these drugs became available in mid 2017, the SVR status of patients receiving them would become available from 2018 onwards; therefore, we noted 2018 as the year for this wave of DAAs. Abbreviations: PEG, peginterferon; RBV, ribavirin; BOC, boceprevir; TEL, telaprevir; DAA, direct-acting antiviral; NS5A, nonstructural protein 5A; SOF, sofosbuvir; SMV, simeprevir; LDV, ledipasvir; DCV, daclatasvir; OBV, ombitasvir; PTV, paritaprevir; r, ritonavir; DSV, dasabuvir; EBR, elbasvir; GZR, grazoprevir; VEL, velpatasvir; VOX, voxilaprevir
HCV Treatment uptake
If patients are aware of their infection, they were considered candidates for treatment. In our simulation model, we assumed that one patient can receive PBV+PR at most twice, PI at most once, and DAA at most 3 times. Before the next-generation NS5A inhibitor (DAA2 NS5A) became available in 2018, patients who failed DAA1 NS5A could be re-treated with DAA1 non-NS5A only if he is cirrhotic; after 2018, all patients who have failed DAA are re-treated with DAA2 NS5A.
The number of patients who were treated each year before 2014 were estimated from the Polaris Observatory [10]. Treatment numbers and capacities for 2014 onwards were estimated and projected based on Gilead’s market research data and expert opinions (Table S12). When treatment capacity was not sufficient to cover all treatment candidates, patients in F3 and F4 states were prioritized for treatment.
Table S12. Number of patients treated and treatment capacity by country and year.
Note. Estimates before 2014 were based on the Polaris Observatory data. Projections for treatment capacity for 2015 and onwards are based on Gilead’s internal projections and expert opinions.
Additional model validation based on UK report for hepatitis C
Our model results were validated with additional data from UK report for hepatitis C [46, 47] as follows:
• Treatment capacity during 2007-2017: We found the numbers of treatment during 2007-2017 closely match the provisional estimates from the UK report [46] (see below figure).
Year France Germany Italy Spain UK 2000 8103 0 0 0 2436 2001 9097 0 0 0 2436 2002 10091 0 0 0 2436 2003 11086 0 0 0 2436 2004 11870 14272 18282 9226 2436 2005 13183 16256 16334 9809 3449 2006 14482 13790 15233 10289 3867 2007 14751 13887 12977 9486 4421 2008 13407 14083 12295 11788 5455 2009 11666 13943 11865 10758 6074 2010 10482 12649 10482 9822 6488 2011 10482 12649 10482 9822 6281 2012 10482 13500 10482 9822 6777 2013 7000 10500 10482 9822 6529 2014 14000 17500 10482 9822 6281 2015 15055 23804 30855 39486 8341 2016 15055 23804 31674 39486 12254 2017 15055 23804 33005 39486 15713 2018 15055 23804 33800 39486 17201
2019+ 15055 23804 33800 39486 18650

12
• In the Hepatitis C Treatment Report [47], an SVR12 of 95.2% was reported with majority of the treatment being DAAs, which is also in line with the magnitude of the SVR values used in our model (Supplement S1, Table S11).
• The report [47] showed that around one third (32%) had cirrhosis prior to treatment. Our model also showed 30%-40% patients receiving treatment are cirrhotic during 2014-2016.

13
Supplement S2. Sensitivity and Scenario Analyses
Probabilistic Sensitivity Analysis
We performed probabilistic sensitivity analyses (PSA) to assess impact of input parameter uncertainty on the model results. Given that our model input parameters include several different types of parameters, including point estimates (e.g., transition probabilities), probability distribution (e.g., distribution of age, fibrosis, and genotype), and time-series inputs (e.g., transplant capacity by year). We defined the uncertainty for each type of parameters as follows (Table S13).
We assumed Beta distribution for probability parameters (state transition probability, male distribution, awareness rates, diagnosis rates, and the chronic infection ratio). The mean μ was determined by the baseline value, and the standard deviation σ is determined by the 1/4 range of the reported confidence interval if available (assuming the confidence interval covers the range µ±2σ), or 20% of baseline value μ. For several SVR estimates with very high baseline values (e.g., 0.95, and 0.99, mostly for NS5A DAAs), the Beta distribution with σ=20%μ is not properly defined. Instead, we simply assumed that the SVR values for NS5A DAAs vary uniformly within ±5% range, and other values follow the Beta distribution with σ/μ=20%.
For distribution estimates, such as age, fibrosis, genotype distributions, we assumed these estimates follow Dirichlet distribution. In particular, given a distribution estimate (𝑝𝑝1, 𝑝𝑝2,⋯ , 𝑝𝑝𝑁𝑁)~Dir(𝛼𝛼1,⋯ ,𝛼𝛼𝑁𝑁), the variance of each component can be calculated as 𝑉𝑉𝑉𝑉𝑉𝑉[𝑝𝑝𝑘𝑘] = 𝛼𝛼𝑘𝑘(𝛼𝛼0−𝛼𝛼𝑘𝑘)
𝛼𝛼02(𝛼𝛼0+1)
. We estimated the parameters (𝛼𝛼1,⋯ ,𝛼𝛼𝑁𝑁) by setting the ratio
of standard deviation to mean (σ/μ) to be at most 20%.
We performed PSA with 5000 samples. Model output uncertainty was represented by 95% uncertainty interval (2.5th -97.5th percentile) for each model outcome.
Table S13. Sampling distribution for model parameters in probabilistic sensitivity analyses. Parameter Distribution Parameter 1 Parameter 2
State Transitions F0 to F1 Beta 285.98 2158.26 F1 to F2 Beta 239.77 2581.00 F2 to F3 Beta 351.88 2580.45 F3 to F4 Beta 304.40 2319.73 F4 to DC Beta 4.87 120.08 F4 to HCC Beta 0.64 44.75 Post-SVR F4 to DC Beta 0.87 107.97 Post-SVR F4 to HCC Beta 3.28 653.57 DC to HCC Beta 24.48 335.51 Mortality of DC in first year Beta 27.56 123.89 Mortality of DC in subsequent years Beta 11.29 89.55 Mortality of HCC Beta 5.52 7.41 Mortality of liver transplant in first year Beta 1.35 10.31 Mortality of liver transplant in subsequent years Beta 3.96 86.04 Chronic infection ratio Beta 80.82 22.80 Awareness ratio among new incidences Beta 23.18 307.96 Awareness ratio in the initial population Betaa 0.20 - Male % Betaa 0.20 - Diagnosis rate Betaa 0.20 - SVR for NS5A DAAs (changes to baseline value) Uniform -0.05 +0.05 SVR for other treatment regimens Betaa 0.20 Distribution estimates Genotype Dirichleta 0.20 - Age of initial population Dirichleta 0.20 - Age of new HCV incidences Dirichleta 0.20 - Fibrosis state of initial population Dirichleta 0.20 - a Distribution parameters depend on parameter baseline values. Parameters for the Beta distribution were estimated by assuming the standard deviation-mean ratio (σ/μ) = 20%. Parameters for the Dirichlet distribution were estimated by assuming the largest standard deviation-mean ratio (max
𝑘𝑘𝜎𝜎𝑘𝑘/𝜇𝜇𝑘𝑘 ) = 20%.

14
Scenario analysis
In the base case analysis, projected HCV incidence estimates (Table S5) assumed a relative trajectory in future, which may not capture the potential increase due to the spreading opioid epidemic such as in the US. For the treatment capacity, we did not include a small portion of patients who received treatment via compassionate use or clinical trials. To assess the potential impact of such two assumptions, we performed additional scenario analyses as follows, and provided the summary of key model outcomes in Supplement S3 Table S14.
• Scenario 1: Increasing HCV incidence. Since there are limited data for estimating the increasing HCV incidences in the 5 European countries studied in this analysis, we used the increasing trends in HCV incidences as observed in the US during 2007-2016 [48]. It is estimated that the HCV incidence increases by 8% per year, and we applied such increases for 2019-2028 and assumed constant from 2028 onwards.
• Scenario 2: Increasing treatment capacity. We estimated that the number of patients receiving DAA treatments via compassionate use or clinical trials would be minimal, with approximately 1-2% of the total patient population, based on expert’s opinions. In our scenario analysis, we assumed 5% of the original treatment capacity estimates as additional treatment capacities to account for such treated cases.

15
Supplement S3. Additional Results
Table S14. Summary of main model results for probabilistic sensitivity analysis and scenario analyses.
France Base case
(Uncertainty interval) Scenario 1
(Percentage of change)
Scenario 2 (Percentage of
change) Projected number of viremic patients in year 2030
90,625 (75,531 - 109,044) 116,635 (28.7%) 90,719 (0.1%)
Projected number of patients with SVR in year 2030
173,387 (144,551 - 203,841) 181,120 (4.5%) 173,541 (0.1%)
First year when the number of patients with SVR exceeds those of viremic patients
2021 (2020 - 2023) 2022 2021
Diagnosis rate by 2030 70.7% (67.0% - 73.7%) 65.0% (-8.1%) 70.8% (0.1%) Number of viremic patients remaining undiagnosed by 2030
71,777 (61,236 - 85,207) 97,583 (36.0%) 71,626 (-0.2%)
Number of treatment in total, 2014-2030
191,121 (159,599 - 221,865) 199,262 (4.3%) 191,942 (0.4%)
Number of NS5A DAA treatment, 2014-2030
171,235 (139,321 - 202,409) 179,310 (4.7%) 170,907 (-0.2%)
Treatment coverage by 2030 70.7% (66.9% - 73.6%) 64.9% (-8.1%) 70.7% (0.1%) Number of treatment failure, 2014-2030
17,766 (13,877 - 27,203) 18,126 (2.0%) 18,144 (2.1%)
Treatment experienced patients (alive without achieving SVR) in 2030
2,203 (845 - 4,071) 2,297 (4.3%) 2,255 (2.4%)
Decompensated cirrhosis developed from patients who failed to achieve SVR, 2014-2030
10,935 (4,113 - 18,701) 11,068 (1.2%) 10,968 (0.3%)
HCC developed from patients who failed to achieve SVR, 2014-2030
10,709 (3,336 - 19,558) 10,701 (-0.1%) 10,752 (0.4%)
Germany Base case
(Uncertainty interval) Scenario 1
(Percentage of change)
Scenario 2 (Percentage of
change) Projected number of viremic patients in year 2030
107,258 (89,826 - 127,892) 133,646 (24.6%) 107,108 (-0.1%)
Projected number of patients with SVR in year 2030
193,011 (162,860 - 224,527) 200,738 (4.0%) 193,075 (0.0%)
First year when the number of patients with SVR exceeds those of viremic patients
2019 (2018 - 2020) 2019 2019
Diagnosis rate by 2030 69.7% (65.8% - 72.8%) 64.5% (-7.4%) 69.8% (0.1%) Number of viremic patients remaining undiagnosed by 2030
84,220 (71,912 - 100,284) 110,600 (31.3%) 83,878 (-0.4%)
Number of treatment in total, 2014- 211,426 (173,651 - 247,599) 219,756 (3.9%) 211,759 (0.2%)

16
2030 Number of NS5A DAA treatment, 2014-2030
177,436 (139,717 - 213,499) 185,076 (4.3%) 176,912 (-0.3%)
Treatment coverage by 2030 69.5% (65.6% - 72.7%) 64.4% (-7.4%) 69.6% (0.1%) Number of treatment failure, 2014-2030
16,873 (11,502 - 27,804) 17,182 (1.8%) 17,010 (0.8%)
Treatment experienced patients (alive without achieving SVR) in 2030
1,921 (893 - 3,484) 2,024 (5.4%) 1,951 (1.6%)
Decompensated cirrhosis developed from patients who failed to achieve SVR, 2014-2030
12,295 (4,633 - 20,252) 12,098 (-1.6%) 12,305 (0.1%)
HCC developed from patients who failed to achieve SVR, 2014-2030
12,916 (4,351 - 21,957) 12,997 (0.6%) 13,108 (1.5%)
Spain Base case
(Uncertainty interval) Scenario 1
(Percentage of change)
Scenario 2 (Percentage of
change) Projected number of viremic patients in year 2030
127,750 (102,751 - 156,635) 139,064 (8.9%) 127,612 (-0.1%)
Projected number of patients with SVR in year 2030
190,188 (152,492 - 230,657) 192,833 (1.4%) 190,324 (0.1%)
First year when the number of patients with SVR exceeds those of viremic patients
2019 (2019 - 2023) 2020 2019
Diagnosis rate by 2030 67.7% (63.4% - 71.0%) 65.4% (-3.3%) 67.7% (0.0%) Number of viremic patients remaining undiagnosed by 2030
90,984 (72,976 - 115,966) 102,026 (12.1%) 90,962 (0.0%)
Number of treatment in total, 2014-2030
242,185 (199,694 - 285,740) 244,809 (1.1%) 242,562 (0.2%)
Number of NS5A DAA treatment, 2014-2030
218,373 (175,660 - 260,401) 220,982 (1.2%) 217,760 (-0.3%)
Treatment coverage by 2030 67.6% (63.2% - 70.9%) 65.3% (-3.3%) 67.6% (0.0%) Number of treatment failure, 2014-2030
20,604 (14,147 - 38,282) 20,777 (0.8%) 20,811 (1.0%)
Treatment experienced patients (alive without achieving SVR) in 2030
1,772 (663 - 3,522) 1,774 (0.1%) 1,683 (-5.0%)
Decompensated cirrhosis developed from patients who failed to achieve SVR, 2014-2030
25,050 (9,258 - 41,927) 25,177 (0.5%) 24,936 (-0.5%)
HCC developed from patients who failed to achieve SVR, 2014-2030
22,195 (6,597 - 41,150) 22,161 (-0.2%) 22,090 (-0.5%)
Italy Base case
(Uncertainty interval) Scenario 1
(Percentage of change)
Scenario 2 (Percentage of
change) Projected number of viremic 168,939 (130,138 - 302,238) 204,352 (21.0%) 167,935 (-0.6%)

17
patients in year 2030 Projected number of patients with SVR in year 2030
366,076 (280,360 - 412,975) 371,809 (1.6%) 366,862 (0.2%)
First year when the number of patients with SVR exceeds those of viremic patients
2026 (2024 - 2029) 2027 2026
Diagnosis rate by 2030 74.7% (70.1% - 78.1%) 70.7% (-5.3%) 74.6% (-0.1%) Number of viremic patients remaining undiagnosed by 2030
124,670 (102,970 - 155,351) 156,281 (25.4%) 125,193 (0.4%)
Number of treatment in total, 2014-2030
539,427 (456,783 - 545,416) 545,416 (1.1%) 547,304 (1.5%)
Number of NS5A DAA treatment, 2014-2030
484,237 (401,287 - 506,494) 490,173 (1.2%) 489,952 (1.2%)
Treatment coverage by 2030 74.4% (61.3% - 76.5%) 69.8% (-6.3%) 74.5% (0.1%) Number of treatment failure, 2014-2030
37,109 (22,630 - 87,266) 37,697 (1.6%) 38,178 (2.9%)
Treatment experienced patients (alive without achieving SVR) in 2030
3,399 (1,006 - 11,553) 3,990 (17.4%) 2,576 (-24.2%)
Decompensated cirrhosis developed from patients who failed to achieve SVR, 2014-2030
30,773 (11,449 - 55,188) 30,948 (0.6%) 30,962 (0.6%)
HCC developed from patients who failed to achieve SVR, 2014-2030
27,444 (7,867 - 53,947) 27,631 (0.7%) 27,151 (-1.1%)
UK Base case
(Uncertainty interval) Scenario 1
(Percentage of change)
Scenario 2 (Percentage of
change) Projected number of viremic patients in year 2030
88,857 (75,095 - 110,505) 109,847 (23.6%) 88,725 (-0.1%)
Projected number of patients with SVR in year 2030
139,193 (115,667 - 159,158) 145,441 (4.5%) 138,996 (-0.1%)
First year when the number of patients with SVR exceeds those of viremic patients
2020 (2019 - 2026) 2020 2020
Diagnosis rate by 2030 65.2% (61.2% - 68.7%) 60.4% (-7.4%) 65.2% (-0.1%) Number of viremic patients remaining undiagnosed by 2030
74,267 (62,573 - 88,129) 95,451 (28.5%) 74,314 (0.1%)
Number of treatment in total, 2014-2030
139,397 (113,377 - 161,357) 145,886 (4.7%) 139,640 (0.2%)
Number of NS5A DAA treatment, 2014-2030
123,339 (97,389 - 145,302) 129,828 (5.3%) 122,846 (-0.4%)
Treatment coverage by 2030 65.1% (61.1% - 68.6%) 60.3% (-7.4%) 65.1% (-0.1%) Number of treatment failure, 2014-2030
12,001 (9,173 - 16,571) 12,350 (2.9%) 12,262 (2.2%)
Treatment experienced patients (alive without achieving SVR) in 2030
819 (312 - 2,122) 870 (6.2%) 788 (-3.8%)
18
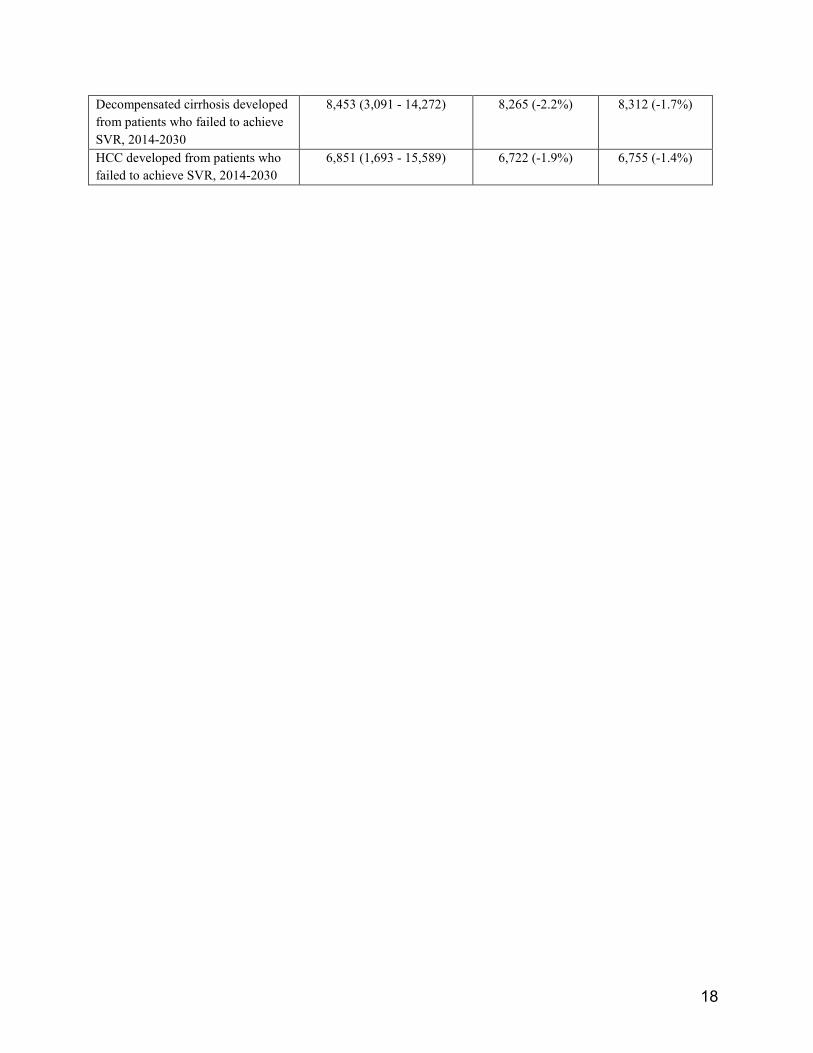
Decompensated cirrhosis developed from patients who failed to achieve SVR, 2014-2030
8,453 (3,091 - 14,272) 8,265 (-2.2%) 8,312 (-1.7%)
HCC developed from patients who failed to achieve SVR, 2014-2030
6,851 (1,693 - 15,589) 6,722 (-1.9%) 6,755 (-1.4%)

19
Figure S3. Number of patients who failed treatment each year from 2014 to 2030 by presence or absence of cirrhosis.
20
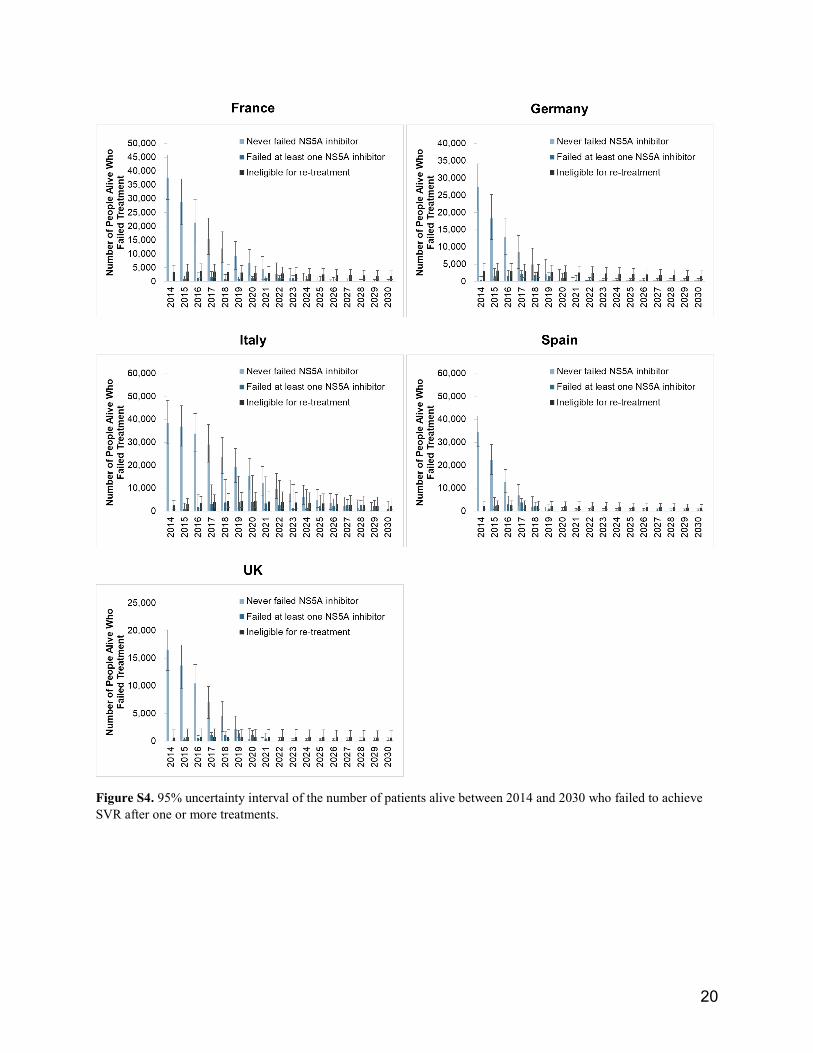
Figure S4. 95% uncertainty interval of the number of patients alive between 2014 and 2030 who failed to achieve SVR after one or more treatments.

21
Reference
1. Kabiri, M., et al., The changing burden of hepatitis C in the United States: Model-based predictions. Annals of Internal Medicine, 2014. 161(3): p. 170-180.
2. Gungabissoon, U., M. Balogun, and M. Ramsay, Hepatitis C virus: laboratory surveillance in England and Wales, 1992–2004. Epidemiology & Infection, 2007. 135(4): p. 541-548.
3. Brouard, C., et al., The undiagnosed chronically-infected HCV population in France. Implications for expanded testing recommendations in 2014. PloS one, 2015. 10(5): p. e0126920.
4. Schröter, M., et al., Epidemiological dynamics of hepatitis C virus among 747 German individuals: new subtypes on the advance. Journal of clinical microbiology, 2002. 40(5): p. 1866-1868.
5. Fusco, M., et al., Epidemiology of viral hepatitis infections in an area of southern Italy with high incidence rates of liver cancer. European Journal of Cancer, 2008. 44(6): p. 847-853.
6. Buti, M., et al., Profiles and clinical management of hepatitis C patients in Spain: disHCovery study. Revista Española de Quimioterapia, 2015. 28(3).
7. Brant, L., et al., Sentinel laboratory surveillance of hepatitis C antibody testing in England: understanding the epidemiology of HCV infection. Epidemiology & Infection, 2007. 135(3): p. 417-426.
8. Gower, E., et al., Global epidemiology and genotype distribution of the hepatitis C virus infection. Journal of hepatology, 2014. 61(1): p. S45-S57.
9. King, L.A., et al., Assessment and proposal of a new combination of screening criteria for hepatitis C in France. The European Journal of Public Health, 2009. 19(5): p. 527-533.
10. The Polaris Observatory 2017 [cited 2017 June]; Available from: http://polarisobservatory.org/polaris/hepC.htm.
11. Armstrong, G.L., et al., The prevalence of hepatitis C virus infection in the United States, 1999 through 2002. Annals of internal medicine, 2006. 144(10): p. 705-714.
12. Cardoso, A.C., et al., Impact of peginterferon and ribavirin therapy on hepatocellular carcinoma: incidence and survival in hepatitis C patients with advanced fibrosis. Journal of Hepatology, 2010. 52(5): p. 652-657.
13. World Health Organization (WHO). Global Health Observatory data repository: Life table by country. [cited 2017; Available from: http://apps.who.int/gho/data/node.main.LIFECOUNTRY?lang=en.
14. Kabiri, M., et al., The changing burden of hepatitis C virus infection in the United States: model-based predictions. Annals of internal medicine, 2014. 161(3): p. 170-180.
15. van der Meer, A.J., et al., Association between sustained virological response and all-cause mortality among patients with chronic hepatitis C and advanced hepatic fibrosis. JAMA, 2012. 308(24): p. 2584-93.
16. European Centre for Disease Prevention and Control, Systematic review on hepatitis B and C prevalence in the EU/EEA. 2016: Stockholm.
17. Razavi, H., et al., The present and future disease burden of hepatitis C virus (HCV) infection with today's treatment paradigm. Journal of viral hepatitis, 2014. 21(s1): p. 34-59.
18. EASL Recommendations on Treatment of Hepatitis C 2018. J Hepatol, 2018. 69(2): p. 461-511. 19. Shiffman, M.L., et al., Peginterferon Alfa-2a and Ribavirin for 16 or 24 Weeks in HCV Genotype 2
or 3. New England Journal of Medicine, 2007. 357(2): p. 124-134. 20. McHutchison, J.G., et al., Peginterferon Alfa-2b or Alfa-2a with Ribavirin for Treatment of
Hepatitis C Infection. New England Journal of Medicine, 2009. 361(6): p. 580-593. 21. Talal, A., et al., Absolute and relative contraindications to pegylated‐interferon or ribavirin in
the US general patient population with chronic hepatitis C: results from a US database of over 45

22
000 HCV‐infected, evaluated patients. Alimentary pharmacology & therapeutics, 2013. 37(4): p. 473-481.
22. Shiffman, M.L., et al., Peginterferon Alfa-2a and ribavirin in patients with chronic hepatitis C who have failed prior treatment1, 2, 3 1 2 3. Gastroenterology, 2004. 126(4): p. 1015-1023.
23. Poynard, T., et al., Peginterferon alfa-2b and ribavirin: effective in patients with hepatitis C who failed interferon alfa/ribavirin therapy. Gastroenterology, 2009. 136(5): p. 1618-28.
24. Jacobson, I.M., et al., Telaprevir for previously untreated chronic hepatitis C virus infection. New England Journal of Medicine, 2011. 364(25): p. 2405-2416.
25. Poordad, F., et al., Boceprevir for untreated chronic HCV genotype 1 infection. New England Journal of Medicine, 2011. 364(13): p. 1195-1206.
26. Bacon, B.R., et al., Boceprevir for previously treated chronic HCV genotype 1 infection. New England Journal of Medicine, 2011. 364(13): p. 1207-1217.
27. Zeuzem, S., et al., Telaprevir for retreatment of HCV infection. New England Journal of Medicine, 2011. 364(25): p. 2417-2428.
28. Lawitz, E., et al., Sofosbuvir for previously untreated chronic hepatitis C infection. New England Journal of Medicine, 2013. 368(20): p. 1878-1887.
29. Jacobson, I.M., et al., Sofosbuvir for hepatitis C genotype 2 or 3 in patients without treatment options. New England Journal of Medicine, 2013. 368(20): p. 1867-1877.
30. Lawitz, E., et al., Simeprevir plus sofosbuvir, with or without ribavirin, to treat chronic infection with hepatitis C virus genotype 1 in non-responders to pegylated interferon and ribavirin and treatment-naive patients: the COSMOS randomised study. The Lancet, 2014. 384(9956): p. 1756-1765.
31. Zeuzem, S., et al., Sofosbuvir and ribavirin in HCV genotypes 2 and 3. New England Journal of Medicine, 2014. 370(21): p. 1993-2001.
32. Kowdley, K.V., et al., Ledipasvir and sofosbuvir for 8 or 12 weeks for chronic HCV without cirrhosis. New England Journal of Medicine, 2014. 370(20): p. 1879-1888.
33. Sulkowski, M.S., et al., Daclatasvir plus sofosbuvir for previously treated or untreated chronic HCV infection. New England Journal of Medicine, 2014. 370(3): p. 211-221.
34. Afdhal, N., et al., Ledipasvir and sofosbuvir for previously treated HCV genotype 1 infection. N Engl J Med, 2014. 370(16): p. 1483-93.
35. Feld, J.J., et al., Treatment of HCV with ABT-450/r-ombitasvir and dasabuvir with ribavirin. N Engl J Med, 2014. 370(17): p. 1594-603.
36. Ferenci, P., et al., ABT-450/r–Ombitasvir and Dasabuvir with or without Ribavirin for HCV. New England Journal of Medicine, 2014. 370(21): p. 1983-1992.
37. Poordad, F., et al., ABT-450/r-ombitasvir and dasabuvir with ribavirin for hepatitis C with cirrhosis. N Engl J Med, 2014. 370(21): p. 1973-82.
38. Zeuzem, S., et al., Retreatment of HCV with ABT-450/r-ombitasvir and dasabuvir with ribavirin. N Engl J Med, 2014. 370(17): p. 1604-14.
39. Flisiak, R., et al., Real-world effectiveness and safety of ombitasvir/paritaprevir/ritonavir +/- dasabuvir +/- ribavirin in hepatitis C: AMBER study. Aliment Pharmacol Ther, 2016. 44(9): p. 946-956.
40. Feld, J.J., et al., Sofosbuvir and Velpatasvir for HCV Genotype 1, 2, 4, 5, and 6 Infection. New England Journal of Medicine, 2015. 373(27): p. 2599-2607.
41. Roth, D., et al., Grazoprevir plus elbasvir in treatment-naive and treatment-experienced patients with hepatitis C virus genotype 1 infection and stage 4–5 chronic kidney disease (the C-SURFER study): a combination phase 3 study. The Lancet, 2015. 386(10003): p. 1537-1545.

23
42. Forns, X., et al., Grazoprevir and elbasvir plus ribavirin for chronic HCV genotype-1 infection after failure of combination therapy containing a direct-acting antiviral agent. Journal of hepatology, 2015. 63(3): p. 564-572.
43. Burstow, N.J., et al., Hepatitis C treatment: where are we now? International Journal of General Medicine, 2017. 10: p. 39-52.
44. Bourlière, M., et al., Sofosbuvir, Velpatasvir, and Voxilaprevir for Previously Treated HCV Infection. New England Journal of Medicine, 2017. 376(22): p. 2134-2146.
45. Forns, X., et al., Glecaprevir plus pibrentasvir for chronic hepatitis C virus genotype 1, 2, 4, 5, or 6 infection in adults with compensated cirrhosis (EXPEDITION-1): a single-arm, open-label, multicentre phase 3 trial. The Lancet Infectious Diseases, 2017. 17(10): p. 1062-1068.
46. Public Health England, Hepatitis C in the UK: 2018 report. 2018. 47. Public Health England, Hepatitis C treatment monitoring in England. 2018. 48. Centers for Disease Control and Prevention. Disease Burden from Viral Hepatitis A, B, and C in
the United States. 2018 [cited 2019 January]; Available from: https://www.cdc.gov/hepatitis/statistics/DiseaseBurden.htm.