supplemental advice 4011-g-a/5375-e-a · supplemental advice 4011-g-a/5375-e-a (pacific gas and...
TRANSCRIPT

Erik Jacobson Director Regulatory Relations
Pacific Gas and Electric Company 77 Beale St., Mail Code B13U P.O. Box 770000 San Francisco, CA 94177
Fax: 415-973-3582
October 29, 2018
Supplemental Advice 4011-G-A/5375-E-A (Pacific Gas and Electric Company ID U 39 M)
Public Utilities Commission of the State of California
Subject: Supplemental: PG&E’s 2019 Energy Efficiency Annual Budget Advice Letter in Compliance with Decision 15-10-028 and 18-05-041
I. Purpose
The purpose of this Supplemental Advice Letter (AL) is to update Pacific Gas and Electric Company’s (PG&E’s) 2019 Energy Efficiency (EE) Annual Budget Advice Letter (ABAL) submitted on September 4, 2018, at the request of the California Public Utilities Commission’s (CPUC or Commission) Energy Division (ED).1
On October 1, 2018, PG&E received an email from ED requesting PG&E to supplement AL 4011-G/5375-E to include additional detail regarding its Finance Program assumptions, EM&V budget allocation, unspent and uncommitted funds, statewide funding, Energy Atlas, and portfolio performance using only approved workpapers as of September 4, 2018 where applicable.2
This Supplemental AL includes PG&E’s original portfolio cost-effectiveness showing, updated with savings and cost-effectiveness based on deemed values from approved workpapers where applicable. PG&E requests that the Commission approve PG&E’s 2019 EE budget as submitted on September 4, 2018.
1 PG&E’s AL was submitted in compliance with the Decision Re Energy Efficiency Goals for 2016 and Beyond and Energy Efficiency Rolling Portfolio Mechanics, D. 15-10-028, Ordering Paragraph (OP) 4.
2 October 1, 2018 email from Peter Franzese re: PG&E Advice Letter 4011-G/5375-E.

Advice 4011-G-A/5375-E-A - 2 - October 29, 2018
III. Discussion
A. Finance Program Assumptions
The Commission requested that PG&E provide additional detail for its Finance program savings forecast assumptions related to measures and customer classes, as well an explanation of a decrease in Finance program savings down to zero in 2020.
1. Savings Estimates for 2019
PG&E is projecting the deployment of $60 million of on-bill-financing (OBF) loans in 2019, which is consistent with the growth in the OBF Program. OBF loan volume by year, with projections for 2018 totals, are below.
Table 1. Loan Amounts Issued by Year ($ millions)34
Cumulative through 2012 2013 2014 2015 2016 2017 2018
Projected 9.3 14.2 17.8 17.8 16.7 24.2 40.0
For projects that receive an incentive and an OBF loan, savings will be reported through the incentive program. PG&E anticipates approximately one-third ($20 million) of the total $60 million OBF loan volume in 2019 to be provided without incentives.
For projects that do not receive an incentive, but do receive an OBF loan, savings will be claimed under the OBF Alternative Pathway subprogram.5 PG&E anticipates approximately two-thirds ($40 million) of the total $60 million OBF loan volume in 2019 to be provided without incentives. This estimate is based on a review of the current OBF project pipeline, and discussions with industry participants. The $40 million in loans provided without incentives would convert into an estimated first year savings claim of net 63 GWh.6
3 For values 2012-2017, See PG&E Petition to Modify Decision 09-09-047 to implement PG&E’s Energy Efficiency Business Plan, Attachment B accessible at http://docs.cpuc.ca.gov/PublishedDocs/Efile/G000/M226/K778/226778237.PDF 4 2018 projection based on loans issued and, in the pipeline, as of October 23 2018 ($33m) 5 OBF Alternative Pathway subprogram approved through AL 3697-G/4812-E accessible via https://www.pge.com/tariffs/tm2/pdf/GAS_3697-G.pdf 6 To convert from loan value ($m) to Gwh, divide the loan value by the Kwh rate and the average payback period. PG&E used assumptions of an average of 3.2-year payback on the loan, and an average rate of $0.20 to generate this estimate.
Advice 4011-G-A/5375-E-A - 3 - October 29, 2018
PG&E anticipates that the measures funded by OBF would reflect measure types installed across the portfolio with larger loans being used primarily for more comprehensive projects.
As discussed in the 2019 ABAL, PG&E’s ability to meet savings goals will require an adjustment to the OBF loan limits.7 PG&E submitted a Petition to Modify Decision 09-09-047 to Implement PG&E’s Energy Efficiency Business Plan on September 7, 2018, in order to receive authorization to implement these changes to the OBF loan limits through an Advice Letter.8
2. Savings Estimates for 2020 and Beyond
When PG&E submitted the 2018-2025 business plan, savings from Finance programs were not identified separately outside of the sectors. Financing is a tool for influencing the customer to take action. Historically the sector-level reporting has reflected all projected savings irrespective of the mechanism for obtaining those savings. No separate claim was made when a customer took a rebate and an OBF loan – the savings were just reported as part of the rebate program.
PG&E has, however, in the 2019 forecast separately identified the savings associated with the financing programs because PG&E anticipates that the operational mechanism for reporting savings associated with the financing program will primarily be through the OBF Alternative Pathway where no rebates will be reported. PG&E will plan to provide additional reporting that provides a breakdown of the sectors where OBF loans were issued in order to reconcile the 2018-2025 business plan with the reporting from the OBF program.
Table 13 in PG&E’s 2019 ABAL, PG&E kWh True-Up, states that “Savings from Financing and OBF Loan Pool projects are rolled into the savings forecasts for the sectors above for program years 2020 – 2025.”9 The savings associated with the OBF program can therefore be considered embedded in the 2020-2025 forecasts for the sectors rather than broken out separately.
7 PG&E Annual Budget Advice Letter 4011-G/5375-E filed on September 4, 2018 (“PG&E 2019 ABAL 4011-G/5375-E”), p. 32 8 PG&E Petition to Modify Decision 09-09-047 to implement PG&E’s Energy Efficiency Business Plan 9 PG&E 2019 ABAL 4011-G/5375-E, p. 45

Advice 4011-G-A/5375-E-A - 4 - October 29, 2018
B. Evaluation, Measurement, and Verification (EM&V) Budget Allocation
The Commission requested that PG&E and the other IOUs demonstrate that their EM&V budgets are in compliance with the allocation requirement of 27.5% or less of the total evaluation budget shared with the Commission.
As Table 2 shows, the following PA EM&V budgets are all calculated to allocate 27.5% to the PA, and 72.5% to the CPUC.
Table 2. 2019 EM&V Budgets [1]
Program
Administrator (PA)
PA Total without EM&V
Ratio based on
Total without EM&V
EM&V
CPUC
(72.5%)
PA
(27.5%)
PA Total
with EM&V
PG&E $294,988,322 89.53% $12,291,180 $8,911,106 $3,380,075 $307,279,502
BayREN [2] $23,557,000 7.15% $981,542 $711,618 $269,924 $24,538,542
MCE [2] $8,204,000 2.49% $341,833 $247,829 $94,004 $8,545,833
3C-REN [3] $2,719,766 0.83% $113,324 $82,160 $31,164 $2,833,090
Portfolio Total $329,469,088 100.00% $13,727,879 $9,952,712 $3,775,167 $343,196,967 [1] The above table uses the 72.5/27.5 CPUC/PA percentage split for each PA. [2] 2019 BayREN and MCE budgets are the approved budgets per the Business Plan Decision D.18-05-041, with EM&V increased to 4%. [3] 2019 3C-REN budget is the proposed contribution for PG&E as circulated by 3C-REN on August 28, 2018.
C. Unspent/Uncommitted Funds
The Commission requested that PG&E, the other IOUs, and MCE report unspent and uncommitted funds that reflect the total unspent and uncommitted funds for all prior program years through December 31, 2018.
PG&E has updated the Prior Years’ Unspent Funds table (filed as Table 7 in PG&E’s 2019 ABAL filing) with data as of September 2018, in the table shown below. Upon approval of this 2019 ABAL, PG&E’s authorized budget request will be reduced by the unspent fund amount of $157 million per Table 3 below.

Advice 4011-G-A/5375-E-A - 5 - October 29, 2018
Table 3: Prior Years’ Unspent Funds as of September 2018
Pre-2013 PY2013- 2015 PY 2016 PY 2017 PY 2018 [3] Totals
Unspent & Committed EM&V [1] - $5,304,980 $15,672,827 $14,479,143 $12,884,592 $48,341,542 Financing Pilots - $3,712,656 - $226,062 $397,967 $4,336,685
BayREN - $3,760,885 - $42,769 $12,887,993 $16,691,647 MCE (gas funding)
-
$36,182
$104,615
-
$70,079
$210,876
Total - $12,814,702 $15,777,442 $14,747,974 $26,240,631 $69,580,750 Unspent & Uncommitted for 2019 Offset
Utility Program Funds [2]
$271,156
$398,045
$11,649,274
$92,113,416
$52,588,000
$157,019,890
[1] Includes unspent funds from the CPUC ($37.8 million) and PG&E ($10.6 million) [2] 2017 & 2018 committed funds were authorized in AL 3904-G/5175-E, effective December 3, 2017 [3] 2018 unspent & uncommitted funds are end-of-year estimates made in September 2018
D. Statewide Funding
The Commission requested that PG&E and the other IOUs demonstrate compliance with D.18-05-41 by providing funding ratios based on their statewide electric and gas load-shares. Per email direction received from Commission staff on October 24, 2018, PG&E and the other IOUs will not address statewide funding questions in this Supplemental ABAL and will instead address stateside funding questions in response to forthcoming supplemental requests related to the Advice Letters on the IOU’s Shared Funding Mechanism Proposal Pursuant to D.18-05- 041.10
10 Email titled “Re: REQUEST FOR SUPPLEMENTAL: PG&E AL #4011-G/535-E” received from Christina Torok, Commission Staff, on October 24th. PG&E’s Advice Letter 5373-E/4009-G relates to the Shared Funding Mechanism Proposal pursuant to D.18-05-041.

Advice 4011-G-A/5375-E-A - 6 - October 29, 2018
F. Energy Atlas
The Commission requested that PG&E and the other IOUs provide detail on their Energy Atlas expansion budget and annual management and maintenance costs in compliance with D.18-05-041 Ordering Paragraph (OP) 3.
In D.18-05-041, the Commission directed the IOU PAs to select a lead to oversee the statewide deployment of Energy Atlas and competitively solicit a third party to implement the deployment, maintain data quality, consistency and security, continue development of the Energy Atlas’ capabilities and encourage and support local governments that choose to participate.11 With the concurrence of and ongoing coordination with Pacific Gas & Electric Company, San Diego Gas & Electric Company and Southern California Gas Company, SCE will be the lead for representing the IOUs in the statewide deployment of Energy Atlas. SCE’s lead role will include conducting a competitive solicitation for a third party to perform the work described above as necessary. In addition, SCE will confer with and obtain the ongoing approval of the other IOU PAs in the management of the contract and deployment.
D.18-05-041 also directs the IOU PAs to allocate up to $2 million to expand Energy Atlas and include annual Energy Atlas management and maintenance costs in their annual budget advice letters proportionally according to relevant energy efficiency program budgets and references these efforts as part of their local government and public-sector implementation plans. However, because the Energy Atlas proposal has yet to be developed, the IOUs are unable to forecast costs for implementing the Energy Atlas at this time. Therefore, for purposes of the annual budget advice letters, the collective budget of $2,000,000 for development and expansion is a placeholder only and based upon the maximum amount allowed in D.18-05-041. The Energy Atlas development, deployment and maintenance costs are highly uncertain as no implementation plan or scope has yet been agreed upon by the IOUs and will be limited and capped at $2 million. The IOUs will work to minimize these costs as they coordinate on implementation and leverage existing work; it is expected that 2020 budget numbers will be refined in the future to reflect cost forecasts and actual costs incurred as long as within the $2 million cost cap. Total annual placeholder budgets by IOU and their budget shares are provided in Table 4 below. The IOUs have based the budget shares on the relative percentages of their combined 2019 Public Sector budgets. SCE has also allocated an additional budget of $60,000 to manage the requirements development and the competitive solicitation process to be conducted in
11 D.18-05-041, OP 32
Advice 4011-G-A/5375-E-A - 7 - October 29, 2018
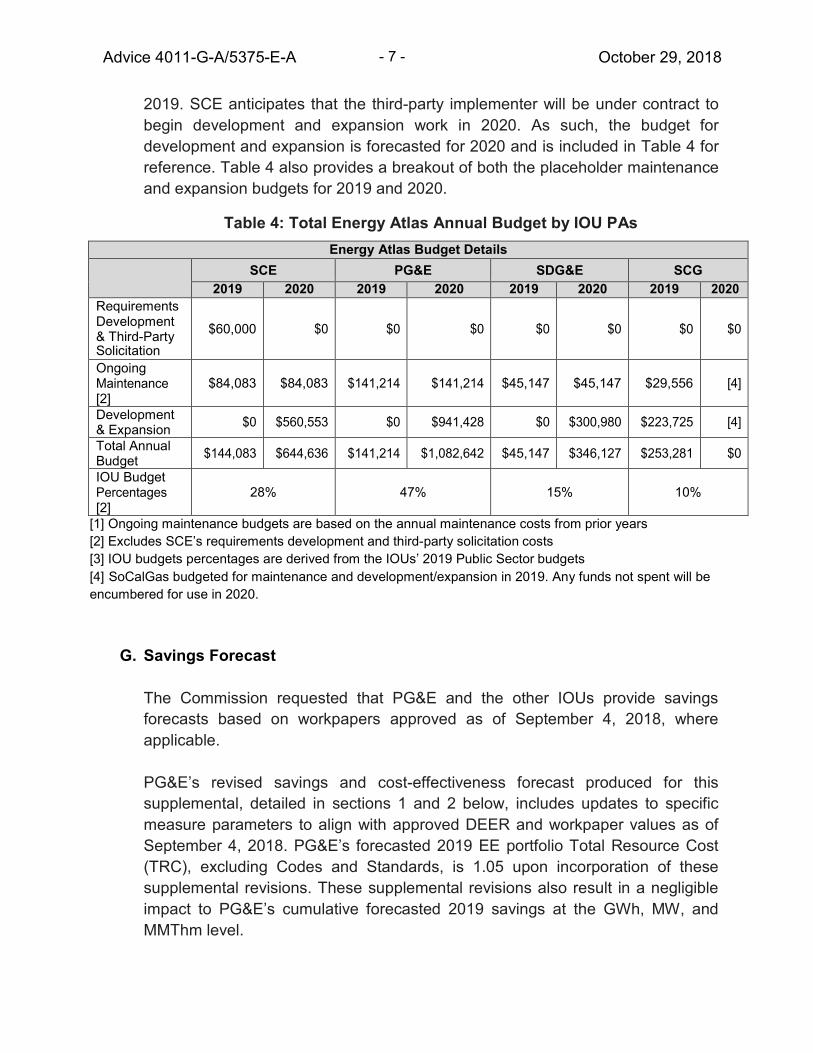
2019. SCE anticipates that the third-party implementer will be under contract to begin development and expansion work in 2020. As such, the budget for development and expansion is forecasted for 2020 and is included in Table 4 for reference. Table 4 also provides a breakout of both the placeholder maintenance and expansion budgets for 2019 and 2020.
Table 4: Total Energy Atlas Annual Budget by IOU PAs
Energy Atlas Budget Details SCE PG&E SDG&E SCG
2019 2020 2019 2020 2019 2020 2019 2020 Requirements Development & Third-Party Solicitation
$60,000
$0
$0
$0
$0
$0
$0
$0
Ongoing Maintenance [2]
$84,083
$84,083
$141,214
$141,214
$45,147
$45,147
$29,556
[4]
Development & Expansion $0 $560,553 $0 $941,428 $0 $300,980 $223,725 [4]
Total Annual Budget $144,083 $644,636 $141,214 $1,082,642 $45,147 $346,127 $253,281 $0
IOU Budget Percentages [2]
28%
47%
15%
10%
[1] Ongoing maintenance budgets are based on the annual maintenance costs from prior years [2] Excludes SCE’s requirements development and third-party solicitation costs [3] IOU budgets percentages are derived from the IOUs’ 2019 Public Sector budgets [4] SoCalGas budgeted for maintenance and development/expansion in 2019. Any funds not spent will be encumbered for use in 2020.
G. Savings Forecast
The Commission requested that PG&E and the other IOUs provide savings forecasts based on workpapers approved as of September 4, 2018, where applicable.
PG&E’s revised savings and cost-effectiveness forecast produced for this supplemental, detailed in sections 1 and 2 below, includes updates to specific measure parameters to align with approved DEER and workpaper values as of September 4, 2018. PG&E’s forecasted 2019 EE portfolio Total Resource Cost (TRC), excluding Codes and Standards, is 1.05 upon incorporation of these supplemental revisions. These supplemental revisions also result in a negligible impact to PG&E’s cumulative forecasted 2019 savings at the GWh, MW, and MMThm level.
Advice 4011-G-A/5375-E-A - 8 - October 29, 2018
To improve the accuracy of its 2019 forecast in its September 4, 2018 filing, PG&E made assumptions about select measures that were active in its portfolio as of September 4, 2018, but for which 2019 changes were anticipated. These assumptions included targeted adjustments to select net-to-gross (NTG) and effective useful life (EUL) measure ex ante parameters in its 2019 forecast to replace default values with values that more accurately reflect the characteristics of those specific measures and the programs in which they are offered, and for which PG&E intends to submit workpaper revisions for anticipated adoption in 2019. The specific NTG and EUL adjustments PG&E made in its 2019 forecast filed on September 4, 2018, as well as the changes made to its forecast for this Supplemental to reflect approved values, are described in section 1 below.
In addition to targeted measure parameter adjustments in its September 4, 2018 filing, PG&E also forecasted the sunset of some measures in 2019 due to expected workpaper updates that would diminish cost-effectiveness, despite approved, cost- effective savings values for those measures as of September 4, 2018. Thus, these measures forecasted as sunset were excluded from PG&E’s 2019 forecast, including several light emitting diode (LED) and water heating measures. For this supplemental AL, PG&E retained the measure sunset assumptions given that the omission of these measures in its forecast do not constitute inclusion of unapproved workpaper values.
Section 2 below provides an overview of the impact of the revised Supplemental forecast on PG&E’s portfolio savings and cost-effectiveness.
1. Supplemental Forecast Revisions
NTG Adjustments
PG&E explained its rational for adjusting select NTG values in its 2019 ABAL submitted on September 4: 12
NTG is also a major driver of portfolio cost-effectiveness and values are often highly outdated and uncertain… in many cases default NTG values must be used for new programs, projects, and measures that have little relation to original research. For instance, the default Residential NTG of 0.55 is employed for the Residential New Construction Program and the California Multifamily New Homes Program. Neither of these programs have been evaluated. Qualitative investigation suggests that production builders targeted by the programs do not
12 PG&E 2019 ABAL 4011-G/5375-E, p.14

Advice 4011-G-A/5375-E-A - 9 - October 29, 2018
incorporate future-year code requirements into their construction practices without intervention. Thus, these programs could reasonably expect a commensurate increase in NTG rations; PG&E’s forecast includes future workpaper updates to reflect these higher NTG ratios.
The NTG values that have been adjusted back to current approved Commission values for this supplemental are listed in the table below.
Table 5. NTG Values Adjusted for Supplemental ABAL
Forecast Value
Description Forecasted Value
Included in September 4 Filing
Approved Value13
Included in October 29 Supplemental Filing
Residential New Construction NTG 0.85 0.55
Multifamily New Construction NTG 0.85 0.55
EUL Adjustments
PG&E explained its rational for adjusting select EUL values in its 2019 ABAL submitted on September 4 (citations removed):14
PG&E has noted the uncertainty around EULs of many programs and measures. The assignment of EULs is often based on very limited information and at times appears to be arbitrary. EULs are among the least-studied EE parameters. For instance, California’s New Construction programs use a 15-year EUL. PG&E believes that the maximum EUL should be used for a program that is spurring the building of above code structures that will be in place for many decades. Therefore, PG&E uses 20-year EULs for these programs in the current forecast. As discussed in PG&E’s Business Plan, new construction programs and other programs and measures, where appropriate, should be eligible for EULs beyond 20 years.
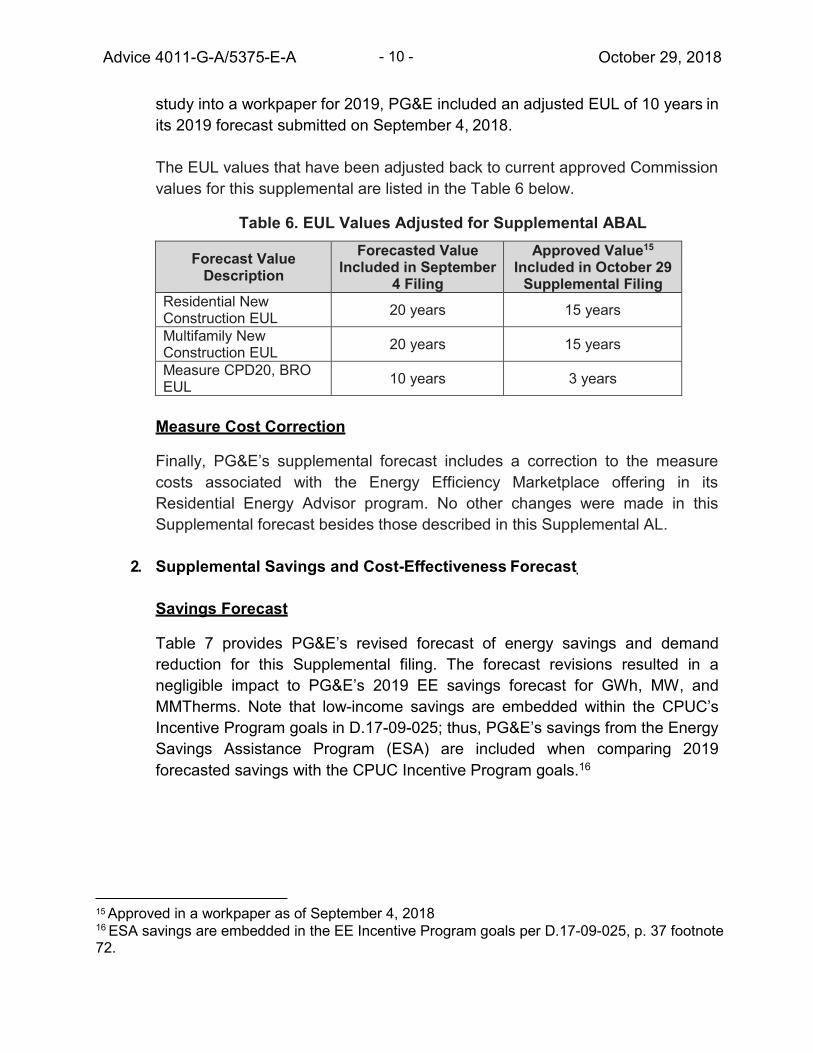
In addition to the Residential and Multifamily New Construction EULs described above, PG&E adjusted the EUL for one agriculture measure, pump overhauls (CPD20). This measure has been classified as “behavioral, retro-commissioning, operational (BRO)” and therefore subject to the default EUL of 3 years. PG&E is currently conducting a study to determine a more appropriate EUL, to be complete by December 2018. In anticipation of incorporating the results of this
13 Approved in a workpaper as of September 4, 2018 14 PG&E 2019 ABAL 4011-G/5375-E, p.16
Advice 4011-G-A/5375-E-A - 10 - October 29, 2018
study into a workpaper for 2019, PG&E included an adjusted EUL of 10 years in its 2019 forecast submitted on September 4, 2018.
The EUL values that have been adjusted back to current approved Commission values for this supplemental are listed in the Table 6 below.
Table 6. EUL Values Adjusted for Supplemental ABAL
Forecast Value Description
Forecasted Value Included in September
4 Filing
Approved Value15
Included in October 29 Supplemental Filing
Residential New Construction EUL 20 years 15 years
Multifamily New Construction EUL 20 years 15 years
Measure CPD20, BRO EUL 10 years 3 years
Measure Cost Correction
Finally, PG&E’s supplemental forecast includes a correction to the measure costs associated with the Energy Efficiency Marketplace offering in its Residential Energy Advisor program. No other changes were made in this Supplemental forecast besides those described in this Supplemental AL.
2. Supplemental Savings and Cost-Effectiveness Forecast
Savings Forecast
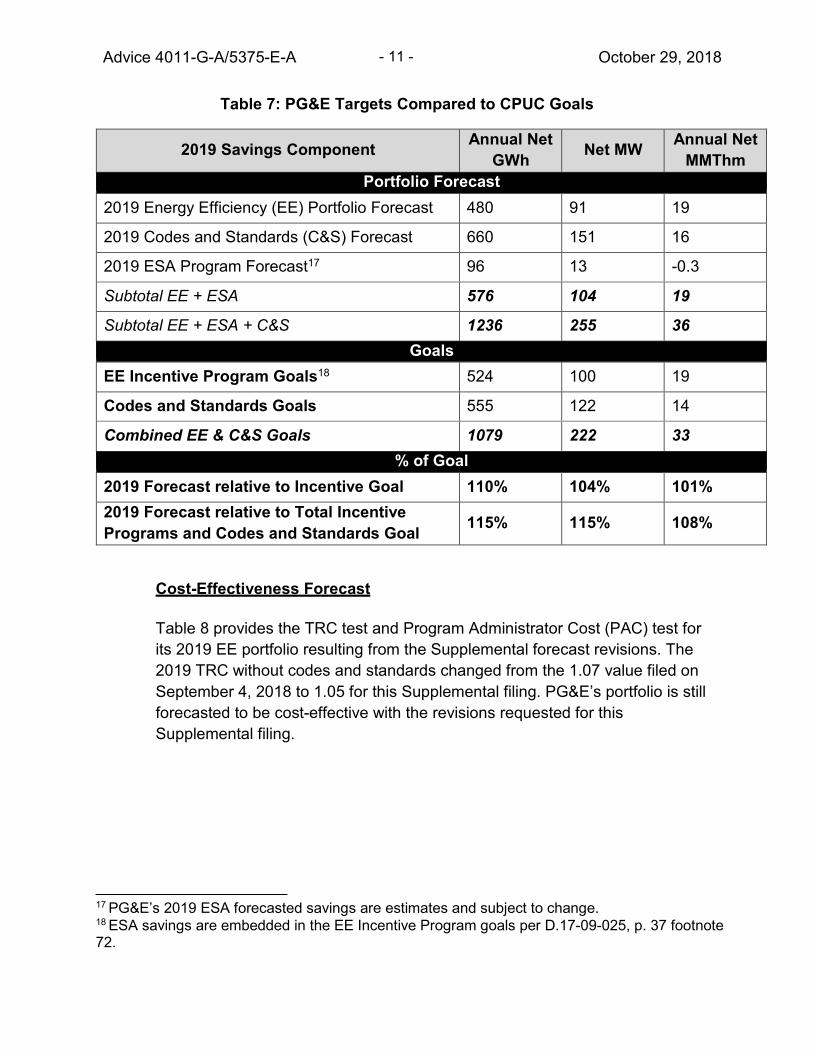
Table 7 provides PG&E’s revised forecast of energy savings and demand reduction for this Supplemental filing. The forecast revisions resulted in a negligible impact to PG&E’s 2019 EE savings forecast for GWh, MW, and MMTherms. Note that low-income savings are embedded within the CPUC’s Incentive Program goals in D.17-09-025; thus, PG&E’s savings from the Energy Savings Assistance Program (ESA) are included when comparing 2019 forecasted savings with the CPUC Incentive Program goals.16
15 Approved in a workpaper as of September 4, 2018 16 ESA savings are embedded in the EE Incentive Program goals per D.17-09-025, p. 37 footnote 72.
Advice 4011-G-A/5375-E-A - 11 - October 29, 2018
Table 7: PG&E Targets Compared to CPUC Goals
2019 Savings Component Annual Net GWh Net MW Annual Net
MMThm Portfolio Forecast
2019 Energy Efficiency (EE) Portfolio Forecast 480 91 19
2019 Codes and Standards (C&S) Forecast 660 151 16
2019 ESA Program Forecast17 96 13 -0.3
Subtotal EE + ESA 576 104 19
Subtotal EE + ESA + C&S 1236 255 36 Goals
EE Incentive Program Goals18 524 100 19
Codes and Standards Goals 555 122 14
Combined EE & C&S Goals 1079 222 33 % of Goal
2019 Forecast relative to Incentive Goal 110% 104% 101% 2019 Forecast relative to Total Incentive Programs and Codes and Standards Goal 115% 115% 108%
Cost-Effectiveness Forecast
Table 8 provides the TRC test and Program Administrator Cost (PAC) test for its 2019 EE portfolio resulting from the Supplemental forecast revisions. The 2019 TRC without codes and standards changed from the 1.07 value filed on September 4, 2018 to 1.05 for this Supplemental filing. PG&E’s portfolio is still forecasted to be cost-effective with the revisions requested for this Supplemental filing.
17 PG&E’s 2019 ESA forecasted savings are estimates and subject to change. 18 ESA savings are embedded in the EE Incentive Program goals per D.17-09-025, p. 37 footnote 72.

Advice 4011-G-A/5375-E-A - 12 - October 29, 2018
Table 8. PG&E 201919 Cost-Effectiveness Statement
Cost-Effectiveness Scenario 2019 TRC Forecast
2019 PAC Forecast
Total portfolio including market effects and the Energy Savings and Performance Incentive (ESPI) award, and excluding C&S
1.05
1.44
Total portfolio including market effects, ESPI award, and C&S 1.27 3.68
As detailed in PG&E’s 2019 ABAL filed on September 4, 2018, TRC and PAC calculations include costs for:
• Resource and non-resource programs, including Financing and Workforce Education and Training (WE&T) programs;
• PG&E’s portion of Statewide DSM; • EM&V; and • An estimated $17 million for PG&E’s ESPI award in 2019.20
TRC and PAC calculations exclude:
• Emerging Technologies (ET) program costs; • Statewide (SW) ME&O costs; • BayREN and MCE benefits and costs;21 • Financing costs including credit enhancements approved for the Statewide
Financing Pilots in D.13-09-044; and • ESA program benefits and costs.
With the changes to the forecast described above, below PG&E provides updated figures (Figures 1 – 4) from its 2019 ABAL submitted on September 4 that show portfolio-level TRC and PAC benefit and cost breakouts, and input sensitivity analyses. The main takeaways for Figures 1 through 4 discussed in PG&E’s September 4 ABAL filing are unchanged after forecast revisions.22
19 The 2019 CET User Interface from CEDARS was used to calculate cost-effectiveness. 20 PG&E’s $17 million ESPI award estimate for 2019 is based on historical trends of ESPI awards
from the past few years with an expected reduction for 2019. 21 D.12-11-015 22 PG&E 2019 ABAL 4011-G/5375-E, pp. 9-12

Advice 4011-G-A/5375-E-A - 13 - October 29, 2018
Figure 1 demonstrates that electric benefits account for the large majority of total TRC benefits and that measure costs account are nearly half of forecast portfolio TRC costs.
Figure 1. 2019 PG&E Portfolio Forecast TRC Parameters
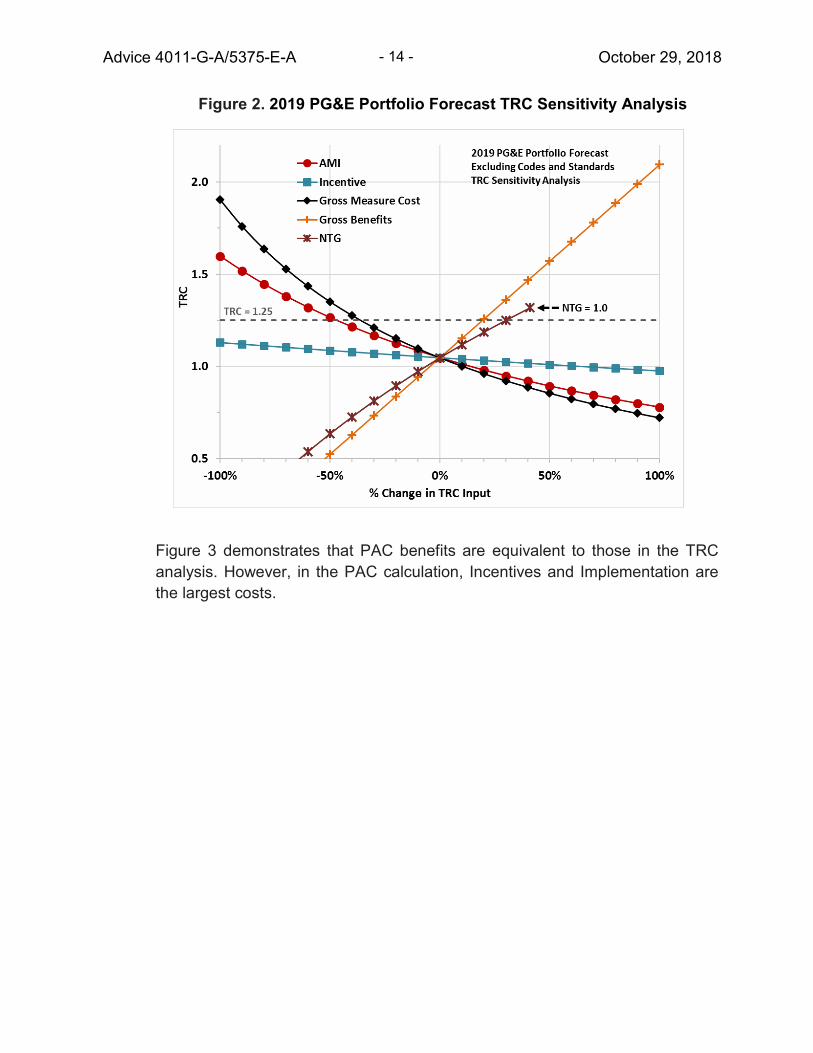
Figure 2 demonstrates that PG&E’s portfolio TRC is most sensitive to measure costs and total benefits. NTG and collective spending on Administration, Marketing, and Implementation (AMI) are less significant but still important TRC drivers. In contrast, portfolio TRC is relatively insensitive to incentive spending.
Advice 4011-G-A/5375-E-A - 14 - October 29, 2018
Figure 2. 2019 PG&E Portfolio Forecast TRC Sensitivity Analysis
Figure 3 demonstrates that PAC benefits are equivalent to those in the TRC analysis. However, in the PAC calculation, Incentives and Implementation are the largest costs.

Advice 4011-G-A/5375-E-A - 15 - October 29, 2018
Figure 3. 2019 PG&E Portfolio Forecast PAC Parameters
Figure 4 demonstrates that, compared to the TRC, the PAC is far more sensitive to AMI spending. The PAC is also more sensitive to NTG and incentive spending. However, because the PAC does not include measure costs, changes in measure cost yield no change in the PAC.

Advice 4011-G-A/5375-E-A - 16 - October 29, 2018
Figure 4. 2019 PG&E Portfolio Forecast PAC Sensitivity Analysis
Updated Summary Tables
The following tables from PG&E’s ABAL filed on September 4th have been updated to reflect a) supplemental forecast revisions, and b) the distribution of the government partnerships program savings according to the applicable business plan sectors in which savings are expected to occur. Additionally, Tables 10 through 12 below include revisions to the 2018 ESA program savings forecasts to align with the forecast estimates filed in PG&E’s 2018 ABAL.23
In PG&E’s 2019 ABAL filed on September 4th, budget and savings shown under the “public” sector reflected the savings for all government partnership program activities, and not just those activities occurring in public facilities. The savings for the public sector in this Supplemental ABAL shown in Tables 9 through 12 have been updated to only reflect forecasted savings for program activities serving public customers; similarly, the forecasted savings for the commercial, agricultural, and industrial sectors have been updated to reflect activities from government partnership programs occurring in facilities in those sectors. The
23 PG&E Annual Budget Advice Letter 3881-G/5137-E filed on September 1, 2017

Advice 4011-G-A/5375-E-A - 17 - October 29, 2018
Table 9 budgets are unchanged from the sector budgets included in PG&E’s September 4th ABAL.
Table 9: PG&E 2019 Budget and Savings Summary
PA PY FORECAST ENERGY SAVINGS (Net)
Sector
Program Year (PY) Budget
PA forecast kWh
PA forecast kW
PA forecast therms (MM)
Residential $88,269,075 206,526,680 41,435 7.1 Commercial $68,402,537 122,895,358 20,725 4.8 Industrial $24,785,481 39,881,461 4,957 2.5 Agriculture $14,477,981 32,209,657 9,431 0.5 Emerging Tech $7,760,943 na na na Public $40,669,461 14,745,172 2,334 0.3 WE&T $9,741,738 na na na Finance $6,504,117 63,333,333 12,033 3.9 OBF Loan Pool $13,500,000 na na na IOU Subtotal $274,111,334 479,591,662 90,916 19 ESA Savings 96,463,923 13,327 (0.3) IOU Total Program Savings (w/out C&S) 576,055,585 104,242 19
CPUC Program Savings Goal 524,000,000 100,000 19 Forecast savings as % of CPUC Program Savings Goal 110% 104% 100%
Codes and Standards $20,876,988 659,736,442 150,796 16 IOU EM&V $12,291,180 IOU PY Spending Budget Request1 $307,279,502
(LESS) IOU Uncommitted and Unspent Carryover Balance2 $157,019,890
IOU PY Budget Recovery Request3 $150,259,612
IOU Authorized PY Budget Cap (D.18-05-041)4 $388,989,738
MCE PY Budget Recovery Request (excl. CCA Uncommitted/Unspent Carryover)5 $8,127,076
BayREN PY Budget Recovery Request (excl. REN Uncommitted/Unspent Carryover) $24,538,542
3C-REN PY Budget Recovery Request (excl. REN Uncommitted/Unspent Carryover) $2,833,090
Total PA (IOU+CCAs+RENs ) PY Recovery Budget $185,758,320
IOU Forecast PY TRC 1.07 IOU Forecast PY PAC 1.47
For reference only MCE EM&V PY Budget $341,833 BayREN EM&V PY Budget $981,542 3C-REN EM&V PY Budget $113,324 EM&V PY PA Budget total $13,727,879
1 This is the amount by which Statewide 25% requirement will be measured, and what the IOU intends to spend in the PY, including carryovers. 2 The balance of unspent uncommitted reflects the total unspent uncommitted starting Jan 1, 2018 through Dec 31 of current year (PY-1). Because each ABAL is filed in Q3, this unspent uncommitted amount is an estimate for the year in which the ABAL is filed. 3 The amount of funds to be collected (budget recovery) for the Program Year 4 The IOU Authorized PY Budget Cap uses the "Total Program" budget from PG&E’s approved Business Plan Table 1.5, plus an EM&V budget of $15,559,690, or 4% of the IOU Authorized PY Budget Cap. 5 MCE Budget Recovery Request excludes unspent funds of $418,757 filed as of September 4, 2018, detailed on p.22 of PG&E's 2019 ABAL.

Advice 4011-G-A/5375-E-A - 18 - October 29, 2018
Table 10: PG&E kWh True-Up
Annual Rolling Portfolio Savings Forecast - True-up (kWh)1
Sector 2018 2019 2020 2021 2022 2023 2024 2025 Residential 221,707,977 206,526,680 165,000,000 163,000,000 169,000,000 175,000,000 181,000,000 181,000,000 Commercial 148,582,487 122,895,358 140,000,000 148,000,000 158,000,000 167,000,000 180,000,000 180,000,000 Industrial 75,513,811 39,881,461 40,000,000 39,000,000 39,000,000 38,000,000 38,000,000 38,000,000 Agriculture 52,381,675 32,209,657 40,000,000 40,000,000 41,000,000 42,000,000 43,000,000 43,000,000 Emerging Tech n/a n/a n/a n/a n/a n/a n/a n/a Public 90,491,009 14,745,172 29,000,000 29,000,000 29,000,000 30,000,000 30,000,000 30,000,000 WE&T n/a n/a n/a n/a n/a n/a n/a n/a Finance2 4,328,542 63,333,333 - - - - - - OBF Loan Pool2 n/a n/a n/a n/a n/a n/a n/a n/a IOU - Subtotal 593,005,502 479,591,662 414,000,000 419,000,000 436,000,000 452,000,000 472,000,000 472,000,000 ESA Savings 74,639,501 96,463,923 TBD TBD TBD TBD TBD TBD MCE Programs 19,319,492 19,319,492 22,549,802 22,549,802 78,004,696 78,004,696 78,004,696 78,004,696 BayREN Programs 6,957,000 6,957,000 6,957,000 21,259,000 21,259,000 21,259,000 21,259,000 27,227,000 3C-REN Programs 706,000 706,000 1,628,000 1,628,000 1,628,000 2,765,000 2,765,000 2,765,000 Total Forecast Portfolio Savings 667,645,003 576,055,585 414,000,000 419,000,000 436,000,000 452,000,000 472,000,000 472,000,000 CPUC Goal 448,000,000 524,000,000 517,000,000 558,000,000 568,000,000 576,000,000 588,000,000 605,000,000 % of Goal 149% 110% 80% 75% 77% 78% 80% 78% Codes and Standards 856,811,593 659,736,442 381,000,000 326,000,000 295,000,000 254,000,000 240,000,000 240,000,000
1 "Reset" 2018 budget at or below 2018 annual budget approved in Business plan Decision. "True-up" years 2019-2025. 2018 budget represents PG&E's 2018 CEDARS Filing Budget (with $548K DSM split 50/50 Res/Com) and the BP Decision Authorized 2018 budgets for BayREN and MCE, adjusted for 4% EM&V. 4. 2 This is what PG&E intends to spend in the PY, including carryovers, as well as the amount by which Statewide 25% requirement will be measured, with the inclusion of statewide program budgets authorized in D.13-09-044 and D.16-09-020 3 Sum of all PA budgets in IOU Service Area 4 IOU only Subtotal (Line 13) + IOU EM&V (Line 14) 5 2019 BayREN and MCE budgets are the authorized amounts from the BP Decision, with their EM&V budget increased to be 4% of their total budget. 2020-2025 BayREN and MCE budgets are the authorized amounts from the BP Decision, with their EM&V budget increased to be 4% of their total budget. 6 2019 3C-REN budget is the proposed contribution for PG&E as circulated by 3C-REN on August 28, 2018, which includes 4% EM&V. Used same budget for 2020-2025.

Advice 4011-G-A/5375-E-A - 19 - October 29, 2018
Table 11: PG&E kW True-Up
Annual Rolling Portfolio Savings Forecast - True-up (kW)1
Sector 2018 2019 2020 2021 2022 2023 2024 2025 Residential 35,617 41,435 11,800 10,900 10,400 8,700 8,700 9,900 Commercial 22,318 20,725 28,700 30,500 32,500 36,700 41,200 44,700 Industrial 13,947 4,957 4,000 3,900 3,800 3,700 3,600 3,600 Agriculture 10,099 9,431 2,400 2,500 2,500 2,600 2,600 2,700 Emerging Tech n/a n/a n/a n/a n/a n/a n/a n/a Public 12,633 2,334 2,800 3,000 3,300 3,900 4,400 4,900 WE&T n/a n/a n/a n/a n/a n/a n/a n/a Finance2 992 12,033 - - - - - - OBF Loan Pool2 n/a n/a n/a n/a n/a n/a n/a n/a IOU - Subtotal 95,606 90,916 49,700 50,800 52,500 55,600 60,500 65,800 ESA Savings 76,831 13,327 TBD TBD TBD TBD TBD TBD MCE Programs 1,710 1,710 1,251 1,251 3,595 3,595 3,595 3,595 BayREN Programs 1,770 1,770 1,770 5,560 5,560 5,560 5,560 9,570 3C-REN Programs 500 500 1,200 1,200 1,200 2,100 2,100 2,100 Total Forecast Portfolio Savings (w/out C&S) 172,437 104,242 49,700 50,800 52,500 55,600 60,500 65,800 CPUC Goal 84,000 100,000 97,000 106,000 108,000 110,000 112,000 116,000 % of Goal 205% 104% 51% 48% 49% 51% 54% 57% Codes and Standards 165,202 150,796 101,000 94,000 90,000 84,000 82,000 82,000
1 Numbers for 2020 - 2025 represent savings forecast as presented in the Business Plan. PG&E will reassess savings goals in future years based on solicitation progress and Potential Study updates, and will strive to achieve goals put forth in future Potential Study updates.
2 Savings from Financing and OBF Loan Pool projects are rolled into the savings forecasts for the sectors above for program years 2020 - 2025.

Advice 4011-G-A/5375-E-A - 20 - October 29, 2018
Table 12: PG&E Therm True-Up
Annual Rolling Portfolio Savings Forecast - True-up (therms)1
Sector 2018 2019 2020 2021 2022 2023 2024 2025 Residential 4,483,968 7,109,676 5,700,000 5,700,000 6,000,000 6,200,000 6,700,000 7,200,000 Commercial 4,653,218 4,784,700 1,900,000 2,100,000 2,300,000 2,500,000 2,700,000 2,800,000 Industrial 7,148,899 2,542,573 4,300,000 4,200,000 4,200,000 4,100,000 4,100,000 4,000,000 Agriculture 1,227,494 520,572 200,000 200,000 200,000 200,000 200,000 200,000 Emerging Tech n/a n/a n/a n/a n/a n/a n/a n/a Public 854,024 340,648 300,000 400,000 400,000 500,000 500,000 500,000 WE&T n/a n/a n/a n/a n/a n/a n/a n/a Finance2 421,791 3,907,667 - - - - - - OBF Loan Pool2 n/a n/a n/a n/a n/a n/a n/a n/a IOU - Subtotal 18,789,394 19,205,834 12,400,000 12,600,000 13,100,000 13,500,000 14,200,000 14,700,000 ESA Savings 1,967,722 (296,372) TBD TBD TBD TBD TBD TBD MCE Programs 815,817 815,817 1,555,065 1,555,065 5,219,615 5,219,615 5,219,615 5,219,615 BayREN Programs 900,000 900,000 900,000 1,927,000 1,927,000 1,927,000 1,927,000 2,577,000 3C-REN Programs 65,000 65,000 157,000 157,000 157,000 276,000 276,000 276,000 Total Forecast Portfolio Savings (w/out C&S) 20,757,116 18,909,462 12,400,000 12,600,000 13,100,000 13,500,000 14,200,000 14,700,000 CPUC Goal 17,000,000 19,000,000 18,000,000 20,000,000 23,000,000 24,000,000 24,000,000 24,000,000 % of Goal 122% 100% 69% 63% 57% 56% 59% 61% Codes and Standards 15,397,524 16,394,386 6,000,000 6,000,000 6,000,000 6,000,000 5,000,000 5,000,000
1 Numbers for 2020 - 2025 represent savings forecast as presented in the Business Plan. PG&E will reassess savings goals in future years based on solicitation progress and Potential Study updates, and will strive to achieve goals put forth in future Potential Study updates. 2 Savings from Financing and OBF Loan Pool projects are rolled into the savings forecasts for the sectors above for program years 2020 - 2025.
Advice 4011-G-A/5375-E-A - 21 - October 29, 2018
H. Public Sector Program Clarification
In its 2019 ABAL, PG&E had signaled its intention to sunset the Local Government Energy Action Resources Program (LGEAR, PGE2110051) because, while “LGEAR traditionally sought to test and develop new partnership programs as well as augment existing partnerships, the portfolio’s shift toward a third-party outsourced model obviates the need to stand up new partnerships and offerings through LGEAR.” 24
In this supplemental filing, PG&E clarifies that it plans to keep the LGEAR program open for 2019 to enable the regional direct install implementers to serve customers outside of the precisely defined local government partnership boundaries. This will allow customers to be served more quickly and effectively. As stated in PG&E’s 2019 ABAL, LGEAR will not be used to stand up new partnerships in 2019 in anticipation of the portfolio’s shift toward third-party outsourcing.
IV. Conclusion
PG&E respectfully requests that the Commission approve PG&E’s 2019 EE budget as filed on September 4, 2018.
V. Protests
PG&E asks that the Commission, pursuant to GO 96-B, General Rule 7.5.1, maintain the original protest and comment period designated in Advice 4011-G-/5375-E and not reopen the protest period as the information in this advice letter reflects the direction of Energy Division.
VI. Effective Date
PG&E requests that this Tier 2 advice filing become effective on January 1, 2019.
VII. Notice
In accordance with General Order 96-B, Section IV, a copy of this advice letter is being sent electronically and via U.S. mail to parties shown on the attached list and the parties on the service lists for R.13-11-005, A.17-01-013 et al. Address changes to the General
24 PG&E 2019 ABAL 4011-G/5375-E, pp. 31

Advice 4011-G-A/5375-E-A - 22 - October 29, 2018
Order 96-B service list should be directed to PG&E at email address [email protected]. For changes to any other service list, please contact the Commission’s Process Office at (415) 703-2021 or at [email protected]. Send all electronic approvals to [email protected]. Advice letter filings can also be accessed electronically at: http://www.pge.com/tariffs/.
/S/ Erik Jacobson Director, Regulatory Relations
Attachments • Attachment 1 – California Energy Data and Reporting System (CEDARS) Filing
Confirmation • Attachment 2 – Appendices
cc: Peter Franzese, Energy Division Service List R.13-11-005 Service List A.17-01-013 et al
ADVICE LETTER S U M M A R Y ENERGY UTILITY
MUST BE COMPLETED BY UTILITY (Attach additional pages as needed) Company name/CPUC Utility No.: Pacific Gas and Electric Company (ID U39M)
Utility type: Contact Person: Yvonne Yang ✔ ELC ✔ GAS WATER Phone #: (415)973-2094
E-mail: [email protected] PLC HEAT
EXPLANATION OF UTILITY TYPE
E-mail Disposition Notice to: [email protected]
(Date Submitted / Received Stamp by CPUC) ELC = Electric PLC = Pipeline
GAS = Gas HEAT = Heat WATER = Water
Advice Letter (AL) #: 4011-G-A/5375-E-A Tier Designation: 2 Subject of AL: Supplemental: PG&E’s 2019 Energy Efficiency Annual Budget Advice Letter in Compliance with
Decisions 15-10-028 and 18-05-041
Keywords (choose from CPUC listing): Energy Efficiency, Compliance AL Type: Monthly Quarterly ✔ Annual One-Time Other: If AL submitted in compliance with a Commission order, indicate relevant Decision/Resolution #: D. 15-10-028 and D. 18-05-041
Does AL replace a withdrawn or rejected AL? If so, identify the prior AL: No
Summarize differences between the AL and the prior withdrawn or rejected AL:
Confidential treatment requested? Yes ✔ No If yes, specification of confidential information: Confidential information will be made available to appropriate parties who execute a nondisclosure agreement. Name and contact information to request nondisclosure agreement/ access to confidential information:
Resolution required? Yes ✔ No
Requested effective date: 1/1/19
Estimated system annual revenue effect (%): N/A
Estimated system average rate effect (%): N/A
No. of tariff sheets: N/A
When rates are affected by AL, include attachment in AL showing average rate effects on customer classes (residential, small commercial, large C/I, agricultural, lighting).
Tariff schedules affected: N/A
Service affected and changes proposed1: N/A
Pending advice letters that revise the same tariff sheets: N/A
1Discuss in AL if more space is needed.
Clear Form

Protests and all other correspondence regarding this AL are due no later than 20 days after the date of this submittal, unless otherwise authorized by the Commission, and shall be sent to:
Name: Erik Jacobson, c/o Megan Lawson CPUC, Energy Division Title: Director, Regulatory Relations Attention: Tariff Unit Utility Name: Pacific Gas and Electric Company 505 Van Ness Avenue San Francisco, CA 94102 Email: [email protected]
Address: 77 Beale Street, Mail Code B13U City: San Francisco, CA 94177 State: California Zip: 94177
Telephone (xxx) xxx-xxxx: (415)973-2093 Facsimile (xxx) xxx-xxxx: (415)973-3582
Email: [email protected]
Name: Title: Utility Name: Address: City: State: District of Columbia Zip:
Telephone (xxx) xxx-xxxx: Facsimile (xxx) xxx-xxxx: Email:
Clear Form
Advice 4011-G-A/5375-E-A October 29, 2018
Attachment 1
California Energy Data and Reporting System (CEDARS) Filing Confirmation

CEDARS FILING SUBMISSION RECEIPT
The PGE portfolio filing has been submitted and is now under review. A summary of the filing is provided below.
PA: Pacific Gas & Electric (PGE)
Filing Year: 2019
Submitted: 12:47:44 on 29 Oct 2018
By: Jennifer Roecks
Advice Letter Number: 4011-G/5375-E
* Portfolio Filing Summary *
- TRC: 1.271 - PAC: 3.6832 - TRC (no admin): 1.661 - PAC (no admin): 11.5266 - RIM: 0.5761 - Budget: $293,779,502.05
* Programs Included in the Filing *
- PGE21001: Residential Energy Advisor - PGE210010: Pay for Performance Pilot - PGE210011: Residential Energy Fitness program - PGE21002: Residential Energy Efficiency - PGE21003: Multifamily Energy Efficiency - PGE21004: Energy Upgrade California - PGE21005: Residential New Construction - PGE21006: Residential HVAC - PGE21007: California New Homes Multifamily - PGE21008: Enhance Time Delay Relay - PGE21009: Direct Install for Manufactured and Mobile Homes - PGE21011: Commercial Calculated Incentives - PGE210112: School Energy Efficiency - PGE210119: LED Accelerator - PGE21012: Commercial Deemed Incentives - PGE210123: Healthcare Energy Efficiency Program - PGE21013: Commercial Continuous Energy Improvement - PGE210135: Water Infrastructure and System Efficiency - PGE210139: SEI Energize Schools Program - PGE21014: Commercial Energy Advisor - PGE210143: Hospitality Program - PGE21015: Commercial HVAC

- PGE21018: EnergySmart Grocer - PGE21021: Industrial Calculated Incentives - PGE210210: Industrial Recommissioning Program - PGE210211: Light Industrial Energy Efficiency - PGE210212: Compressed Air and Vacuum Optimization Program - PGE210213: Small Petrochemical Energy Efficiency - PGE21022: Industrial Deemed Incentives - PGE21023: Industrial Continuous Energy Improvement - PGE21024: Industrial Energy Advisor - PGE21025: California Wastewater Process Optimization - PGE21026: Energy Efficiency Services for Oil Production - PGE21027: Heavy Industry Energy Efficiency Program - PGE21029: Refinery Energy Efficiency Program - PGE21030: Industrial Strategic Energy Management - PGE21031: Agricultural Calculated Incentives - PGE210311: Process Wastewater Treatment EM Pgm for Ag Food Processing - PGE210312: Dairy and Winery Industry Efficiency Solutions - PGE21032: Agricultural Deemed Incentives - PGE21033: Agricultural Continuous Energy Improvement - PGE21034: Agricultural Energy Advisor - PGE21036: Industrial Refrigeration Performance Plus - PGE21039: Comprehensive Food Process Audit & Resource Efficiency Pgm - PGE21041: Primary Lighting - PGE21042: Lighting Innovation - PGE21043: Lighting Market Transformation - PGE21051: Building Codes Advocacy - PGE21052: Appliance Standards Advocacy - PGE21053: Compliance Improvement - PGE21054: Reach Codes - PGE21055: Planning and Coordination - PGE21056: Code Readiness - PGE21057: National Codes and Standards Advocacy - PGE21061: Technology Development Support - PGE21062: Technology Assessments - PGE21063: Technology Introduction Support - PGE21071: Integrated Energy Education and Training - PGE21072: Connections - PGE21073: Strategic Planning - PGE21076: Career and Workforce Readiness - PGE21081: Statewide DSM Coordination & Integration - PGE21091: On-Bill Financing (excludes Loan Pool) - PGE210911: On-Bill Financing Alternative Pathway - PGE21091LP: Financing Loan Pool Addition - PGE21092: Third-Party Financing - PGE21093: New Financing Offerings - PGE2110011: California Community Colleges - PGE2110012: University of California/California State University - PGE2110013: State of California

- PGE2110014: Department of Corrections and Rehabilitation - PGE2110051: Local Government Energy Action Resources (LGEAR) - PGE2110052: Strategic Energy Resources - PGE211007: Association of Monterey Bay Area Governments (AMBAG) - PGE211009: East Bay - PGE211010: Fresno - PGE211011: Kern - PGE211012: Madera - PGE211013: Marin County - PGE211014: Mendocino/Lake County - PGE211015: Napa County - PGE211016: Redwood Coast - PGE211018: San Luis Obispo County - PGE211019: San Mateo County - PGE211020: Santa Barbara - PGE211021: Sierra Nevada - PGE211022: Sonoma County - PGE211023: Silicon Valley - PGE211024: San Francisco - PGE211025: Savings by Design (SBD) - PGE211026: North Valley - PGE211027: Sutter Buttes - PGE211028: Yolo - PGE211029: Solano - PGE211030: Northern San Joaquin Valley - PGE211031: Valley Innovative Energy Watch (VIEW) - PGE_EMV: Evaluation Measurement and Verification - PGE_ESA: Energy Savings Assistance - PGE_ESPI: Energy Savings Performance Index - PGE_SWMEO: Statewide Marketing Education and Outreach - PGE_WATER: Water Energy Nexus

Advice 4011-G-A/5375-E-A October 29, 2018
Attachment 2
Appendices

PA Name: Pacific Gas and Electric Company Budget Year: 2019
Table 1 -Bill Payer Impacts - Rates by Customer Class
Electric Average Rate (Res and Non-Res) $/kwh
Gas Average Rate (Res and Non-Res)
$/therm
Total Average Bill Savings by
Year ($)
Total Average Lifecycle Bill Savings ($)
Present Rates - System Average
2013 $ 0.16088 $ 1.18081 $ 152,246,518 $ 1,553,692,551 2014 $ 0.16891 $ 1.24800 $ 161,566,746 $ 1,557,176,408 2015 $ 0.17094 $ 1.50984 $ 226,868,285 $ 2,396,414,536 2016 $ 0.18423 $ 1.66679 $ 263,727,662 $ 2,670,876,906 2017 $ 0.19092 $ 1.59360 $ 300,032,228 $ 3,316,129,816 2018 $ 0.19545 $ 1.53810 $ 277,809,754 $ 3,064,704,836
Notes: 1) Average first year electric bill savings is calculated by multiplying an average electric rate with first year net kWh energy savings. 2) Average first year gas bill savings is calculated by multiplying an average gas rate with first year net therm energy savings. 3) Total average first year bill savings is the sum of Notes 1 and 2. 4) Average lifecycle electric bill savings is calculated by multiplying an average electric rate with lifecycle net kWh energy savings. 5) Average lifecycle gas bill savings is calculated by multiplying an average gas rate with lifecycle net therm energy savings. 6) Total average lifecycle bill savings is the sum of Notes 4 and 5. 7) As of 3/1/2018, the bundles average electric rate is $0.19545 8) As of 7/1/2018, the bundled average gas rate is $1.507 per therm before the impact of EE programs. 9) Total Average Bill Savings by Year and Lifecycle Bill Savings include C&S net lifecycle savings and exclude ESA Programs. 10) Consistent with SPM TRC/PAC/RIM tests, all savings used from actuals and forecasts in this table are net not gross
PA Name: Pacific Gas and Electric Company Budget Year: 2019
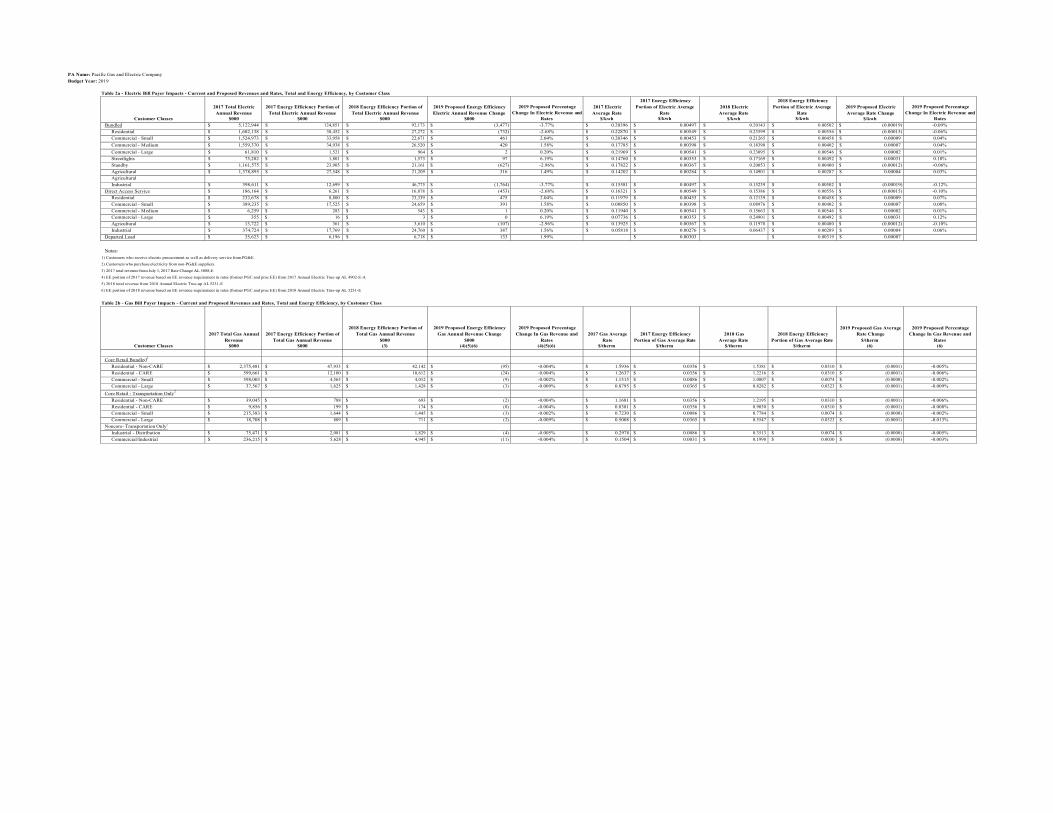
Table 2a - Electric Bill Payer Impacts - Current and Proposed Revenues and Rates, Total and Energy Efficiency, by Customer Class
Customer Classes
2017 Total Electric
Annual Revenue $000
2017 Energy Efficiency Portion of
Total Electric Annual Revenue $000
2018 Energy Efficiency Portion of
Total Electric Annual Revenue $000
2019 Proposed Energy Efficiency Electric Annual Revenue Change
$000
2019 Proposed Percentage
Change In Electric Revenue and Rates
2017 Electric Average Rate
$/kwh
2017 Energy Efficiency Portion of Electric Average
Rate $/kwh
2018 Electric Average Rate
$/kwh
2018 Energy Efficiency Portion of Electric Average
Rate $/kwh
2019 Proposed Electric Average Rate Change
$/kwh
2019 Proposed Percentage
Change In Electric Revenue and Rates
Bundled $ 5,122,944 $ 124,851 $ 92,173 $ (3,477) -3.77% $ 0.20396 $ 0.00497 $ 0.20143 $ 0.00502 $ (0.00019) -0.09% Residential $ 1,602,138 $ 38,452 $ 27,272 $ (732) -2.68% $ 0.22870 $ 0.00549 $ 0.23599 $ 0.00556 $ (0.00015) -0.06% Commercial - Small $ 1,524,973 $ 33,958 $ 22,671 $ 461 2.04% $ 0.20346 $ 0.00453 $ 0.21265 $ 0.00458 $ 0.00009 0.04% Commercial - Medium $ 1,559,370 $ 34,938 $ 26,520 $ 420 1.58% $ 0.17785 $ 0.00398 $ 0.18398 $ 0.00402 $ 0.00007 0.04% Commercial - Large $ 61,810 $ 1,521 $ 964 $ 2 0.20% $ 0.21969 $ 0.00541 $ 0.23095 $ 0.00546 $ 0.00002 0.01% Streetlights $ 75,282 $ 1,801 $ 1,573 $ 97 6.19% $ 0.14760 $ 0.00353 $ 0.17169 $ 0.00492 $ 0.00031 0.18% Standby $ 1,161,575 $ 23,905 $ 21,161 $ (627) -2.96% $ 0.17822 $ 0.00367 $ 0.20053 $ 0.00400 $ (0.00012) -0.06% Agricultural $ 1,378,895 $ 27,548 $ 21,209 $ 316 1.49% $ 0.14202 $ 0.00284 $ 0.14901 $ 0.00287 $ 0.00004 0.03% Agricultural
Industrial $ 398,611 $ 12,699 $ 46,775 $ (1,764) -3.77% $ 0.15581 $ 0.00497 $ 0.15239 $ 0.00502 $ (0.00019) -0.12% Direct Access Service $ 186,164 $ 6,261 $ 16,878 $ (453) -2.68% $ 0.16321 $ 0.00549 $ 0.15386 $ 0.00556 $ (0.00015) -0.10%
Residential $ 232,678 $ 8,800 $ 23,339 $ 475 2.04% $ 0.11979 $ 0.00453 $ 0.12139 $ 0.00458 $ 0.00009 0.07% Commercial - Small $ 389,235 $ 17,525 $ 24,659 $ 391 1.58% $ 0.08850 $ 0.00398 $ 0.08976 $ 0.00402 $ 0.00007 0.08% Commercial - Medium $ 6,259 $ 283 $ 543 $ 1 0.20% $ 0.11940 $ 0.00541 $ 0.15663 $ 0.00546 $ 0.00002 0.01% Commercial - Large $ 355 $ 16 $ 3 $ 0 6.19% $ 0.07736 $ 0.00353 $ 0.24901 $ 0.00492 $ 0.00031 0.12% Agricultural $ 13,722 $ 361 $ 3,610 $ (107) -2.96% $ 0.13925 $ 0.00367 $ 0.11978 $ 0.00400 $ (0.00012) -0.10% Industrial $ 374,724 $ 17,769 $ 24,760 $ 387 1.56% $ 0.05818 $ 0.00276 $ 0.06437 $ 0.00289 $ 0.00004 0.06%
Departed Load $ 35,623 $ 6,196 $ 6,718 $ 133 1.99% $ 0.00303 $ 0.00319 $ 0.00007
Notes:
1) Customers who receive electric procurement as well as delivery service from PG&E. 2) Customers who purchase electricity from non-PG&E suppliers. 3) 2017 total revenue from July 1, 2017 Rate Change AL 5088-E 4) EE portion of 2017 revenue based on EE revenue requirement in rates (former PGC and proc EE) from 2017 Annual Electric True-up AL 4902-E-A 5) 2018 total revenue from 2018 Annual Electric True-up AL 5231-E 6) EE portion of 2018 revenue based on EE revenue requirement in rates (former PGC and proc EE) from 2018 Annual Electric True-up AL 5231-E
Table 2b - Gas Bill Payer Impacts - Current and Proposed Revenues and Rates, Total and Energy Efficiency, by Customer Class
Customer Classes
2017 Total Gas Annual Revenue
$000
2017 Energy Efficiency Portion of Total Gas Annual Revenue
$000
2018 Energy Efficiency Portion of Total Gas Annual Revenue
$000 (3)
2019 Proposed Energy Efficiency Gas Annual Revenue Change
$000 (4)(5)(6)
2019 Proposed Percentage Change In Gas Revenue and
Rates (4)(5)(6)
2017 Gas Average Rate
$/therm
2017 Energy Efficiency Portion of Gas Average Rate
$/therm
2018 Gas Average Rate
$/therm
2018 Energy Efficiency Portion of Gas Average Rate
$/therm
2019 Proposed Gas Average Rate Change
$/therm (6)
2019 Proposed Percentage Change In Gas Revenue and
Rates (6)
Core Retail Bundled1
Residential - Non-CARE $ 2,375,481 $ 47,933 $ 42,142 $ (95) -0.004% $ 1.5936 $ 0.0356 $ 1.5381 $ 0.0310 $ (0.0001) -0.005% Residential - CARE $ 599,661 $ 12,100 $ 10,612 $ (24) -0.004% $ 1.2637 $ 0.0356 $ 1.2216 $ 0.0310 $ (0.0001) -0.006% Commercial - Small $ 598,003 $ 4,565 $ 4,012 $ (9) -0.002% $ 1.1315 $ 0.0086 $ 1.0807 $ 0.0074 $ (0.0000) -0.002% Commercial - Large $ 37,567 $ 1,625 $ 1,428 $ (3) -0.009% $ 0.8795 $ 0.0365 $ 0.8282 $ 0.0323 $ (0.0001) -0.009%
Core Retail - Transportation Only2
Residential - Non-CARE $ 39,045 $ 788 $ 693 $ (2) -0.004% $ 1.1681 $ 0.0356 $ 1.2195 $ 0.0310 $ (0.0001) -0.006% Residential - CARE $ 9,856 $ 199 $ 174 $ (0) -0.004% $ 0.8381 $ 0.0356 $ 0.9030 $ 0.0310 $ (0.0001) -0.008% Commercial - Small $ 215,383 $ 1,644 $ 1,445 $ (3) -0.002% $ 0.7230 $ 0.0086 $ 0.7784 $ 0.0074 $ (0.0000) -0.002% Commercial - Large $ 18,708 $ 809 $ 711 $ (2) -0.009% $ 0.5008 $ 0.0365 $ 0.5547 $ 0.0323 $ (0.0001) -0.013%
Noncore- Transportation Only2
Industrial - Distribution $ 75,471 $ 2,081 $ 1,829 $ (4) -0.005% $ 0.2978 $ 0.0086 $ 0.3513 $ 0.0074 $ (0.0000) -0.005% Commercial/Industrial $ 236,215 $ 5,628 $ 4,945 $ (11) -0.004% $ 0.1504 $ 0.0031 $ 0.1990 $ 0.0030 $ (0.0000) -0.003%
PA Name: Pacific Gas and Electric Company Budget Year: 2019
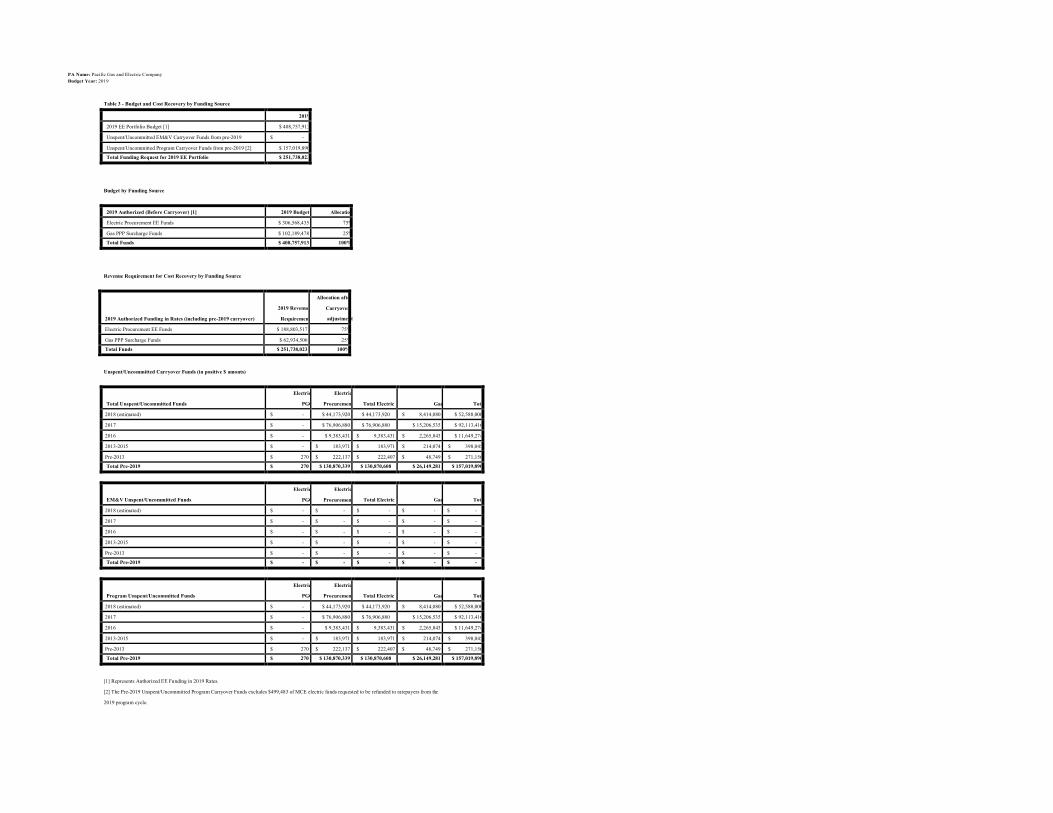
Table 3 - Budget and Cost Recovery by Funding Source
2019
2019 EE Portfolio Budget [1] $ 408,757,913
Unspent/Uncommitted EM&V Carryover Funds from pre-2019 $ -
Unspent/Uncommitted Program Carryover Funds from pre-2019 [2] $ 157,019,890
Total Funding Request for 2019 EE Portfolio $ 251,738,023
Budget by Funding Source
2019 Authorized (Before Carryover) [1] 2019 Budget Allocatio
Electric Procurement EE Funds $ 306,568,435 75%
Gas PPP Surcharge Funds $ 102,189,478 25%
Total Funds $ 408,757,913 100%
Revenue Requirement for Cost Recovery by Funding Source
t
Unspent/Uncommitted Carryover Funds (in positive $ amonts)
Total Unspent/Uncommitted Funds
Electric
PGC
Electric
Procurement
Total Electric
Gas
Tota
2018 (estimated) $ - $ 44,173,920 $ 44,173,920 $ 8,414,080 $ 52,588,000
2017 $ - $ 76,906,880 $ 76,906,880 $ 15,206,535 $ 92,113,416
2016 $ - $ 9,383,431 $ 9,383,431 $ 2,265,843 $ 11,649,274
2013-2015 $ - $ 183,971 $ 183,971 $ 214,074 $ 398,045
Pre-2013 $ 270 $ 222,137 $ 222,407 $ 48,749 $ 271,156
Total Pre-2019 $ 270 $ 130,870,339 $ 130,870,608 $ 26,149,281 $ 157,019,890
EM&V Unspent/Uncommitted Funds
Electric
PGC
Electric
Procurement
Total Electric
Gas
Tota
2018 (estimated) $ - $ - $ - $ - $ -
2017 $ - $ - $ - $ - $ -
2016 $ - $ - $ - $ - $ -
2013-2015 $ - $ - $ - $ - $ -
Pre-2013 $ - $ - $ - $ - $ -
Total Pre-2019 $ - $ - $ - $ - $ -
Program Unspent/Uncommitted Funds
Electric
PGC
Electric
Procurement
Total Electric
Gas
Tota
2018 (estimated) $ - $ 44,173,920 $ 44,173,920 $ 8,414,080 $ 52,588,000
2017 $ - $ 76,906,880 $ 76,906,880 $ 15,206,535 $ 92,113,416
2016 $ - $ 9,383,431 $ 9,383,431 $ 2,265,843 $ 11,649,274
2013-2015 $ - $ 183,971 $ 183,971 $ 214,074 $ 398,045
Pre-2013 $ 270 $ 222,137 $ 222,407 $ 48,749 $ 271,156
Total Pre-2019 $ 270 $ 130,870,339 $ 130,870,608 $ 26,149,281 $ 157,019,890
[1] Represents Authorized EE Funding in 2019 Rates.
[2] The Pre-2019 Unspent/Uncommitted Program Carryover Funds excludes $499,483 of MCE electric funds requested to be refunded to ratepayers from the
2019 program cycle.
2019 Authorized Funding in Rates (including pre-2019 carryover)
2019 Revenue
Requiremen
Allocation afte
Carryover
adjustmen
Electric Procurement EE Funds $ 188,803,517 75%
Gas PPP Surcharge Funds $ 62,934,506 25%
Total Funds $ 251,738,023 100%

PA Name: Pacific Gas and Electric Company Budget Year: 2019
Table 4 – Budget, Spent, Unspent, Carryover Details
2013-2015 Budget, Spent, Unspent and Carryover
New/Existing Program #
Main Program Name / Sub-Program Name
2015 Authorized Budget
2015 Total Budget with
Commitments & Fundshifts [1]
2015 Total Budget Spent [2]
Requested Carry Over of Pre-2013 Unspent Funds to
2016 [3]
2013-2015
Unspent/Uncommi ted Funds
Refunded or Transferred
2013-2015 Commitments as
of 12/31/15 [5]
2013-2015
Unspent/Committe d Funds,
Carryover to 2017 [6]
2013-2015 Cycle Expenditures Spent in 2016
Pre-2016 Unspent/Uncomm
itted Funds Available for 2017
offset [E-F+H-J-K] [7]
2016 Authorized Budget
2016 Fundshifts
PGE2100 Residential Energy Efficiency Programs Total $ 61,794,379 $ 83,984,802 $ 83,984,802 $ 4,475,456 $ - $ 12,029,803 $ - $ (122,295) $ 122,295 $ 61,794,379 $ 11,336,407 PGE21001 Residential Energy Advisor $ 13,531,293 $ 23,635,570 $ 23,635,570 $ - $ 0 $ 13,531,293 $ 2,500,000 PGE21002 Plug Load and Appliances $ 18,990,738 $ 18,858,757 $ 18,858,757 $ - $ 0 $ 18,990,738 $ - PGE21003 Multifamily Energy Efficiency $ 1,839,507 $ 1,522,581 $ 1,522,581 $ - $ 0 $ 1,839,507 $ - PGE21004 Energy Upgrade California $ 13,998,809 $ 20,967,951 $ 20,967,951 $ 322,330 $ 322,330 $ (86,905) $ 86,905 $ 13,998,809 $ 7,936,407 PGE21005 Residential New Construction $ 3,958,299 $ 5,830,541 $ 5,830,541 $ 4,000,000 $ 11,554,347 $ - $ 3,958,299 $ 500,000 PGE21006 Residential HVAC $ 9,475,734 $ 13,169,401 $ 13,169,401 $ 153,126 $ 153,126 $ (35,390) $ 35,390 $ 9,475,734 $ 400,000
PGE210010 Pay for Performance Pilot $ - $ - $ - $ - $ - $ - $ - PGE2101 Commercial Programs Total $ 79,040,928 $ 84,797,377 $ 84,797,377 $ 7,082,579 $ - $ 25,608,086 $ - $ - $ - $ 79,040,928 $ 20,850,000
PGE21011 Commercial Calculated Incentives $ 25,132,514 $ 24,103,034 $ 24,440,383 $ 6,682,579 $ 11,732,639 $ (337,349) $ 25,132,514 $ - PGE211025 Savings by Design (SBD) $ 10,237,119 $ 10,382,091 $ 10,533,625 $ 400,000 $ 13,821,821 $ (151,535) $ 10,237,119 $ -
PGE21012 Commercial Deemed Incentives $ 18,922,890 $ 23,144,357 $ 23,786,931 $ 3,588 $ (642,575) $ 18,922,890 $ 20,850,000 PGE21013 Commercial Continuous Energy Improvement $ 491,754 $ 785,604 $ 1,126,045 $ - $ (340,441) $ 491,754 $ - PGE21014 Commercial Energy Advisor $ 5,979,427 $ 5,508,948 $ 6,107,525 $ - $ (598,577) $ 5,979,427 $ - PGE21015 Commercial HVAC $ 18,277,223 $ 20,873,344 $ 18,802,867 $ 50,038 $ 2,070,476 $ 18,277,223 $ -
PGE2103 Agricultural Programs Total $ 18,823,008 $ 18,553,570 $ 18,553,570 $ - $ - $ 2,873,652 $ - $ - $ 0 $ 18,823,008 $ - PGE21031 Agricultural Calculated Incentives $ 10,240,375 $ 9,443,466 $ 8,304,778 $ - $ 2,873,652 $ 1,138,687 $ 10,240,375 $ - PGE21032 Agricultural Deemed Incentives $ 3,815,997 $ 2,629,376 $ 4,804,403 $ - $ (2,175,027) $ 3,815,997 $ - PGE21033 Agricultural Continuous Energy Improvement $ 506,988 $ 1,034,505 $ 164,253 $ - $ 870,252 $ 506,988 $ - PGE21034 Agricultural Energy Advisor $ 4,259,648 $ 5,446,223 $ 5,280,136 $ - $ 166,087 $ 4,259,648 $ -
PGE2102 Industrial Programs Total $ 11,938,780 $ 14,896,434 $ 12,571,310 $ 1,000,000 $ - $ 15,646,040 $ - $ - $ 2,325,124 $ 11,938,780 $ - PGE21021 Industrial Calculated Incentives $ 8,712,285 $ 10,052,601 $ 9,520,724 $ 1,000,000 $ 15,646,040 $ 531,877 $ 8,712,285 $ - PGE21022 Industrial Deemed Incentives $ 794,316 $ (770) $ 1,275,032 $ - $ (1,275,802) $ 794,316 $ - PGE21023 Industrial Continuous Energy Improvement $ 226,407 $ 806,463 $ 498,997 $ - $ 307,466 $ 226,407 $ - PGE21024 Industrial Energy Advisor $ 2,205,773 $ 4,038,139 $ 1,276,557 $ - $ 2,761,583 $ 2,205,773 $ - PGE21030 Industrial Strategic Energy Management $ - $ - $ - $ - $ - $ - $ -
PGE2104 Lighting Programs Total $ 13,551,559 $ 13,998,772 $ 11,882,102 $ - $ - $ - $ - $ - $ 2,116,670 $ 13,551,559 $ (700,000) PGE21041 Primary Lighting $ 11,188,130 $ 12,981,250 $ 10,718,482 $ - $ 2,262,768 $ 11,188,130 $ - PGE21042 Lighting Innovation $ 1,692,692 $ (650,415) $ 912,958 $ - $ (1,563,373) $ 1,692,692 $ (700,000) PGE21043 Lighting Market Transformation $ 670,738 $ 1,667,938 $ 250,663 $ - $ 1,417,275 $ 670,738 $ -
PGE2105 Codes & Standards Programs Total $ 15,335,248 $ 15,386,387 $ 12,781,513 $ - $ - $ - $ - $ - $ 2,604,873 $ 15,335,248 $ 279,921 PGE21051 Building Codes Advocacy $ 4,482,917 $ 8,202,476 $ 3,296,640 $ - $ 4,905,837 $ 4,482,917 $ - PGE21052 Appliance Standards Advocacy $ 4,407,361 $ 3,298,213 $ 5,129,082 $ - $ (1,830,869) $ 4,407,361 $ 279,921 PGE21053 Compliance Improvement $ 3,870,071 $ 952,088 $ 2,776,489 $ - $ (1,824,401) $ 3,870,071 $ - PGE21054 Reach Codes $ 1,429,957 $ 1,740,210 $ 669,053 $ - $ 1,071,157 $ 1,429,957 $ - PGE21055 Planning and Coordination $ 1,144,942 $ 1,193,401 $ 910,251 $ - $ 283,150 $ 1,144,942 $ - PGE21056 Code Readiness $ - $ - $ - $ - $ - $ - $ - PGE21057 National Codes & Standards Advocacy $ - $ - $ - $ - $ - $ - $ -
PGE2106 Emerging Technologies Programs Total $ 6,292,077 $ 11,281,370 $ 7,997,027 $ - $ - $ - $ - $ - $ 3,284,343 $ 6,292,077 $ - PGE21061 Technology Development Support $ 452,119 $ 391,364 $ 1,220,896 $ - $ (829,532) $ 452,119 $ - PGE21062 Technology Assessments $ 3,073,632 $ 4,783,957 $ 3,214,618 $ - $ 1,569,339 $ 3,073,632 $ - PGE21063 Technology Introduction Support $ 2,766,325 $ 6,106,050 $ 3,561,513 $ - $ 2,544,536 $ 2,766,325 $ -
PGE2107
Workforce Education & Training Programs Total
$ 12,561,342
$ 13,706,885
$ 10,853,110
$ -
$ -
$ -
$ -
$ -
$ 2,853,775
$ 12,561,342
$ (1,666,431)
PGE21071 Integrated Energy Education and Training $ 9,721,801 $ 10,846,380 $ 7,934,272 $ - $ 2,912,108 $ 9,721,801 $ (823,631) PGE21072 Connections $ 2,150,604 $ 2,250,472 $ 2,094,267 $ - $ 156,205 $ 2,150,604 $ (808,292) PGE21073 Strategic Planning $ 688,937 $ 610,033 $ 824,571 $ - $ (214,539) $ 688,937 $ (34,508) PGE21076 Career and Workforce Readiness $ - $ - $ - $ - $ - $ - $ -
PGE2108
Statewide DSM Coordination & Integration Program Total
$ 714,617
$ 1,105,405
$ (16,299)
$ -
$ -
$ -
$ -
$ -
$ 1,121,704
$ 714,617
$ -
PGE21081 Statewide DSM Coordination & Integration $ 714,617 $ 1,105,405 $ (16,299) $ - $ 1,121,704 $ 714,617 $ - PGE2109 Financing Programs Total $ 5,568,714 $ 37,954,871 $ 8,205,515 $ - $ (14,048,074) $ - $ 8,396,816 $ 3,254,387 $ 4,050,079 $ 5,568,714 $ (810,824)
PGE21091 On-Bill Financing (excludes Loan Pool) $ 3,537,010 $ 3,913,046 $ 4,010,097 $ (97,051) $ 3,537,010 $ - PGE21092 Third-Party Financing $ 2,031,703 $ 5,538,183 $ 1,391,053 $ - $ 4,147,130 $ 2,031,703 $ (810,824) PGE21093 New Financing Offerings [9] $ - $ 28,503,642 $ 2,804,365 $ (14,048,074) $ - $ 8,396,816 $ 3,254,387 $ - $ - $ -
PGE210911 On Bill Financing Alternative Pathway $ - $ - $ - $ - $ - $ - $ - Third-Party Programs (Competitvely Bid)
Total
$ 90,906,191
$ 99,373,101
$ 81,475,468
$ -
$ -
$ 30,322,790
$ -
$ (105,704)
$ 18,003,336
$ 90,906,191
$ (16,092,119) PGE2100 Residential Third Party Programs SubTotal $ 10,188,301 $ 9,282,160 $ 9,596,381 $ - $ - $ - $ - $ (105,704) $ (208,517) $ 10,188,301 $ (1,945,117)
PGE21007 California New Homes Multifamily $ 3,801,408 $ 3,754,223 $ 2,289,801 $ - $ 1,464,422 $ 3,801,408 $ (1,945,117) PGE21008 Enhance Time Delay Relay $ 2,061,601 $ 1,674,330 $ 2,274,467 $ - $ (600,137) $ 2,061,601 $ - PGE21009 Direct Install for Manufactured and Mobile Homes $ 4,325,292 $ 3,750,358 $ 5,018,394 $ - $ (105,704) $ (1,162,332) $ 4,325,292 $ -
PGE210132 RSG The Smarter Water Heater $ - $ 103,249 $ 13,719 $ - $ 89,531 $ - $ - PGE210011 Residential Energy Fitness Program $ - $ - $ - $ - $ - $ - $ -
PGE2101 Commercial Third Party Programs SubTotal $ 51,591,182 $ 45,943,193 $ 36,508,743 $ - $ - $ 793,249 $ - $ - $ 9,434,450 $ 51,591,182 $ (14,147,002) PGE210110 Monitoring-Based Persistence Commissioning $ - $ (731,790) $ (555) $ - $ (731,236) $ - $ - PGE210111 LodgingSavers $ 5,044,780 $ 1,788,544 $ 6,031,971 $ - $ (4,243,427) $ 5,044,780 $ - PGE210112 School Energy Efficiency $ 3,421,431 $ 3,507,961 $ 3,653,297 $ 457,173 $ (145,336) $ 3,421,431 $ - PGE210113 Energy Fitness Program $ 2,940,737 $ 3,698,416 $ 871,914 $ - $ 2,826,501 $ 2,940,737 $ (2,295,212) PGE210114 Energy Savers $ 1,329,057 $ 1,100,704 $ 336,521 $ - $ 764,183 $ 1,329,057 $ (1,019,905) PGE210115 RightLights $ 5,211,807 $ 5,185,416 $ 1,230,837 $ - $ 3,954,579 $ 5,211,807 $ (4,030,253) PGE210116 Small Business Commercial Comprehensive $ - $ 2,997,504 $ (16,070) $ - $ 3,013,574 $ - $ - PGE210117 Energy-Efficient Parking Garage $ - $ 552,404 $ (9,831) $ - $ 562,235 $ - $ - PGE210118 Retail Energy Efficiency $ 1,414,293 $ (439,517) $ 2,169,000 $ - $ (2,608,517) $ 1,414,293 $ - PGE210119 LED Accelerator $ 2,458,594 $ (648,152) $ 4,099,974 $ - $ (4,748,125) $ 2,458,594 $ - PGE210120 Monitoring-Based Commissioning $ - $ 81,414 $ 48,111 $ - $ 33,303 $ - $ - PGE210122 Casino Green $ 1,564,647 $ 1,680,451 $ 949,805 $ - $ 730,646 $ 1,564,647 $ - PGE210123 Healthcare Energy Efficiency Program $ 1,189,849 $ 1,274,107 $ 441,363 $ 37,567 $ 832,744 $ 1,189,849 $ -

PA Name: Pacific Gas and Electric Company Budget Year: 2019
Table 4 – Budget, Spent, Unspent, Carryover Details
2013-2015 Budget, Spent, Unspent and Carryover
New/Existing Program #
Main Program Name / Sub-Program Name
2015 Authorized Budget
2015 Total Budget with
Commitments & Fundshifts [1]
2015 Total Budget Spent [2]
Requested Carry Over of Pre-2013 Unspent Funds to
2016 [3]
2013-2015
Unspent/Uncommi ted Funds
Refunded or Transferred
2013-2015 Commitments as
of 12/31/15 [5]
2013-2015
Unspent/Committe d Funds,
Carryover to 2017 [6]
2013-2015 Cycle Expenditures Spent in 2016
Pre-2016 Unspent/Uncomm
itted Funds Available for 2017
offset [E-F+H-J-K] [7]
2016 Authorized Budget
2016 Fundshifts
PGE210124 Ozone Laundry Energy Efficiency $ - $ 714,953 $ (2,216) $ - $ 717,169 $ - $ - PGE210125 California Preschool Energy Efficiency Program $ - $ 833,294 $ (2,506) $ - $ 835,801 $ - $ - PGE210126 K-12 Private Schools and Colleges Audit Retro $ 1,844,726 $ 1,655,196 $ 1,079,552 $ - $ 575,644 $ 1,844,726 $ -
PGE210127
Innovative Designs for Energy Efficiency Approaches (IDEEA)
$ 11,844,521
$ 2,744,592
$ 25,320
$ -
$ 2,719,272
$ 11,844,521
$ (1,572,398)
PGE210128 Enovity SMART $ - $ 1,048,790 $ 1,644,827 $ 3,940 $ (596,037) $ - $ - PGE210129 Nexant AERCx $ - $ 1,590,139 $ 504,317 $ - $ 1,085,822 $ - $ - PGE210130 CLEAResult AERCx $ - $ 1,112,781 $ 681,424 $ - $ 431,356 $ - $ - PGE210131 PECI AERCx $ - $ 510,892 $ 483,003 $ - $ 27,889 $ - $ - PGE210136 McKinstry Laboratory Fume Hoods $ - $ 510,494 $ 603,373 $ - $ (92,879) $ - $ - PGE210137 Waypoint Commercial Outreach $ - $ 313,678 $ 864,820 $ - $ (551,142) $ - $ - PGE210138 Data Center Air Flow and Temp Optimization $ - $ 278,436 $ 206,590 $ - $ 71,846 $ - $ - PGE210139 SEI Energize Schools Program $ - $ (5,322) $ 537,061 $ - $ (542,383) $ - $ - PGE210140 Mazzetti Dynamic Gas Scavenging System $ - $ 177,533 $ 33,092 $ - $ 144,441 $ - $ - PGE210141 Lincus Commercial Mid-Market Program $ - $ 333,645 $ 835,586 $ - $ (501,941) $ - $ - PGE210143 Hospitality Program $ - $ - $ - $ - $ - $ - $ (2,049,313)
PGE21016 Air Care Plus $ 3,784,067 $ 6,155,564 $ 2,312,688 $ - $ 3,842,877 $ 3,784,067 $ (3,179,921) PGE21017 Boiler Energy Efficiency Program $ 2,086,213 $ 1,896,072 $ 916,103 $ 294,569 $ 979,970 $ 2,086,213 $ - PGE21018 EnergySmart Grocer $ 7,456,460 $ 5,552,209 $ 5,896,030 $ - $ (343,822) $ 7,456,460 $ - PGE21019 Enhanced Automation Initiative $ - $ 472,786 $ 83,344 $ - $ 389,442 $ - $ -
PGE2103 Agricultural Third Party Programs SubTotal $ 8,227,091 $ 10,018,743 $ 11,457,071 $ - $ - $ 2,118,541 $ - $ - $ (1,438,328) $ 8,227,091 $ - PGE210310 Dairy Industry Resource Advantage Pgm $ 1,480,754 $ (209,110) $ 2,298,717 $ 747,830 $ (2,507,828) $ 1,480,754 $ -
PGE210311
Process Wastewater Treatment EM Pgm for Ag Food Processing
$ 1,065,359
$ 963,909
$ 752,412
$ 496,655
$ 211,497
$ 1,065,359
$ -
PGE210312 Dairy and Winery Industry Efficiency Solutions $ - $ - $ - $ - $ - $ - $ - PGE210133 Staples Low Pressure Irrigation DI $ - $ 1,155,851 $ 1,250,631 $ - $ (94,779) $ - $ -
PGE21035 Dairy Energy Efficiency Program $ 472,638 $ 562,401 $ 467,690 $ - $ 94,710 $ 472,638 $ - PGE21036 Industrial Refrigeration Performance Plus $ 1,419,916 $ 2,135,688 $ 992,145 $ 399,735 $ 1,143,543 $ 1,419,916 $ - PGE21037 Light Exchange Program $ 1,046,700 $ 819,308 $ 578,448 $ - $ 240,859 $ 1,046,700 $ - PGE21038 Wine Industry Efficiency Solutions $ 1,677,221 $ 2,486,505 $ 2,084,509 $ 474,322 $ 401,996 $ 1,677,221 $ -
PGE21039
Comprehensive Food Process Audit & Resource Efficiency Pgm
$ 1,064,504
$ 2,104,192
$ 3,032,519
$ -
$ (928,327)
$ 1,064,504
$ -
PGE2102 Industrial Third Party Programs SubTotal $ 20,899,617 $ 34,351,982 $ 23,630,116 $ - $ - $ 27,411,000 $ - $ - $ 10,721,867 $ 20,899,617 $ - PGE210210 Industrial Recommissioning Program $ 1,372,850 $ 3,071,471 $ 1,335,323 $ 1,373,897 $ 1,736,148 $ 1,372,850 $ - PGE210211 Light Industrial Energy Efficiency $ - $ - $ - $ - $ - $ - $ - PGE210212 Industrial Compressed Air System Efficiency $ - $ - $ - $ - $ - $ - $ - PGE210213 Small Petrochemical Energy Efficiency $ - $ - $ - $ - $ - $ - $ -
PGE21025 California Wastewater Process Optimization $ 995,518 $ 1,238,167 $ 595,695 $ 253,266 $ 642,472 $ 995,518 $ - PGE21026 Energy Efficiency Services for Oil Production $ 4,475,267 $ 6,259,122 $ 3,234,535 $ 2,273,622 $ 3,024,586 $ 4,475,267 $ - PGE21027 Heavy Industry Energy Efficiency Program $ 11,067,518 $ 15,001,729 $ 13,037,517 $ 14,709,712 $ 1,964,212 $ 11,067,518 $ - PGE21028 Industrial Compressed Air Program $ 1,678,196 $ 1,070,652 $ 376,427 $ 201,081 $ 694,225 $ 1,678,196 $ - PGE21029 Refinery Energy Efficiency Program $ 1,310,269 $ 6,414,950 $ 2,090,205 $ 8,589,844 $ 4,324,745 $ 1,310,269 $ -
PGE210135 Lincus WISE $ - $ 583,483 $ 2,828,643 $ 9,577 $ (2,245,159) $ - $ - PGE210142 Ameresco Intelligent Energy Efficiency $ - $ 712,408 $ 131,771 $ - $ 580,638 $ - $ -
PGE2107
Workforce Education & Training Third Party Programs SubTotal
$ -
$ (222,977)
$ 283,158
$ -
$ -
$ -
$ -
$ -
$ (506,135)
$ -
$ -
PGE21074 Builder Energy Code Training $ - $ (81,650) $ 11,523 $ - $ (93,173) $ - $ - PGE21075 Green Building Technical Support Services $ - $ (205,549) $ 4,699 $ - $ (210,248) $ - $ -
PGE210134 Bridges to Energy Sector Opportunities $ - $ 64,221 $ 266,936 $ - $ (202,714) $ - $ - PGE2110 Government Partnership Programs Total $ 72,321,914 $ 78,908,455 $ 68,224,688 $ - $ - $ 9,189,905 $ - $ - $ 10,683,768 $ 72,321,914 $ (3,296,953)
PGE2110011 California Community Colleges $ 3,495,392 $ 2,959,452 $ 2,450,565 $ 2,127,113 $ 508,887 $ 3,495,392 $ - PGE2110012 University $ 11,801,373 $ 11,156,606 $ 5,666,056 $ 5,998,323 $ 5,490,550 $ 11,801,373 $ (3,296,953) PGE2110013 State of California $ 1,423,968 $ 4,447,501 $ 446,349 $ 365,262 $ 4,001,152 $ 1,423,968 $ - PGE2110014 Department of Corrections and Rehabilitation $ 3,199,909 $ 4,309,041 $ 357,993 $ 510,033 $ 3,951,048 $ 3,199,909 $ -
PGE2110051
Local Government Energy Action Resources (LGEAR)
$ 5,500,535
$ 5,079,566
$ 10,810,840
$ -
$ (5,731,275)
$ 5,500,535
$ -
PGE2110052 Strategic Energy Resources $ 2,764,003 $ (6,527,308) $ 7,508,767 $ - $ (14,036,074) $ 2,764,003 $ -
PGE211007
Association of Monterey Bay Area Governments (AMBAG)
$ 3,581,301
$ 3,173,251
$ 4,213,849
$ 103,697
$ (1,040,598)
$ 3,581,301
$ -
PGE211009 East Bay $ 9,262,008 $ 11,273,322 $ 6,720,458 $ - $ 4,552,865 $ 9,262,008 $ - PGE211010 Fresno $ 3,846,492 $ 7,730,350 $ 3,130,833 $ - $ 4,599,517 $ 3,846,492 $ - PGE211011 Kern $ 3,194,412 $ 4,669,107 $ 2,811,185 $ 8,692 $ 1,857,922 $ 3,194,412 $ - PGE211012 Madera $ 445,314 $ 851,041 $ 436,007 $ - $ 415,034 $ 445,314 $ - PGE211013 Marin County $ 1,334,743 $ 1,784,706 $ 1,179,302 $ 11,000 $ 605,404 $ 1,334,743 $ - PGE211014 Mendocino/Lake County $ 322,506 $ 295,006 $ 626,591 $ - $ (331,586) $ 322,506 $ - PGE211015 Napa County $ 549,632 $ 376,214 $ 519,326 $ - $ (143,112) $ 549,632 $ - PGE211016 Redwood Coast $ 1,556,910 $ 2,057,613 $ 1,474,416 $ - $ 583,197 $ 1,556,910 $ - PGE211018 San Luis Obispo County $ 936,840 $ 279,466 $ 878,220 $ - $ (598,754) $ 936,840 $ - PGE211019 San Mateo County $ 1,744,567 $ 950,687 $ 2,625,108 $ 52,748 $ (1,674,422) $ 1,744,567 $ - PGE211020 Santa Barbara $ 1,184,837 $ 1,368,579 $ 966,840 $ - $ 401,739 $ 1,184,837 $ - PGE211021 Sierra Nevada $ 2,560,460 $ 2,643,277 $ 1,954,601 $ - $ 688,676 $ 2,560,460 $ - PGE211022 Sonoma County $ 1,709,718 $ 2,364,100 $ 2,226,417 $ 9,885 $ 137,683 $ 1,709,718 $ - PGE211023 Silicon Valley $ 4,074,436 $ 5,306,242 $ 4,609,175 $ 3,151 $ 697,068 $ 4,074,436 $ -

PA Name: Pacific Gas and Electric Company Budget Year: 2019
Table 4 – Budget, Spent, Unspent, Carryover Details
2013-2015 Budget, Spent, Unspent and Carryover
New/Existing Program #
Main Program Name / Sub-Program Name
2015 Authorized Budget
2015 Total Budget with
Commitments & Fundshifts [1]
2015 Total Budget Spent [2]
Requested Carry Over of Pre-2013 Unspent Funds to
2016 [3]
2013-2015
Unspent/Uncommi ted Funds
Refunded or Transferred
2013-2015 Commitments as
of 12/31/15 [5]
2013-2015
Unspent/Committe d Funds,
Carryover to 2017 [6]
2013-2015 Cycle Expenditures Spent in 2016
Pre-2016 Unspent/Uncomm
itted Funds Available for 2017
offset [E-F+H-J-K] [7]
2016 Authorized Budget
2016 Fundshifts
PGE211024 San Francisco $ 7,832,558 $ 12,360,636 $ 6,611,788 $ - $ 5,748,848 $ 7,832,558 $ - PGE211026 North Valley $ - $ - $ - $ - $ - $ - $ - PGE211027 Sutter Buttes $ - $ - $ - $ - $ - $ - $ - PGE211028 Yolo $ - $ - $ - $ - $ - $ - $ - PGE211029 Solano $ - $ - $ - $ - $ - $ - $ - PGE211030 Northern San Joaquin Valley $ - $ - $ - $ - $ - $ - $ - PGE211031 Valley Innovative Energy Watch (VIEW) $ - $ - $ - $ - $ - $ - $ -
Funds to be returned in rates [4] $ - $ - $ - $ (43,024,402) $ - $ (43,024,402) $ - $ - 2013-2015 funds transferred to REN and
CCA balancing accounts for 2016 [6]
$ -
$ -
$ -
$ -
$ -
$ -
$ 4,066,080
$ -
$ (4,066,080)
$ -
$ (4,066,080)
Pre-2013 Unspent Funds transferred to 2016 Commercial Deemed Incentives program [3]
$ 9,900,000
$ -
$ (9,900,000) PG&E PROGRAM TOTAL $ 388,848,756 $ 473,947,429 $ 401,310,184 $ 22,458,035 $ (57,072,476) $ 95,670,275 $ 12,462,896 $ 3,026,388 $ 75,485 $ 388,848,756 $ (4,066,080) EM&V EM&V (PA & CPUC Portions) Total $ 17,204,418 $ 43,427,745 $ 14,196,403 $ 2,261,982 $ - $ 29,231,342 $ 18,873,781 $ 9,360,310 $ 997,251 $ 17,204,418 $ -
PGE_EMV PG&E EM&V - CPUC $ 12,200,968 $ 33,361,125 $ 10,473,870 $ 880,380 $ - $ 22,887,233 $ 16,149,179 $ 6,738,076 $ - $ 12,200,968 $ - PGE_EMV PG&E EM&V - PG&E $ 5,003,450 $ 10,066,620 $ 3,722,532 $ 1,381,602 $ - $ 6,344,110 $ 2,724,603 $ 2,622,234 $ 997,251 $ 5,003,450 $ - PGE_EMV BayREN EM&V - CPUC $ - $ - $ - $ - $ - $ - $ - $ - $ - $ - $ - PGE_EMV BayREN EM&V $ - $ - $ - $ - $ - $ - $ - $ - $ - $ - $ - PGE_EMV MCE EM&V - CPUC $ - $ - $ - $ - $ - $ - $ - $ - $ - $ - $ - PGE_EMV MCE EM&V $ - $ - $ - $ - $ - $ - $ - $ - $ - $ - $ - PGE_EMV 3C REN EM&V - CPUC $ - $ - $ - $ - $ - $ - $ - $ - $ - $ - $ - PGE_EMV 3C REN EM&V $ - $ - $ - $ - $ - $ - $ - $ - $ - $ - $ -
PG&E TOTAL with EM&V $ 406,053,174 $ 517,375,174 $ 415,506,587 $ 24,720,017 $ (57,072,476) $ 124,901,618 $ 31,336,678 $ 12,386,697 $ 1,072,736 $ 406,053,174 $ (4,066,080) PGE_BayREN BayREN [10] $ 12,837,000 $ 18,163,894 $ 14,403,008 $ - $ - $ 3,760,885 $ - $ 12,837,000 $ 3,700,000 PGE_MCE Marin Clean Energy [10] $ 1,220,267 $ 1,420,267 $ 124,539 $ - $ (1,082,708) $ - $ 36,182 $ - (81,441) $ 1,220,267 $ 366,080 PGE_3C REN 3C REN [10] $ - $ - $ - $ - $ - $ - $ - $ - - $ - $ -
TOTAL PG&E EE EXPENSE PORTFOLIO $ 420,110,441 $ 536,959,334 $ 430,034,134 $ 24,720,017 $ (58,155,184) $ 124,901,618 $ 35,133,745 $ 12,386,697 $ 991,295 $ 420,110,441 $ -
PGE21091LP OBF REVOLVING LOAN POOL $ 10,000,000 $ 32,528,389 $ 6,532,126 $ - $ - $ - $ 15,682,517 $ - $ - $ 10,000,000 $ -
TOTAL PG&E EE PORTFOLIO $ 430,110,441 $ 569,487,724 $ 436,566,260 $ 24,720,017 $ (58,155,184) $ 124,901,618 $ 50,816,262 $ 12,386,697 $ 991,295 $ 430,110,441 $ -
Other EE-Related Budgets
PGE_SWMEO
Statewide Marketing, Education and Outreach Program Total
$ 7,655,061
$ 6,090,704
$ 7,620,318
$ -
$ -
$ -
$ -
$ -
$ -
$ 8,445,775
$ -
PGE_SWMEO
Statewide Marketing, Education and Outreach Program (Flex Alert) [11]
$ 1,590,250
$ 909,877
$ 1,591,046
$ -
$ -
$ -
$ -
$ -
$ -
$ -
PGE_SWMEO
Statewide Marketing, Education and Outreach Program [11]
$ 6,064,811
$ 5,180,827
$ 6,029,272
$ -
$ -
$ -
$ -
$ -
$ -
$ 8,445,775
$ -
Notes: 1. "2015 Total Budget with Commitments & Fundshifts" reflects funds available for 2015, from the authorized 2013-2015 Budget, less the spending in 2013 - 2014 from the 2013 - 2015 Budget. 2. "2015 Total Budget Spent" includes spending in 2015 paid from the 2013 - 2015 Budget. 3. “Requested Carry Over of pre-2013 Unspent Funds to 2016” identifies the funds PG&E is requesting to carry over to 2016 in supplemental Advice 3752-G-B/4905-E-B, which was approved on November 2, 2016. In addition to the amounts identified at the subprogram level in column G, PG&Ewas approved authorization to shift $9.9m of pre-2013 unspent funds into the Commercial Deemed Incentive program 2016 budget. 4. The CPUC approved AL 3718-G/4852-E on July 11, 2016, authorizing PG&E to return a total of $43,024,401.85 in unspent, uncommitted energy efficiency funds from its 2013-2015 program cycle to its customers; PG&E implemented this through a one-time adjustment to its gas and electric EE balancing accounts. 5. Commitments as of 12/31/2015 (column I), 12/31/2016 (column R), and 12/31/2017 (column Y) includes incentive Commitments as of the end of the year indicated. Contractual encumbrances are not reflected. BayREN and MCE Carry Over figures represent the level of funds in PG&E’s balancing accounts; this may include BayREN expenses or MCE gas expenses not yet invoiced to or accrued by PG&E as of the year indicated; the remainder is the amount potentially available for carry over; these may not match MCE or BayREN submissions. 6. 2013-2015 Unspent/Committed Funds, Carryover to 2016" Identifies unspent, committed funds that are carried over into 2016 and augment the 2016 budget, in accordance with D.12-11-015, as follows:
New Financing Offerings: In D. 15-06-008, the Commission ordered that PG&E operate for a minimum of 24 months from the point at which each pilot program enrolls its first loan. The Pilots have begun enrolling loans in 2016 indicating that the pilots will run until at least 2018. New financing pilot subprogram funds collected during 2013-2014 period are being carried over to continue to operate during this compliance period. Funds Transferred to REN and CCA balancing accounts: In D.16-05-004 (petition to modify D.14-10-046), effective May 12, 2016, the Commission authorized for Marin Clean Energy (MCE) an annual budget increase of $366,080 for the duration of the ten-year rolling portfolio cycle unless and until modified by the Commission. The CPUC approved AL 3718-G/4852-E on July 11, 2016, authorizing PG&E to use unspent 2013-2015 unspent funds to fund the increase in MCE’s 2016 budget. Advice Letter 3704-G/4826-E, effective April 29, 2016, authorized for BayREN a one-time budget increase of $3,700,000 transferred from unspent 2013-2015 cycle EE funds to the 2016 cycle.
Marin Clean Energy: MCE’s 2015 authorized gas budget included $419,000. The Commission authorized a gas budget of $219,000 in D.14-10-046 and augmented the gas budget by $200,000 per PG&E Advice 3642- G/4720-E, filed 10/15/2015, approved 10/28/2015. After $382,818 of gas payments from PG&E to MCE, $36,182 is available for carryover to 2016.
7. “Pre-2016 unspent/uncommitted funds available for 2017 offset” identifies 2013–2015 cycle unspent funds at the program level. The balancing account transfer for $43 million of funds refunded to customers based on Advice Letter 3718-G/4852-E is identified on Row 154. Unspent funds from 2009 and 2010–2012 are represented in Column G. In 2017 PG&E recorded a one-time electric EE balancing account adjustment of $230,474 crediting customer rates for unspent 2015-2016 Marin Clean Energy Electric funds. In the 2018 ABAL, It had been pointed out that of the $230,474, a refund should have occurred in the amount of $311,915 from the 2016 cycle, while an increase of $81,441 should have been applied to the 2013-2015 cycle.
8. “2019 Proposed Budget” reflects the budget request for 2019, which differs from the collections requested through this advice letter of approximately $408.8 million.
9. Advice Letter 3589-G-C/4624-E-C, approved June 29, 2015, effective June 25, 2015 established the Energy Efficiency Financing Balancing Account (EEFBA), and the Credit Enhancement Balance Account (CEBA) and the On-Bill Financing Balancing Account (OBFBA) subaccounts. The $14 million referenced in cell H57 was transferred to the CEBA subaccount. 10. BayREN, MCE and 3C-REN figures generally represent the level of funds in PG&E’s balancing accounts and may not match MCE or BayREN submissions. effectiveness calculations. 12. The "2018 Authorized Budget" in Table 4 represents PG&E's 2018 CEDARS filing budget at the subprogram level detail, and BayREN and MCE's approved budgets per the Business Plan Decision D.18-05- 041. This budget is lower than PG&E's 2018 portfolio budget of $416,713,780, also approved in D.18-05-041. Subprogram level detail is unavailable in the approved Business Plan budget. 13. 2019 BayREN and MCE budgets are the authorized amounts from the Business Plan decision D.18-05-041, with their EM&V budgets increased to be 4% of their total budget. 14. 2019 3C-REN budget is the proposed contribution for PG&E as circulated by 3C-REN on August 28, 2018, which includes 4% EM&V.

PA Name: Pacific Gas and Electric Company Budget Year: 2019
Table 4 – Budget, Spent, Unspent, Carryover Details
2016 Budget, Spent, Unspent and Carryover 2017 Budget, Fundshifts and Spending to Date 2
New/Existing Program #
Main Program Name / Sub-Program Name
2016 Total Budget with Commitments
& Fundshifts (G+J+M+N)
2016 Cycle Expenditures Spent
in 2016
2016 Unspent/Uncommit ed Funds Returned
to Ratepayers
2016 Commitments as
of 12/31/16 [5]
2016
Unspent/Uncom mitted Funds Available for 2018 offset
2017 Authorized Budget
2017 Fundshifts
2017 Total Budget
2017 Cycle Expenditures Spent
in 2017
2016 Unspent/Uncommited
Funds Returned to Ratepayers
2017 Commitments as
of 12/31/17 [5]
2017 Unspent/Uncommitte d Funds Available for
2018 offset
2018 Authorized Budget [12]
PGE2100 Residential Energy Efficiency Programs Total $ 77,606,242 $ 77,606,242 $ - $ 10,622,188 $ - $ 62,652,625 - $ 62,652,625 $ 52,797,764 $ - $ 275,011 $ - $ 55,622,926 PGE21001 Residential Energy Advisor $ 16,031,293 $ 17,534,364 $ - $ - $ - $ 16,998,320 - $ 16,998,320 $ 13,355,709 $ - $ - $ - $ 14,692,263 PGE21002 Plug Load and Appliances $ 18,990,738 $ 13,641,352 $ - $ 303 $ - $ 12,175,962 - $ 12,175,962 $ 11,396,952 $ - $ 176,200 $ - $ 10,600,377 PGE21003 Multifamily Energy Efficiency $ 1,839,507 $ 675,488 $ - $ - $ - $ 677,058 - $ 677,058 $ 126,806 $ - $ - $ - $ 6,779,725 PGE21004 Energy Upgrade California $ 22,257,546 $ 24,947,402 $ - $ - $ - $ 14,514,755 - $ 14,514,755 $ 17,690,082 $ - $ 53,440 $ - $ 10,707,759 PGE21005 Residential New Construction $ 8,458,299 $ 7,179,186 $ - $ 10,621,885 $ - $ 5,947,372 - $ 5,947,372 $ 6,721,490 $ - $ - $ - $ 6,770,695 PGE21006 Residential HVAC $ 10,028,860 $ 13,628,451 $ - $ - $ - $ 9,515,664 - $ 9,515,664 $ 3,160,623 $ - $ 45,371 $ - $ 5,318,382
PGE210010 Pay for Performance Pilot $ - $ - $ - $ - $ - $ 2,823,495 - $ 2,823,495 $ 346,104 $ - $ - $ - $ 753,726 PGE2101 Commercial Programs Total $ 106,973,507 $ 99,034,373 $ - $ 13,647,258 $ - $ 70,945,809 - $ 70,945,809 $ 57,892,760 $ - $ 12,350,081 $ - $ 64,732,629
PGE21011 Commercial Calculated Incentives $ 31,815,093 $ 19,123,362 $ - $ 9,584,741 $ - $ 22,085,875 - $ 22,085,875 $ 12,720,207 $ - $ 6,729,118 $ - $ 23,262,758 PGE211025 Savings by Design (SBD) $ 10,637,119 $ 6,734,513 $ - $ 3,107,426 $ - $ 6,136,870 - $ 6,136,870 $ 4,727,014 $ - $ 3,997,568 $ - $ 9,111,221
PGE21012 Commercial Deemed Incentives $ 39,772,890 $ 54,790,353 $ - $ 955,090 $ - $ 20,590,599 - $ 20,590,599 $ 23,189,689 $ - $ 1,335,834 $ - $ 19,367,904 PGE21013 Commercial Continuous Energy Improvement $ 491,754 $ 988,777 $ - $ - $ - $ 1,361,810 - $ 1,361,810 $ 398,924 $ - $ - $ - $ 240,150 PGE21014 Commercial Energy Advisor $ 5,979,427 $ 4,459,100 $ - $ - $ - $ 4,645,605 - $ 4,645,605 $ 1,783,055 $ - $ - $ - $ 2,123,638 PGE21015 Commercial HVAC $ 18,277,223 $ 12,938,268 $ - $ - $ - $ 16,125,050 - $ 16,125,050 $ 15,073,871 $ - $ 287,561 $ - $ 10,626,958
PGE2103 Agricultural Programs Total $ 18,823,008 $ 18,262,460 $ - $ 2,927,707 $ - $ 15,416,439 - $ 15,416,439 $ 13,473,189 $ - $ 2,450,731 $ - $ 17,238,326 PGE21031 Agricultural Calculated Incentives $ 10,240,375 $ 5,747,440 $ - $ 2,852,046 $ - $ 5,384,644 - $ 5,384,644 $ 3,359,466 $ - $ 2,375,927 $ - $ 9,155,062 PGE21032 Agricultural Deemed Incentives $ 3,815,997 $ 8,068,249 $ - $ 75,661 $ - $ 5,677,746 - $ 5,677,746 $ 7,337,881 $ - $ 73,664 $ - $ 4,758,784 PGE21033 Agricultural Continuous Energy Improvement $ 506,988 $ 197,629 $ - $ - $ - $ 226,700 - $ 226,700 $ 70,219 $ - $ - $ - $ 67,740 PGE21034 Agricultural Energy Advisor $ 4,259,648 $ 4,249,142 $ - $ - $ - $ 4,127,350 - $ 4,127,350 $ 2,705,623 $ - $ 1,140 $ - $ 3,256,739
PGE2102 Industrial Programs Total $ 12,938,780 $ 11,052,656 $ - $ 12,939,997 $ - $ 13,060,791 $ - $ 13,060,791 $ 10,692,100 $ - $ 2,297,869 $ - $ 18,155,388 PGE21021 Industrial Calculated Incentives $ 9,712,285 $ 6,422,285 $ - $ 12,850,024 $ - $ 8,899,910 - $ 8,899,910 $ 8,670,968 $ - $ 2,229,456 $ - $ 12,115,800 PGE21022 Industrial Deemed Incentives $ 794,316 $ 2,982,574 $ - $ 89,973 $ - $ 2,141,873 - $ 2,141,873 $ 1,475,622 $ - $ 68,413 $ - $ 4,157,505 PGE21023 Industrial Continuous Energy Improvement $ 226,407 $ 393,031 $ - $ - $ - $ 135,480 - $ 135,480 $ 82,159 $ - $ - $ - $ 67,233 PGE21024 Industrial Energy Advisor $ 2,205,773 $ 1,254,766 $ - $ - $ - $ 1,511,322 - $ 1,511,322 $ 305,034 $ - $ - $ - $ 597,692 PGE21030 Industrial Strategic Energy Management $ - $ - $ - $ - $ - $ 372,206 - $ 372,206 $ 158,316 $ - $ - $ - $ 1,217,158
PGE2104 Lighting Programs Total $ 12,851,559 $ 12,732,856 $ - $ - $ - $ 12,082,245 - $ 12,082,245 $ 11,746,184 $ - $ 58,461 $ - $ 11,131,075 PGE21041 Primary Lighting $ 11,188,130 $ 11,879,081 $ - $ - $ - $ 10,970,646 - $ 10,970,646 $ 11,245,149 $ - $ 58,461 $ - $ 10,711,690 PGE21042 Lighting Innovation $ 992,692 $ 669,673 $ - $ - $ - $ 734,898 - $ 734,898 $ 387,383 $ - $ - $ - $ 357,652 PGE21043 Lighting Market Transformation $ 670,738 $ 184,102 $ - $ - $ - $ 376,702 - $ 376,702 $ 113,652 $ - $ - $ - $ 61,733
PGE2105 Codes & Standards Programs Total $ 15,615,169 $ 15,615,169 $ - $ - $ - $ 17,113,967 - $ 17,113,967 $ 16,216,003 $ - $ - $ - $ 16,183,839 PGE21051 Building Codes Advocacy $ 4,482,917 $ 4,087,284 $ - $ - $ - $ 4,297,883 - $ 4,297,883 $ 4,228,535 $ - $ - $ - $ 4,331,109 PGE21052 Appliance Standards Advocacy $ 4,687,282 $ 5,650,393 $ - $ - $ - $ 6,076,435 - $ 6,076,435 $ 4,698,784 $ - $ - $ - $ 4,774,497 PGE21053 Compliance Improvement $ 3,870,071 $ 4,182,764 $ - $ - $ - $ 4,347,595 - $ 4,347,595 $ 4,652,165 $ - $ - $ - $ 4,044,129 PGE21054 Reach Codes $ 1,429,957 $ 597,935 $ - $ - $ - $ 526,723 - $ 526,723 $ 518,145 $ - $ - $ - $ 604,747 PGE21055 Planning and Coordination $ 1,144,942 $ 531,663 $ - $ - $ - $ 504,030 - $ 504,030 $ 481,879 $ - $ - $ - $ 650,922 PGE21056 Code Readiness $ - $ 565,130 $ - $ - $ - $ 1,361,301 - $ 1,361,301 $ 1,636,495 $ - $ - $ - $ 1,778,436 PGE21057 National Codes & Standards Advocacy $ - $ - $ - $ - $ - $ - - $ - $ - $ - $ - $ - $ -
PGE2106 Emerging Technologies Programs Total $ 6,292,077 $ 5,821,061 $ - $ - $ - $ 7,930,755 - $ 7,930,755 $ 4,193,096 $ - $ - $ - $ 5,629,976 PGE21061 Technology Development Support $ 452,119 $ 747,678 $ - $ - $ - $ 1,416,527 - $ 1,416,527 $ 782,379 $ - $ - $ - $ 942,398 PGE21062 Technology Assessments $ 3,073,632 $ 1,815,758 $ - $ - $ - $ 2,544,857 - $ 2,544,857 $ 1,294,627 $ - $ - $ - $ 1,929,215 PGE21063 Technology Introduction Support $ 2,766,325 $ 3,257,624 $ - $ - $ - $ 3,969,371 - $ 3,969,371 $ 2,116,091 $ - $ - $ - $ 2,758,363
PGE2107
Workforce Education & Training Programs Total
$ 10,894,911
$ 10,166,215
$ -
$ -
$ -
$ 10,682,374
-
$ 10,682,374
$ 10,065,520
$ -
$ -
$ -
$ 11,038,180
PGE21071 Integrated Energy Education and Training $ 8,898,170 $ 7,896,227 $ - $ - $ - $ 8,733,939 - $ 8,733,939 $ 7,928,260 $ - $ - $ - $ 8,564,820 PGE21072 Connections $ 1,342,312 $ 1,755,612 $ - $ - $ - $ 1,328,476 - $ 1,328,476 $ 1,725,513 $ - $ - $ - $ 1,900,879 PGE21073 Strategic Planning $ 654,429 $ 514,375 $ - $ - $ - $ 619,959 - $ 619,959 $ 411,746 $ - $ - $ - $ 572,481 PGE21076 Career and Workforce Readiness $ - $ - $ - $ - $ - $ - - $ - $ - $ - $ - $ - $ -
PGE2108
Statewide DSM Coordination & Integration Program Total
$ 714,617
$ 450,154
$ -
$ -
$ -
$ 547,921
-
$ 547,921
$ 135,577
$ -
$ -
$ -
$ 547,921
PGE21081 Statewide DSM Coordination & Integration $ 714,617 $ 450,154 $ - $ - $ - $ 547,921 - $ 547,921 $ 135,577 $ - $ - $ - $ 547,921 PGE2109 Financing Programs Total $ 13,154,706 $ 3,957,816 $ - $ - $ - $ 4,600,866 - $ 4,600,866 $ 3,251,837 $ - $ - $ - $ 4,158,662
PGE21091 On-Bill Financing (excludes Loan Pool) $ 3,537,010 $ 3,115,051 $ - $ - $ - $ 1,939,167 - $ 1,939,167 $ 2,639,847 $ - $ - $ - $ 3,141,013 PGE21092 Third-Party Financing $ 1,220,879 $ 842,764 $ - $ - $ - $ 942,678 - $ 942,678 $ 550,872 $ - $ - $ - $ 660,195 PGE21093 New Financing Offerings [9] $ 8,396,816 $ - $ - $ - $ - $ 934,746 - $ 934,746 $ - $ - $ - $ - $ -
PGE210911 On Bill Financing Alternative Pathway $ - $ - $ - $ - $ - $ 784,275 - $ 784,275 $ 61,118 $ - $ - $ - $ 357,454 Third-Party Programs (Competitvely Bid)
Total
$ 74,814,071
$ 58,186,155
$ -
$ 2,620,229
$ -
$ 86,532,089
-
$ 86,532,089
$ 58,282,454
$ -
$ 21,209,506
$ -
$ 75,653,627 PGE2100 Residential Third Party Programs SubTotal $ 8,243,184 $ 8,768,360 $ - $ 10,343 $ - $ 9,667,015 - $ 9,667,015 $ 11,357,494 $ - $ 32,784 $ - $ 13,319,768
PGE21007 California New Homes Multifamily $ 1,856,291 $ 1,772,777 $ - $ - $ - $ 1,828,344 - $ 1,828,344 $ 1,277,592 $ - $ - $ - $ 1,460,826 PGE21008 Enhance Time Delay Relay $ 2,061,601 $ 2,676,931 $ - $ 10,343 $ - $ 2,902,239 - $ 2,902,239 $ 3,058,715 $ - $ 4,475 $ - $ 1,536,619 PGE21009 Direct Install for Manufactured and Mobile Homes $ 4,325,292 $ 3,743,310 $ - $ - $ - $ 3,743,632 - $ 3,743,632 $ 4,051,759 $ - $ 3,371 $ - $ 5,242,617
PGE210132 RSG The Smarter Water Heater $ - $ - $ - $ - $ - $ - - $ - $ - $ - $ - $ - $ - PGE210011 Residential Energy Fitness Program $ - $ 575,343 $ - $ - $ - $ 1,192,800 - $ 1,192,800 $ 2,969,428 $ - $ 24,938 $ - $ 5,079,706
PGE2101 Commercial Third Party Programs SubTotal $ 37,444,179 $ 27,279,393 $ - $ 1,784,984 $ - $ 31,191,606 - $ 31,191,606 $ 25,347,402 $ - $ 11,310,117 $ - $ 27,827,481 PGE210110 Monitoring-Based Persistence Commissioning $ - $ - $ - $ - $ - $ - - $ - $ - $ - $ - $ - $ - PGE210111 LodgingSavers $ 5,044,780 $ - $ - $ - $ - $ - - $ - $ - $ - $ - $ - $ - PGE210112 School Energy Efficiency $ 3,421,431 $ 2,174,599 $ - $ 485,773 $ - $ 1,512,412 - $ 1,512,412 $ 2,319,689 $ - $ 228,165 $ - $ 2,971,983 PGE210113 Energy Fitness Program $ 645,525 $ 613,180 $ - $ - $ - $ - - $ - $ 29 $ - $ - $ - $ - PGE210114 Energy Savers $ 309,153 $ 302,296 $ - $ - $ - $ - - $ - $ - $ - $ - $ - $ - PGE210115 RightLights $ 1,181,553 $ 1,089,928 $ - $ - $ - $ - - $ - $ - $ - $ - $ - $ - PGE210116 Small Business Commercial Comprehensive $ - $ - $ - $ - $ - $ - - $ - $ - $ - $ - $ - $ - PGE210117 Energy-Efficient Parking Garage $ - $ - $ - $ - $ - $ - - $ - $ - $ - $ - $ - $ - PGE210118 Retail Energy Efficiency $ 1,414,293 $ 1,448,343 $ - $ 284,065 $ - $ 3,856,419 - $ 3,856,419 $ 596,194 $ - $ - $ - $ - PGE210119 LED Accelerator $ 2,458,594 $ 529,771 $ - $ 720 $ - $ 4,174,961 - $ 4,174,961 $ 2,685,760 $ - $ 67,231 $ - $ 2,995,445 PGE210120 Monitoring-Based Commissioning $ - $ - $ - $ - $ - $ - - $ - $ - $ - $ - $ - $ - PGE210122 Casino Green $ 1,564,647 $ - $ - $ - $ - $ - - $ - $ - $ - $ - $ - $ - PGE210123 Healthcare Energy Efficiency Program $ 1,189,849 $ 935,964 $ - $ - $ - $ 1,371,119 - $ 1,371,119 $ 346,865 $ - $ 436,641 $ - $ 2,244,672

PA Name: Pacific Gas and Electric Company Budget Year: 2019
Table 4 – Budget, Spent, Unspent, Carryover Details
2016 Budget, Spent, Unspent and Carryover 2017 Budget, Fundshifts and Spending to Date 2
New/Existing Program #
Main Program Name / Sub-Program Name
2016 Total Budget with Commitments
& Fundshifts (G+J+M+N)
2016 Cycle Expenditures Spent
in 2016
2016 Unspent/Uncommit ed Funds Returned
to Ratepayers
2016 Commitments as
of 12/31/16 [5]
2016
Unspent/Uncom mitted Funds Available for 2018 offset
2017 Authorized Budget
2017 Fundshifts
2017 Total Budget
2017 Cycle Expenditures Spent
in 2017
2016 Unspent/Uncommited
Funds Returned to Ratepayers
2017 Commitments as
of 12/31/17 [5]
2017 Unspent/Uncommitte d Funds Available for
2018 offset
2018 Authorized Budget [12]
PGE210124 Ozone Laundry Energy Efficiency $ - $ - $ - $ - $ - $ - - $ - $ - $ - $ - $ - $ - PGE210125 California Preschool Energy Efficiency Program $ - $ - $ - $ - $ - $ - - $ - $ - $ - $ - $ - $ - PGE210126 K-12 Private Schools and Colleges Audit Retro $ 1,844,726 $ 1,671,226 $ - $ 28,107 $ - $ 1,959,233 - $ 1,959,233 $ 274,675 $ - $ - $ - $ -
PGE210127
Innovative Designs for Energy Efficiency Approaches (IDEEA)
$ 10,272,122
$ -
$ -
$ -
$ -
$ -
-
$ -
$ -
$ -
$ -
$ -
$ -
PGE210128 Enovity SMART $ - $ 304,130 $ - $ - $ - $ - - $ - $ (196) $ - $ - $ - $ - PGE210129 Nexant AERCx $ - $ 277,389 $ - $ - $ - $ - - $ - $ (0) $ - $ - $ - $ - PGE210130 CLEAResult AERCx $ - $ 286,046 $ - $ - $ - $ - - $ - $ 147,432 $ - $ - $ - $ - PGE210131 PECI AERCx $ - $ (19,156) $ - $ - $ - $ - - $ - $ 93,714 $ - $ - $ - $ - PGE210136 McKinstry Laboratory Fume Hoods $ - $ (26,114) $ - $ - $ - $ - - $ - $ - $ - $ - $ - $ - PGE210137 Waypoint Commercial Outreach $ - $ 598,588 $ - $ - $ - $ 901,094 - $ 901,094 $ 8,014 $ - $ - $ - $ - PGE210138 Data Center Air Flow and Temp Optimization $ - $ 251,159 $ - $ - $ - $ 512,895 - $ 512,895 $ 202,388 $ - $ - $ - $ - PGE210139 SEI Energize Schools Program $ - $ 517,681 $ - $ - $ - $ 411,884 - $ 411,884 $ 444,299 $ - $ - $ - $ 316,125 PGE210140 Mazzetti Dynamic Gas Scavenging System $ - $ 97 $ - $ - $ - $ - - $ - $ - $ - $ - $ - $ - PGE210141 Lincus Commercial Mid-Market Program $ - $ 5,459 $ - $ - $ - $ - - $ - $ - $ - $ - $ - $ - PGE210143 Hospitality Program $ (2,049,313) $ 9,748,754 $ - $ 866,140 $ - $ 8,828,990 - $ 8,828,990 $ 9,399,480 $ - $ 254,143 $ - $ 12,626,882
PGE21016 Air Care Plus $ 604,146 $ (356,235) $ - $ - $ - $ - - $ - $ 263,282 $ - $ - $ - $ - PGE21017 Boiler Energy Efficiency Program $ 2,086,213 $ 917,469 $ - $ 78,065 $ - $ 806,844 - $ 806,844 $ 805,932 $ - $ - $ - $ - PGE21018 EnergySmart Grocer $ 7,456,460 $ 5,966,916 $ - $ 42,115 $ - $ 6,855,755 - $ 6,855,755 $ 7,759,847 $ - $ 10,323,937 $ - $ 6,672,373 PGE21019 Enhanced Automation Initiative $ - $ 41,905 $ - $ - $ - $ - - $ - $ - $ - $ - $ - $ -
PGE2103 Agricultural Third Party Programs SubTotal $ 8,227,091 $ 5,886,232 $ - $ 642,431 $ - $ 15,982,677 - $ 15,982,677 $ 5,916,331 $ - $ 2,625,063 $ - $ 8,589,707 PGE210310 Dairy Industry Resource Advantage Pgm $ 1,480,754 $ - $ - $ - $ - $ - - $ - $ - $ - $ - $ - $ -
PGE210311
Process Wastewater Treatment EM Pgm for Ag Food Processing
$ 1,065,359
$ 476,641
$ -
$ -
$ -
$ 1,110,018
-
$ 1,110,018
$ 390,611
$ -
$ 18,585
$ -
$ 988,763
PGE210312 Dairy and Winery Industry Efficiency Solutions $ - $ 3,390,664 $ - $ 522,869 $ - $ 4,386,895 - $ 4,386,895 $ 1,941,705 $ - $ 784,461 $ - $ 3,350,121 PGE210133 Staples Low Pressure Irrigation DI $ - $ 63,210 $ - $ - $ - $ - - $ - $ - $ - $ - $ - $ -
PGE21035 Dairy Energy Efficiency Program $ 472,638 $ 1,157 $ - $ - $ - $ - - $ - $ - $ - $ - $ - $ - PGE21036 Industrial Refrigeration Performance Plus $ 1,419,916 $ 160,199 $ - $ - $ - $ 2,266,145 - $ 2,266,145 $ 471,847 $ - $ 491,197 $ - $ 692,777 PGE21037 Light Exchange Program $ 1,046,700 $ 751 $ - $ - $ - $ - - $ - $ - $ - $ - $ - $ - PGE21038 Wine Industry Efficiency Solutions $ 1,677,221 $ - $ - $ - $ - $ - - $ - $ - $ - $ - $ - $ -
PGE21039
Comprehensive Food Process Audit & Resource Efficiency Pgm
$ 1,064,504
$ 1,793,610
$ -
$ 119,561
$ -
$ 8,219,619
-
$ 8,219,619
$ 3,112,167
$ -
$ 1,330,820
$ -
$ 3,558,046
PGE2102 Industrial Third Party Programs SubTotal $ 20,899,617 $ 16,205,955 $ - $ 182,471 $ - $ 29,690,792 - $ 29,690,792 $ 15,661,227 $ - $ 7,241,542 $ - $ 25,916,672 PGE210210 Industrial Recommissioning Program $ 1,372,850 $ 1,350,434 $ - $ - $ - $ 1,669,289 - $ 1,669,289 $ 446,488 $ - $ 646,889 $ - $ 2,245,631 PGE210211 Light Industrial Energy Efficiency $ - $ 47,944 $ - $ - $ - $ 1,120,799 - $ 1,120,799 $ 217,555 $ - $ 45,855 $ - $ 546,368 PGE210212 Industrial Compressed Air System Efficiency $ - $ 245,729 $ - $ - $ - $ 889,186 - $ 889,186 $ 233,412 $ - $ 185,778 $ - $ 270,590 PGE210213 Small Petrochemical Energy Efficiency $ - $ 96,290 $ - $ - $ - $ 1,228,940 - $ 1,228,940 $ 236,774 $ - $ 3,624 $ - $ 714,660
PGE21025 California Wastewater Process Optimization $ 995,518 $ 644,407 $ - $ - $ - $ 879,788 - $ 879,788 $ 167,288 $ - $ 284,814 $ - $ 1,227,756 PGE21026 Energy Efficiency Services for Oil Production $ 4,475,267 $ 1,510,663 $ - $ - $ - $ 5,028,847 - $ 5,028,847 $ 1,134,765 $ - $ 1,621,548 $ - $ 3,737,735 PGE21027 Heavy Industry Energy Efficiency Program $ 11,067,518 $ 8,839,023 $ - $ 182,471 $ - $ 15,288,395 - $ 15,288,395 $ 8,478,932 $ - $ 1,794,208 $ - $ 13,179,841 PGE21028 Industrial Compressed Air Program $ 1,678,196 $ 18,634 $ - $ - $ - $ - - $ - $ (3,719) $ - $ - $ - $ - PGE21029 Refinery Energy Efficiency Program $ 1,310,269 $ 591,228 $ - $ - $ - $ 952,965 - $ 952,965 $ 1,520,486 $ - $ 2,567,126 $ - $ 1,666,727
PGE210135 Lincus WISE $ - $ 2,861,492 $ - $ - $ - $ 2,632,582 - $ 2,632,582 $ 3,229,245 $ - $ 91,700 $ - $ 2,327,364 PGE210142 Ameresco Intelligent Energy Efficiency $ - $ 110 $ - $ - $ - $ - - $ - $ - $ - $ - $ - $ -
PGE2107
Workforce Education & Training Third Party Programs SubTotal
$ -
$ 46,214
$ -
$ -
$ -
$ -
-
$ -
$ -
$ -
$ -
$ -
$ -
PGE21074 Builder Energy Code Training $ - $ - $ - $ - $ - $ - - $ - $ - $ - $ - $ - $ - PGE21075 Green Building Technical Support Services $ - $ - $ - $ - $ - $ - - $ - $ - $ - $ - $ - $ -
PGE210134 Bridges to Energy Sector Opportunities $ - $ 46,214 $ - $ - $ - $ - - $ - $ - $ - $ - $ - $ - PGE2110 Government Partnership Programs Total $ 69,024,961 $ 63,692,329 $ - $ 6,076,600 $ - $ 74,542,976 - $ 74,542,976 $ 56,789,532 $ - $ 3,815,328 $ - $ 72,368,174
PGE2110011 California Community Colleges $ 3,495,392 $ 2,936,598 $ - $ 1,263,079 $ - $ 2,650,376 - $ 2,650,376 $ 991,734 $ - $ 779,480 $ - $ 4,448,702 PGE2110012 University $ 8,504,419 $ 4,160,265 $ - $ 3,248,820 $ - $ 6,135,203 - $ 6,135,203 $ 3,495,997 $ - $ 1,877,527 $ - $ 4,703,997 PGE2110013 State of California $ 1,423,968 $ 597,810 $ - $ - $ - $ 922,797 - $ 922,797 $ 657,152 $ - $ 9,990 $ - $ 1,005,394 PGE2110014 Department of Corrections and Rehabilitation $ 3,199,909 $ 1,395,816 $ - $ 715,062 $ - $ 2,036,885 - $ 2,036,885 $ 703,393 $ - $ 818,225 $ - $ 1,677,562
PGE2110051
Local Government Energy Action Resources (LGEAR)
$ 5,500,535
$ 8,894,255
$ -
$ 15,808
$ -
$ 8,687,570
-
$ 8,687,570
$ 3,504,107
$ -
$ -
$ -
$ 6,059,173
PGE2110052 Strategic Energy Resources $ 2,764,003 $ 7,633,159 $ - $ - $ - $ 9,885,399 - $ 9,885,399 $ 7,138,904 $ - $ - $ - $ 9,632,258
PGE211007
Association of Monterey Bay Area Governments (AMBAG)
$ 3,581,301
$ 3,472,920
$ -
$ 101,248
$ -
$ 3,732,609
-
$ 3,732,609
$ 4,056,257
$ -
$ 58,408
$ -
$ 3,744,061
PGE211009 East Bay $ 9,262,008 $ 6,597,937 $ - $ 97,015 $ - $ 6,093,616 - $ 6,093,616 $ 6,136,966 $ - $ 57,559 $ - $ 6,129,105 PGE211010 Fresno $ 3,846,492 $ 2,698,158 $ - $ 1,787 $ - $ 2,601,225 - $ 2,601,225 $ 1,920,517 $ - $ 98,291 $ - $ 2,648,728 PGE211011 Kern $ 3,194,412 $ 2,497,282 $ - $ - $ - $ 2,680,280 - $ 2,680,280 $ 2,436,122 $ - $ - $ - $ 2,725,208 PGE211012 Madera $ 445,314 $ 314,528 $ - $ - $ - $ 326,472 - $ 326,472 $ 413,979 $ - $ - $ - $ 363,621 PGE211013 Marin County $ 1,334,743 $ 1,221,459 $ - $ 2,373 $ - $ 1,281,629 - $ 1,281,629 $ 747,329 $ - $ 3,585 $ - $ 1,271,550 PGE211014 Mendocino/Lake County $ 322,506 $ 666,557 $ - $ - $ - $ 634,221 - $ 634,221 $ 545,040 $ - $ - $ - $ 711,132 PGE211015 Napa County $ 549,632 $ 439,889 $ - $ - $ - $ 530,485 - $ 530,485 $ 311,606 $ - $ - $ - $ 557,007 PGE211016 Redwood Coast $ 1,556,910 $ 1,332,988 $ - $ 5,429 $ - $ 1,609,191 - $ 1,609,191 $ 1,192,649 $ - $ 46 $ - $ 1,598,179 PGE211018 San Luis Obispo County $ 936,840 $ 1,169,461 $ - $ - $ - $ 1,054,111 - $ 1,054,111 $ 1,183,580 $ - $ - $ - $ 1,076,601 PGE211019 San Mateo County $ 1,744,567 $ 1,999,253 $ - $ 136,065 $ - $ 2,271,691 - $ 2,271,691 $ 1,822,151 $ - $ - $ - $ 2,279,756 PGE211020 Santa Barbara $ 1,184,837 $ 852,691 $ - $ - $ - $ 973,018 - $ 973,018 $ 578,544 $ - $ - $ - $ 1,008,901 PGE211021 Sierra Nevada $ 2,560,460 $ 2,189,823 $ - $ 8,718 $ - $ 2,391,132 - $ 2,391,132 $ 1,404,108 $ - $ 15,794 $ - $ 2,422,994 PGE211022 Sonoma County $ 1,709,718 $ 1,647,877 $ - $ 534 $ - $ 1,764,538 - $ 1,764,538 $ 2,301,325 $ - $ 14,177 $ - $ 1,756,500 PGE211023 Silicon Valley $ 4,074,436 $ 3,934,221 $ - $ 323,658 $ - $ 3,793,893 - $ 3,793,893 $ 5,110,637 $ - $ - $ - $ 3,762,183

PA Name: Pacific Gas and Electric Company Budget Year: 2019
Table 4 – Budget, Spent, Unspent, Carryover Details
2016 Budget, Spent, Unspent and Carryover 2017 Budget, Fundshifts and Spending to Date 2
New/Existing Program #
Main Program Name / Sub-Program Name
2016 Total Budget with Commitments
& Fundshifts (G+J+M+N)
2016 Cycle Expenditures Spent
in 2016
2016 Unspent/Uncommit ed Funds Returned
to Ratepayers
2016 Commitments as
of 12/31/16 [5]
2016
Unspent/Uncom mitted Funds Available for 2018 offset
2017 Authorized Budget
2017 Fundshifts
2017 Total Budget
2017 Cycle Expenditures Spent
in 2017
2016 Unspent/Uncommited
Funds Returned to Ratepayers
2017 Commitments as
of 12/31/17 [5]
2017 Unspent/Uncommitte d Funds Available for
2018 offset
2018 Authorized Budget [12]
PGE211024 San Francisco $ 7,832,558 $ 7,039,384 $ - $ 157,003 $ - $ 6,168,064 - $ 6,168,064 $ 4,056,751 $ - $ 36,758 $ - $ 6,315,049 PGE211026 North Valley $ - $ - $ - $ - $ - $ 1,908,356 - $ 1,908,356 $ 536,650 $ - $ - $ - $ 1,898,230 PGE211027 Sutter Buttes $ - $ - $ - $ - $ - $ 446,216 - $ 446,216 $ 343,251 $ - $ - $ - $ 495,328 PGE211028 Yolo $ - $ - $ - $ - $ - $ 357,936 - $ 357,936 $ 256,813 $ - $ - $ - $ 415,574 PGE211029 Solano $ - $ - $ - $ - $ - $ 1,472,213 - $ 1,472,213 $ 2,262,743 $ - $ 45,272 $ - $ 1,480,725 PGE211030 Northern San Joaquin Valley $ - $ - $ - $ - $ - $ 1,443,028 - $ 1,443,028 $ 2,202,379 $ - $ 216 $ - $ 1,455,492 PGE211031 Valley Innovative Energy Watch (VIEW) $ - $ - $ - $ - $ - $ 690,825 - $ 690,825 $ 478,848 $ - $ - $ - $ 725,163
Funds to be returned in rates [4] $ - $ - $ - $ - $ - $ - - $ - $ - $ - $ - $ - $ - 2013-2015 funds transferred to REN and
CCA balancing accounts for 2016 [6]
$ -
$ -
$ -
$ -
$ -
$ -
-
$ -
$ -
$ -
$ -
$ -
$ -
Pre-2013 Unspent Funds transferred to 2016 Commercial Deemed Incentives program [3]
$ -
$ -
$ -
$ -
$ -
-
$ -
$ -
$ -
$ -
$ -
$ - PG&E PROGRAM TOTAL $ 419,703,607 $ 376,577,485 $ - $ 48,833,978 $ - $ 376,108,857 $ - $ 376,108,857 $ 295,536,016 $ - $ 42,456,987 $ - $ 352,460,723 EM&V EM&V (PA & CPUC Portions) Total $ 38,340,181 $ 1,531,591 $ - $ 15,672,827 $ - $ 16,988,842 $ - $ 16,988,842 $ 2,509,699 $ - $ 14,479,143 $ - $ 16,522,072
PGE_EMV PG&E EM&V - CPUC $ 29,230,527 $ 477,668 $ - $ 11,723,301 $ - $ 11,653,492 - $ 11,653,492 $ 524,259 $ - $ 11,129,233 $ - $ 11,055,064 PGE_EMV PG&E EM&V - PG&E $ 9,109,655 $ 1,053,923 $ - $ 3,949,526 $ - $ 4,580,210 - $ 4,580,210 $ 2,083,440 $ - $ 2,496,770 $ - $ 4,193,300 PGE_EMV BayREN EM&V - CPUC $ - $ - $ - $ - $ - $ 499,555 - $ 499,555 $ (98,001) $ - $ 597,556 $ - $ 675,609 PGE_EMV BayREN EM&V $ - $ - $ - $ - $ - $ 189,486 - $ 189,486 $ - $ - $ 189,486 $ - $ 256,266 PGE_EMV MCE EM&V - CPUC $ - $ - $ - $ - $ - $ 47,921 - $ 47,921 $ - $ - $ 47,921 $ - $ 247,829 PGE_EMV MCE EM&V $ - $ - $ - $ - $ - $ 18,177 - $ 18,177 $ - $ - $ 18,177 $ - $ 94,004 PGE_EMV 3C REN EM&V - CPUC $ - $ - $ - $ - $ - $ - - $ - $ - $ - $ - $ - $ - PGE_EMV 3C REN EM&V $ - $ - $ - $ - $ - $ - - $ - $ - $ - $ - $ - $ -
PG&E TOTAL with EM&V $ 458,043,789 $ 378,109,077 $ - $ 64,506,805 $ - $ 393,097,699 - $ 393,097,699 $ 298,045,715 $ - $ 56,936,130 $ - $ 368,982,795 PGE_BayREN BayREN [10] $ 20,297,885 $ 17,379,767 $ - $ - $ - $ 16,537,000 - $ 16,537,000 $ 16,494,231 $ - $ 42,769 $ - $ 22,365,000 PGE_MCE Marin Clean Energy [10] $ 1,622,529 $ 1,428,096 $ 311,915 $ 104,615 $ - $ 1,586,347 - $ 1,586,347 $ 1,816,622 $ - $ - $ - $ 8,204,000 PGE_3C REN 3C REN [10] $ - $ - $ - $ - $ - $ - - $ - $ - $ - $ - $ - $ -
TOTAL PG&E EE EXPENSE PORTFOLIO $ 479,964,203 $ 396,916,939 $ 311,915 $ 64,611,421 $ - $ 411,221,046 $ - $ 411,221,046 $ 316,356,567 $ - $ 56,978,899 $ - $ 399,551,795
PGE21091LP OBF REVOLVING LOAN POOL $ 25,682,517 $ 2,224,457 $ - $ 7,775,543 $ - $ 13,500,000 - $ 13,500,000 $ 8,344,822 $ - $ 5,155,178 $ - $ 13,500,000
TOTAL PG&E EE PORTFOLIO $ 505,646,720 $ 399,141,396 $ 311,915 $ 72,386,964 $ - $ 424,721,046 - $ 424,721,046 $ 324,701,390 $ - $ 62,134,077 $ - $ 413,051,795
Other EE-Related Budgets
PGE_SWMEO
Statewide Marketing, Education and Outreach Program Total
$ 8,445,775
$ 7,689,442
$ -
$ -
$ -
$ 6,840,739
-
$ 6,840,739
$ 7,269,185
$ -
$ -
$ -
$ 6,840,979
PGE_SWMEO
Statewide Marketing, Education and Outreach Program (Flex Alert) [11]
$ -
$ -
$ -
$ -
$ -
$ -
-
$ -
$ -
$ -
$ -
$ -
$ -
PGE_SWMEO
Statewide Marketing, Education and Outreach Program [11]
$ 8,445,775
$ 7,689,442
$ -
$ -
$ -
$ 6,840,739
-
$ 6,840,739
$ 7,269,185
$ -
$ -
$ -
$ 6,840,979
Notes: 1. "2015 Total Budget with Commitments & Fundshifts" reflects funds available for 2015, from the authorized 2013-2015 Budget, less the spending in 2013 - 2014 from the 2013 - 2015 Budget. 2. "2015 Total Budget Spent" includes spending in 2015 paid from the 2013 - 2015 Budget. 3. “Requested Carry Over of pre-2013 Unspent Funds to 2016” identifies the funds PG&E is requesting to carry over to 2016 in supplemental Advice 3752-G-B/4905-E-B, which was approved on November 2, 2016. In addition to the amounts identified at the subprogram level in column G, PG&Ewas approved authorization to shift $9.9m of pre-2013 unspent funds into the Commercial Deemed Incentive program 2016 budget. 4. The CPUC approved AL 3718-G/4852-E on July 11, 2016, authorizing PG&E to return a total of $43,024,401.85 in unspent, uncommitted energy efficiency funds from its 2013-2015 program cycle to its customers; PG&E implemented this through a one-time adjustment to its gas and electric EE balancing accounts. 5. Commitments as of 12/31/2015 (column I), 12/31/2016 (column R), and 12/31/2017 (column Y) includes incentive Commitments as of the end of the year indicated. Contractual encumbrances are not reflected. BayREN and MCE Carry Over figures represent the level of funds in PG&E’s balancing accounts; this may include BayREN expenses or MCE gas expenses not yet invoiced to or accrued by PG&E as of the year indicated; the remainder is the amount potentially available for carry over; these may not match MCE or BayREN submissions. 6. 2013-2015 Unspent/Committed Funds, Carryover to 2016" Identifies unspent, committed funds that are carried over into 2016 and augment the 2016 budget, in accordance with D.12-11-015, as follows:
New Financing Offerings: In D. 15-06-008, the Commission ordered that PG&E operate for a minimum of 24 months from the point at which each pilot program enrolls its first loan. The Pilots have begun enrolling loans in 2016 indicating that the pilots will run until at least 2018. New financing pilot subprogram funds collected during 2013-2014 period are being carried over to continue to operate during this compliance period. Funds Transferred to REN and CCA balancing accounts: In D.16-05-004 (petition to modify D.14-10-046), effective May 12, 2016, the Commission authorized for Marin Clean Energy (MCE) an annual budget increase of $366,080 for the duration of the ten-year rolling portfolio cycle unless and until modified by the Commission. The CPUC approved AL 3718-G/4852-E on July 11, 2016, authorizing PG&E to use unspent 2013-2015 unspent funds to fund the increase in MCE’s 2016 budget. Advice Letter 3704-G/4826-E, effective April 29, 2016, authorized for BayREN a one-time budget increase of $3,700,000 transferred from unspent 2013-2015 cycle EE funds to the 2016 cycle.
Marin Clean Energy: MCE’s 2015 authorized gas budget included $419,000. The Commission authorized a gas budget of $219,000 in D.14-10-046 and augmented the gas budget by $200,000 per PG&E Advice 3642-G/4720-E, filed 10/15/2015, approved 10/28/2015. After $382,818 of gas payments from PG&E to MCE, $36,182 is available for carryover to 2016.
7. “Pre-2016 unspent/uncommitted funds available for 2017 offset” identifies 2013–2015 cycle unspent funds at the program level. The balancing account transfer for $43 million of funds refunded to customers based on Advice Letter 3718-G/4852-E is identified on Row 154. Unspent funds from 2009 and 2010–2012 are represented in Column G. In 2017 PG&E recorded a one-time electric EE balancing account adjustment of $230,474 crediting customer rates for unspent 2015-2016 Marin Clean Energy Electric funds. In the 2018 ABAL, It had been pointed out that of the $230,474, a refund should have occurred in the amount of $311,915 from the 2016 cycle, while an increase of $81,441 should have been applied to the 2013-2015 cycle.
8. “2019 Proposed Budget” reflects the budget request for 2019, which differs from the collections requested through this advice letter of approximately $408.8 million.
9. Advice Letter 3589-G-C/4624-E-C, approved June 29, 2015, effective June 25, 2015 established the Energy Efficiency Financing Balancing Account (EEFBA), and the Credit Enhancement Balance Account (CEBA) and the On-Bill Financing Balancing Account (OBFBA) subaccounts. The $14 million referenced in cell H57 was transferred to the CEBA subaccount. 10. BayREN, MCE and 3C-REN figures generally represent the level of funds in PG&E’s balancing accounts and may not match MCE or BayREN submissions. calculations. 12. The "2018 Authorized Budget" in Table 4 represents PG&E's 2018 CEDARS filing budget at the subprogram level detail, and BayREN and MCE's approved budgets per the Business Plan Decision D.18-05- 041. This budget is lower than PG&E's 2018 portfolio budget of $416,713,780, also approved in D.18-05-041. Subprogram level detail is unavailable in the approved Business Plan budget. 13. 2019 BayREN and MCE budgets are the authorized amounts from the Business Plan decision D.18-05-041, with their EM&V budgets increased to be 4% of their total budget. 14. 2019 3C-REN budget is the proposed contribution for PG&E as circulated by 3C-REN on August 28, 2018, which includes 4% EM&V.
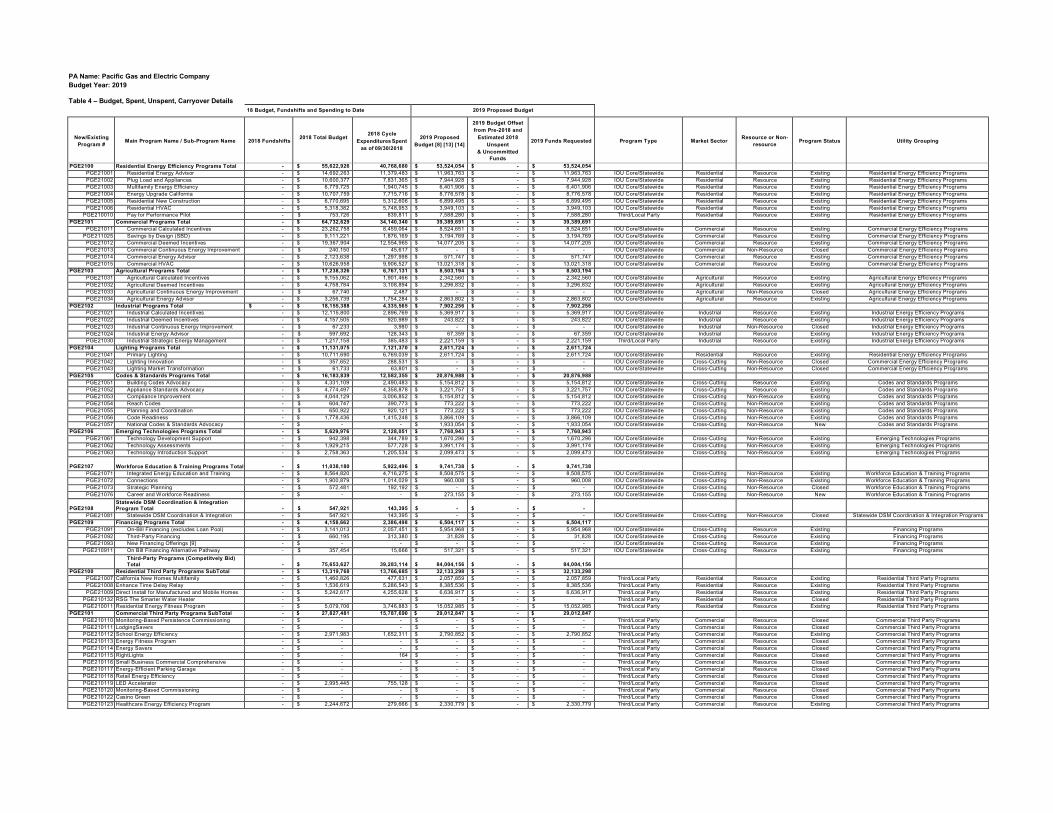
PA Name: Pacific Gas and Electric Company Budget Year: 2019
Table 4 – Budget, Spent, Unspent, Carryover Details
18 Budget, Fundshifts and Spending to Date 2019 Proposed Budget
New/Existing Program #
Main Program Name / Sub-Program Name
2018 Fundshifts
2018 Total Budget
2018 Cycle Expenditures Spent
as of 09/30/2018
2019 Proposed Budget [8] [13] [14]
2019 Budget Offset from Pre-2018 and
Estimated 2018 Unspent
& Uncommitted Funds
2019 Funds Requested
Program Type
Market Sector
Resource or Non- resource
Program Status
Utility Grouping
PGE2100 Residential Energy Efficiency Programs Total - $ 55,622,926 40,768,680 $ 53,524,054 $ - $ 53,524,054
PGE21001 Residential Energy Advisor - $ 14,692,263 11,379,483 $ 11,963,763 $ - $ 11,963,763 IOU Core/Statewide Residential Resource Existing Residential Energy Efficiency Programs PGE21002 Plug Load and Appliances - $ 10,600,377 7,831,365 $ 7,944,928 $ - $ 7,944,928 IOU Core/Statewide Residential Resource Existing Residential Energy Efficiency Programs PGE21003 Multifamily Energy Efficiency - $ 6,779,725 1,940,745 $ 6,401,906 $ - $ 6,401,906 IOU Core/Statewide Residential Resource Existing Residential Energy Efficiency Programs PGE21004 Energy Upgrade California - $ 10,707,759 7,715,716 $ 8,776,578 $ - $ 8,776,578 IOU Core/Statewide Residential Resource Existing Residential Energy Efficiency Programs PGE21005 Residential New Construction - $ 6,770,695 5,312,606 $ 6,899,495 $ - $ 6,899,495 IOU Core/Statewide Residential Resource Existing Residential Energy Efficiency Programs PGE21006 Residential HVAC - $ 5,318,382 5,748,953 $ 3,949,103 $ - $ 3,949,103 IOU Core/Statewide Residential Resource Existing Residential Energy Efficiency Programs
PGE210010 Pay for Performance Pilot - $ 753,726 839,811 $ 7,588,280 $ - $ 7,588,280 Third/Local Party Residential Resource Existing Residential Energy Efficiency Programs PGE2101 Commercial Programs Total - $ 64,732,629 34,140,340 $ 39,389,691 $ - $ 39,389,691
PGE21011 Commercial Calculated Incentives - $ 23,262,758 8,459,064 $ 8,524,651 $ - $ 8,524,651 IOU Core/Statewide Commercial Resource Existing Commercial Energy Efficiency Programs PGE211025 Savings by Design (SBD) - $ 9,111,221 1,876,169 $ 3,194,769 $ - $ 3,194,769 IOU Core/Statewide Commercial Resource Existing Commercial Energy Efficiency Programs
PGE21012 Commercial Deemed Incentives - $ 19,367,904 12,554,965 $ 14,077,205 $ - $ 14,077,205 IOU Core/Statewide Commercial Resource Existing Commercial Energy Efficiency Programs PGE21013 Commercial Continuous Energy Improvement - $ 240,150 45,617 $ - $ - $ - IOU Core/Statewide Commercial Non-Resource Closed Commercial Energy Efficiency Programs PGE21014 Commercial Energy Advisor - $ 2,123,638 1,297,998 $ 571,747 $ - $ 571,747 IOU Core/Statewide Commercial Resource Existing Commercial Energy Efficiency Programs PGE21015 Commercial HVAC - $ 10,626,958 9,906,527 $ 13,021,318 $ - $ 13,021,318 IOU Core/Statewide Commercial Resource Existing Commercial Energy Efficiency Programs
PGE2103 Agricultural Programs Total - $ 17,238,326 6,767,131 $ 8,503,194 $ - $ 8,503,194
PGE21031 Agricultural Calculated Incentives - $ 9,155,062 1,901,466 $ 2,342,560 $ - $ 2,342,560 IOU Core/Statewide Agricultural Resource Existing Agricultural Energy Efficiency Programs PGE21032 Agricultural Deemed Incentives - $ 4,758,784 3,108,894 $ 3,296,832 $ - $ 3,296,832 IOU Core/Statewide Agricultural Resource Existing Agricultural Energy Efficiency Programs PGE21033 Agricultural Continuous Energy Improvement - $ 67,740 2,487 $ - $ - $ - IOU Core/Statewide Agricultural Non-Resource Closed Agricultural Energy Efficiency Programs PGE21034 Agricultural Energy Advisor - $ 3,256,739 1,754,284 $ 2,863,802 $ - $ 2,863,802 IOU Core/Statewide Agricultural Resource Existing Agricultural Energy Efficiency Programs
PGE2102 Industrial Programs Total $ - $ 18,155,388 4,335,565 $ 7,902,256 $ - $ 7,902,256
PGE21021 Industrial Calculated Incentives - $ 12,115,800 2,896,769 $ 5,369,917 $ - $ 5,369,917 IOU Core/Statewide Industrial Resource Existing Industrial Energy Efficiency Programs PGE21022 Industrial Deemed Incentives - $ 4,157,505 920,989 $ 243,822 $ - $ 243,822 IOU Core/Statewide Industrial Resource Existing Industrial Energy Efficiency Programs PGE21023 Industrial Continuous Energy Improvement - $ 67,233 3,980 $ - $ - $ - IOU Core/Statewide Industrial Non-Resource Closed Industrial Energy Efficiency Programs PGE21024 Industrial Energy Advisor - $ 597,692 128,343 $ 67,359 $ - $ 67,359 IOU Core/Statewide Industrial Resource Existing Industrial Energy Efficiency Programs PGE21030 Industrial Strategic Energy Management - $ 1,217,158 385,483 $ 2,221,159 $ - $ 2,221,159 Third/Local Party Industrial Resource Existing Industrial Energy Efficiency Programs
PGE2104 Lighting Programs Total - $ 11,131,075 7,121,370 $ 2,611,724 $ - $ 2,611,724
PGE21041 Primary Lighting - $ 10,711,690 6,769,039 $ 2,611,724 $ - $ 2,611,724 IOU Core/Statewide Residential Resource Existing Residential Energy Efficiency Programs PGE21042 Lighting Innovation - $ 357,652 288,531 $ - $ - $ - IOU Core/Statewide Cross-Cutting Non-Resource Closed Commercial Energy Efficiency Programs PGE21043 Lighting Market Transformation - $ 61,733 63,801 $ - $ - $ - IOU Core/Statewide Cross-Cutting Non-Resource Closed Commercial Energy Efficiency Programs
PGE2105 Codes & Standards Programs Total - $ 16,183,839 12,582,355 $ 20,876,988 $ - $ 20,876,988
PGE21051 Building Codes Advocacy - $ 4,331,109 2,490,483 $ 5,154,812 $ - $ 5,154,812 IOU Core/Statewide Cross-Cutting Resource Existing Codes and Standards Programs PGE21052 Appliance Standards Advocacy - $ 4,774,497 4,358,878 $ 3,221,757 $ - $ 3,221,757 IOU Core/Statewide Cross-Cutting Resource Existing Codes and Standards Programs PGE21053 Compliance Improvement - $ 4,044,129 3,006,852 $ 5,154,812 $ - $ 5,154,812 IOU Core/Statewide Cross-Cutting Non-Resource Existing Codes and Standards Programs PGE21054 Reach Codes - $ 604,747 390,773 $ 773,222 $ - $ 773,222 IOU Core/Statewide Cross-Cutting Non-Resource Existing Codes and Standards Programs PGE21055 Planning and Coordination - $ 650,922 920,121 $ 773,222 $ - $ 773,222 IOU Core/Statewide Cross-Cutting Non-Resource Existing Codes and Standards Programs PGE21056 Code Readiness - $ 1,778,436 1,415,248 $ 3,866,109 $ - $ 3,866,109 IOU Core/Statewide Cross-Cutting Non-Resource Existing Codes and Standards Programs PGE21057 National Codes & Standards Advocacy - $ - - $ 1,933,054 $ - $ 1,933,054 IOU Core/Statewide Cross-Cutting Non-Resource New Codes and Standards Programs
PGE2106 Emerging Technologies Programs Total - $ 5,629,976 2,128,051 $ 7,760,943 $ - $ 7,760,943
PGE21061 Technology Development Support - $ 942,398 344,789 $ 1,670,296 $ - $ 1,670,296 IOU Core/Statewide Cross-Cutting Non-Resource Existing Emerging Technologies Programs PGE21062 Technology Assessments - $ 1,929,215 577,728 $ 3,991,174 $ - $ 3,991,174 IOU Core/Statewide Cross-Cutting Non-Resource Existing Emerging Technologies Programs PGE21063 Technology Introduction Support - $ 2,758,363 1,205,534 $ 2,099,473 $ - $ 2,099,473 IOU Core/Statewide Cross-Cutting Non-Resource Existing Emerging Technologies Programs
PGE2107
Workforce Education & Training Programs Total
-
$ 11,038,180
5,922,496
$ 9,741,738
$ -
$ 9,741,738
PGE21071 Integrated Energy Education and Training - $ 8,564,820 4,716,275 $ 8,508,575 $ - $ 8,508,575 IOU Core/Statewide Cross-Cutting Non-Resource Existing Workforce Education & Training Programs PGE21072 Connections - $ 1,900,879 1,014,029 $ 960,008 $ - $ 960,008 IOU Core/Statewide Cross-Cutting Non-Resource Existing Workforce Education & Training Programs PGE21073 Strategic Planning - $ 572,481 192,192 $ - $ - $ - IOU Core/Statewide Cross-Cutting Non-Resource Closed Workforce Education & Training Programs PGE21076 Career and Workforce Readiness - $ - - $ 273,155 $ - $ 273,155 IOU Core/Statewide Cross-Cutting Non-Resource New Workforce Education & Training Programs
PGE2108
Statewide DSM Coordination & Integration Program Total
-
$ 547,921
143,395
$ -
$ -
$ -
PGE21081 Statewide DSM Coordination & Integration - $ 547,921 143,395 $ - $ - $ - IOU Core/Statewide Cross-Cutting Non-Resource Closed Statewide DSM Coordination & Integration Programs PGE2109 Financing Programs Total - $ 4,158,662 2,386,498 $ 6,504,117 $ - $ 6,504,117
PGE21091 On-Bill Financing (excludes Loan Pool) - $ 3,141,013 2,057,451 $ 5,954,968 $ - $ 5,954,968 IOU Core/Statewide Cross-Cutting Resource Existing Financing Programs PGE21092 Third-Party Financing - $ 660,195 313,380 $ 31,828 $ - $ 31,828 IOU Core/Statewide Cross-Cutting Resource Existing Financing Programs PGE21093 New Financing Offerings [9] - $ - - $ - $ - $ - IOU Core/Statewide Cross-Cutting Resource Existing Financing Programs
PGE210911 On Bill Financing Alternative Pathway - $ 357,454 15,666 $ 517,321 $ - $ 517,321 IOU Core/Statewide Cross-Cutting Resource Existing Financing Programs Third-Party Programs (Competitvely Bid)
Total
-
$ 75,653,627
39,283,114
$ 84,004,156
$ -
$ 84,004,156
PGE2100 Residential Third Party Programs SubTotal - $ 13,319,768 13,766,685 $ 32,133,298 $ - $ 32,133,298
PGE21007 California New Homes Multifamily - $ 1,460,826 477,631 $ 2,057,859 $ - $ 2,057,859 Third/Local Party Residential Resource Existing Residential Third Party Programs PGE21008 Enhance Time Delay Relay - $ 1,536,619 5,286,543 $ 8,385,536 $ - $ 8,385,536 Third/Local Party Residential Resource Existing Residential Third Party Programs PGE21009 Direct Install for Manufactured and Mobile Homes - $ 5,242,617 4,255,628 $ 6,636,917 $ - $ 6,636,917 Third/Local Party Residential Resource Existing Residential Third Party Programs
PGE210132 RSG The Smarter Water Heater - $ - - $ - $ - $ - Third/Local Party Residential Resource Closed Residential Third Party Programs PGE210011 Residential Energy Fitness Program - $ 5,079,706 3,746,883 $ 15,052,985 $ - $ 15,052,985 Third/Local Party Residential Resource Existing Residential Third Party Programs
PGE2101 Commercial Third Party Programs SubTotal - $ 27,827,481 15,787,690 $ 29,012,847 $ - $ 29,012,847
PGE210110 Monitoring-Based Persistence Commissioning - $ - - $ - $ - $ - Third/Local Party Commercial Resource Closed Commercial Third Party Programs PGE210111 LodgingSavers - $ - - $ - $ - $ - Third/Local Party Commercial Resource Closed Commercial Third Party Programs PGE210112 School Energy Efficiency - $ 2,971,983 1,652,311 $ 2,790,852 $ - $ 2,790,852 Third/Local Party Commercial Resource Existing Commercial Third Party Programs PGE210113 Energy Fitness Program - $ - - $ - $ - $ - Third/Local Party Commercial Resource Closed Commercial Third Party Programs PGE210114 Energy Savers - $ - - $ - $ - $ - Third/Local Party Commercial Resource Closed Commercial Third Party Programs PGE210115 RightLights - $ - 164 $ - $ - $ - Third/Local Party Commercial Resource Closed Commercial Third Party Programs PGE210116 Small Business Commercial Comprehensive - $ - - $ - $ - $ - Third/Local Party Commercial Resource Closed Commercial Third Party Programs PGE210117 Energy-Efficient Parking Garage - $ - - $ - $ - $ - Third/Local Party Commercial Resource Closed Commercial Third Party Programs PGE210118 Retail Energy Efficiency - $ - - $ - $ - $ - Third/Local Party Commercial Resource Closed Commercial Third Party Programs PGE210119 LED Accelerator - $ 2,995,445 755,128 $ - $ - $ - Third/Local Party Commercial Resource Closed Commercial Third Party Programs PGE210120 Monitoring-Based Commissioning - $ - - $ - $ - $ - Third/Local Party Commercial Resource Closed Commercial Third Party Programs PGE210122 Casino Green - $ - - $ - $ - $ - Third/Local Party Commercial Resource Closed Commercial Third Party Programs PGE210123 Healthcare Energy Efficiency Program - $ 2,244,672 279,666 $ 2,330,779 $ - $ 2,330,779 Third/Local Party Commercial Resource Existing Commercial Third Party Programs

PA Name: Pacific Gas and Electric Company Budget Year: 2019
Table 4 – Budget, Spent, Unspent, Carryover Details
18 Budget, Fundshifts and Spending to Date 2019 Proposed Budget
New/Existing Program #
Main Program Name / Sub-Program Name
2018 Fundshifts
2018 Total Budget
2018 Cycle Expenditures Spent
as of 09/30/2018
2019 Proposed Budget [8] [13] [14]
2019 Budget Offset from Pre-2018 and
Estimated 2018 Unspent
& Uncommitted Funds
2019 Funds Requested
Program Type
Market Sector
Resource or Non- resource
Program Status
Utility Grouping
PGE210124 Ozone Laundry Energy Efficiency - $ - - $ - $ - $ - Third/Local Party Commercial Resource Closed Commercial Third Party Programs PGE210125 California Preschool Energy Efficiency Program - $ - - $ - $ - $ - Third/Local Party Commercial Resource Closed Commercial Third Party Programs PGE210126 K-12 Private Schools and Colleges Audit Retro - $ - - $ - $ - $ - Third/Local Party Commercial Resource Closed Commercial Third Party Programs
PGE210127
Innovative Designs for Energy Efficiency Approaches (IDEEA)
-
$ -
-
$ -
$ -
$ -
Third/Local Party
Commercial
Resource
Closed
Commercial Third Party Programs
PGE210128 Enovity SMART - $ - - $ - $ - $ - Third/Local Party Commercial Resource Closed Commercial Third Party Programs PGE210129 Nexant AERCx - $ - - $ - $ - $ - Third/Local Party Commercial Resource Closed Commercial Third Party Programs PGE210130 CLEAResult AERCx - $ - - $ - $ - $ - Third/Local Party Commercial Resource Closed Commercial Third Party Programs PGE210131 PECI AERCx - $ - - $ - $ - $ - Third/Local Party Commercial Resource Closed Commercial Third Party Programs PGE210136 McKinstry Laboratory Fume Hoods - $ - - $ - $ - $ - Third/Local Party Commercial Resource Closed Commercial Third Party Programs PGE210137 Waypoint Commercial Outreach - $ - - $ - $ - $ - Third/Local Party Commercial Non-Resource Closed Commercial Third Party Programs PGE210138 Data Center Air Flow and Temp Optimization - $ - - $ - $ - $ - Third/Local Party Commercial Resource Closed Commercial Third Party Programs PGE210139 SEI Energize Schools Program - $ 316,125 111,864 $ - $ - $ - Third/Local Party Commercial Non-Resource Closed Commercial Third Party Programs PGE210140 Mazzetti Dynamic Gas Scavenging System - $ - - $ - $ - $ - Third/Local Party Commercial Resource Closed Commercial Third Party Programs PGE210141 Lincus Commercial Mid-Market Program - $ - - $ - $ - $ - Third/Local Party Commercial Resource Closed Commercial Third Party Programs PGE210143 Hospitality Program - $ 12,626,882 7,665,070 $ 16,021,373 $ - $ 16,021,373 Third/Local Party Commercial Resource Existing Commercial Third Party Programs
PGE21016 Air Care Plus - $ - - $ - $ - $ - Third/Local Party Commercial Resource Closed Commercial Third Party Programs PGE21017 Boiler Energy Efficiency Program - $ - - $ - $ - $ - Third/Local Party Commercial Resource Closed Commercial Third Party Programs PGE21018 EnergySmart Grocer - $ 6,672,373 5,323,488 $ 7,869,842 $ - $ 7,869,842 Third/Local Party Commercial Resource Existing Commercial Third Party Programs PGE21019 Enhanced Automation Initiative - $ - - $ - $ - $ - Third/Local Party Commercial Resource Closed Commercial Third Party Programs
PGE2103 Agricultural Third Party Programs SubTotal - $ 8,589,707 2,662,799 $ 5,974,787 $ - $ 5,974,787
PGE210310 Dairy Industry Resource Advantage Pgm - $ - - $ - $ - $ - Third/Local Party Agricultural Resource Closed Agricultural Third Party Programs
PGE210311
Process Wastewater Treatment EM Pgm for Ag Food Processing
-
$ 988,763
65,716
$ 421,791
$ -
$ 421,791
Third/Local Party
Agricultural
Resource
Existing
Agricultural Third Party Programs
PGE210312 Dairy and Winery Industry Efficiency Solutions - $ 3,350,121 1,016,793 $ 2,298,225 $ - $ 2,298,225 Third/Local Party Agricultural Resource Existing Agricultural Third Party Programs PGE210133 Staples Low Pressure Irrigation DI - $ - - $ - $ - $ - Third/Local Party Agricultural Resource Closed Agricultural Third Party Programs
PGE21035 Dairy Energy Efficiency Program - $ - - $ - $ - $ - Third/Local Party Agricultural Resource Closed Agricultural Third Party Programs PGE21036 Industrial Refrigeration Performance Plus - $ 692,777 21,552 $ - $ - $ - Third/Local Party Cross-Cutting Resource Closed Agricultural Third Party Programs PGE21037 Light Exchange Program - $ - - $ - $ - $ - Third/Local Party Agricultural Resource Closed Agricultural Third Party Programs PGE21038 Wine Industry Efficiency Solutions - $ - - $ - $ - $ - Third/Local Party Agricultural Resource Closed Agricultural Third Party Programs
PGE21039
Comprehensive Food Process Audit & Resource Efficiency Pgm
-
$ 3,558,046
1,558,738
$ 3,254,771
$ -
$ 3,254,771
Third/Local Party
Agricultural
Resource
Existing
Agricultural Third Party Programs
PGE2102 Industrial Third Party Programs SubTotal - $ 25,916,672 7,065,940 $ 16,883,225 $ - $ 16,883,225
PGE210210 Industrial Recommissioning Program - $ 2,245,631 376,996 $ 2,873,214 $ - $ 2,873,214 Third/Local Party Industrial Resource Existing Industrial Third Party Programs PGE210211 Light Industrial Energy Efficiency - $ 546,368 24,724 $ - $ - $ - Third/Local Party Industrial Resource Closed Industrial Third Party Programs PGE210212 Industrial Compressed Air System Efficiency - $ 270,590 75,807 $ 518,911 $ - $ 518,911 Third/Local Party Industrial Resource Existing Industrial Third Party Programs PGE210213 Small Petrochemical Energy Efficiency - $ 714,660 113,489 $ 516,403 $ - $ 516,403 Third/Local Party Industrial Resource Existing Industrial Third Party Programs
PGE21025 California Wastewater Process Optimization - $ 1,227,756 159,690 $ - $ - $ - Third/Local Party Industrial Resource Closed Industrial Third Party Programs PGE21026 Energy Efficiency Services for Oil Production - $ 3,737,735 929,827 $ 1,868,192 $ - $ 1,868,192 Third/Local Party Industrial Resource Existing Industrial Third Party Programs PGE21027 Heavy Industry Energy Efficiency Program - $ 13,179,841 3,876,615 $ 8,719,340 $ - $ 8,719,340 Third/Local Party Industrial Resource Existing Industrial Third Party Programs PGE21028 Industrial Compressed Air Program - $ - - $ - $ - $ - Third/Local Party Industrial Resource Closed Industrial Third Party Programs PGE21029 Refinery Energy Efficiency Program - $ 1,666,727 33,978 $ - $ - $ - Third/Local Party Industrial Resource Closed Industrial Third Party Programs
PGE210135 Lincus WISE - $ 2,327,364 1,474,814 $ 2,387,165 $ - $ 2,387,165 Third/Local Party Industrial Resource Existing Industrial Third Party Programs PGE210142 Ameresco Intelligent Energy Efficiency - $ - - $ - $ - $ - Third/Local Party Industrial Resource Closed Industrial Third Party Programs
PGE2107
Workforce Education & Training Third Party Programs SubTotal
-
$ -
-
$ -
$ -
$ -
PGE21074 Builder Energy Code Training - $ - - $ - $ - $ - Third/Local Party Cross-Cutting Non-Resource Closed Workforce Education & Training Third Party Programs PGE21075 Green Building Technical Support Services - $ - - $ - $ - $ - Third/Local Party Cross-Cutting Non-Resource Closed Workforce Education & Training Third Party Programs
PGE210134 Bridges to Energy Sector Opportunities - $ - - $ - $ - $ - Third/Local Party Cross-Cutting Non-Resource Closed Workforce Education & Training Third Party Programs PGE2110 Government Partnership Programs Total - $ 72,368,174 34,209,205 $ 40,669,461 $ - $ 40,669,461
PGE2110011 California Community Colleges - $ 4,448,702 1,347,438 $ 1,113,531 $ - $ 1,113,531 State Institutional Partnership Public Resource Existing Institutional Partnerships PGE2110012 University - $ 4,703,997 1,755,124 $ 937,464 $ - $ 937,464 State Institutional Partnership Public Resource Existing Institutional Partnerships PGE2110013 State of California - $ 1,005,394 (10,887) $ 931,841 $ - $ 931,841 State Institutional Partnership Public Resource Existing Institutional Partnerships PGE2110014 Department of Corrections and Rehabilitation - $ 1,677,562 655,632 $ 1,086,976 $ - $ 1,086,976 State Institutional Partnership Public Resource Existing Institutional Partnerships
PGE2110051
Local Government Energy Action Resources (LGEAR)
-
$ 6,059,173
1,835,596
$ -
$ -
$ -
Local Government Partnership
Public
Resource
Closed
Master Government Partnership
PGE2110052 Strategic Energy Resources - $ 9,632,258 4,654,040 $ 5,554,039 $ - $ 5,554,039 Local Government Partnership Public Non-Resource Existing Master Government Partnership
PGE211007
Association of Monterey Bay Area Governments (AMBAG)
-
$ 3,744,061
2,411,994
$ 3,576,277
$ -
$ 3,576,277
Local Government Partnership
Public
Resource
Existing
Government Partnership Programs
PGE211009 East Bay - $ 6,129,105 3,411,471 $ 3,189,040 $ - $ 3,189,040 Local Government Partnership Public Resource Existing Government Partnership Programs PGE211010 Fresno - $ 2,648,728 1,197,291 $ 2,759,465 $ - $ 2,759,465 Local Government Partnership Public Resource Existing Government Partnership Programs PGE211011 Kern - $ 2,725,208 1,775,765 $ 2,324,632 $ - $ 2,324,632 Local Government Partnership Public Resource Existing Government Partnership Programs PGE211012 Madera - $ 363,621 172,892 $ 299,630 $ - $ 299,630 Local Government Partnership Public Resource Existing Government Partnership Programs PGE211013 Marin County - $ 1,271,550 451,090 $ 868,459 $ - $ 868,459 Local Government Partnership Public Resource Existing Government Partnership Programs PGE211014 Mendocino/Lake County - $ 711,132 507,350 $ 537,440 $ - $ 537,440 Local Government Partnership Public Resource Existing Government Partnership Programs PGE211015 Napa County - $ 557,007 217,272 $ 356,669 $ - $ 356,669 Local Government Partnership Public Resource Existing Government Partnership Programs PGE211016 Redwood Coast - $ 1,598,179 826,180 $ 1,226,970 $ - $ 1,226,970 Local Government Partnership Public Resource Existing Government Partnership Programs PGE211018 San Luis Obispo County - $ 1,076,601 579,045 $ 990,181 $ - $ 990,181 Local Government Partnership Public Resource Existing Government Partnership Programs PGE211019 San Mateo County - $ 2,279,756 955,668 $ 1,073,415 $ - $ 1,073,415 Local Government Partnership Public Resource Existing Government Partnership Programs PGE211020 Santa Barbara - $ 1,008,901 375,763 $ 606,943 $ - $ 606,943 Local Government Partnership Public Resource Existing Government Partnership Programs PGE211021 Sierra Nevada - $ 2,422,994 747,745 $ 944,354 $ - $ 944,354 Local Government Partnership Public Resource Existing Government Partnership Programs PGE211022 Sonoma County - $ 1,756,500 1,849,781 $ 1,632,927 $ - $ 1,632,927 Local Government Partnership Public Resource Existing Government Partnership Programs PGE211023 Silicon Valley - $ 3,762,183 2,236,481 $ 3,107,863 $ - $ 3,107,863 Local Government Partnership Public Resource Existing Government Partnership Programs

PA Name: Pacific Gas and Electric Company Budget Year: 2019
Table 4 – Budget, Spent, Unspent, Carryover Details
18 Budget, Fundshifts and Spending to Date 2019 Proposed Budget
New/Existing Program #
Main Program Name / Sub-Program Name
2018 Fundshifts
2018 Total Budget
2018 Cycle Expenditures Spent
as of 09/30/2018
2019 Proposed Budget [8] [13] [14]
2019 Budget Offset from Pre-2018 and
Estimated 2018 Unspent
& Uncommitted Funds
2019 Funds Requested
Program Type
Market Sector
Resource or Non- resource
Program Status
Utility Grouping
PGE211024 San Francisco - $ 6,315,049 3,326,138 $ 3,783,713 $ - $ 3,783,713 Local Government Partnership Public Resource Existing Government Partnership Programs PGE211026 North Valley - $ 1,898,230 301,140 $ 466,473 $ - $ 466,473 Local Government Partnership Public Resource Existing Government Partnership Programs PGE211027 Sutter Buttes - $ 495,328 226,587 $ 155,120 $ - $ 155,120 Local Government Partnership Public Resource Existing Government Partnership Programs PGE211028 Yolo - $ 415,574 64,055 $ 460,953 $ - $ 460,953 Local Government Partnership Public Resource Existing Government Partnership Programs PGE211029 Solano - $ 1,480,725 1,181,395 $ 1,136,345 $ - $ 1,136,345 Local Government Partnership Public Resource Existing Government Partnership Programs PGE211030 Northern San Joaquin Valley - $ 1,455,492 875,555 $ 982,143 $ - $ 982,143 Local Government Partnership Public Resource Existing Government Partnership Programs PGE211031 Valley Innovative Energy Watch (VIEW) - $ 725,163 281,606 $ 566,596 $ - $ 566,596 Local Government Partnership Public Resource Existing Government Partnership Programs
Funds to be returned in rates [4] - $ - - $ - $ 157,019,890 $ (157,019,890)
2013-2015 funds transferred to REN and CCA balancing accounts for 2016 [6]
-
$ -
-
$ -
$ -
$ -
Pre-2013 Unspent Funds transferred to 2016 Commercial Deemed Incentives program [3]
-
$ -
-
$ -
$ -
$ -
PG&E PROGRAM TOTAL $ - $ 352,460,723 189,788,201 281,488,322 $ 157,019,890 $ 124,468,432
EM&V EM&V (PA & CPUC Portions) Total $ - $ 16,522,072 $ 3,118,911 $ 13,727,879 $ - $ 13,727,879
PGE_EMV PG&E EM&V - CPUC - $ 11,055,064 411,819 $ 8,911,106 $ - $ 8,911,106 EM&V Cross Cutting Non-Resource Existing EM&V PGE_EMV PG&E EM&V - PG&E - $ 4,193,300 2,318,198 $ 3,380,075 $ - $ 3,380,075 EM&V Cross Cutting Non-Resource Existing EM&V PGE_EMV BayREN EM&V - CPUC - $ 675,609 388,894 $ 711,618 $ - $ 711,618 EM&V Cross Cutting Non-Resource Existing EM&V PGE_EMV BayREN EM&V - $ 256,266 - $ 269,924 $ - $ 269,924 EM&V Cross Cutting Non-Resource Existing EM&V PGE_EMV MCE EM&V - CPUC - $ 247,829 - $ 247,829 $ - $ 247,829 EM&V Cross Cutting Non-Resource Existing EM&V PGE_EMV MCE EM&V - $ 94,004 - $ 94,004 $ - $ 94,004 EM&V Cross Cutting Non-Resource Existing EM&V PGE_EMV 3C REN EM&V - CPUC - $ - - $ 82,160 $ - $ 82,160 EM&V Cross Cutting Non-Resource Existing EM&V PGE_EMV 3C REN EM&V - $ - - $ 31,164 $ - $ 31,164 EM&V Cross Cutting Non-Resource Existing EM&V
PG&E TOTAL with EM&V - $ 368,982,795 192,907,112 $ 295,216,201 $ 157,019,890 $ 138,196,311
PGE_BayREN BayREN [10] - $ 22,365,000 9,477,007 $ 23,557,000 $ - $ 23,557,000 REN Cross Cutting Resource Existing REN PGE_MCE Marin Clean Energy [10] - $ 8,204,000 830,006 $ 8,204,000 $ 499,483 $ 7,704,517 CCA Cross Cutting Resource Existing CCA PGE_3C REN 3C REN [10] - $ - - $ 2,719,766 $ - $ 2,719,766 REN Cross Cutting Resource New REN
TOTAL PG&E EE EXPENSE PORTFOLIO $ - $ 399,551,795 $ 203,214,125 $ 329,696,967 $ 157,519,373 $ 172,177,594
PGE21091LP OBF REVOLVING LOAN POOL - $ 13,500,000 15,496,270 $ 13,500,000 $ - $ 13,500,000 IOU Core/Statewide Cross-Cutting Non-Resource Existing Financing Programs
TOTAL PG&E EE PORTFOLIO - $ 413,051,795 218,710,395 $ 343,196,967 $ 157,519,373 $ 185,677,594
Other EE-Related Budgets
PGE_SWMEO
Statewide Marketing, Education and Outreach Program Total
-
$ 6,840,979
3,412,261
$ 6,840,978
$ -
$ 6,840,978
PGE_SWMEO
Statewide Marketing, Education and Outreach Program (Flex Alert) [11]
-
$ -
-
$ -
$ -
$ -
PGE_SWMEO
Statewide Marketing, Education and Outreach Program [11]
-
$ 6,840,979
3,412,261
$ 6,840,978
$ -
$ 6,840,978
Notes: 1. "2015 Total Budget with Commitments & Fundshifts" reflects funds available for 2015, from the authorized 2013-2015 Budget, less the spending in 2013 - 2014 from the 2013 - 2015 Budget. 2. "2015 Total Budget Spent" includes spending in 2015 paid from the 2013 - 2015 Budget. 3. “Requested Carry Over of pre-2013 Unspent Funds to 2016” identifies the funds PG&E is requesting to carry over to 2016 in supplemental Advice 3752-G-B/4905-E-B, which was approved on November 2, 2016. In addition to the amounts identified at the subprogram level in column G, PG&Ewas approved authorization to shift $9.9m of pre-2013 unspent funds into the Commercial Deemed Incentive program 2016 budget. 4. The CPUC approved AL 3718-G/4852-E on July 11, 2016, authorizing PG&E to return a total of $43,024,401.85 in unspent, uncommitted energy efficiency funds from its 2013-2015 program cycle to its customers; PG&E implemented this through a one-time adjustment to its gas and electric EE balancing accounts.
5. Commitments as of 12/31/2015 (column I), 12/31/2016 (column R), and 12/31/2017 (column Y) includes incentive Commitments as of the end of the year indicated. Contractual encumbrances are not reflected. BayREN and MCE Carry Over figures represent the level of funds in PG&E’s balancing accounts; this may include BayREN expenses or MCE gas expenses not yet invoiced to or accrued by PG&E as of the year indicated; the remainder is the amount potentially available for carry over; these may not match MCE or BayREN submissions. 6. 2013-2015 Unspent/Committed Funds, Carryover to 2016" Identifies unspent, committed funds that are carried over into 2016 and augment the 2016 budget, in accordance with D.12-11-015, as follows:
New Financing Offerings: In D. 15-06-008, the Commission ordered that PG&E operate for a minimum of 24 months from the point at which each pilot program enrolls its first loan. The Pilots have begun enrolling loans in 2016 indicating that the pilots will run until at least 2018. New financing pilot subprogram funds collected during 2013-2014 period are being carried over to continue to operate during this compliance period.
Funds Transferred to REN and CCA balancing accounts: In D.16-05-004 (petition to modify D.14-10-046), effective May 12, 2016, the Commission authorized for Marin Clean Energy (MCE) an annual budget increase of $366,080 for the duration of the ten-year rolling portfolio cycle unless and until modified by the Commission. The CPUC approved AL 3718-G/4852-E on July 11, 2016, authorizing PG&E to use unspent 2013-2015 unspent funds to fund the increase in MCE’s 2016 budget. Advice Letter 3704-G/4826-E, effective April 29, 2016, authorized for BayREN a one-time budget increase of $3,700,000 transferred from unspent 2013-2015 cycle EE funds to the 2016 cycle.
Marin Clean Energy: MCE’s 2015 authorized gas budget included $419,000. The Commission authorized a gas budget of $219,000 in D.14-10-046 and augmented the gas budget by $200,000 per PG&E Advice 3642-G/4720-E, filed 10/15/2015, approved 10/28/2015. After $382,818 of gas payments from PG&E to MCE, $36,182 is available for carryover to 2016.
7. “Pre-2016 unspent/uncommitted funds available for 2017 offset” identifies 2013–2015 cycle unspent funds at the program level. The balancing account transfer for $43 million of funds refunded to customers based on Advice Letter 3718-G/4852-E is identified on Row 154. Unspent funds from 2009 and 2010–2012 are represented in Column G. In 2017 PG&E recorded a one-time electric EE balancing account adjustment of $230,474 crediting customer rates for unspent 2015-2016 Marin Clean Energy Electric funds. In the 2018 ABAL, It had been pointed out that of the $230,474, a refund should have occurred in the amount of $311,915 from the 2016 cycle, while an increase of $81,441 should have been applied to the 2013-2015 cycle.
8. “2019 Proposed Budget” reflects the budget request for 2019, which differs from the collections requested through this advice letter of approximately $408.8 million.
9. Advice Letter 3589-G-C/4624-E-C, approved June 29, 2015, effective June 25, 2015 established the Energy Efficiency Financing Balancing Account (EEFBA), and the Credit Enhancement Balance Account (CEBA) and the On-Bill Financing Balancing Account (OBFBA) subaccounts. The $14 million referenced in cell H57 was transferred to the CEBA subaccount. 10. BayREN, MCE and 3C-REN figures generally represent the level of funds in PG&E’s balancing accounts and may not match MCE or BayREN submissions. 11. Statewide ME&O budgets for 2017 through 2019 were approved in Advice Letter 3783-G/4963-E on January 23, 2017, effective November 28, 2016. The portion of SW ME&O allocated to EE is reflected in PG&E's cost effectiveness calculations. 12. The "2018 Authorized Budget" in Table 4 represents PG&E's 2018 CEDARS filing budget at the subprogram level detail, and BayREN and MCE's approved budgets per the Business Plan Decision D.18-05-041. This budget is lower than PG&E's 2018 portfolio budget of $416,713,780, also approved in D.18-05-041. Subprogram level detail is unavailable in the approved Business Plan budget. 13. 2019 BayREN and MCE budgets are the authorized amounts from the Business Plan decision D.18-05-041, with their EM&V budgets increased to be 4% of their total budget. 14. 2019 3C-REN budget is the proposed contribution for PG&E as circulated by 3C-REN on August 28, 2018, which includes 4% EM&V.

PA Name: Pacific Gas and Electric Company Budget Year: 2019
Table 5 - Total 2019 Requested and 2013-2018 Authorized Budgets ($000)
Category (2013-18 Authorized and 2019 Request) [1]
Electric Demand Response Funds
Electric Energy Efficiency Funds
Natural Gas Public Purpose Funds
Total Energy Efficiency Funds
2013-2015 Annualized Program Funds - Utility $3,264 $321,712 $70,620 $392,331 2013-2015 Annualized Program Funds - REN $9,725 $2,135 $11,860 2013-2015 Annualized Program Funds - MCE $1,431 $314 $1,745 2013-2015 Annualized EM&V $14,073 $3,089 $17,162
2013-2015 Total Annualized Portfolio $3,264 $346,941 $76,158 $423,099 2016 Program Funds - Utility $3,264 $327,056 $71,793 $398,849 2016 Program Funds - REN $13,560 $2,977 $16,537 2016 Program Funds - MCE $1,301 $286 $1,586 2016 EM&V $14,108 $3,097 $17,204
2016 Annualized Total $3,264 $356,025 $78,152 $434,177 2017 Program Funds - Utility $3,264 $327,271 $62,337 $389,609 2017 Program Funds - REN $13,891 $2,646 $16,537 2017 Program Funds - MCE $1,333 $254 $1,586 2017 EM&V $14,271 $2,718 $16,989
2017 Annualized Total $3,264 $356,766 $67,955 $424,721 2018 Program Funds - Utility $3,264 $263,492 $102,469 $365,961 2018 Program Funds - REN $18,787 $3,578 $22,365 2018 Program Funds - MCE $6,891 $1,313 $8,204 2018 EM&V $13,879 $2,644 $16,522
2018 Annualized Total $3,264 $303,048 $110,004 $413,052 2019 Requested Program Funds - Utility $7,771 $221,241 $73,747 $294,988 2019 Requested Program Funds - REN $17,668 $5,889 $23,557 2019 Requested Program Funds - MCE $6,153 $2,051 $8,204 2019 Requested Program Funds - 3C-REN $2,040 $680 $2,720 2019 Requested EM&V $10,296 $3,432 $13,728
2019 Total Portfolio Request $7,771 $257,398 $85,799 $343,197

PA Name: Pacific Gas and Electric Company Budget Year: 2019
Table 6 - Accrued Energy Efficiency Program Funding Not Yet Spent Committed funds not yet spent as of Sept. 30, 2018 ($000)
Electric Procurement
Funds
Natural Gas Public
Purpose Funds
Total Category 2013-2015 EM&V Funds $3,770 $827 $4,597 2013-2015 Program Funds - Utility $3,412 $749 $4,161 2013-2015 Program Funds - REN $3,084 $677 $3,761 2013-2015 Program Funds - CCA $30 $7 $36 2016 EM&V Funds $12,852 $2,821 $15,673 2016 Program Funds - Utility $0 $0 $0 2016 Program Funds - REN $0 $0 $0 2016 Program Funds - CCA $86 $19 $105 2017 EM&V Funds $12,162 $2,317 $14,479 2017 Program Funds - Utility [1] $9,755 $1,858 $11,613 2017 Program Funds - REN $36 $7 $43 2017 Program Funds - CCA $0 $0 $0 2018 to date EM&V Funds $10,823 $2,062 $12,885 2018 to date Program Funds - Utility [2] $43,519 $8,289 $51,808 2018 to date Program Funds - REN $10,826 $2,062 $12,888 2018 to date Program Funds - CCA $59 $11 $70 Total $110,412 $21,706 $132,118
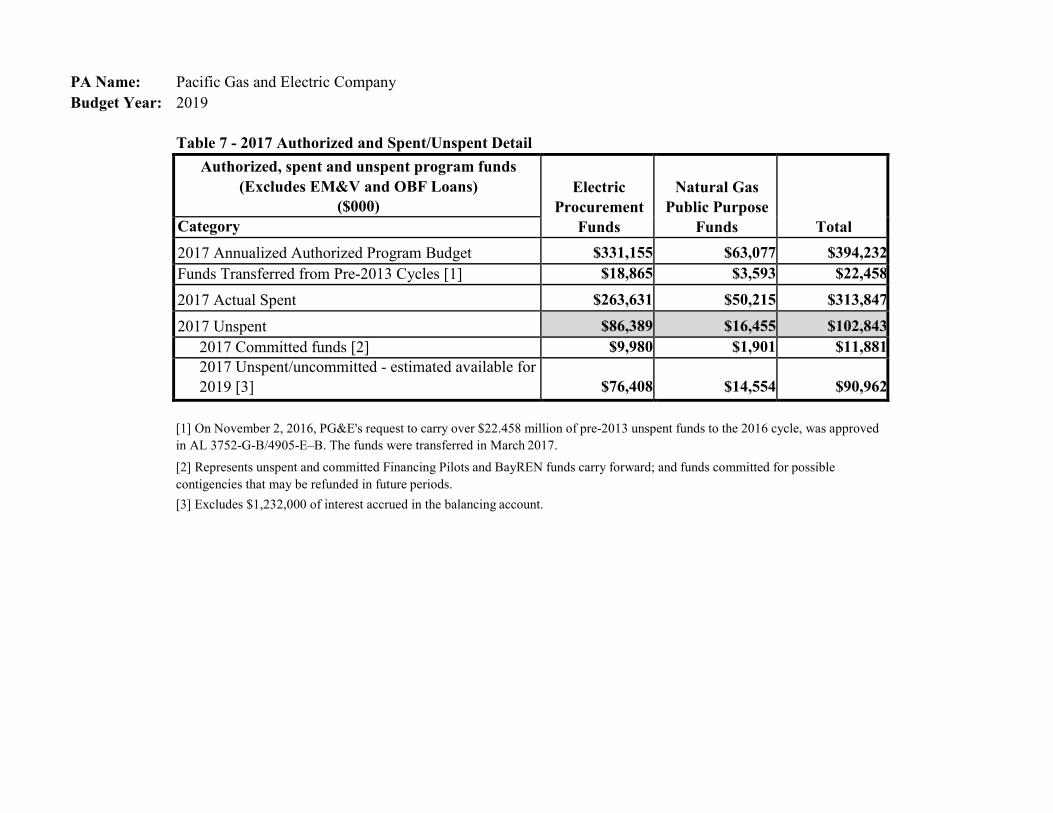
PA Name: Pacific Gas and Electric Company Budget Year: 2019
Table 7 - 2017 Authorized and Spent/Unspent Detail Authorized, spent and unspent program funds
(Excludes EM&V and OBF Loans) ($000)
Electric
Procurement Funds
Natural Gas
Public Purpose Funds
Total Category
2017 Annualized Authorized Program Budget $331,155 $63,077 $394,232 Funds Transferred from Pre-2013 Cycles [1] $18,865 $3,593 $22,458
2017 Actual Spent $263,631 $50,215 $313,847
2017 Unspent $86,389 $16,455 $102,843 2017 Committed funds [2] $9,980 $1,901 $11,881 2017 Unspent/uncommitted - estimated available for 2019 [3]
$76,408
$14,554
$90,962
[1] On November 2, 2016, PG&E's request to carry over $22.458 million of pre-2013 unspent funds to the 2016 cycle, was approved in AL 3752-G-B/4905-E–B. The funds were transferred in March 2017. [2] Represents unspent and committed Financing Pilots and BayREN funds carry forward; and funds committed for possible contigencies that may be refunded in future periods. [3] Excludes $1,232,000 of interest accrued in the balancing account.

PG&E Gas and Electric Advice Filing List General Order 96-B, Section IV
AT&T Downey & Brand Pioneer Community Energy Albion Power Company Ellison Schneider & Harris LLP Praxair Alcantar & Kahl LLP Energy Management Service Regulatory & Cogeneration Service, Inc. Anderson & Poole Evaluation + Strategy for Social
Innovation SCD Energy Solutions
Atlas ReFuel GenOn Energy, Inc. SCE BART Goodin, MacBride, Squeri, Schlotz &
Ritchie SDG&E and SoCalGas
Barkovich & Yap, Inc. Green Charge Networks SPURR Braun Blaising Smith Wynne P.C. Green Power Institute San Francisco Water Power and Sewer CalCom Solar Hanna & Morton Seattle City Light California Cotton Ginners & Growers Assn ICF Sempra Utilities California Energy Commission International Power Technology Southern California Edison Company California Public Utilities Commission Intestate Gas Services, Inc. Southern California Gas Company California State Association of Counties Kelly Group Spark Energy Calpine Ken Bohn Consulting Sun Light & Power Casner, Steve Keyes & Fox LLP Sunshine Design Cenergy Power Leviton Manufacturing Co., Inc. Tecogen, Inc. Center for Biological Diversity Linde TerraVerde Renewable Partners City of Palo Alto Los Angeles County Integrated Waste
Management Task Force Tiger Natural Gas, Inc.
City of San Jose Los Angeles Dept of Water & Power TransCanada Clean Power Research MRW & Associates Troutman Sanders LLP Coast Economic Consulting Manatt Phelps Phillips Utility Cost Management Commercial Energy Marin Energy Authority Utility Power Solutions County of Tehama - Department of Public Works
McKenzie & Associates Utility Specialists
Crossborder Energy Modesto Irrigation District Verizon Crown Road Energy, LLC Morgan Stanley Water and Energy Consulting Davis Wright Tremaine LLP NLine Energy, Inc. Wellhead Electric Company Day Carter Murphy NRG Solar Western Manufactured Housing
Communities Association (WMA) Dept of General Services Office of Ratepayer Advocates Yep Energy Don Pickett & Associates, Inc. OnGrid Solar Douglass & Liddell Pacific Gas and Electric Company