supplemental materials methods evaluation of d...
TRANSCRIPT

Supplemental Materials Methods Evaluation of D-amino acid incorporation into peptidoglycan
Three mL LB was inoculated with a single colony of dtd+ B. subtilis and incubated in a
roller drum at 37˚C. After three hours, these cultures were diluted 1:1000 into MSgg and
48.5 mL of culture were transferred into a glass dish containing a total of 1.5 mL
treatment (D-tryptophan) or water (untreated). These biofilm cultures were incubated
statically at 25˚C for 48 hours, at which time cells were harvested by centrifugation at
4000 rpm for 25 minutes.
Pelleted cells were resuspended in 2 mL cold distilled H2O, added drop-wise to boiling
50 mL solutions of 5% SDS, and boiled for 15 minutes. After cooling to room
temperature, the samples were pelleted at 4000 rpm for 25 minutes at room temperature.
SDS was removed from the pellets by several rounds of washing in warm distilled H2O
and re-pelleting. Pellets were resuspended in a solution of 100 mM Tris-HCl, 20 mM
MgSO4, pH 7.5. 20 µg/mL DNase I, 40 µg/mL RNAse, and 80 µg/mL α-amylase (final
concentrations from 10 mg/ml stocks in 50% glycerol) were added and samples were
incubated shaking at 37˚C for 2 hours. 80 µg/mL trypsin (10 mg/ml stock) was added as
well as CaCl2 to a final concentration of 10 mM, and the samples were incubated shaking
at 37˚C overnight. The following day, SDS was added to achieve a final SDS
concentration of 1%, and samples were boiled for 2 hours. After washing out the SDS
with warm water as described above, the sample was pelleted and resuspended in 0.02%
NaN3.

To digest the cell wall for LC-MS analysis, 50 µL of the cell wall sample was moved to a
fresh eppendorf tube, mixed with 10 µL 500 mM sodium phosphate buffer (pH 6.0), 2.5
µL 4000 U/mL mutanolysin, and 37.5 µL dH2O, and incubated shaking overnight at
37˚C. Another aliquot of mutanolysin was added the next morning, and the samples were
incubated shaking at 37˚C for at least three hours. The samples were centrifuged at
16000 rpm for 10 min at 4˚C, and the supernatant was transferred to fresh 1.5 mL
eppendorf tubes. One volume of freshly dissolved 10 mg/mL NaBH4 (in dH2O) was
added for every two volumes of supernatant. The solution was mixed gently every 10
minutes for 30 minutes, and the reaction was quenched with 20% H3PO4 (1.2 µL of acid
was added for every 10 µL of base). After centrifuging until all bubbles disappeared, the
samples were frozen in liquid nitrogen, lyophilized, and resuspended in 25 µL dH2O.
LC-MS chromatograms were obtained on an Agilent Technologies 1100 series LC-MSD
instrument using electrospray ionization (ESI) in positive mode and a Waters Symmetry
Shield RP18 column (5 µm, 3.9X150 mm) with matching column guard. The fragments
were separated by water for 5 minutes followed by a gradient of 0% acetonitrile in water
to 20% acetonitrile in water for 40 minutes, always at a constant flow rate of 0.5 mL/min.
Both the water and acetonitrile contained 0.1% formic acid to aid in ionization.
(M+2H)/2 ions were extracted from the chromatograms for selected disaccharide
fragments.
To confirm the structure of the D-Trp incorporation peaks, high-resolution LC-MS/MS
was performed on the peptidoglycan isolated from dtd+ cells treated with 1 mM D-Trp.

Chromatograms were obtained in positive mode (ES) on a Bruker maXis impact Q-Tof
with Agilent 1290 HPLC using the same column and method as the nominal mass LC-
MS above. Differences in retention times between the nominal and high-resolution
chromatograms can be attributed to dead volume differences between instruments.
Table S1. Bacterial strains and primers used in this study.
Strain name Relevant genotype or property Reference Turbo E. coli recA+, endA1, Δ(hsdS-mcrB)5 NEB NCIB3610 Wild biofilm-forming strain Laboratory stock SLH31 dtdT2A in NCIB3610 This study ALM89 sacA::PepsA-lux in NCIB3610, CmR Chen et al, 2011 SLH32 sacA::PepsA-lux in SLH31, CmR This study ALM91 sacA::PtapA-lux in NCIB3610, CmR Chen et al, 2011 SLH33 sacA::PtapA-lux in SLH31, CmR This study
Primer Number Primer Sequence
7 CCAGCTTTTGTTCCCTTTAGTGAGGATCGAAAGCGGATTAGAGAAATAC 8 AATGAAGAGGATATGTACGCGGC 51 CGTTGTAAAACGACGGCCAGTGAATTCGTCTGGAAACGGCTCTCTAAACAA 52 GAAATGAGATTAGTTGTTCAGCGAG 53 CTAATCTCATTTCTAACCCCTTTAGTTC 54 AACAGCTATGACCATGATTACGCCAAGCTTTCTGTTCCGATTGACTTTTCTTACCG

Figure S1. Biofilm-inhibitory concentrations of D-amino acids also inhibit growth.
The optical density of untreated cells or cells treated with D-Y or with equimolar
mixtures of D-LMWY was measured every hour. Concentrations were chosen to reflect
conditions that do not inhibit pellicle formation (10 nM, 100 nM) and those that mildly
weaken pellicle formation (500 nM). Cultures were grown in shaking unmodified MSgg
at 37˚C. Results represent the average of duplicate experiments, and error bars show the
standard deviation.
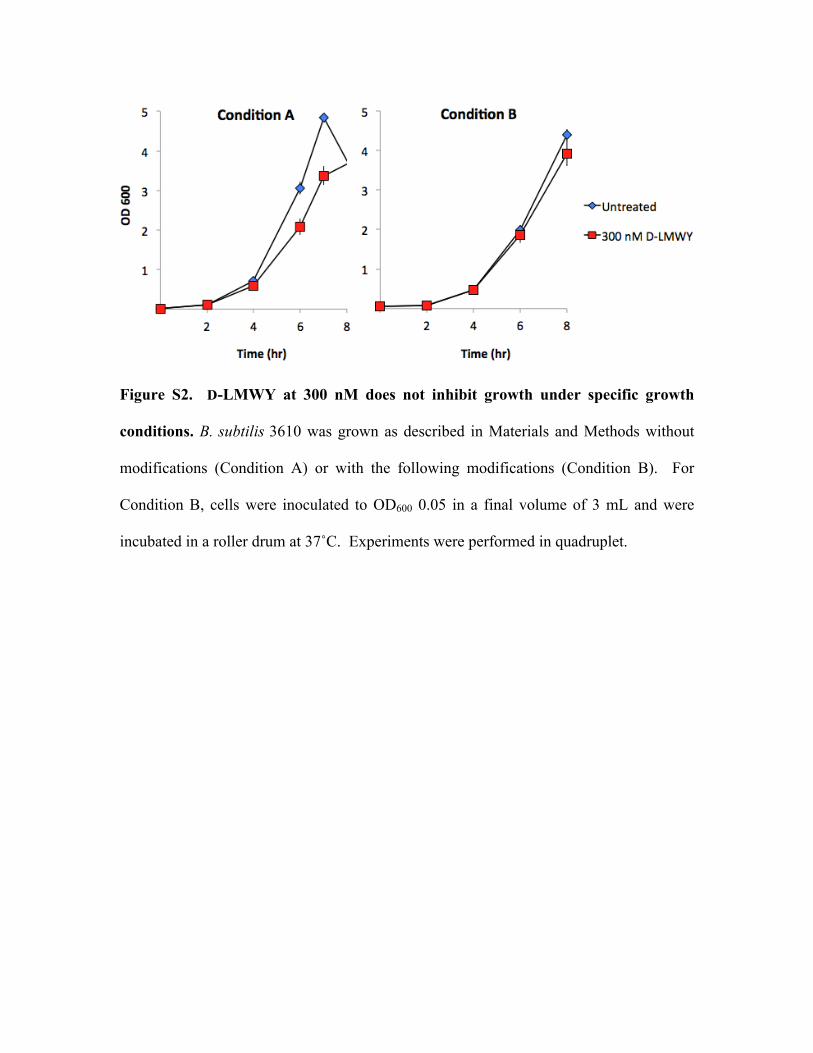
Figure S2. D-LMWY at 300 nM does not inhibit growth under specific growth
conditions. B. subtilis 3610 was grown as described in Materials and Methods without
modifications (Condition A) or with the following modifications (Condition B). For
Condition B, cells were inoculated to OD600 0.05 in a final volume of 3 mL and were
incubated in a roller drum at 37˚C. Experiments were performed in quadruplet.

Figure S3. Expression of biofilm matrix genes is sensitive to D-LMWY in 3610 cells,
but not in cells repaired for D-aminoacyl-tRNA deacylase activity. 3610 or dtd+ cells
harboring a luciferase reporter for epsA or tapA expression were grown in MSgg.
Luciferase luminescence was normalized to optical density. Results represent the
average of triplicate experiments, and the error bars show the standard deviation.

B
Fragment Extracted (M+2H)/2 Mass tri 435.7 tetra 471.2 penta (D-‐Ala) 506.7 tetra-‐tri 896.9 tetra-‐tetra 932.4 tetra-‐penta (D-‐Ala) 967.9 penta D-‐Trp 564.3 tetra-‐penta D-‐Trp 1025.5
Figure S4. Peptidoglycan fragment analysis by LC-MS. A) B. subtilis cell wall was
harvested, digested with a glycan hydrolase, and reduced with sodium borohydride to
yield disaccharide fragments for separation and detection by LCMS. Note: the structures
of these fragments are proposed based on the work of Atrih et al (1). B) Masses of the
(M+2H)/2 ions extracted in Figure 7.


Figure S5. High-resolution LC-MS/MS fragmentation of the dtd+ 1 mM D-Trp
sample supports the proposed penta D-Trp structure. A) Representative total ion
chromatogram of the dtd+ 1 mM D-Trp sample overlaid with extracted ion
chromatograms for the proposed penta D-Trp (32 minutes) and tetra-penta D-Trp (34
minutes) fragments. B) Proposed structure, molecular formula, and m/z values for the
penta D-Trp fragment eluting at 32 minutes. C) Full scan mass spectrum for the peak at
32 minutes. D) Expanded views of the mass spectrum for the peak at 32 minutes
confirm the proposed elemental composition of the penta D-Trp fragment within 5 ppm.
E and F) The product ion scan mass spectrum of the peak at 32 minutes supports the
proposed structure of the penta D-Trp fragment. As depicted in E, loss of the
glucosamine derivative (x) generates fragment y, which loses tryptophan to yield
fragment z.

Figure S6. High-resolution LC-MS supports the proposed tetra-penta D-Trp
elemental composition. A) Proposed structure, molecular formula, and m/z values for
the tetra-penta D-Trp fragment eluting at 34 minutes in panel A of Figure S5. B) Full
scan mass spectrum for the peak at 34 minutes. C) Expanded views of the mass
spectrum for the peak at 34 minutes confirm the proposed elemental composition of the
tetra-penta D-Trp fragment within 5 ppm.

References
1. Atrih A, Bacher G, Allmaier G, Williamson MP, Foster SJ. 1999. Analysis of peptidoglycan structure from vegetative cells of Bacillus subtilis 168 and role of PBP 5 in peptidoglycan maturation. Journal of bacteriology 181:3956-3966.