supplemental materials methods
TRANSCRIPT
Supplemental Materials
Methods
Patients
We retrospectively studied 34 brain tumor patients (mean age±standard deviation (SD): 46.9±12.7
years, 20 females) who underwent presurgical fMRI language mapping at Brigham and Women’s
Hospital between November 2010 and April 2016. The inclusion criteria were: (1) confirmed
diagnosis of brain tumor according to the 2016 World Health Organization classification of tumors
of the central nervous system; (2) underwent AntGen tb-fMRI and mw-fMRI. Of these patients,
22 also underwent rs-fMRI. All patients were native English speakers, and none were fluent in a
second language. Handedness was determined by the Edinburgh Handedness Inventory (EHI) [1].
For clinical purposes, the language hemispheric dominance was estimated by a neuroradiologist,
based on qualitative assessment of language maps derived from a battery of fMRI tasks, including
AntGen and 1-2 other language tasks (noun categorization, sentence completion, or auditory
naming) [2]. Patients’ language deficits were evaluated presurgically and postsurgically by
neurosurgeons. For tb-fMRI, the data of 4 patients were excluded from analysis due to excessive
in-scanner head motion, for a total of 30 patients. For mw-fMRI, the data of 1 patient were
excluded due to excessive in-scanner head motion, and from 1 other patient due to inability to
identify language components from the output of independent component analysis (ICA), for a
total of 32 patients. For rs-fMRI, the data of 1 patient were excluded from data analysis due to
excessive in-scanner head motion, and from 1 other patient due to inability to identify language
components from the output of ICA. Data from one other patient were removed from rs-fMRI
BMJ Publishing Group Limited (BMJ) disclaims all liability and responsibility arising from any relianceSupplemental material placed on this supplemental material which has been supplied by the author(s) J Neurol Neurosurg Psychiatry
doi: 10.1136/jnnp-2020-325738–2.:10 2021;J Neurol Neurosurg Psychiatry, et al. Yao S
because the patient was excluded from the tb-fMRI and mw-fMRI, for a total of 18 patients. Of
note, the data excluded due to ICA failure was from the same patient in mw-fMRI and rs-fMRI.
All research procedures in this study were approved by the Mass General Brigham
Institutional Review Board. The study protocol was fully explained to the patients prior to data
acquisition, and all patients provided written informed consent.
MRI acquisition
MRI was acquired on a 3.0 Tesla GE scanner (Signa system, General Electric, Milwaukee, WI,
USA) with an 8-channel head coil, or a 3.0 Tesla Siemens scanner (Verio, Trio or Skyra system,
Siemens, Munich, Germany) with a 20-channel head coil. Patients were placed supine with their
head immobilized by a custom-fit cushion to minimize motion.
Blood oxygen level-dependent (BOLD) fMRI was acquired using a single-shot gradient-
echo echo-planar imaging (EPI) sequence with repetition time (TR)/echo time (TE)=2000/30ms,
flip angle (FA)=85°, matrix=64´64, field of view (FOV)=220´220mm, voxel
size=3.44´3.44´(4.0 or 5.0) mm3, 24 or 33 slices, in an ascending interleaved order. High-
resolution Gadolinium contrast-enhanced T1/T2 images were acquired in a separate session within
approximately one week of the fMRI session, using the 3D fast spoiled gradient-recalled (SPGR)
sequence (TR/TE=8.8/4.8ms, FA=20°, matrix=256´256, FOV=256´256mm, voxel
size=1´1´1mm3, 176 slices) or magnetization-prepared rapid gradient-echo (MPRAGE) sequence
(TR/TE=1790/3.62ms, FA=15°, matrix=256´256, FOV=256´256mm, voxel size=1´1´1mm3,
176 slices).
BMJ Publishing Group Limited (BMJ) disclaims all liability and responsibility arising from any relianceSupplemental material placed on this supplemental material which has been supplied by the author(s) J Neurol Neurosurg Psychiatry
doi: 10.1136/jnnp-2020-325738–2.:10 2021;J Neurol Neurosurg Psychiatry, et al. Yao S
Behavioral paradigms
The fMRI scanning protocol varied slightly between patients due to individual clinical
requirements, patient tolerance, and constraints on scanner availability. The order of fMRI runs
was fixed as follows: tb-fMRI, rs-fMRI, and mw-fMRI.
Blocked design AntGen tb-fMRI: Patients were instructed to silently think of antonyms to
words presented for 2 sec with 2 sec interstimulus-intervals in blocks of five words. Eight 20 sec
task blocks were interleaved with eight 20 sec control blocks in which patients were instructed to
look at a crosshair in the center of the screen, for a total duration of 5 min. Prior to scanning, all
patients practiced the task with words not used during scanning. All the patients except one were
able to perform the antonym generation task. For this patient, the task was modified to a simple
word reading task.
Mw-fMRI: The movie stimulus consisted of a 7-min excerpt from the family film “The
Parent Trap” (directed by Nancy Meyers, produced by The Meyers/Shyer Company and Walt
Disney Pictures, 1998), as in our previous study [3]. The clip comprised 7 segments of spoken
dialogue (segment duration range: 5-119 sec, total length: 5 min 54 sec), interleaved with 6
segments of indoor or outdoor scenes with no dialogue (segment duration range: 4-25 sec, total
length: 1 min 6 sec). Among the 34 patients, 18 watched the entire 7-min clip, 15 watched the first
5 min, and 1 watched the first 4 min. Patients were instructed to watch the movie, and that they
would be asked a few comprehension questions after the scan. All patients confirmed ability to
hear and comprehend the spoken instructions, and movie spoken narrative.
Rs-fMRI: Patients were instructed to keep their eyes closed and relax without thinking
about anything specific. The scan duration varied between 7 min 10 sec (7 patients), 7 min 4 sec
(1 patient), 5 min (11 patients), and 4 min (3 patients).
BMJ Publishing Group Limited (BMJ) disclaims all liability and responsibility arising from any relianceSupplemental material placed on this supplemental material which has been supplied by the author(s) J Neurol Neurosurg Psychiatry
doi: 10.1136/jnnp-2020-325738–2.:10 2021;J Neurol Neurosurg Psychiatry, et al. Yao S
The tasks and movie clip were presented using E-Prime software (Psychology Software
Tools, Sharpsburg, PA, USA), and MRI compatible goggles and headphones (Resonance
Technology, Los Angeles, CA, USA) on the GE scanners, or Nordic NeuroLab audiovisual
presentation software and hardware (NordicNeuroLab, Bergen, Norway) on the Siemens scanners.
The electrostatic headphones are noise-attenuating (30 dB, without earplugs), and the audio system
has a frequency response of 0.008-3.5 kHz designed for hearing speech during fMRI. Sound level
was set individually to accommodate individual differences in hearing, and the patients were
interviewed after the scan to confirm that they were able to properly hear the instructions for each
paradigm, and the movie-clips’ soundtracks during the scan. All functional runs started with 10
sec dummy scans to allow for stabilization of the BOLD signal.
fMRI pre-processing
The data analysis workflow is shown in Supplementary Figure S1. fMRI data were pre-processed
using the FMRI Expert Analysis Tool (FEAT) of FMRIB Software Library (FSL v6.0) [4]. The
pre-processing steps included: (1) realigning functional images to the first image of the run using
rigid body motion correction with FMRIB's Linear Image Registration Tool (MCFLIRT) [5], (2)
head motion estimation and outlier detection, (3) spatial smoothing using a full width half
maximum (FWHM) Gaussian kernel of 5 mm, and (4) high-pass filtering (cutoff=100 sec) to
remove linear drifts and low-frequency noise.
Head motion was quantified using the artifact detection tool (ART,
https://www.nitrc.org/projects/artifact_detect) [6]. In each run, time points with relative framewise
displacement (FD) >0.9 mm or global BOLD signal change >5 SD were flagged as outliers. Scans
BMJ Publishing Group Limited (BMJ) disclaims all liability and responsibility arising from any relianceSupplemental material placed on this supplemental material which has been supplied by the author(s) J Neurol Neurosurg Psychiatry
doi: 10.1136/jnnp-2020-325738–2.:10 2021;J Neurol Neurosurg Psychiatry, et al. Yao S
with outlier time points amounting to >15% of the total time points were excluded from further
analyses.
Language regions-of-interests (ROIs)
To test for local differences between the paradigms in language mapping sensitivity and specificity,
and language lateralization as measured by a laterality index (LI), three functional language ROIs
were defined in each hemisphere. First, a functionally defined, inclusive language template was
derived by combining the maps associated with the terms “language”, “phonological”, and
“semantic”, in the Neurosynth platform [7]. The functional maps for these terms were based on
meta-analyses of 2509 studies, and adding other terms (e.g., “linguistic” and “sentence
comprehension”) did not expand the combined language template. The template in each
hemisphere was then mirrored to the other hemisphere, to obtain a symmetric bilateral template.
Second, the automated anatomical labeling atlas 3 (AAL 3) [8] was used to segment the template
into three ROIs, frontal, temporal, and inferior parietal lobule (IPL), in each hemisphere (see
Figure S1, panel 3).
Patient-specific language ROIs
Patient-specific language ROIs were generated by transforming the ROIs defined in the Montreal
Neurological Institute (MNI) space to the patient’s native space, using reverse application of the
normalization matrix generated from spatial normalization of the patient’s T1 structural images to
the MNI space [3,9–11]. The cost-function masking method (mutual information algorithm) with
a 12-degrees-of-freedom transformation in the FMRIB’s Linear Image Registration Tool (FLIRT)
was employed and has shown evidence that it could provide higher accurate results in patients with
BMJ Publishing Group Limited (BMJ) disclaims all liability and responsibility arising from any relianceSupplemental material placed on this supplemental material which has been supplied by the author(s) J Neurol Neurosurg Psychiatry
doi: 10.1136/jnnp-2020-325738–2.:10 2021;J Neurol Neurosurg Psychiatry, et al. Yao S
brain lesions both in terms of deformation field displacement and voxel-wise intensity differences
[12,13]. A lesion mask, including the tumor region and surrounding edema, and any prior surgical
cavities, was generated in each patient using semi-automatic segmentation on the contrast-
enhanced T1 images in 3D Slicer [14] and visual inspection by two neurosurgeons. The lesion
masks were included in the normalization procedure to reduce lesion distortions and were also
used to mask out the lesions from the patient-specific language ROIs [14,15] (Figure 1B, Figure
S1 panel 3).
fMRI data analysis
General linear model (GLM) analysis of tb-fMRI
The tb-fMRI data were analyzed at the single subject level using GLM analysis in FSL, with
regressors representing the task and control conditions, and the 6 parameters derived from rigid-
body head motion correction to account for motion artifacts. The resulting t-maps were
individually thresholded at 10% of the activation distribution within the bilateral language
template.
Independent component analysis (ICA) of mw-fMRI and rs-fMRI
Mw-fMRI and rs-fMRI data were analyzed at the single-subject level using the Group ICA Of
fMRI Toolbox (GIFT, https://trendscenter.org/software/gift). The number of independent
components was estimated for each dataset using the minimum description length (MDL) criterion
[11,16]. The average number of components was estimated as 41 in the mw-fMRI and 38 in the
rs-fMRI. The Infomax ICA algorithm [17] was applied to decompose the pre-processed fMRI into
spatially-independent components with ICASSO to derive reliable components [18]. Each
BMJ Publishing Group Limited (BMJ) disclaims all liability and responsibility arising from any relianceSupplemental material placed on this supplemental material which has been supplied by the author(s) J Neurol Neurosurg Psychiatry
doi: 10.1136/jnnp-2020-325738–2.:10 2021;J Neurol Neurosurg Psychiatry, et al. Yao S
component map was converted to a z-map and thresholded at 10% of the individual activation
distribution within the bilateral language template.
For each dataset, the ICA output included a series of components, each associated with a
spatial map and a time-course. To identify the language components from the ICA output, both
temporal and spatial correlation criteria were applied. The temporal criterion consisted of
correlation with two language response models (LRMs), one consisting of the mean time-course
of language response in the frontotemporal cortex (LRM-FT), and the other consisting of a distinct
mean time course of language response in the parietal cortex (LRM-P), derived from an
independent group of 22 healthy subjects who underwent mw-fMRI language mapping with the
same movie stimulus [3]. A primary language component (LC1) was searched for by correlating
the time-course of each component with LRM-FT, and the map of each component with the
patient-specific language template (separately in each hemisphere). A secondary language
component (LC2) was searched for by correlating the time-course of each component with LRM-
P, and the map of each component with the patient-specific IPL ROI (Figure S1, panel 3). The
LC1 and LC2 were selected based on: (1) temporal and spatial correlation coefficients ranked
among the top 5 of all components (the spatial correlation coefficients were examined with both
the left and right hemisphere ROIs); and (2) a stability index (Iq, range: 0-1, generated by the
ICASSO approach) >0.8 [18]. For rs-fMRI, the language component(s) was identified based
strictly on spatial correlation with the patient-specific language template. The selected language
components were visually inspected to confirm that activations were in the putative language areas
in each patient.
BMJ Publishing Group Limited (BMJ) disclaims all liability and responsibility arising from any relianceSupplemental material placed on this supplemental material which has been supplied by the author(s) J Neurol Neurosurg Psychiatry
doi: 10.1136/jnnp-2020-325738–2.:10 2021;J Neurol Neurosurg Psychiatry, et al. Yao S
In four patients in whom two mw-fMRI LC1s were identified and one in whom three LC2s
were identified, the components were combined for further analyses. In two patients, only the mw-
fMRI LC1 could be identified.
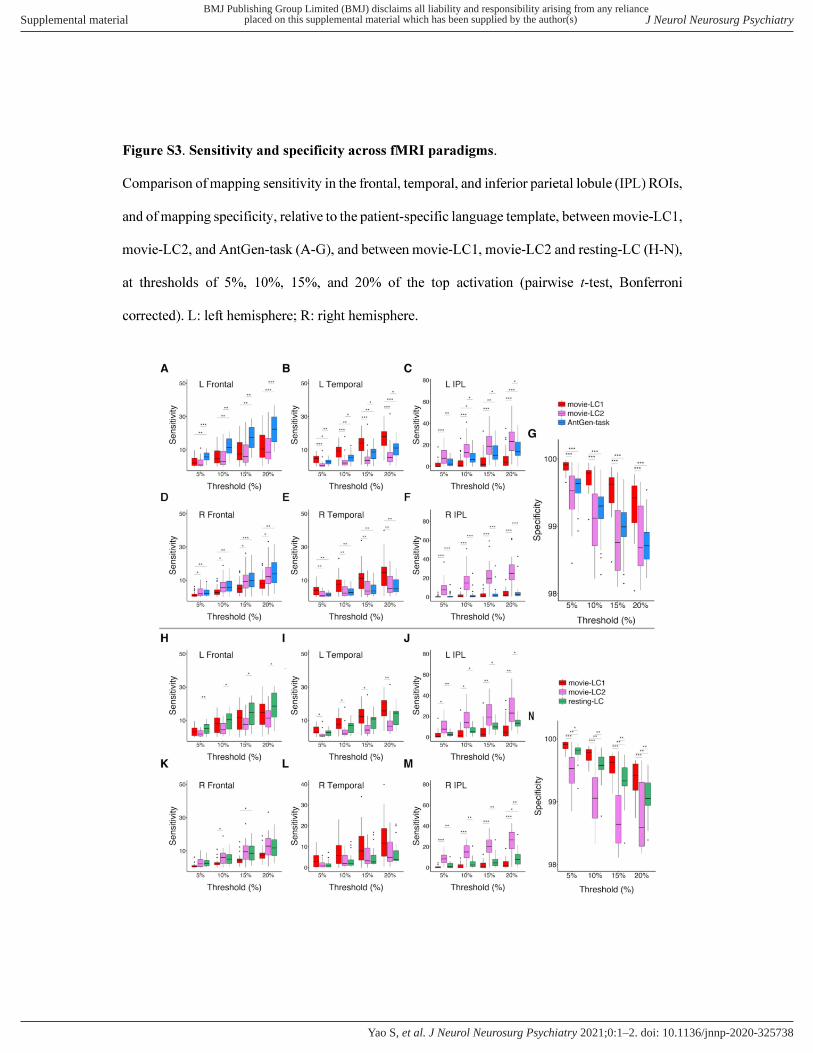
Sensitivity and specificity of language localization
The language mapping sensitivity of each fMRI paradigm in each ROI was calculated as the
proportion of supra-threshold voxels within the ROI. The language mapping specificity was
calculated for the entire brain as the proportion of non-activated voxels outside of the language
ROIs. The sensitivity and specificity were calculated at four thresholds, 5%, 10%, 15%, and 20%
of the top activation (Figure S3) to test for possible influences of the threshold on the results.
Because differences between the paradigms in these metrics were found to be stable across
thresholds, and a 10% threshold is commonly used [19], 10% was used for computing the inter-
subject activation overlap maps and the report of sensitivity and specificity measures shown in
Figure 1C and discussed in the paper.
Language lateralization index (LI)
The language LIs were calculated for each left/right pair of language ROIs, as well as for the entire
language template, using the equation:
LI =sumAmplitude! − sumAmplitude"
sumAmplitude! + sumAmplitude"
where sumAmplitudeL and sumAmplitudeR represent the sum of t or z scores within the left and
right language ROIs, respectively. LI³0.2 was regarded as left-hemisphere language dominance,
LI£-0.2 as right-hemisphere language dominance, and -0.2<LI<0.2 as bilateral language function.
For mw-fMRI, the LI in the frontal and temporal ROIs was computed based on LC1, and in the
BMJ Publishing Group Limited (BMJ) disclaims all liability and responsibility arising from any relianceSupplemental material placed on this supplemental material which has been supplied by the author(s) J Neurol Neurosurg Psychiatry
doi: 10.1136/jnnp-2020-325738–2.:10 2021;J Neurol Neurosurg Psychiatry, et al. Yao S
IPL ROI based on LC2. LI agreement between paradigms (Figure S4) was computed at a 10%
threshold, as done for the sensitivity and specificity calculation.
Statistical analysis
The patient demographic and clinical characteristics were described using mean±SD, median
(interquartile range, IQR), or frequency according to the variable type (Table S1). Group
differences in head motion were assessed using a paired t-test. Multiple comparisons correction
with Bonferroni was employed for comparisons between language maps of the fMRI paradigm.
The McNemar–Bowker test was performed to assess the agreement between LI results from fMRI
maps and the clinical report. Significance was set at p<0.05 (two-tailed). Statistical analyses and
results visualization were performed using R software (version 3.6.3, R Foundation for Statistical
Computing) and Python (version 3.7.6, https://www.python.org/).
BMJ Publishing Group Limited (BMJ) disclaims all liability and responsibility arising from any relianceSupplemental material placed on this supplemental material which has been supplied by the author(s) J Neurol Neurosurg Psychiatry
doi: 10.1136/jnnp-2020-325738–2.:10 2021;J Neurol Neurosurg Psychiatry, et al. Yao S
References
1 Oldfield RC. The assessment and analysis of handedness: The Edinburgh inventory.
Neuropsychologia 1971;9:97–113. doi:10.1016/0028-3932(71)90067-4
2 Unadkat P, Fumagalli L, Rigolo L, et al. Functional MRI task comparison for language
mapping in neurosurgical Patients. Journal of Neuroimaging 2019;0. doi:10.1111/jon.12597
3 Tie Y, Rigolo L, Ozdemir Ovalioglu A, et al. A New Paradigm for Individual Subject
Language Mapping: Movie-Watching fMRI. Journal of Neuroimaging 2015;25:710–20.
doi:10.1111/jon.12251
4 Jenkinson M, Beckmann CF, Behrens TEJ, et al. FSL. NeuroImage 2012;62:782–90.
doi:10.1016/j.neuroimage.2011.09.015
5 Jenkinson M, Bannister P, Brady M, et al. Improved optimization for the robust and accurate
linear registration and motion correction of brain images. Neuroimage 2002;17:825–41.
6 Whitfield-Gabrieli S, Nieto-Castanon A. Conn: a functional connectivity toolbox for
correlated and anticorrelated brain networks. Brain Connect 2012;2:125–41.
doi:10.1089/brain.2012.0073
7 Yarkoni T, Poldrack RA, Nichols TE, et al. Large-scale automated synthesis of human
functional neuroimaging data. Nat Methods 2011;8:665–70. doi:10.1038/nmeth.1635
8 Rolls ET, Huang C-C, Lin C-P, et al. Automated anatomical labelling atlas 3. NeuroImage
2020;206:116189. doi:10.1016/j.neuroimage.2019.116189
9 Tie Y, Rigolo L, Norton IH, et al. Defining language networks from resting-state fMRI for
surgical planning—a feasibility study. Hum Brain Mapp 2014;35:1018–30.
doi:10.1002/hbm.22231
BMJ Publishing Group Limited (BMJ) disclaims all liability and responsibility arising from any relianceSupplemental material placed on this supplemental material which has been supplied by the author(s) J Neurol Neurosurg Psychiatry
doi: 10.1136/jnnp-2020-325738–2.:10 2021;J Neurol Neurosurg Psychiatry, et al. Yao S
10 Tie Y, Suarez RO, Whalen S, et al. Comparison of blocked and event-related fMRI designs
for pre-surgical language mapping. NeuroImage 2009;47:T107–15.
doi:10.1016/j.neuroimage.2008.11.020
11 Tie Y, Whalen S, Suarez RO, et al. Group independent component analysis of language
fMRI from word generation tasks. NeuroImage 2008;42:1214–25.
doi:10.1016/j.neuroimage.2008.05.028
12 Brett M, Leff AP, Rorden C, et al. Spatial normalization of brain images with focal lesions
using Cost Function masking. NeuroImage 2001;14:486–500. doi:10.1006/nimg.2001.0845
13 Andersen SM, Rapcsak SZ, Beeson PM. Cost function masking during normalization of
brains with focal lesions: still a necessity? Neuroimage 2010;53:78–84.
doi:10.1016/j.neuroimage.2010.06.003
14 Yao S, Liebenthal E, Juvekar P, et al. Sex Effect on Presurgical Language Mapping in
Patients With a Brain Tumor. Front Neurosci 2020;14:4. doi:10.3389/fnins.2020.00004
15 Dietz A, Vannest J, Maloney T, et al. The Calculation of Language Lateralization Indices in
Post-stroke Aphasia: A Comparison of a Standard and a Lesion-Adjusted Formula. Front
Hum Neurosci 2016;10. doi:10.3389/fnhum.2016.00493
16 Li Y-O, Adali T, Calhoun VD. Estimating the number of independent components for
functional magnetic resonance imaging data. Hum Brain Mapp 2007;28:1251–66.
doi:10.1002/hbm.20359
17 Bell AJ, Sejnowski TJ. An information-maximization approach to blind separation and blind
deconvolution. Neural Comput 1995;7:1129–59. doi:10.1162/neco.1995.7.6.1129
BMJ Publishing Group Limited (BMJ) disclaims all liability and responsibility arising from any relianceSupplemental material placed on this supplemental material which has been supplied by the author(s) J Neurol Neurosurg Psychiatry
doi: 10.1136/jnnp-2020-325738–2.:10 2021;J Neurol Neurosurg Psychiatry, et al. Yao S
18 Himberg J, Hyvärinen A, Esposito F. Validating the independent components of
neuroimaging time series via clustering and visualization. Neuroimage 2004;22:1214–22.
doi:10.1016/j.neuroimage.2004.03.027
19 Rolinski R, You X, Gonzalez‐Castillo J, et al. Language lateralization from task-based and
resting state functional MRI in patients with epilepsy. Human Brain Mapping 2019.
doi:10.1002/hbm.25003
BMJ Publishing Group Limited (BMJ) disclaims all liability and responsibility arising from any relianceSupplemental material placed on this supplemental material which has been supplied by the author(s) J Neurol Neurosurg Psychiatry
doi: 10.1136/jnnp-2020-325738–2.:10 2021;J Neurol Neurosurg Psychiatry, et al. Yao S
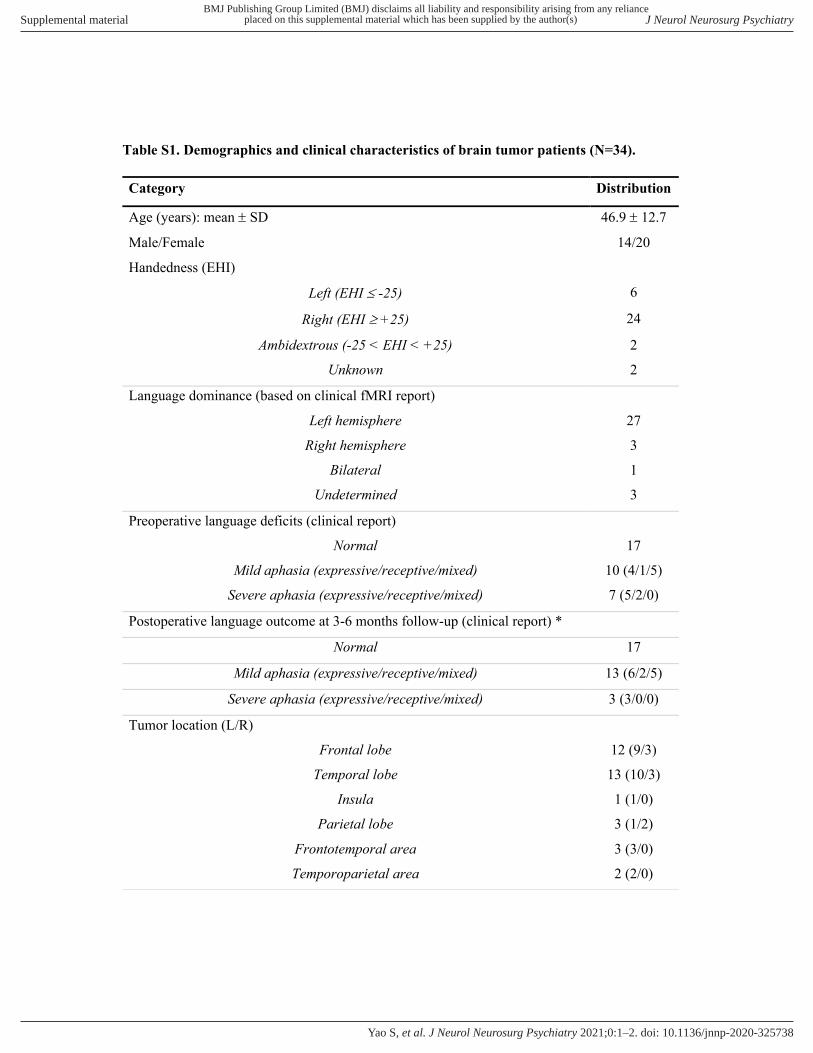
Table S1. Demographics and clinical characteristics of brain tumor patients (N=34).
Category Distribution
Age (years): mean ± SD 46.9 ± 12.7
Male/Female 14/20
Handedness (EHI)
Left (EHI £ -25) 6
Right (EHI ³ +25) 24
Ambidextrous (-25 < EHI < +25) 2
Unknown 2
Language dominance (based on clinical fMRI report)
Left hemisphere 27
Right hemisphere 3
Bilateral 1
Undetermined 3
Preoperative language deficits (clinical report)
Normal 17
Mild aphasia (expressive/receptive/mixed) 10 (4/1/5)
Severe aphasia (expressive/receptive/mixed) 7 (5/2/0)
Postoperative language outcome at 3-6 months follow-up (clinical report) *
Normal 17
Mild aphasia (expressive/receptive/mixed) 13 (6/2/5)
Severe aphasia (expressive/receptive/mixed) 3 (3/0/0)
Tumor location (L/R)
Frontal lobe 12 (9/3)
Temporal lobe 13 (10/3)
Insula 1 (1/0)
Parietal lobe 3 (1/2)
Frontotemporal area 3 (3/0)
Temporoparietal area 2 (2/0)
BMJ Publishing Group Limited (BMJ) disclaims all liability and responsibility arising from any relianceSupplemental material placed on this supplemental material which has been supplied by the author(s) J Neurol Neurosurg Psychiatry
doi: 10.1136/jnnp-2020-325738–2.:10 2021;J Neurol Neurosurg Psychiatry, et al. Yao S
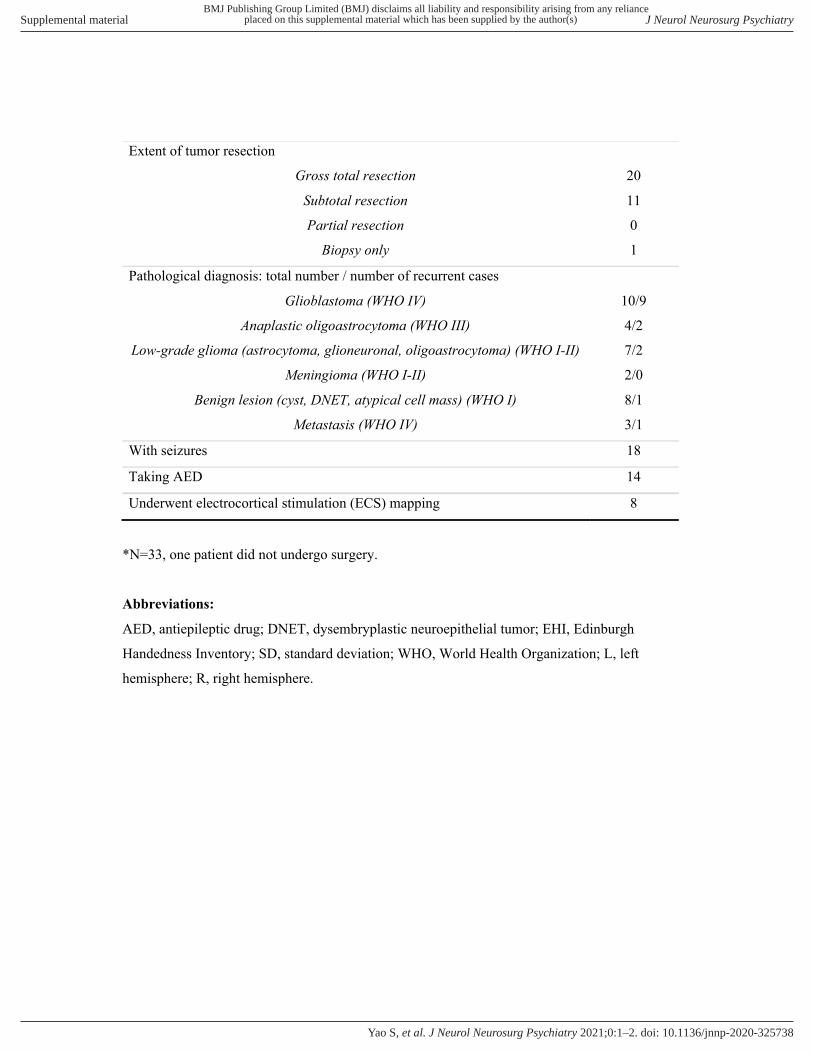
*N=33, one patient did not undergo surgery.
Abbreviations:
AED, antiepileptic drug; DNET, dysembryplastic neuroepithelial tumor; EHI, Edinburgh
Handedness Inventory; SD, standard deviation; WHO, World Health Organization; L, left
hemisphere; R, right hemisphere.
Extent of tumor resection
Gross total resection 20
Subtotal resection 11
Partial resection 0
Biopsy only 1
Pathological diagnosis: total number / number of recurrent cases
Glioblastoma (WHO IV) 10/9
Anaplastic oligoastrocytoma (WHO III) 4/2
Low-grade glioma (astrocytoma, glioneuronal, oligoastrocytoma) (WHO I-II) 7/2
Meningioma (WHO I-II) 2/0
Benign lesion (cyst, DNET, atypical cell mass) (WHO I) 8/1
Metastasis (WHO IV) 3/1
With seizures 18
Taking AED 14
Underwent electrocortical stimulation (ECS) mapping 8
BMJ Publishing Group Limited (BMJ) disclaims all liability and responsibility arising from any relianceSupplemental material placed on this supplemental material which has been supplied by the author(s) J Neurol Neurosurg Psychiatry
doi: 10.1136/jnnp-2020-325738–2.:10 2021;J Neurol Neurosurg Psychiatry, et al. Yao S
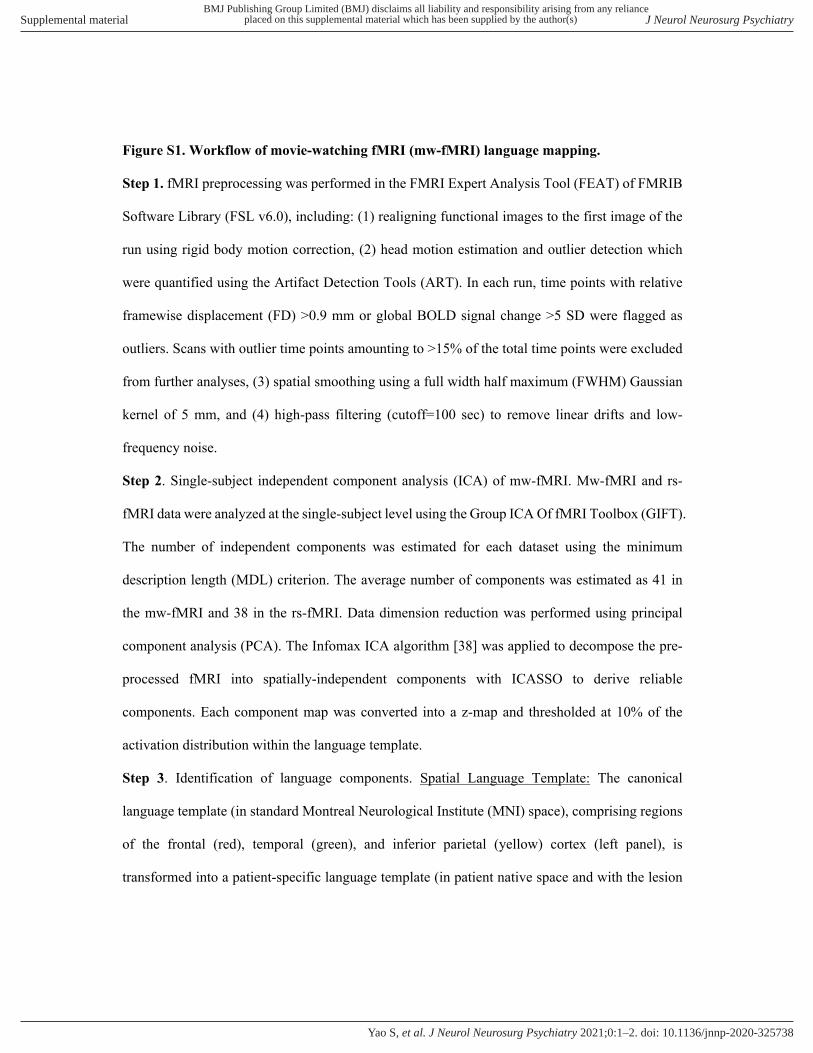
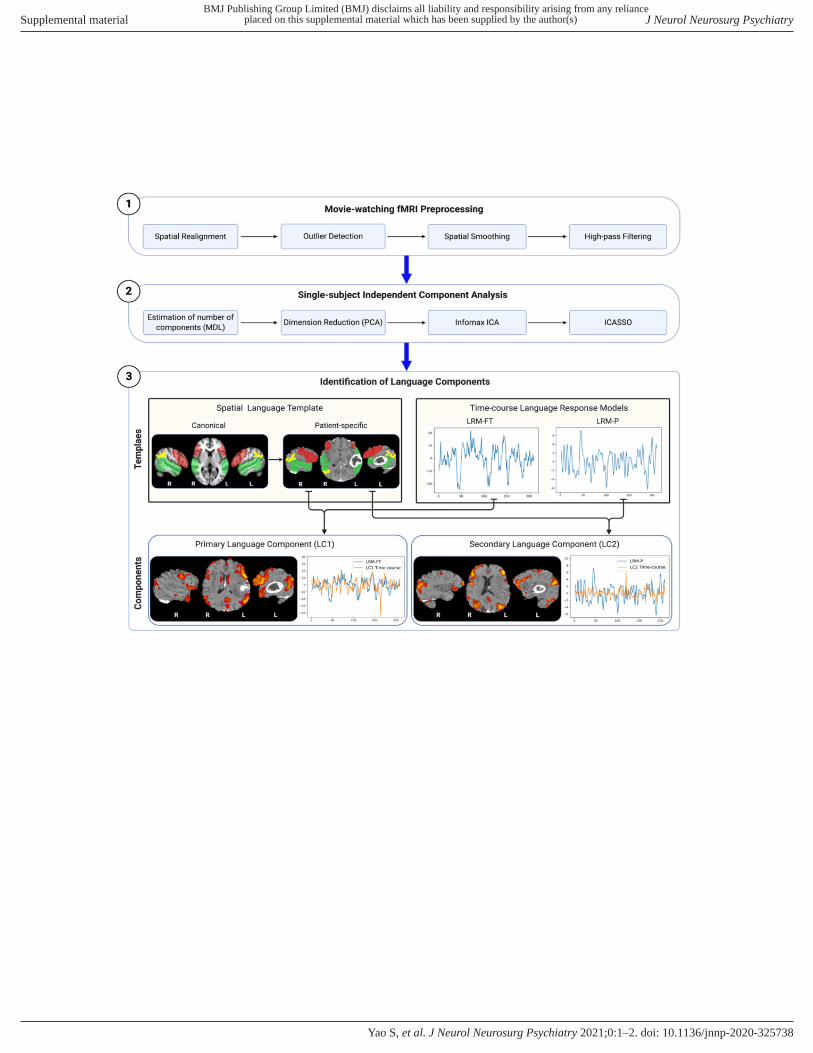
Figure S1. Workflow of movie-watching fMRI (mw-fMRI) language mapping.
Step 1. fMRI preprocessing was performed in the FMRI Expert Analysis Tool (FEAT) of FMRIB
Software Library (FSL v6.0), including: (1) realigning functional images to the first image of the
run using rigid body motion correction, (2) head motion estimation and outlier detection which
were quantified using the Artifact Detection Tools (ART). In each run, time points with relative
framewise displacement (FD) >0.9 mm or global BOLD signal change >5 SD were flagged as
outliers. Scans with outlier time points amounting to >15% of the total time points were excluded
from further analyses, (3) spatial smoothing using a full width half maximum (FWHM) Gaussian
kernel of 5 mm, and (4) high-pass filtering (cutoff=100 sec) to remove linear drifts and low-
frequency noise.
Step 2. Single-subject independent component analysis (ICA) of mw-fMRI. Mw-fMRI and rs-
fMRI data were analyzed at the single-subject level using the Group ICA Of fMRI Toolbox (GIFT).
The number of independent components was estimated for each dataset using the minimum
description length (MDL) criterion. The average number of components was estimated as 41 in
the mw-fMRI and 38 in the rs-fMRI. Data dimension reduction was performed using principal
component analysis (PCA). The Infomax ICA algorithm [38] was applied to decompose the pre-
processed fMRI into spatially-independent components with ICASSO to derive reliable
components. Each component map was converted into a z-map and thresholded at 10% of the
activation distribution within the language template.
Step 3. Identification of language components. Spatial Language Template: The canonical
language template (in standard Montreal Neurological Institute (MNI) space), comprising regions
of the frontal (red), temporal (green), and inferior parietal (yellow) cortex (left panel), is
transformed into a patient-specific language template (in patient native space and with the lesion
BMJ Publishing Group Limited (BMJ) disclaims all liability and responsibility arising from any relianceSupplemental material placed on this supplemental material which has been supplied by the author(s) J Neurol Neurosurg Psychiatry
doi: 10.1136/jnnp-2020-325738–2.:10 2021;J Neurol Neurosurg Psychiatry, et al. Yao S
region masked out), as shown for a patient with a left temporal glioblastoma (right panel). Time-
course Language Response Models (LRMs): LRM-FT corresponding to the mean time-course in
the frontotemporal ROIs (left panel), and LRM-P corresponding to the mean time-course in the
parietal ROI, derived from mw-fMRI in an independent group of neurologically healthy subjects
watching the same movie clip [3]. Primary and secondary language components: The primary
language component (LC1, left panel) and secondary language component (LC2, right panel), each
consisting of a spatial map and a time-course, are selected based on both spatial and temporal
criteria consisting of correlation with the patient-specific language template and the time-course
LRMs.
BMJ Publishing Group Limited (BMJ) disclaims all liability and responsibility arising from any relianceSupplemental material placed on this supplemental material which has been supplied by the author(s) J Neurol Neurosurg Psychiatry
doi: 10.1136/jnnp-2020-325738–2.:10 2021;J Neurol Neurosurg Psychiatry, et al. Yao S
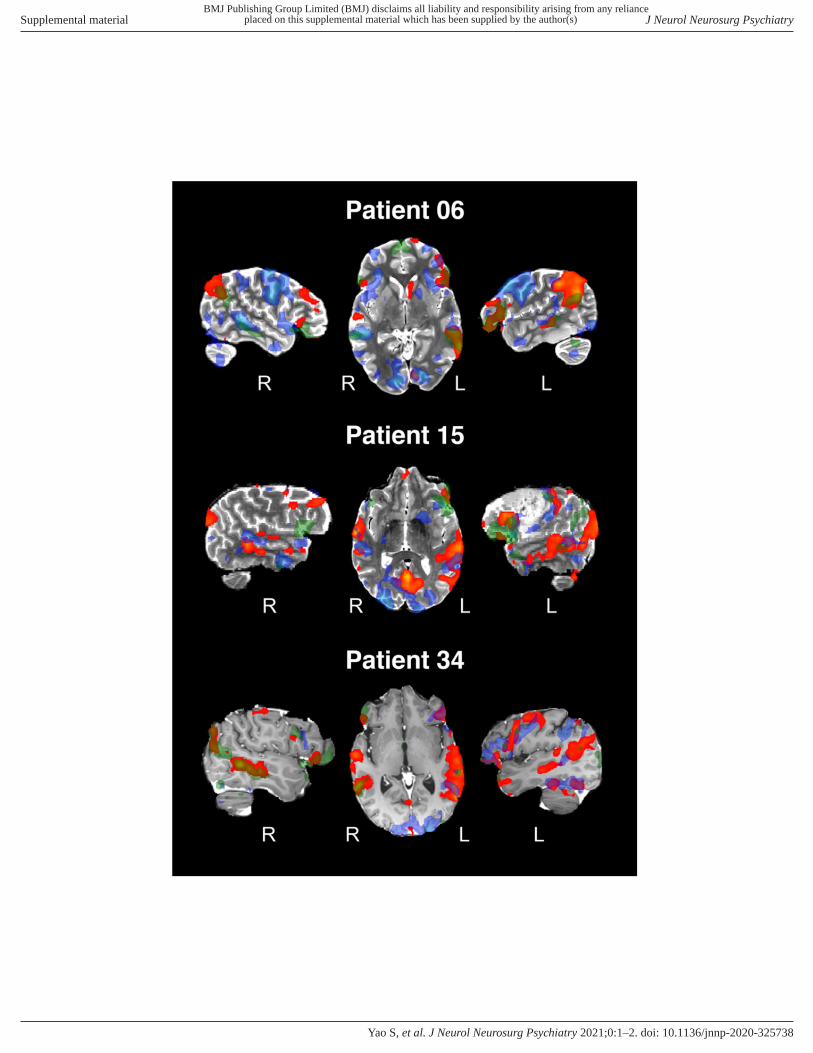
Figure S2. Examples of individual language maps in each paradigm.
Three examples of individual language maps resulting from tb-fMRI (blue), mw-fMRI (red), and
rs-fMRI (green), overlaid on the patient’s anatomical image. The cases were selected based on
having data, and high mapping sensitivity and specificity, in all three paradigms.
Case 1 (patient 06): 53-year-old, left-handed (EHI=-40) female presenting with a left temporal
anaplastic oligoastrocytoma (WHO grade III) and severe mixed language deficits. Language
laterality was indeterminate according to the preoperative clinical report (which is based on tb-
fMRI), while mw-fMRI indicated left-hemispheric dominance. She received a gross total tumor
resection and language improved to mild expressive dysfunction after the surgery (as tested at 3-6
months follow-up).
Case 2 (patient 15): 60-year-old, right-handed (EHI=90) female presenting with a left frontal
atypical meningioma (WHO grade II) and mild expressive language dysfunction. Language was
left-hemisphere dominant according to both the clinical report and mw-fMRI. She received a gross
total tumor resection and language function returned to normal after the surgery.
Case 3 (patient 34): 45-year-old, left-handed (EHI=-60) female presenting with a right frontal
anaplastic oligoastrocytoma (WHO grade III) and without any language complaints. Language
was left-hemisphere dominant according to both the clinical report and mw-fMRI. She received a
gross total tumor resection and language function remained normal after the surgery.
BMJ Publishing Group Limited (BMJ) disclaims all liability and responsibility arising from any relianceSupplemental material placed on this supplemental material which has been supplied by the author(s) J Neurol Neurosurg Psychiatry
doi: 10.1136/jnnp-2020-325738–2.:10 2021;J Neurol Neurosurg Psychiatry, et al. Yao S
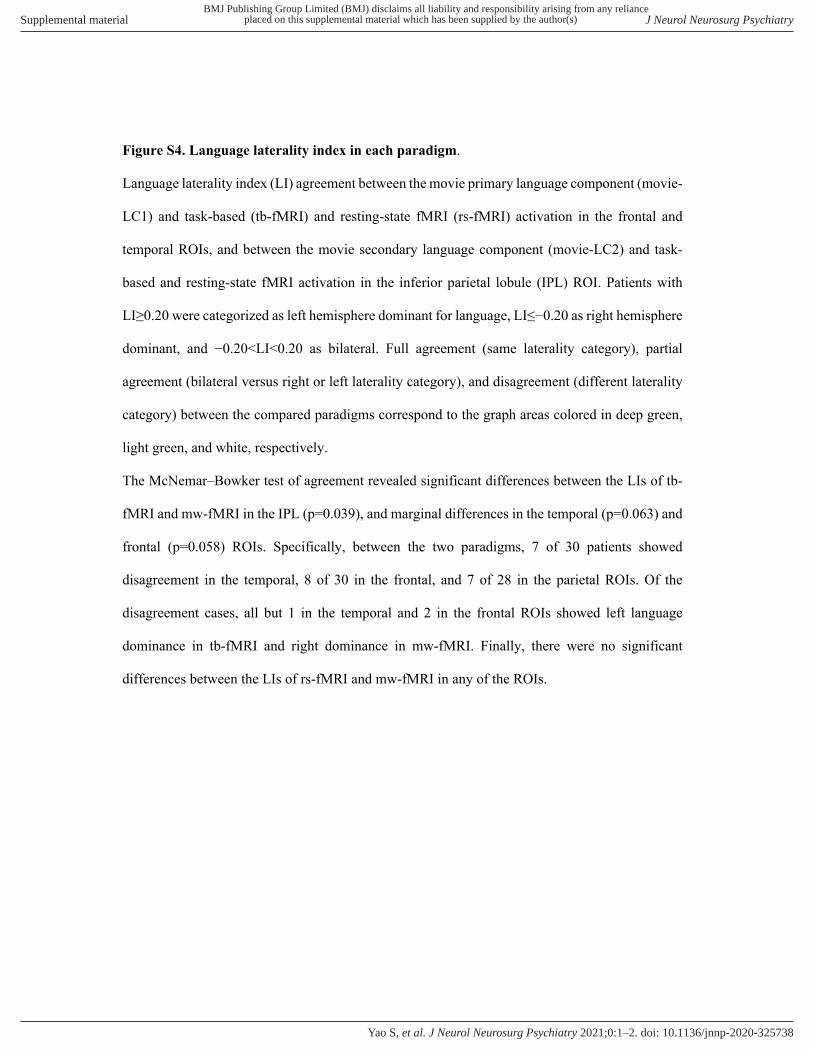
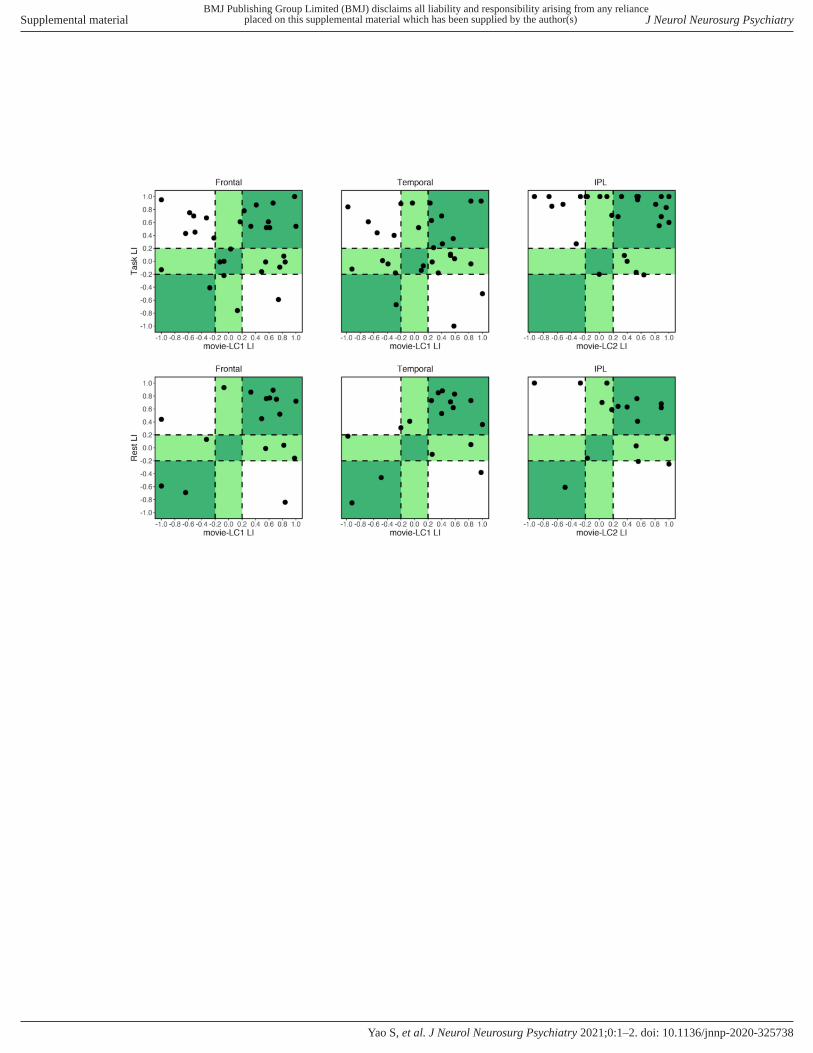
Figure S4. Language laterality index in each paradigm.
Language laterality index (LI) agreement between the movie primary language component (movie-
LC1) and task-based (tb-fMRI) and resting-state fMRI (rs-fMRI) activation in the frontal and
temporal ROIs, and between the movie secondary language component (movie-LC2) and task-
based and resting-state fMRI activation in the inferior parietal lobule (IPL) ROI. Patients with
LI≥0.20 were categorized as left hemisphere dominant for language, LI≤−0.20 as right hemisphere
dominant, and −0.20<LI<0.20 as bilateral. Full agreement (same laterality category), partial
agreement (bilateral versus right or left laterality category), and disagreement (different laterality
category) between the compared paradigms correspond to the graph areas colored in deep green,
light green, and white, respectively.
The McNemar–Bowker test of agreement revealed significant differences between the LIs of tb-
fMRI and mw-fMRI in the IPL (p=0.039), and marginal differences in the temporal (p=0.063) and
frontal (p=0.058) ROIs. Specifically, between the two paradigms, 7 of 30 patients showed
disagreement in the temporal, 8 of 30 in the frontal, and 7 of 28 in the parietal ROIs. Of the
disagreement cases, all but 1 in the temporal and 2 in the frontal ROIs showed left language
dominance in tb-fMRI and right dominance in mw-fMRI. Finally, there were no significant
differences between the LIs of rs-fMRI and mw-fMRI in any of the ROIs.
BMJ Publishing Group Limited (BMJ) disclaims all liability and responsibility arising from any relianceSupplemental material placed on this supplemental material which has been supplied by the author(s) J Neurol Neurosurg Psychiatry
doi: 10.1136/jnnp-2020-325738–2.:10 2021;J Neurol Neurosurg Psychiatry, et al. Yao S